

Abstract
Fast photochemical oxidation of proteins (FPOP) is a chemical footprinting method whereby exposed amino-acid residues are covalently labeled by oxidation with hydroxyl radicals produced by the photolysis of hydrogen peroxide. Modified residues can be detected by standard trypsin proteolysis followed by LC/MS/MS, providing information about solvent accessibility at the peptide and even the amino-acid level. Like other chemical footprinting techniques, FPOP must ensure only the native conformation is labeled. Although oxidation via hydroxyl radical induces unfolding in proteins on a timescale of milliseconds or longer, FPOP is designed to limit •OH exposure to 1 μs or less by employing a pulsed laser for initiation to produce the radicals and a radical-scavenger to limit their lifetimes. We applied FPOP to three oxidation-sensitive proteins and found that the distribution of modification (oxidation) states is Poisson when a scavenger is present, consistent with a single conformation protein modification model. This model breaks down when a scavenger is not used and/or hydrogen peroxide is not removed following photolysis. The outcome verifies that FPOP occurs on a time scale faster than conformational changes in these proteins.
INTRODUCTION
Protein footprinting is an assay that monitors protein conformation by selectively labeling or cleaving residues. This selectivity is, in part, a function of the target protein's solvent accessibility; thus, an implicit picture of protein structure is afforded by footprinting. Although the ways of modifying residues are diverse, and many have been in practice for over forty years,1 the advent of biomolecular mass spectrometry, employing electrospray and matrix-assisted laser desorption ionization and interfaced to liquid chromatography, makes possible highly specific, sensitive, and rapid analysis of modified peptides and proteins.2, 3 We wish to establish a marriage of mass spectrometry and chemical footprinting to afford a tool for the elucidation of protein structure and dynamics, and for the identification of partner binding sites, stoichiometry, and affinity.4
Protein oxidation by hydroxyl radicals is one class of footprinting methods; the various subclasses are differentiated by the means used to generate the •OH. Hydroxyl radicals probe solvent accessibility because they have comparable size to solvent water molecules and high reactivity with a significant fraction of amino acid side chains. The advantages of hydroxyl radical footprinting are twofold. First, the primary sequence of modified residues is preserved by virtue of the stable covalent modification that occurs even though a protein may be subjected to several hours and even days of handling and proteolysis following the chemical footprinting step. Second, the hydroxyl radical is a reactive reagent, modifying many amino acid residues and affording a higher coverage footprint than those covalent approaches that target specific residues (e.g., the acetylation of primary amines). Xu and Chance5–7 showed that in X-ray and γ-ray water radiolysis, up to 14 of the 20 sidechains and cys-cys disulfide bonds can be usefully modified in footprinting experiments.
Several hydroxyl radical footprinting approaches are currently in use, as detailed in a recent review.8 Many of the early DNA:protein and protein:ligand binding site footprinting studies used hydroxyl radicals generated from catalytic Fenton chemistry9 consuming hydrogen peroxide.10, 11 The synchrotron X-ray and 137Cs γ-ray methods generate hydroxyl radicals as the major reactive products from water radiolysis by high-energy photons. These methods stem from the work of Chance12–14 and coworkers, who footprint DNA/protein interactions, RNA folding, and large proteins. Recently Hambly and Gross, and independently Aye et al.,15–17 reported similar methods of fast photochemical oxidation of proteins (FPOP) that generate ·OH by photolysis of mM hydrogen peroxide with a pulsed laser (either 248-nm KrF eximer laser or 266-nm frequency quadrupled Nb YAG) and react them with protein in a flow system. The laser provides a spatially small, high flux of light, maximizing the exposure of a small volume of protein solution to radicals and ensuring all but a small exclusion fraction of the protein in the flow is irradiated only once (Figure 1). In the design by Hambly and Gross, a constituent radical scavenger limits the timescale of oxidation. During a short timescale of oxidation (~ μs), footprinting occurs at high yield.
Figure 1.
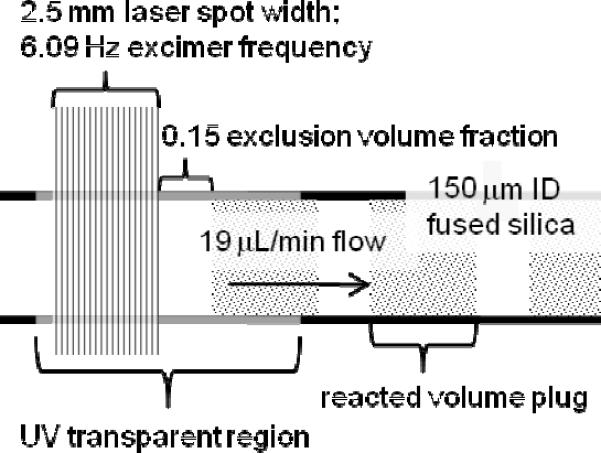
Schematic of FPOP whereby a protein in a solution flowing in fused silica reacts with OH radicals. Shown is the reaction region with typical flow rate, laser pulse frequency, and laser spot size.
Here we report the first experimental evaluation of FPOP to test the claim by Hambly and Gross that it labels a protein faster than its unfolding. Fast laser temperature-jump methods coupled with several spectroscopy techniques have measured timescales of folding for protein model systems.18 Recent studies by Chung and coworkers19, 20 using 2D IR spectroscopy, dispersed vibrational echo spectroscopy, and MD simulation, showed that the fast-folding response of ubiquitin, of breaking native contacts in its β-sheet, proceeds within 3 μs of an abrupt T-jump. Although such perturbation is wholly different than chemical modification, the timescale of ubiquitin response is suggestive of the earliest changes we may expect for those proteins that are conformationally sensitive to oxidative modification. Small in size and tractable for analysis, β-lactoglobulin (β-lg), apo-calmodulin (apo-CaM), and lysozyme (LysC) are not structurally similar, yet are representative of proteins exhibiting this sensitivity.21, 22 Therefore, we chose these proteins to test the hypothesis.
Venkatesh and coworkers21 proposed a method of ascertaining whether hydroxyl radical reactions sample the native protein conformation or upset the structural equilibrium during the timescale of exposure. Their approach is appropriate for continuous-dose methods because they provide a near steady state hydroxyl radical concentration, allowing for a pseudo-first order kinetic model to be used.22, 23 The FPOP method, however, cannot be so evaluated because it is pulsed. A single laser pulse provides a well defined start, and chemical quenching provides the “shutter” for the reaction. The 17-nsec laser pulse generates an [•OH ] of approximately 1 mM. We estimate that the presence of glutamine radical scavenger at 20 mM effectively quenches radical exposure by ~ 1 μs; thus, the [•OH ] is not at steady state.16.
An appropriate approach is to test for a change in conformation induced by FPOP on the labeling timescale. One means of monitoring protein conformational changes is to track their charge-state distribution.24–29 This approach, however, has difficulty distinguishing fast and slow FPOP-induced conformation changes. One might follow Maleknia and coworkers30–32, who developed protein footprinting by generating reactive oxygen species in an ESI source, accommodating rapid mass spectrometry analysis, but this approach suffers from the uncertainty that protein conformation in a charge-dense droplet in a high electric field is relevant to solution biology. The special experimental features of FPOP require an indirect evaluation method.
Test of Hypothesis that FPOP Oxidizes Protein Faster than its Unfolding
If an effective radical exposure at 1 μs is shorter than a significant structural response to oxidative modification, and if the probability of modification at a site is a function of its solvent accessibility, it follows that the modification probability at each site is independent of other incurred modifications for such an exposure. It is also a function of the site's inherent chemical reactivity.6, 33 The modification probabilities of the most sensitive sites can be approximated by an average probability. A binomial distribution models the outcomes of this approximation. The probability a protein will be modified k times is:
| (1) |
for N potential modification sites, each with pmod probability of modification. As N increases, this probability diminishes for any one site, yet the product Npmod is invariant. For example, two proteins, one large and one small, undergoing controlled oxidative labeling, will exhibit the same product distribution only if they are exposed at equal mass concentration other things being equal (i.e., the solvent accessibility/size ratio and average reactivity of each site). The limiting case of the binomial distribution as N → ∞ is the Poisson distribution, with a probability mass function:
| (2) |
Significantly, this is parameterized by only one factor, λ, which is the expected number of events 〈k〉 and their variance 〈k2〉 – 〈k〉2. In practice for N > 50 and p < 0.02, an optimal λ gives a Poisson distribution matching the binomial, per outcome, to within the determination error (inclusive of experimental error and modeling uncertainty) of any •OH modification state of a protein.
The dominant product pathway for most residue sidechains reacting with •OH is the net addition of oxygen (+16 Da) by substitution of H for OH.8, 34 Consequently, the distribution of modified products can be simplified as a 0, +16, +32… addition state distribution, wherein proteins are binned only by the number of increments in 16 Da they have gained. For a properly controlled FPOP experiment, we hypothesize that the distribution of 0, +16, +32… products should be very nearly Poisson if the footprinting reactions occur more rapidly than any significant protein unfolding. This hypothesis is the basis for our evaluation of the three aforementioned proteins subjected to varying oxidation conditions.
EXPERIMENTAL SECTION
Reagents
Bovine β-Lactoglobulin A, lysozyme from chicken egg white, 30% hydrogen peroxide, L-glutamine, L-methionine, catalase, urea, ethylene glycol-bis(2-aminoethylether)-N,N,N′,N′-tetraacetic acid (EGTA), acetonitrile, formic acid, and phosphate buffered saline (PBS) were purchased from the Sigma Aldrich Chemical Company (St. Louis, MO). Bovine CaM was purchased from Oceanbiologics (Corvallis, OR). The proteins were used without further purification. tris-(2-Carboxyethyl) phosphine hydrochloride (TCEP-HCl) was purchased from Pierce Biotechnology, Inc (Rockford, IL). Purified water (18 MΩ) was obtained from an in-house Milli-Q Synthesis system (Millipore, Billerica, MA).
Oxidative-modification labeling
Each 50 μL sample was prepared in PBS (10 mM phosphate buffer, 138 mM NaCl, 2.7 mM KCl, pH 7.4 at 25 °C) with a final protein concentration of 10 μM. Apo-CaM samples included 100 μM EGTA for the chelation of adventitious calcium. Glutamine was added to a final concentration of 20 mM in normal FPOP samples. Hydrogen peroxide was added to a final concentration of 15 mM just before FPOP infusion. The flowing sample solution was collected in a 0.6 mL microcentrifuge tube containing an additional 20 μL of 100 nM catalase and 70 mM methionine in PBS, as per the normal FPOP procedure. The breakdown of peroxide by catalase was conducted by allowing the sample to react for 10 min at room temperature before freezing the samples at −80°C.
FPOP was conducted as described previously, but with150 μm ID fused silica (Polymicro Technologies, Pheonix, AZ).16 The 2.54 mm beam width was measured from a 30-shot burn pattern on label tape affixed to a temporary beam stop placed in the plane of the flow cell. Samples with an approximate 15% exclusion volume fraction (EVF) were infused at a rate of 19.00 ± 0.04 μL/min, and the excimer pulse frequency was set to 6.00 ± 0.02 Hz. 30% and 60% EVF samples were infused at the same rate but with 4.94 ± 0.02 and 2.82 ± 0.02 Hz pulse frequencies, respectively.
Mass spectrometry
Each sample was thawed and ZiptipC4-desalted (Millipore, Billerica, MA) before ESI MS acquisition on a Waters Ultima Global quadrupole time-of-flight (Milford, MA), operating in V mode at 12,000 FWHM resolving power at 838.8 m/z ((CF3COONa)6Na+ calibrant ion). Some samples were subjected to a 1 h, 37 °C incubation in 8 M urea, 5 mM TCEP prior to de-salting. The 10 μL 50% acetonitrile 1% formic acid elution solution was diluted 3-fold with 50% aqueous acetonitrile prior to direct infusion. The capacity of the 0.6 μL bed ZiptipC4 was approximately 3.3 μg, so that 180–230 pmol of protein was infused at a flow rate adjusted to insure accuracy in the time-to-digital conversion of the multi-channel plate detector, requiring 80–180 ion counts/scan base peak. Scans spanning the entire chromatogram were summed to improve the signal-to-noise ratio, typically 60–150 scans depending on the flow rate.
Data analysis
A 20–40 m/z spectrum window about the 15th charge state of β-lg and apo-CaM and 10th charge state of LysC was fit with a model FPOP product distribution (described below), for each protein replicate. The window range encompassed all detected product peaks and a 10 m/z region lower than the unmodified peak average m/z for baseline estimation.
MATHEMATICAL MODELING
The FPOP charge state spectrum model is the weighted sum of the set of Nox non-zero oxygen-addition states [M + O + z·H]z+, [M + 2·O + z·H]z+,…, [M + Nox ·O + z·H]z+, together with the unmodified state [M + z·H]z+. The ith state Ai is represented as an unresolved isotopic distribution centered on the [M + i·O + z·H]z+ average m/z; its contribution is weighted by the coefficient ai. The sum has the form:
| (1) |
The baseline constant E is the average spectrum noise taken 5–7 m/z lower than the unmodified protein peak in the zth charge state. There is no uncertainty in the form of the isotopic distribution as we know the elemental composition of each oxygen-addition product. A Mathcad 14 Minimize algorithm was used to fit the model to the spectrum to determine the coefficient values; these values convey the oxygen-addition state distribution and were tested for goodness-of-fit to a Poisson distribution. The solution convergence tolerance was 10−12.
We further expand the spectrum model two ways. One motivation is to deal with the charge state spectrum that is complicated by low abundance starting material, electrospray adducts, and other FPOP oxidation products that do not correspond to +16, +32… We assume that these latter adducts are equally likely to be observed for each +16, +32… state, including the unmodified protein, with an important exception discussed below. ESI MS of control samples, wherein the protein is subjected to identical sample handling and peroxide exposure but not pulsed laser irradiation, provided spectra for determining the presence of adducts of the starting protein and other impurities, ESI-induced losses of ammonia and water, direct hydrogen peroxide oxidation, and salt adduction. A peak detection algorithm was employed to detect and pass the mass shifts and relative intensities of these peaks to the modeling algorithm.
The low abundance FPOP products that do not correspond to the substitution of H for OH or the simple addition of an oxygen atom (+16) fall into two categories: resolved and unresolved. Resolved peaks corresponding to losses of ammonia, water, and the −30 Da major product of acidic residue oxidation from the zero oxygen-addition state were observable as they are shifted to lower m/z than the major oxygen-addition product series. Especially for apo-CaM (see Figure 4), these peaks were more conspicuous than in the control and must result from species produced in the FPOP treatment. Additional control experiments in which hydrogen peroxide was not added showed that the excimer laser did not contribute to these modifications (data not shown). Other FPOP products include but are not limited to +14 Da carbonyl incorporation at aliphatic residues, −23, −22, −10 and +5 Da shifted histidine oxidation products, and −43 Da deguanidination at arginine.8 Their low abundance is obscured by the dominant 0, +16, +32… distribution and so are unresolved. The distribution of proteins undergoing such reactions and having I +16 Da additions, was modeled as a normal distribution, whose amplitude, variance, and centroid displacement from the ith oxygen-addition state were set by the algorithm. All of the parameters that model the complexity of each population of proteins having 0, +16, +32… mass increments were determined by preliminary empirical modeling, in the case of resolved and control adducts, or for the unresolved adducts, by the same Minimize algorithm that determines the state coefficients. It is important to note that these parameters are state-invariant, unlike the state coefficients.
Figure 4.

ESI-QTOF mass spectra (a–c) are of the 15th charge state apo-calmodulin; spectra (e–g) are of the 10th charge state of lysozyme. Spectra (a) and (d) are of the controls, absent only laser irradiation; (b) and (e) are of samples after normal FPOP treatment (i.e., with scavenger and removal of peroxide post FPOP); (c) and (f) are of samples after FPOP treatment absent the scavenger (20 mM Gln).
The second spectrum model expansion is crucial for determining the distribution of 0, +16, +32,… for its Poisson goodness-of-fit evaluation. Owing to the EVF, only a fraction of the full contribution of the 0th state (i.e., the signal for the unoxidized protein) should be included in the FPOP product distribution analysis. This fraction represents the proteins in the irradiated volume that undergo no additions of 16, 32… Furthermore this fraction contributes FPOP adducts other than those in the series corresponding to +16, +32…, whereas the EVF does not. The model is rewritten as:
| (2) |
Here the 0th state is split between the exclusion volume portion , which has the form of a simple isotopic distribution convolved with those adduct peaks seen in the control experiments, and the irradiated volume portion, fa0A0 which has a form identical to all other oxygen-addition states and so contains all complicating terms. The parameter f is not the irradiation fraction of the 0th state; rather, the adjusted coefficient fa0, is proportional to the 0th state peak area attributed to this fraction by definition (eqn 2). The other ai coefficients are likewise proportional to their +16, +32… state peak areas. The parameter f is fixed in the modeling algorithm by its relation to the independently measured EVF:
| (3) |
The underscored state variables denote integration over the entire m/z spectrum encompassing the charge-state product distribution.
A Mathcad 14 Minimize algorithm was also used to fit a Poisson distribution to the set of 0, +16, +32… state peak areas {fA0,Ai| t = 1,…,Nox}. The Poisson characteristic parameter λ determined by this minimization gives the Poisson +16, +32… addition state expectation value. A second modeling approach was also examined, in which f was varied to optimize a Poisson fit, thereby determining the EVF. This tested the corollary of our hypothesis: that an FPOP protein-product distribution well modeled by a Poisson should provide an EVF corroborating its independent measure—although a match doesn't prove the converse. The reader is referred to Supporting Information for a more detailed discussion of the modeling and Poisson-fitting algorithms.
Results and Discussion
Taking that a single conformation protein invariant to FPOP has a large number of independent sites of low modification probability, the distribution of species for which the molecular weight has increased by 0, +16, +32… should be well modeled by a Poisson distribution. The low specificity of hydroxyl radical footprinting means up to 85 residue sidechains in a 100-residue protein may be modified, depending on •OH exposure. The frequency of a residue's modification can be further split among the atomic sites of the residue (e.g., phenylalanine can be modified at o, m, p sites). It follows that there are more than 100 oxidative-modification sites, even for a small 100-residue protein. The probability of reaction is site-specific, and is determined by the site's inherent reactivity and solvent accessibility. Xu and Chance6 showed in γ-ray radiolysis dose experiments that among 10 of the 12 most reactive amino acids, oxidation by hydroxyl radicals spans a 30-fold range of first-order product formation rates..
While the reactivity at any site is unique, it is well approximated as having an average modification probability, pmod. We designed the FPOP experiment so that the OH radicals have a short lifetime in a properly quenched experiment. Shortening the radical exposure time reduces the set of reactive sites, thereby improving the representation of each site as the average. If the time is too short, the residue resolution of the footprint experiment will be lost. Replacing 20 mM Gln with 20 mM Phe depletes [•OH ] at a 10-fold faster rate16; we observed that >90% of oxidative-modification products for several proteins are abolished with this change (data not shown).
In the event that the protein partially contorts from its native conformation on the timescale of radical exposure, the distribution of products from oxygen addition will change if one or more oxidation targets have a substantially different solvent accessibility. In this case, the resultant distribution cannot be Poisson for two reasons. First, the site probabilities are no longer independent. Second, the native state pmod cannot describe the average modification probability for newly exposed sites because their exposure time is shorter. For the simplest example, consider the oxidative modification of a mixture of two protein conformations, each insensitive to oxidation-induced perturbation and each with its own pmod. The oxygen-addition state distribution for each population is ideally Poisson, but the overall protein population is not; that is, the distribution from the sum of two Poisson distributions having different means is not itself Poisson.
Although we have not tested that a protein with an invariant conformation exhibits a Poisson-like oxygen-addition distribution following FPOP, this is a reasonable assumption. Rather, if we find the distribution of products is Poisson or nearly so, we may conclude the conformation was unaffected during labeling. Thus, the test for induced FPOP-timescale conformation change requires 1) determining the distribution of products corresponding to substitution of H by OH or by addition of an oxygen atom, 2) determining its best-fitting Poisson distribution, and 3) evaluating the goodness-of-fit.
We also tested whether changes to the FPOP procedure and to post-labeling conditions and sample handling affect the product distribution. When the Gln radical scavenger, normally constituent with the sample, is removed, the radical lifetime is determined principally by its self-reaction rate and is approximately 100-times longer.16, 33 Consequently, we expect that oxidation-sensitive proteins will adopt significantly different product distributions from a best fitting Poisson because there will likely be a structural response on this timescale. Furthermore, given that covalent modification footprinting can involve days of sample handling, millimolar levels of hydrogen peroxide may slowly oxidize proteins especially at exposed Met and Cys.35 Intentionally or otherwise, buried residues often experience solvent exposure with such handling, so that all peroxide-reactive residues are vulnerable. By omitting catalase and allowing hydrogen peroxide to persist following FPOP treatment, we can test the sensitivity of FPOP-treated protein to further peroxide oxidation and long-time (minute-hour) conformational change.
Data Acquisition and Analysis
We chose not to model a deconvoluted or “decharged” mass spectrum of each sample, owing to uncertainties in fitting to the output of the Waters MaxEnt1 maximum entropy algorithm supplied with the mass spectrometer data system. We selected single charge states instead: the 15th charge state of β-lg and 10th charge state of LysC. These choices are justified by their match to the charge state-invariant product distribution of the FPOP-treated protein, determined in an experiment wherein the protein was denatured by urea prior to ESI-MS (data not shown).
This integrity of a distribution determined for a charge state is of concern because ESI affords different responses (different charge-state distributions) to different conformers of a protein. A partially unfolded protein can accommodate more protons and will have a charge state distribution shifted to higher charge. In fact, two proteins (β-lg and LysC) exhibited product distributions that were charge-state dependent; that is, at higher charge states, the peak corresponding to the unmodified protein is significantly diminished, and the higher +16, +32… states are relatively more populated than at lower charge states. Denaturing and reducing (β-lg has 2 and LysC 4 disulfide linkages) a portion of each protein following FPOP treatment just prior to desalting and direct infusion, we could minimize any dependence of the relative product distribution on charge state. This charge-state dependence indicates that the protein ultimately infused for ESI analysis existed as a mixture of conformers in the un-denatured treatment (an acidic 50% acetonitrile solution does not fully denature β-lg and LysC although this may be due to their intact disulfide bonds). Venkatesh, Sharp and coworkers21, 22 showed that the proteins selected for this study are susceptible to partial unfolding upon oxidation. Our finding that proteins undergoing multiple +16, +32… additions dominate the higher charge states corroborates their finding. Although the 8 M urea denaturing solution was freshly prepared, significant carbamylation (+43 Da) of primary amines was observed in the unoxidized control sample for both proteins. On this basis, we chose to analyze single charge states to obtain the distribution of 0, +16, +32… states and eschewed the analysis of post-FPOP urea-denatured samples.
On the other hand, apo-CaM, a 16.8 kDa dumbbell-shaped protein with no disulfide bonds, showed a relative FPOP product distribution that was invariant of charge state. Its 15th charge state was analyzed because its peaks were the most intense in the mass spectrum.
Agreement with a Poisson Distribution
The optimum model fit to the 15th charge state of β-lg sample oxidized under normal FPOP conditions (Figure 2) typifies the fit observed for all three proteins under the same conditions. The spectrum/model relative residuals (normalized to the spectrum intensity) at each data point are generally in good agreement. The model fit, however, is poorer at higher m/z: the average |relative residual| doubles from 0.042 at to 0.082 at m/z > 1235 (Figure 2a). The higher +16, +32… addition states are more resolved in the calculated (model) spectrum than in the experimental spectrum. This may be a consequence of an underestimation of the background contribution in this region. Given this uncertainty, the states analyzed for Poisson likeness were restricted to the first states, accounting for at least 95% of the signal.
Figure 2.
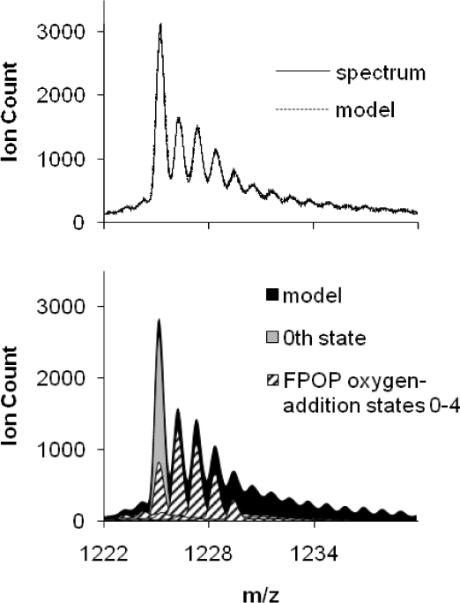
Graph (a) is of the ESI-QTOF mass spectrum of the 15th charge state of FPOP-treated β-lactoglobulin and its composite model. Graph (b) is of the background-subtracted model and its first five oxygen-addition state components (hashed fill). The 0th state (gray) is made up of a 53% contribution from the exclusion volume fraction (not shown) and a 47% contribution from the irradiated portion of the sample that did not react with OH radicals.
Each 0, +16, +32…state contribution in 2b has two dominant features: a major isotopic distribution peak with a centroid at [Mr + tO + 15H]15+, and a broad normal distribution with an intensity 1.0 ± 0.3% that of the major peak; this was seen for all proteins under all FPOP treatments. The portion of the 0th state owing to zero oxygen additions in the irradiated volume is fixed in the spectrum modeling by the measured EVF (eq 3).
The distribution is affected by changes in EVF, radical scavenger, and post-FPOP oxidation protection: Figure 3 shows spectra of β-lg treated with these variations and again typifies the CaM and LysC spectra (Figure 4). Intensity is plotted relative to each spectrum's maximum. Exposure for 5 min to 15 mM H2O2 does not oxidize these proteins (Figures 3a, 4a, 4d). In the “normal” FPOP treatment, radical exposure is controlled with constituent Gln scavenger. Post-FPOP oxidation is minimized by removing any left over H2O2 by reaction with catalase and adding millimolar levels of Met.36 Methionine, a competitive oxidation reagent, was used because the samples were not analyzed immediately after their treatment. Tuning the EVF from 60 to 15% by increasing the laser frequency for samples submitted to a properly controlled FPOP procedure (Figure 3b–d) increases the levels of oxidation. Without radical control (no Gln scavenger) and/or removal of peroxide post FPOP (Figure 3e–f), the product distributions skew significantly to higher oxidation levels. The S/N ratio is also worse, as an equivalent amount of protein is spread over more states, relative to the other spectra.
Figure 3.

ESI-QTOF mass spectra of the 15th charge state of six β-lactoglobulin samples subjected to varying FPOP conditions. Spectrum (a) is of the control, absent only laser irradiation; (b) is of a normal FPOP treatment with an EVF 60%; (c) is of a normal treatment with an EVF 30%; (d–f) are of samples with an EVF of 15%; (d) is of a normal treatment (all controls); (e) is of a treatment absent 20 mM Gln; and (f) is of a treatment without use of scavenger (Gln), removal of peroxide (by catalase), and control of post FPOP oxidation (addition of Met).
The Poisson fitting to the modeled distribution of β-lg samples is shown in Figure 5. The state coefficients {fao, ai | i = 1, …, Nox} determined by the spectrum modeling are proportional to the ion counts comprising the peak area of each state; these values are normalized to give probability values in the figure. In all cases, the f factor was fixed by the measured EVF, except for the FPOP experiments without the glutamine scavenger. The standard error bars are in general small except for the 0th state. This stems from the sensitivity of the 0th state to the f factor calculation—small changes in the set of coefficients {ai | i = 0, …, Nox} can compensate a larger change in f without unduly worsening the spectrum model fit.
Figure 5.
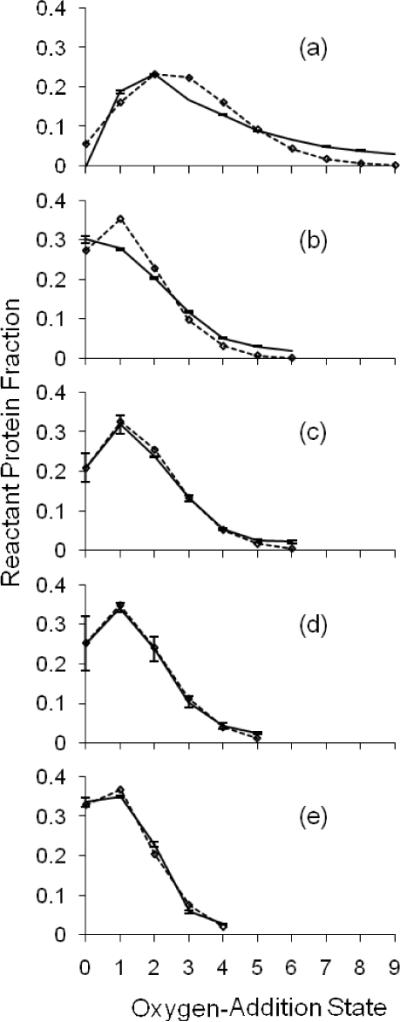
The irradiation volume oxygen-addition state ion counts are modeled for the spectrum of each bovine β-lactoglobulin sample. The modeling was constrained such that the calculated EVF matched the independently measured EVF. Per condition, shown with standard error bars along a solid line, are the averages of the normalized ion counts of four replicates (a–c) and two replicates (d–e). The diamonds along a dotted line show the non-linear regression best-fit Poisson distribution to the average oxygen-addition state distribution. The number of states per sample distribution fit to a Poisson was chosen to account for at least 95% of protein signal. Plot (a) is for sample submitted to FPOP but without the glutamine radical scavenger. When all zero oxygen-addition protein is assigned to the EVF, its value is 9%, short of the measured 15%. Plot (b) is for sample submitted to FPOP but without removal of peroxide post-FPOP, with a 15% EVF. Plot (c) is for sample FPOP-treated with a 15% EVF. Plot (d) is for sample FPOP-treated with a 30% EVF. Plot (e) is for sample FPOP-treated with a 60% EVF.
Qualitatively, the Poisson distribution fitting to the sample distributions obtained by appropriately controlled FPOP at all experimental EVF levels is much better than for samples submitted to FPOP but without scavenger (Gln) or post-FPOP removal of peroxide by catalase. This is also realized for the other two proteins, apo-CaM and LysC. Table 1 summarizes the Student's-t goodness-of-fit evaluation for each 0,+16,+32…oxidation state. The chi-Squared goodness-of-fit test was not employed because there is modeling uncertainty in binning large ion counts among oxidation states, and it does not convey per state residual statistics.
Table 1.
Student's t Goodness-of-Fit Statistics of the Poisson Fit to the FPOP 16 Da-Increment State Distributiona
| Protein | β-Lactoglobulin | Apo-Calmodulin | Lysozyme | ||||||
|---|---|---|---|---|---|---|---|---|---|
| FPOP Formulation | Normal | Absent Gln | Absent Catalase | Normald | Normald | Normal | Absent Gln | Normald | Absent Gind |
| EVF | 15% | 15% | 15% | 30% | 60% | 15% | 15% | 15% | 15% |
| Poisson Mean | 1.6 | 2.9 | 1.3 | 1.4 | 1.1 | 1.6 | 2.7 | 2.5 | 3 |
| No. of States Fit b | 7 | 10 | 7 | 6 | 5 | 6 | 10 | 7 | 10 |
| No. of States, p-value >0.05 c | 6 | 2 | 2 | 6 | 5 | 5 | 0 | 5 | 4 |
| Student's t p(state)-values | |||||||||
| P(0) | 0.9 | e | 0.1 | 0.9 | 1.0 | 0.04 | e | 0.7 | e |
| P(1) | 0.6 | 0.007 | 0.00001 | 0.2 | 0.3 | 1.0 | 0.01 | 0.02 | 0.3 |
| P(2) | 0.003 | 0.1 | 0.001 | 0.8 | 0.5 | 0.01 | 0.006 | 0.5 | 0.01 |
| P(3) | 0.9 | 0.0001 | 0.1 | 0.4 | 0.2 | 0.8 | 0.0002 | 0.5 | 0.01 |
| P(4) | 0.1 | 0.002 | 0.001 | 0.6 | 0.4 | 0.03 | 0.003 | 0.5 | 0.1 |
| P(5) | 0.9 | 0.4 | 0.0004 | 0.2 | 0.2 | 0.03 | 0.2 | 0.1 | |
| P(6) | 0.3 | 0.00005 | 0.0001 | 0.3 | 0.002 | 0.005 | 0.0009 | ||
| P(7) | 0.00002 | 0.2 | 0.001 | 0.0003 | |||||
| P(8) | 0.0002 | 0.002 | 0.1 | ||||||
| P(9) | 0.0004 | 0.004 | 0.01 | ||||||
Each Poisson distribution was fit to the exclusion volume fraction constrained model of a single charge state Q-TOF spectrum of the FPOP-treated sample spectrum.
The number of states is inclusive of ≥ 95% of protein signal
The null hypothesis for each state is that its observed normalized frequency = Poisson distribution probability for that outcome.
These treatments were analyzed in duplicate; all others in quadruplicate.
All unmodified protein was necessarily assigned to the EVF for the absent radical scavenger samples.
For the FPOP experiment in which the EVF was 15% and no scavenger (Gln) was present, the EVF could not be correctly calculated (Figure 5a). Setting the f factor to zero (i.e., the protein in the exclusion volume accounts for all of the zero-addition state) forces the model to give an EVF of 9%. The fraction of unoxidized protein is significantly less than the measured EVF. A reasonable interpretation of the result in Figure 3e is that there is some zero oxygen-addition state contribution from the irradiated volume; this further depresses the calculated EVF from the expected value. In fact, uncoupling the calculated EVF from its measured value by using the Poisson-dependent modeling approach shows that for the FPOP-treated sample without scavenger, the EVF is less than half 15% (Table 2). This is illustrated for β-lg in Figure 6. Each normalized distribution is for a sample submitted to FPOP with a 15% EVF; plots a and b clearly show poorer fitting than the plot obtained when the sample is submitted to FPOP with the correct controls in place (plot c).
Table 2.
Exclusion Volume Fraction (EVF) Determination From the Poisson-Parameterized Modeling of Spectra
| Protein | β-Lactoglobulin | Apo-Calmodulin | Lysozyme | ||||||||
|---|---|---|---|---|---|---|---|---|---|---|---|
| FPOP Formulation | Normal | Absent Gln | Absent Catalase | Absent All | Normal | Normal | Normal | Absent Gln | Absent Catalase | Normal | Absent Gln |
| EVF | 15% | 15% | 15% | 15% | 30% | 60% | 15% | 15% | 15% | 15% | 15% |
| Modeled EVF | 0.17 ±0.02 | 0.070 ±0.004 | 0.211 ±0.003 | 0.066 | 0.30 ±0.03 | 0.54 ±0.01 | 0.11 ±0.01 | 0.060 ±0.005 | 0.031 ±0.006 | 0.11 ±0.01 | 0.048 ±0.001 |
Figure 6.
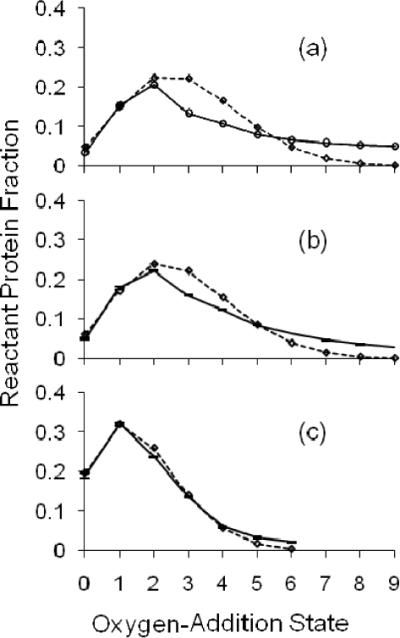
The irradiation volume oxygen-addition state ion counts are modeled for the spectrum of each β-lactoglobulin sample. A non-linear regression best fit Poisson distribution was simultaneously determined; the EVF was varied to optimize the fit. Per condition, shown with standard error bars along a solid line, are the averages of the normalized ion counts of 4 replicates (b and c); case (a) is singlicate. The number of states per sample distribution plotted account for at least 95% of protein signal. The diamonds along a dotted line show the Poisson distribution. Plot (a) is for sample FPOP-treated without glutamine radical scavenger, post-FPOP catalase, or post-FPOP methionine. The best fit exclusion volume was calculated at 6.6%. Plot (b) is for sample FPOP-treated without glutamine, with a calculated EVF of 7.0 ± 0.4%. Plot (c) is for sample FPOP-treated with a calculated EVF of 17 ± 2%. In all cases the measured EVF was 15%.
Thus, contrary to the controlled FPOP treatment, some of the protein in the EVF is oxidized when the radical scavenger is absent. This may occur for three reasons: (1) the radical and protein diffuse from the irradiated volume, (2) oxidation is initiated by diffuse 248 nm light outside the considered reaction volume, and/or (3) one protein is oxidized by another following laser irradiation. The first mechanism is unlikely. Even without considering the hydroxyl radical recombination rate of 5.5×10⁻⁹ M−1s−1, the concentration of hydroxyl radical 5 microns into the exclusion volume after 100 μsec is only 0.15% the 1 mM theoretical maximum instantaneous [•OH ] in the irradiated volume.16, 33 The •OH diffusion coefficient was estimated by molecular dynamics simulation to be 7.1×10⁻⁹ m2 s−1.37, 38 Without any scavenger, protein oxidation in the excluded volume may be due to lingering radicals created at low levels from H2O2 photolysis. Although highly collimated, the incident laser beam edges may extend >10 microns beyond the observed irradiation width. Finally, the oxidation by hydroxyl radicals is not a one-step process. In some protein-hydroxyl radical reactions, superoxide is created. Superoxide has a longer half-life than hydroxyl radical; sulfur-containing residues are sensitive to this ROS, although their reaction with O2−• is much slower than with •OH.7, 36 Additionally, some protein-hydroperoxide intermediates may react intermolecularly instead of following the usual pathways to modification.39 These peroxides are formed predominantly at aliphatic residues where a carbon-centered radical from hydrogen abstraction by an hydroxyl radical is stabilized by dissolved molecular oxygen.34
The last mechanism of intermolecular oxidation is potentially a problem for all oxidative-modification footprinting strategies. Yet evidence thus far from proteolysis and MS/MS analysis of constituent peptides shows that the sites of oxidation are consistent with the residue sidechain solvent accessibilities calculated from x-ray crystallography and NMR structures of several proteins.13, 15, 16, 22 States higher than +8 oxygens are of very low abundance when FPOP is correctly controlled, but they are significantly more populated when a radical scavenger is not included. Latent protein-peroxide oxidation of newly accessible residues may be a millisecond-minute pathway capable of enriching these higher states without the presence of large excesses of Gln.
Conclusion
FPOP conducted properly by including control on radical lifetime and minimizing exposure to peroxide post FPOP provides a means of footprinting proteins without perturbing unduly their conformation during labeling. Although some proteins undergoing several oxidations do unfold at longer times (by the time of ESI-MS), this unfolding occurs post-FPOP, as established by finding a good fit of the +0, +16, +32… state product distribution to a Poisson distribution under proper conditions. The underlying assumption is that the Poisson model is applicable to footprinting a protein population sharing an invariant conformation and having many non-cooperative oxidation sites. In cases where radical and peroxide controls are insufficient, the product distribution is shifted to higher states of modification, as expected, and is no longer well described by a Poisson distribution. The implication that partial unfolding occurs during the timescale of modification is consistent with the Poisson model. This test is not ad-hoc as it holds for three proteins. Moreover, we suggest that the approach is an appropriate validation of any oxidative-modification footprinting. The global modification distribution of •OH-treated proteins larger than 20 kDa can also be examined for concordance with a Poisson distribution—in fact the Poisson approximation of the binomial distribution is improved with more labeling sites.
Accurate modeling requires approximately half-height resolution of distinct +16 Da states; mass resolving power achievable on FTMS instruments is needed for proteins as large as BSA (66 kDa). The modification distribution should be only a function of the native conformation state of a protein. If the native state is an equilibrium mixture of conformations, the distribution will not necessarily be Poisson. If this non-Poisson distribution occurs in a properly controlled FPOP experiment, then it serves as a means for testing conformational change induced by additional perturbations (such as denaturant) to the native equilibrium.
Supplementary Material
References
- (1).Hirs CHW, Di Sabato G, Ottesen M, Gold AM, Gurd FRN, Horton HR, Koshland DE, Kimmel JR, Klotz IM, Ludwig ML, Hunter MJ, Neumann NP, Ray WJ, Riordan JF, Vallee BL, Sela M, Arnon R, Spande TF, Witkop B, Stark GR, Wilcox PE, Wold F. Methods in Enzymology. Vol. 11. Academic Press; 1967. pp. 485–748. [Google Scholar]
- (2).Fenn JB, Mann M, Meng CK, Wong SF, Whitehouse CM. Science. 1989;246:64–71. doi: 10.1126/science.2675315. [DOI] [PubMed] [Google Scholar]
- (3).Karas M, Bachmann D, Hillenkamp F. Anal. Chem. 1985;57:2935–2939. [Google Scholar]
- (4).Lars Konermann XTYP. J. Mass Spectrom. 2008;43:1021–1036. doi: 10.1002/jms.1435. [DOI] [PubMed] [Google Scholar]
- (5).Xu G, Chance MR. Anal. Chem. 2004;76:1213–1221. doi: 10.1021/ac035422g. [DOI] [PubMed] [Google Scholar]
- (6).Xu G, Chance MR. Anal. Chem. 2005;77:4549–4555. doi: 10.1021/ac050299+. [DOI] [PubMed] [Google Scholar]
- (7).Xu G, Chance MR. Anal. Chem. 2005;77:2437–2449. doi: 10.1021/ac0484629. [DOI] [PubMed] [Google Scholar]
- (8).Xu G, Chance MR. Chem. Rev. 2007;107:3514–3543. doi: 10.1021/cr0682047. [DOI] [PubMed] [Google Scholar]
- (9).Fenton HJH. J. Chem. Soc. Proc. 1894;10:157–158. [Google Scholar]
- (10).Tullius TD, Dombroski BA. Proc. Natl. Acad. Sci. U.S.A. 1986;83:5469–5473. doi: 10.1073/pnas.83.15.5469. [DOI] [PMC free article] [PubMed] [Google Scholar]
- (11).Shanblatt SH, Revzin A. J. Biol. Chem. 1987;262:11422–11427. [PubMed] [Google Scholar]
- (12).Maleknia SD, Ralston CY, Brenowitz MD, Downard KM, Chance MR. Anal. Biochem. 2001;289:103–115. doi: 10.1006/abio.2000.4910. [DOI] [PubMed] [Google Scholar]
- (13).Kiselar JG, Maleknia SD, Sullivan M, Downard KM, Chance MR. Int. J. Radiat. Biol. 2002;78:101–114. doi: 10.1080/09553000110094805. [DOI] [PubMed] [Google Scholar]
- (14).Guan JQ, Takamoto K, Almo SC, Reisler E, Chance MR. Biochemistry. 2005;44:3166–3175. doi: 10.1021/bi048021j. [DOI] [PubMed] [Google Scholar]
- (15).Hambly D, Gross M. Int. J. Mass Spectrom. 2007;259:124–129. [Google Scholar]
- (16).Hambly DM, Gross ML. J. Am. Soc. Mass Spectrom. 2005;16:2057–2063. doi: 10.1016/j.jasms.2005.09.008. [DOI] [PubMed] [Google Scholar]
- (17).Aye TT, Low TY, Sze SK. Anal. Chem. 2005;77:5814–5822. doi: 10.1021/ac050353m. [DOI] [PubMed] [Google Scholar]
- (18).Dill KA, Ozkan SB, Shell MS, Weikl TR. Annu. Rev. Biophys. 2008;37:289–316. doi: 10.1146/annurev.biophys.37.092707.153558. [DOI] [PMC free article] [PubMed] [Google Scholar]
- (19).Chung HS, Ganim Z, Jones KC, Tokmakoff A. Proc. Natl. Acad. Sci. U.S.A. 2007;104:14237–14242. doi: 10.1073/pnas.0700959104. [DOI] [PMC free article] [PubMed] [Google Scholar]
- (20).Chung HS, Khalil M, Smith AW, Ganim Z, Tokmakoff A. Proc. Natl. Acad. Sci. U.S.A. 2005;102:612–617. doi: 10.1073/pnas.0408646102. [DOI] [PMC free article] [PubMed] [Google Scholar]
- (21).Venkatesh S, Tomer KB, Sharp JS. Rapid Commun. Mass Spectrom. 2007;21:3927–3936. doi: 10.1002/rcm.3291. [DOI] [PubMed] [Google Scholar]
- (22).Sharp JS, Tomer KB. Biophys. J. 2007;92:1682–1692. doi: 10.1529/biophysj.106.099093. [DOI] [PMC free article] [PubMed] [Google Scholar]
- (23).Sclavi B, Woodson S, Sullivan M, Chance M, Brenowitz M, Gary KA, Michael LJ. Methods in Enzymology. Volume 295. Academic Press; 1998. pp. 379–402. [DOI] [PubMed] [Google Scholar]
- (24).Meng CK, Mann M, Fenn JB. Z. Phys. D: At., Mol. Clusters. 1988;10:361–368. [Google Scholar]
- (25).Chowdhury SK, Katta V, Chait BT. J. Am. Chem. Soc. 1990;112:9012–9013. [Google Scholar]
- (26).Mirza UA, Cohen SL, Chait BT. Anal. Chem. 1993;65:1–6. doi: 10.1021/ac00049a003. [DOI] [PubMed] [Google Scholar]
- (27).Robinson CV, Radford SE. Structure. 1995;3:861–865. doi: 10.1016/S0969-2126(01)00221-0. [DOI] [PubMed] [Google Scholar]
- (28).Kaltashov IA, Abzalimov RR. J. Am. Soc. Mass Spectrom. 2008;19:1239–1246. doi: 10.1016/j.jasms.2008.05.018. [DOI] [PubMed] [Google Scholar]
- (29).Liu J, Konermann L. J. Am. Soc. Mass Spectrom. 2009;20:819–828. doi: 10.1016/j.jasms.2008.12.016. [DOI] [PubMed] [Google Scholar]
- (30).Simin D, Maleknia MRCKMD. Rapid Commun. Mass Spectrom. 1999;13:2352–2358. doi: 10.1002/(SICI)1097-0231(19991215)13:23<2352::AID-RCM798>3.0.CO;2-X. [DOI] [PubMed] [Google Scholar]
- (31).Wong JWH, Maleknia SD, Downard KM. Anal. Chem. 2003;75:1557–1563. doi: 10.1021/ac026400h. [DOI] [PubMed] [Google Scholar]
- (32).Maleknia SD, Wong JWH, Downard KM. Photochem. & Photobiol. Sci. 2004;3:741–748. doi: 10.1039/b315904c. [DOI] [PubMed] [Google Scholar]
- (33).Buxton GV, Greenstock CL, Helman WP, Ross AB, Tsang W. J. Phys. Chem. Ref. Data. 1988;17:513–886. [Google Scholar]
- (34).Garrison WM. Chem. Rev. 1987;87:381–398. [Google Scholar]
- (35).Shechter Y, Burstein Y, Patchornik A. Biochemistry. 1975;14:4497–4503. doi: 10.1021/bi00691a025. [DOI] [PubMed] [Google Scholar]
- (36).Xu G, Kiselar J, He Q, Chance MR. Anal. Chem. 2005;77:3029–3037. doi: 10.1021/ac048282z. [DOI] [PubMed] [Google Scholar]
- (37).Van Holde KE, Johnson C, Ho PS. Principles of Physical Biochemistry. 2 ed. Prentice Hall; Upper Saddle River, NJ: 2005. [Google Scholar]
- (38).Campo MG, Grigera JR. The Journal of Chemical Physics. 2005;123:084507–084506. doi: 10.1063/1.2013253. [DOI] [PubMed] [Google Scholar]
- (39).Saladino J, Liu M, Live D, Sharp JS. J. Am. Soc. Mass Spectrom. 2009;20:1123–1126. doi: 10.1016/j.jasms.2009.02.004. [DOI] [PMC free article] [PubMed] [Google Scholar]
Associated Data
This section collects any data citations, data availability statements, or supplementary materials included in this article.