Abstract
We report a sensitive, label-free method for detecting single-stranded DNA and discriminating between single nucleotide polymorphisms (SNPs) using arrays of silicon photonic microring resonators. In only a 10 minute assay, DNA is detected at sub-picomole levels with a dynamic range of three orders of magnitude. Following quantitation, sequence discrimination with single nucleotide resolution is achieved isothermally by monitoring the dissociation kinetics of the duplex in real-time using an array of SNP-specific capture probes. By leveraging the multiplexed capabilities of the microring resonator platform, we successfully generate multiplexed arrays to quickly screen for the presence and identity of SNPs and show the robustness of this methodology by analyzing multiple target sequences of varying GC content. Furthermore, we show that this technique can be used to distinguish both homozygote and heterozygote alleles.
INTRODUCTION
With the sequencing of the human genome effectively complete, the development of high throughput and rapid DNA detection methods has become a major focus of research as the biomedical community seeks to translate genomic insight into clinical improvements in patient care. For example, DNA detection is an essential element of genetic screening,1 disease diagnosis,2,3 forensic analysis,4,5 single-nucleotide polymorphism (SNP) profiling,6,7 and drug quality control.8 Many traditional analysis tools involve fluorescent and/or enzymatic tags for detection, which can provide versatility and sensitivity. However, the requirement for labeled biomolecules can introduce limitations in terms of reagent cost and slower analysis times, and may also introduce signal bias into measurements. Label-free technologies represent alternative means for detecting a range of biomolecules, including DNA, enabling quantitative, multiplexed measurements and real time kinetic analysis of binding events without requiring additional assay reagents or sample pre-treatment (i.e., labeling).9
Microcavity optical resonators have emerged as an interesting class of devices that are well suited to label-free biomolecular quantitation.10 These biosensors, which include microspheres,11,12 microtoroids,13 microcapillaries,14,15 and microrings,16–19 support spectrally narrow optical resonances that are exceptionally responsive to binding-induced changes in the refractive index environment at the cavity surface. The relationship between refractive index and resonance wavelength is given by:
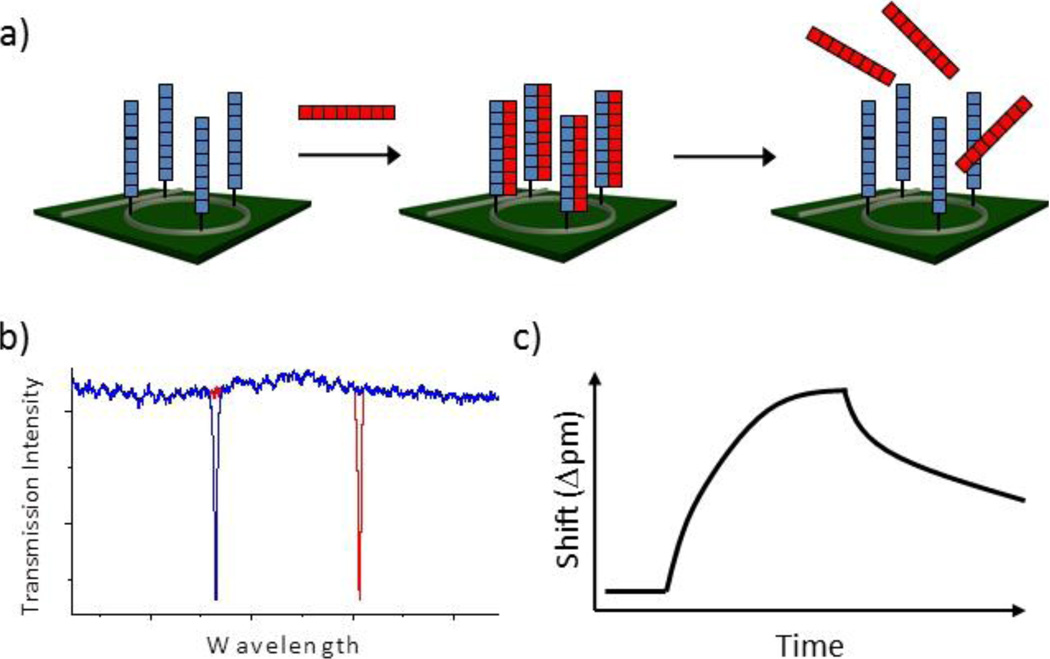
where m is an integer value, λ is the wavelength, r is the radius of the resonant cavity, and neff is the effective refractive index of the optical mode. Therefore, the resonance wavelengths shift to longer or shorter values as molecular binding or unbinding, respectively, modulates the local refractive index, as shown in Scheme 1.
Scheme 1.
a) Microring resonators presenting single-stranded DNA capture probes can be used to detect the hybridization of complementary target probes and dissociation of the resulting duplex can be used to identify single nucleotide sequence mismatches. b) The wavelength of optical resonances supported by microrings is responsive to hybridization and duplex melting events. c) Shifts in resonance wavelength are measured in real-time, allowing access to binding and unbinding kinetics, which are used both for quantitation and SNP identification.
On account of their scalable and cost-effective fabrication via commercially validated semiconductor processing methods, microring resonators are particularly well-suited for high volume, multiplexed diagnostic applications. We have recently developed a versatile biosensing platform in which an array of silicon-on-insulator microring resonators can be simultaneously interrogated in near real time, and have demonstrated the ability to quantitatively a range of biomolecular targets in both single16,18 and multiplexed formats.17,19
In this paper, we report the rapid and label-free detection of DNA down to a detection limit of 195 femtomoles (1.95 nM) utilizing arrays of silicon photonic microring resonators. More importantly, we show the ability to distinguish single nucleotide polymorphisms by monitoring in real-time the desorption rates of mismatch DNA from the sensor surfaces. By leveraging the multiplexed nature of our sensing platform, we can screen multiple DNA interactions simultaneously, allowing for a high-throughput method of SNP identification. The rapid time-to-result and intrinsic scalability of this semiconductor-based platform makes it a promising technology for sensitive and specific detection of DNA.
EXPERIMENTAL
Materials
All synthetic DNA probes were obtained from Integrated DNA Technologies. DNA capture probes were HPLC purified and target sequences were desalted. DNA capture probes contained a C12 linker and a randomly generated 18-mer DNA sequence to act as a spacer between the recognition sequence and the sensor surface. Phosphate buffered saline (PBS), with a standard 10 mM phosphate ion concentration, was reconstituted from Dulbecco’s phosphate buffered saline packets purchased from Sigma-Aldrich (St. Louis, MO) and adjusted to pH 7.4.
Fabrication of Silicon Photonic Microring Resonators and Measurement Instrumentation
Details on the fabrication of the sensor arrays and measurement instrumentation, from Genalyte, Inc., have been previously described.16,20 Briefly, the 6 × 6 mm sensor substrates contained 32 uniquely addressable microrings that were thirty micrometers in diameter. The sensor array was assembled into flow chamber with two ~1.5 µL microfluidic channels. All measurements were made at room temperature (~25°C).
Chemical and Biochemical Functionalization of Sensor Surfaces
Sensor chips were first immersed in Piranha solution (3:1 solution of 16 M H2SO4:30% wt H2O2) for 1 min and subsequently rinsed copiously with Millipore H2O. (Caution: Piranha solutions are extremely hazardous and can explode in contact with trace amounts of organics!) A solution of 1 µg/mL of 3-N-((6-(N′-Isopropylidene-hydrazino))nicotinamide)propyltriethoxysilane (HyNic Silane, Solulink Inc.) in 100% EtOH was introduced to the sensor surface at a flow rate of 10 µL/min for 90 min. The sensors were subsequently rinsed with 100% ethanol to remove any residual HyNic Silane not covalently bound to the surface. The deposition of the HyNic Silane was monitored in real-time, and is shown in Figure S1.
The DNA capture sequences were buffer exchanged in PBS using a Vivaspin 500, 5000 MWCO (Sartorius) spin column. The solution was centrifuged three times at 10000 rpm to remove any residual ammonium acetate present in the sample that would interfere with subsequent conjugation steps. The 5′-aminated DNA capture strands were treated with succinimidyl 4-formylbenzoate (S-4FB, Solulink, Inc.) with at least a 4-fold molar excess. The DNA capture strands and S-4FB were allowed to react overnight, after which the solution was centrifuged three times in 5000 MWCO spin columns at 10000 rpm to remove any residual S-4FB that did not react with the capture probes. The S-4FB modified ssDNA capture probes were flowed across the sensor surface, where they were covalently attached only to areas immediately surrounding and including microrings, with the rest of the substrate masked by an inert cladding layer. The covalent attachment of the DNA capture probes was monitored in real-time to ensure covalent attachment to the sensor surface, as shown in Figure S2.
DNA Detection and Surface Regeneration
All synthetic DNA targets (sequences listed in Table S1) were suspended in PBS. The concentration of the target DNA solutions were verified using a NanoDrop 1000 UV-Vis spectrometer (Thermo Scientific). Solutions containing the DNA target of interest were flowed across the sensor surface for 10 min at 10 µL/min. The sensors were subsequently rinsed with PBS to ensure hybridization of the target probe. In order to regenerate the sensors for further experiments, the surface was exposed to 8 M Urea for 90 min at a flow rate of 10 µL/min. The surface was subsequently rinsed with Millipore H2O for at least 30 min at a flow rate of 10 µL/min, after which the sensors could be used for further experiments. As shown in Figures S3 and S4, repeated regeneration cycles do not significantly affect signal response.
Non-Complementary Sequence Specificity
To evaluate the specificity of the sensors towards the hybridization of non-complementary sequences, a single sensor chip was functionalized with two ssDNA capture probes, A and B (Table S1). The entire sensor surface was initially exposed to a 1 µM solution of A′ (the target probe complementary to A), followed by a quick rinse with PBS and then a 1 µM solution of B′ (the target probe complementary to B). The results, shown in Figure S5, demonstrate no appreciable cross-reactivity between the two sequences.
Detection of a single Single Nucleotide Polymorphism
Microrings were functionalized with ssDNA Capture Probe A and subsequently exposed to solutions containing either the complementary ssDNA Sequence A′ or single-base mismatch DNA sequence (Table S2) for 20 min at a flow rate of 20 µL/min. While continuously measuring the relative shifts in resonance wavelength, the sensor was then rinsed with PBS for 30 min at the same flow rate, during which the desorption of the target sequences were observed.
Multiplexed Detection and Identification of Single Nucleotide Polymorphisms
Microring sensors were functionalized as previously mentioned, with the exception that S-4FB modified ssDNA capture probes for each of the 4 possible DNA targets (Table S3 and Table S4) were hand-spotted onto a single sensor chip and allowed to incubate overnight. A 1 µM solution of each target DNA sequence in PBS was flowed across the sensor surface for 20 min at a rate of 30 µL/min. The sensors were subsequently exposed to a solution of PBS for 30 min, at a flow rate of 30 µL/min, and finally regenerated for further experiments as described above. The results of these experiments are summarized in Figure S6 and Figure S7, while the normalized desorption responses are shown in Figure 3 and Figure S8. Experimental parameters for detecting SNP heterozygotes were identical, except that the target solution contained two target probes, each at a concentration of 1 µM. The results of these experiments are summarized in Figure S10, Tables S13, and Table S14.
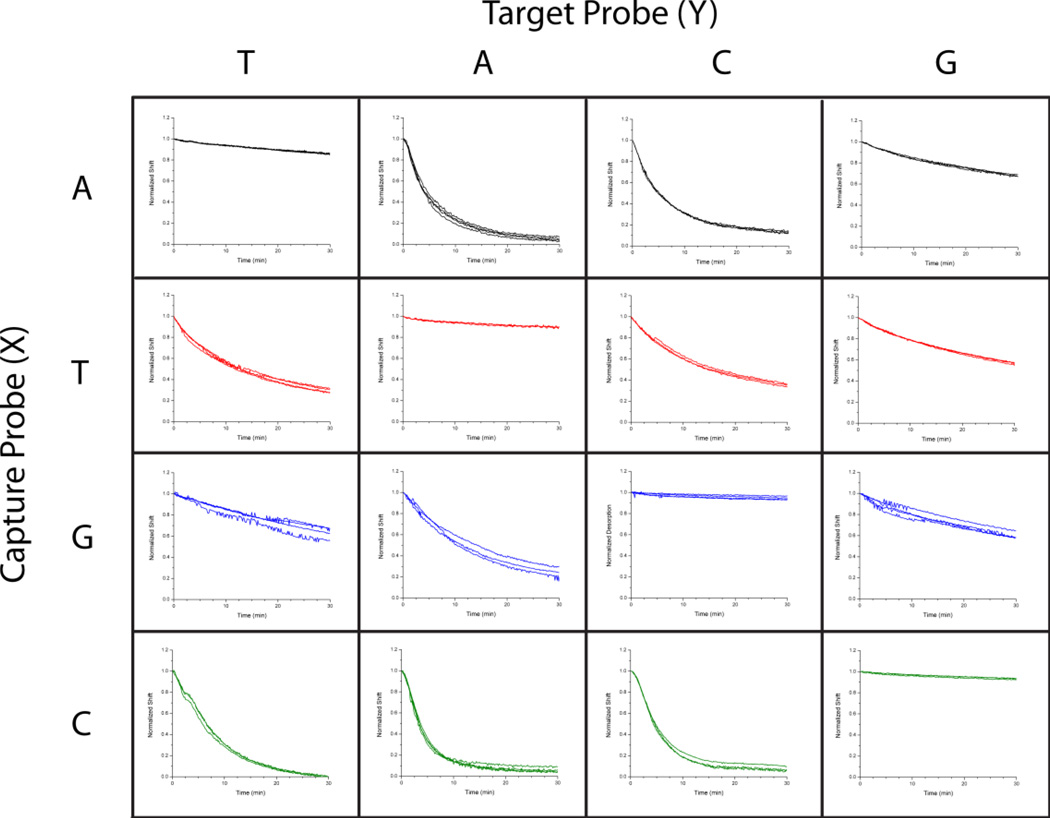
Figure 3.
Using an array of differentially functionalized microrings, the identity of a particular SNP can be determined. Microrings were uniquely functionalized with one of four capture strands, each varying by only a single nucleotide at the same position within the sequence. Four different target sequences, each perfectly complementary to only one of the arrayed capture strands, were then individually flowed across the array and the desorption response monitored. In each case, the perfectly complementary interactions were observed as the slowest desorption rates within the column. By using an array of microring resonators it is therefore easy to not only establish that there is a SNP, but also precisely determine the identity of the mismatched nucleotide.
Determination of DNA Melting Temperatures
Prior to measurements, the concentrations of total DNA solutions were adjusted to 4 µM. All probes were annealed by heating to 95°C followed by cooling at 10°C prior to absorbance measurements. The absorbance of every capture and target probe combination, summarized in Tables S3 and S4, were measured at λ = 260 nm as a function of temperature with a UV-2561 PC UV Recording Spectrometer (Shimadzu). Absorbance readings were taken at every ~0.5°C from 10°C to 95°C, with 1 min stabilization periods between temperatures. From each of the spectra (Figure S8 and Figure S9), the Tm of each target sequence towards each capture probe was determined using LabSolutions – Tm Analysis software, and are summarized in Tables S10 and S12.
Data Processing
All data was corrected for temperature drift by subtracting relative shifts from a series of reference microrings that were not exposed to solution. Any linear instrumental drift was corrected for by subtracting linear fits from data points collected in PBS. All data was fitted and graphed using OriginPro8 (OriginLab Corporation). To calculate the initial slope of the DNA binding, we used a modified 1:1 Langmuir Binding Isotherm, as described by:
To determine the initial slope of the binding response, the first derivative of the previous equation was evaluated at t = t0, yielding:
For concentrations greater than 15.6 nM, the first 10 min of the sensor response was fit to the Langmuir binding isotherm, prior to taking the derivative of the function. At concentrations 15.6 nM or lower, a linear fit over the initial 10 min was sufficient. The data used in the fitting of the adsorption-hybrdization responses is compiled in Tables S5–S7.
To determine the desorption rates, the sensor response over 30 min were fit to:
where A represents the maximum response of the microring during adsorption-hybridization and B is the desorption rate, kd. The parameters used in fitting desorption rates can be in found in Tables S9 and S11, and are summarized in Tables S10 and S12 respectively.
For illustrative purposes, the desorption responses of the microrings in Figure 2, Figure 3, and Figure S8 were normalized at the point at which the solution was switched back to PBS .
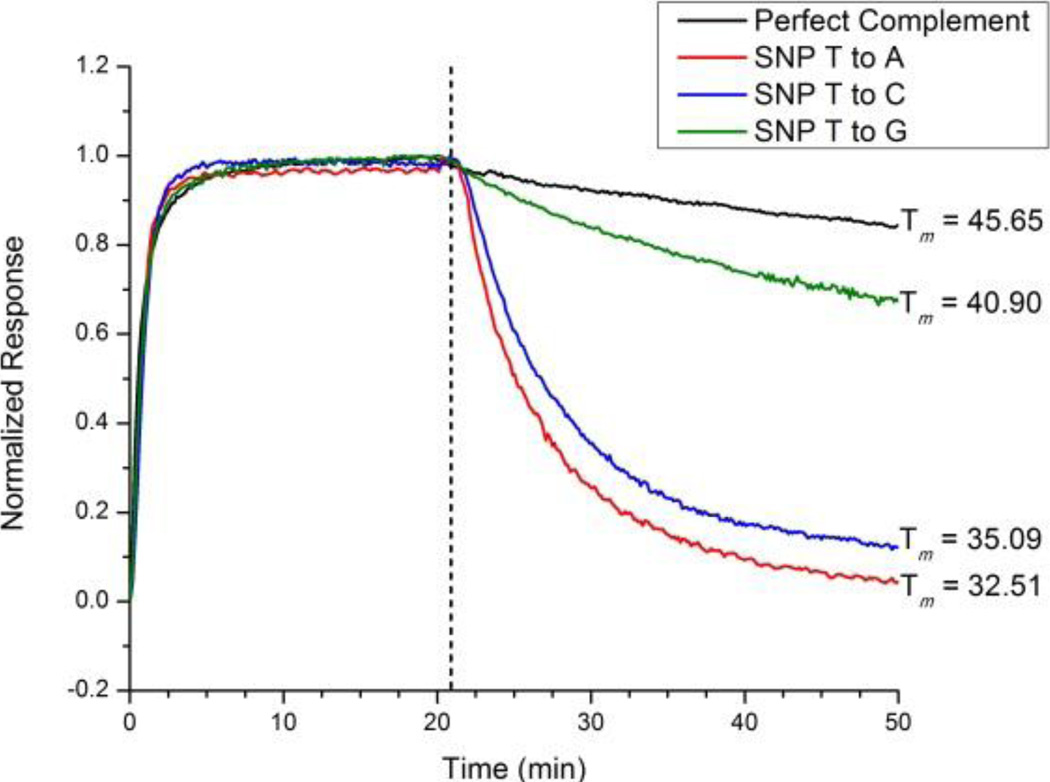
Figure 2.
Normalized hybridization and desorption responses of a single microring to sequence A′ and the three possible SNPs at position 8. At t ~ 20 min the solution was switched to pure buffer. Although differences in strand hybridization rate are difficult to distinguish, the rate of desorption clearly reveals the perfect complement from the mismatched sequences. Furthermore, the order of desorption rates is correlated with duplex stability, as determined by measuring melting temperatures.
RESULTS AND DISCUSSION
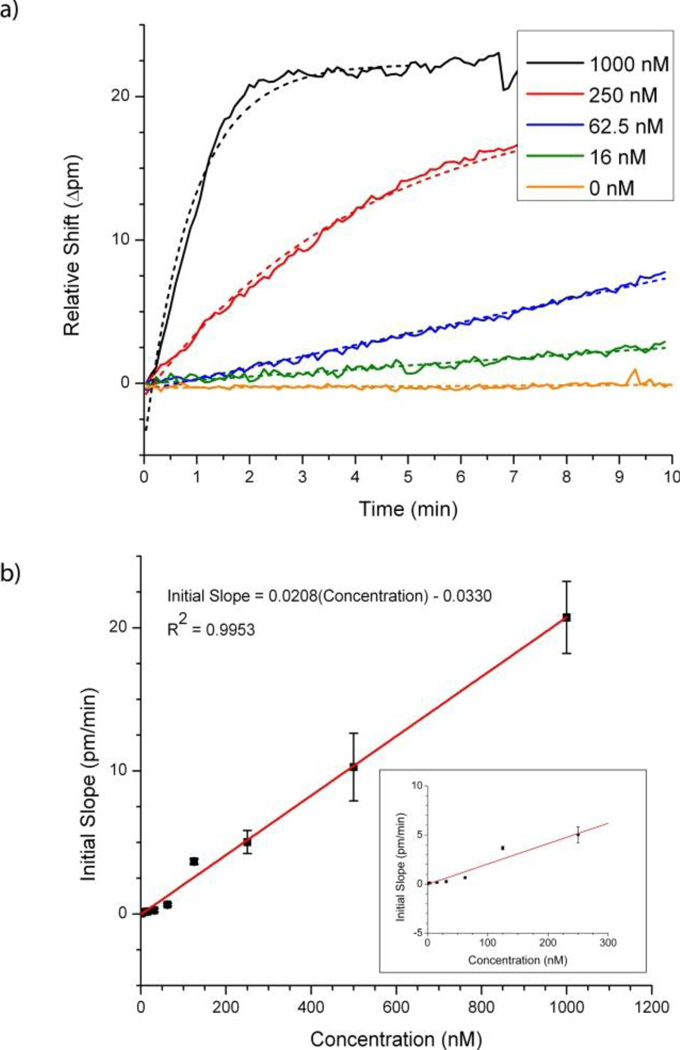
To validate the applicability of the microring resonator platform for DNA detection, an array of microrings was covalently modified with a single 5′-aminated DNA capture probe (strand A). Solutions containing a 15-mer complement (strand A′) over a concentration range from 1 µM to 1.95 nM were then flowed across the entire array. As shown in Figure 1a, upon hybridization, the resonance wavelengths of the microrings shifted to longer wavelength, and the amount of shift was a function of DNA target concentration. Following hybridization, an 8 M aqueous solution of urea, a chaotropic reagent that destabilizes the hydrogen bonding networks of DNA duplexes, was flowed across the sensor chip in order to release the target probe and regenerate the surface. Repeated exposures to the same concentration showed no loss of device performance, indicating complete regeneration as well as the robust nature of the sensing platform (Figures S3 and S4).
Figure 1.
a) Overlay of the resonance wavelength shifts of a representative microring to several concentrations of target DNA. The dotted lines indicate the functions fit to the initial binding response from which the initial slope of the sensors was determined via differentiation. b) The plot of sensor initial slope versus target concentration yields a response relationship that is linear over an ~3 order of magnitude dynamic range. The inset is an expanded version of the same plot showing the lower concentration range.
To demonstrate the quantitative utility of the platform for DNA concentration determination, we constructed a sensor calibration plot based upon the data in Figure 1a. Since we are interested in minimizing assay time, we employed an analysis method in which we use the initial slopes of the sensor response, as opposed to saturation or fixed time point shifts, as the sensor output.16,19 To determine the sensor slope, the real-time target binding data is fit with an exponential function, and the derivative determined at time zero. A plot of sensor initial slope versus concentration, Figure 1b, yields a linear calibration curve, which is convenient not only from the standpoint of quantitation, but also suggests that analyses can be achieved at very short assay times, since the slope above background is determined within the first ten minutes of hybridization. Using this approach, we demonstrated a detection limit of 1.95 nM, which corresponds to only 195 fmol of target DNA given the 100 µL sample volume of analysis. This detection limit is comparable to those reported using surface plasmon resonance in a direct hybridization format.21–23 Nonetheless, we are currently investigating methods to improve the limit of detection, which include enzymatic amplification strategies24 as well as improved microfluidic sample delivery that will allow for further reduced sample volumes.
While there are certainly instances where ultimate sensitivity is important, the widespread use of the polymerase chain reaction (PCR) prior to analysis via hybridization has lessened the significance of extremely low DNA detection limits for many applications. Given this, sequence specificity is perhaps the most important attribute to design into emerging DNA analysis technologies. Target specificity is of particular concern when using label-free techniques since only a single analyte recognition event is responsible for the observed response. In contrast, sandwich-type assays require two target-specific recognition events for detection. We first evaluated specificity of our microring resonator platform by functionalizing portions of the sensor array with two unique capture probes, strands A and B, and find that there was absolutely no cross reactivity between their completely non-complementary 15-mer target sequences (Figure S5).
However, a much more important and clinically-relevant challenge is the discrimination of SNPs. A common approach to SNP discrimination relies upon determining the relative amount of bound target DNA when measured at different temperatures.25–29 Since imperfect duplexes are energetically less stable than perfectly complementary duplexes, SNPs can be thermally dissociated (melted) at lower temperatures. Increasing the temperature across the duplex melting temperature, Tm, allows SNPs to be resolved due the differential amount of hybridized probe at equilibrium. Differences in Tm can be further resolved by either the addition of chaotropric reagents or by engineering constructs which take advantage of collective melting effects.30 Another approach to discriminating between SNPs involves enzymatic recognition of duplex mismatches. Enzymatic processes can be extremely selective, but biases towards particular sequences limit the generality of these methods.31–33
As an alternative to equilibrium-based measurements, we reasoned that differences in the energetic stability of perfectly and imperfectly paired strands would be evident in the duplex interaction kinetics. Given our access to real-time interaction data, we felt that a kinetic-based assay would be advantageous since it does not require changing the temperature and also eliminates the need for any additional chemical or biochemical reagents. Previously, Suter and co-workers showed an ability to discriminate between multiple base mismatches on the basis of differential adsorption rates between a capture probe and a solution phase target.15 However, the rate of adsorption onto a surface depends both upon the on “rate,” kon, and well as the concentration of analyte in solution, among other factors such as diffusion. Therefore, in order to rigorously discriminate SNPs, the exact target concentration needs to be known and held constant across multiple analyses—simultaneous concentration and sequence determination cannot be accomplished. By contrast, the rate at which a species desorbs from the surface, in the absence of additional target, depends solely on the dissociation rate constant, koff, with no dependence upon concentration.34 Dissociation rate constants have previously been used to assess the specificity of DNA duplexes, but in this report koff was calculated from a series of equilibrium measurements made sequentially at different temperatures.35
To test the premise that desorption rate can be directly measured using microring resonators and used to determine the complementarity of the hybridized duplex via measurements made only at a single temperature, we flowed a room temperature solution of strand A′ as well as solutions containing the three possible SNPs at nucleotide position 8 (from the 5′ end of the target strands) over a microring functionalized with strand A. Clearly the length of the sequence and position of the SNP within the sequence will affect the relative stability of the resulting mismatched duplexes. Only a single sequence length and SNP position, in the center of the duplex, were investigated herein to establish the feasibility of kinetic desorption based discrimination. Further design and optimization would be required for a more diverse set of SNP sequences. Figure 2 shows the normalized association and dissociation responses of both the perfectly complementary strand A′ as well as 3 different SNP sequences. While there is only a slight difference in the adsorption of the sequences, which again is concentration dependent, a clear difference is observed in the rate of strand desorption after returning the solution to pure buffer (no DNA). Furthermore, beyond simply discriminating between perfectly and imperfectly paired sequences, visual inspection reveals that the desorption rates track with the measured duplex melting temperatures, with faster dissociations observed for lower Tms.
The relative desorption rates of each of the SNP sequences can be justified given the structures of each of the mismatches. The perfectly complementary sequence A′ contains a thymidine at position 8 (from the 5′ end of the target strand), forming two hydrogen-bonds with the adenosine of the DNA capture probe. The SNPs containing adenosine and cytosine at the same position, which have the fastest desorption rates, can only form a single hydrogen-bond with the adenosine on the capture probe, resulting in their decreased stability. Furthermore, the SNP containing adenine is slightly less stable than the duplex with a cytosine due to sterically repulsive purine-purine base pairing. By comparison, the SNP containing guanosine, which has the slowest desorption rate of the SNP sequences, can still form two hydrogen bonds with adenine; however purine-purine basepairing still destabilizes the duplex over the perfectly complementary sequence.
As a demonstration of the platform’s ability to rapidly screen and identify SNPs, we functionalized a single sensor chip with four separate ssDNA capture probes, each varying by a single nucleotide at position 8 (from the 3′ end of the capture strand). The perfect complement to each of the capture probes was flowed across the entire sensor surface sequentially and the desorption rates measured for every combination of capture probe and target DNA. Figure 3 shows the normalized desorption response for each combination, with each column representing a single hybridization/desorption cycle on the array of microring resonators. Each column in the figure represents a single target strand flowed across the entire array, which has complementary strands varying by only a single nucleotide. By comparing the differential desorption rates of a single target sequence from the entire array of microrings, each presenting a different sequence that is perfectly complementary to one of the possible SNPs, we can rapidly identify the perfect complementary pair as the slowest desorption rate in each column.
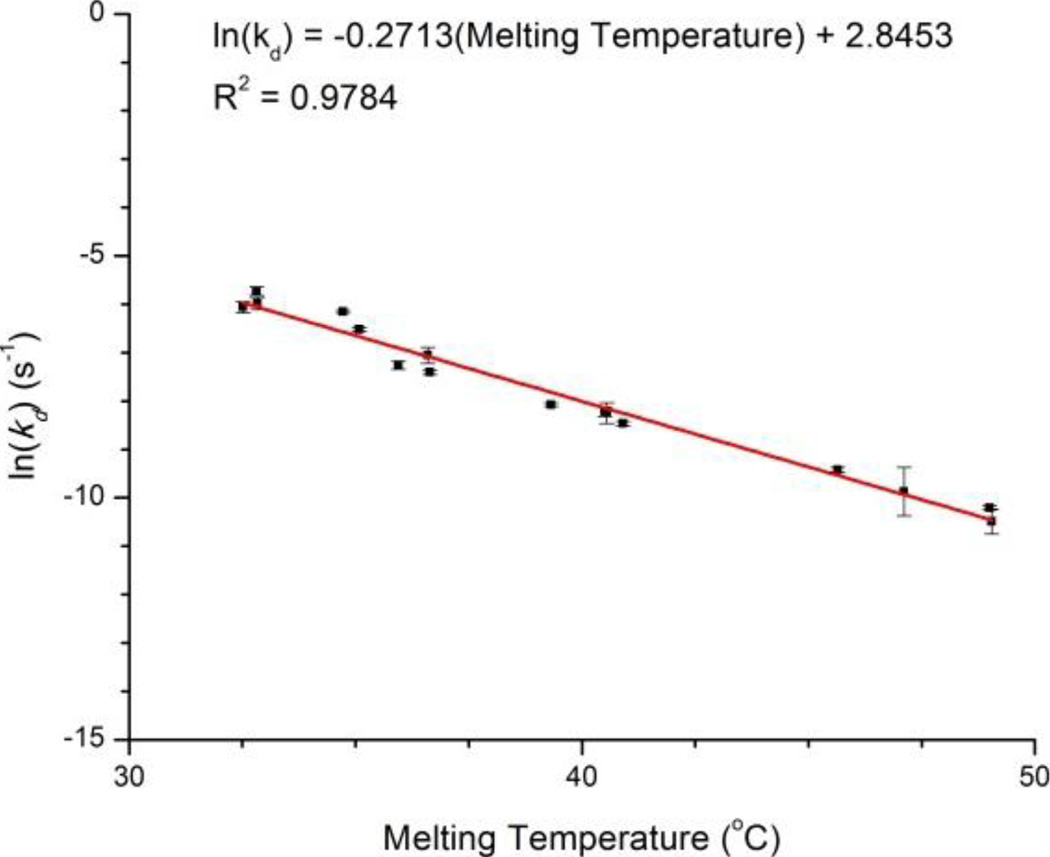
In order to provide a more quantitative framework to rationalize these observations, we empirically determined the melting temperatures for each of the sixteen pairwise interactions interrogated in Figure 3. Importantly, Tm is a good estimate for relative duplex stability that can easily be determined by simply measuring the UV absorbance at 260 nm as a function of temperature, with the absorbance increasing upon duplex dissociation.36 We then plotted the natural logarithm of the measured desorption rate versus Tm, which is a proxy for duplex stability, and found a linear dependence, consistent with the Arrhenius equation, as shown in Figure 4. While melting temperatures provide a convenient and widely accessible method to visualize this effect, future efforts will incorporate more rigorous studies of duplex thermodynamics involving isothermal titration calorimetry.37,38
Figure 4.
The natural log of desorption rates demonstrate a strong correlation with empirically determined solution phase duplex melting temperatures.
To further demonstrate the utility of this approach, we repeated the SNP screening experiment above utilizing a series of DNA capture and target probes with increased G-C content, as described in Table S4. The increased G-C content of these probe sets globally increases the Tm for all duplexes (both perfectly complementary and SNP duplexes), significantly complicating the observation of strand desorption at room temperature. However, we were able to isothermally observe differential melting of perfectly complementary and SNP duplexes by the simple addition of 10% formamide to the PBS buffer. Formamide is a commonly utilized chaotropic reagent that destabilizes base pairing interactions due to competitive hydrogen bonding, effectively lowering the melting temperature of all duplexes. By utilizing this higher stringency buffer during desorption measurements we were able to again identify SNP sequences, with the slowest rates of dissociation for a given probe strand always corresponding to the perfectly complementary duplex as seen in Figures S7 (and summarized in Tables S11 and S12).
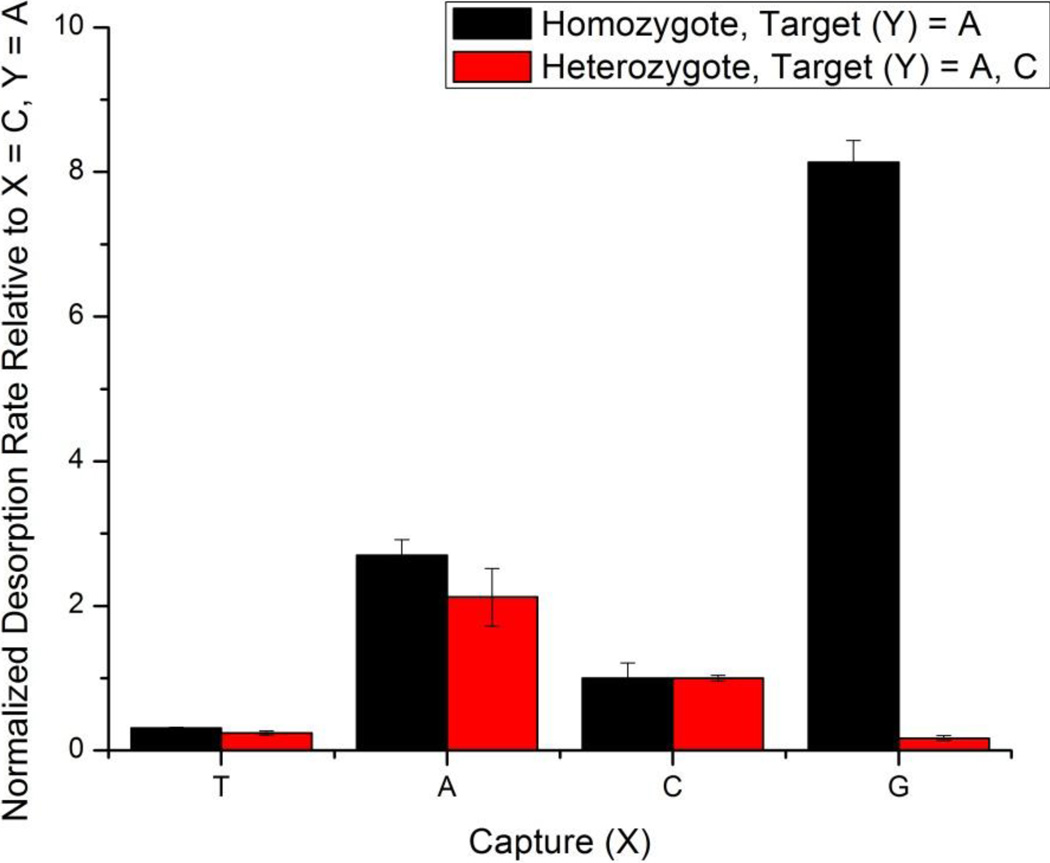
Another important area in the detection of SNPs is the ability to detect heterozygotes, where one allele carries a SNP not present in the other allele. In this case, both copies of the allele would be present within the same genomic sample, meaning that there would be two gene sequences that differ by only a single nucleotide. To demonstrate this capability, we functionalized a single sensor chip with four capture probes as in Figure 3. However, instead of flowing a single target DNA across the sensor surface, we flowed two target sequences simultaneously (both at the same concentration) to simulate the presence of a heterozygote allele. In this case there are two perfectly complementary capture probes on the sensor array and both alleles were clearly identified by the two slowest desorption rates, as shown in Figure 5, as opposed to the homozygous sample which has only a single complementary duplex combination. The relative desorption rates of the two capture sequences that are mismatched to both allele combinations remain similar in magnitude; however the capture probe presenting the guanine shows a dramatic lowering of the desorption rate for the simulated heterozygous allele, as it is now perfectly complementary to the cytosine-containing target probe. The ability to detect multiple SNP sequences is a distinct advantage of the array-based microring resonator platform as many different capture strands can be arrayed onto the multiplexable sensor chip with only 4N sensors needed to definitively identify N SNPs from within a sample.
Figure 5.
Comparison of the desorption rates in which a single target probe is flowed across the sensor surface (simulating a homozygous allele) with two target probes (simulating a heterozygote allele). Upon additional of a second DNA target probe in the heterozygote experiment (Y = C), the desorption rate for the duplexes formed with the X = G capture probe drastically decreases, consistent with the observation that perfectly complementary duplexes have relatively low desorption rates. The X = T capture probe has its respective target in both the homozygote and heterozygote case, and thus does not change significantly. Each of the respective experiments were normalized relative towards the desorption rate of the X = C, Y = A duplex, a non-perfectly complementary pair for both simulated alleles.
CONCLUSIONS
In this manuscript, we have demonstrated the label-free detection of DNA utilizing arrays of silicon photonic microring resonators down to a limit of detection of 195 femtomoles (1.95 nM). Additionally, by taking advantage of the modular multiplexing capability of the platform we show the ability to distinguish between and even determine the identity of SNPs based upon the relative rates of desorption as measured isothermally and in real-time. We have shown that this method can be applied to sequences with higher melting temperatures by incorporating probes with increased G-C content and demonstrate that this approach is well-suited for detecting heterozygote SNP alleles as well. While this proof-of-principle demonstration utilized short synthetic oligonucleotides, this methodology could translate to longer sequences by performing the dissociation analysis under conditions that uniformly destabilize duplex interactions, such as a static elevated temperature or in the presence of a low concentration of a chaotropic agent. Finally, we believe that the ability to simultaneously provide both quantitative information on target concentration and sequence specificity in a highly multiplexable assay format make this an attractive methodology for a range of existing and emerging DNA analysis challenges.
Supplementary Material
Acknowledgement
The authors thank the National Institutes of Health (NIH) New Innovator Award Program, part of the NIH Roadmap for Medical Research, through grant number 1-DP2-OD002109-01, the Camille and Henry Dreyfus Foundation, and the Eastman Chemical Company (fellowship to AJQ), for their financial support of this work. The authors also thank Mr. Chun-Ho Wong for assistance in determining the melting temperatures of DNA duplexes.
Footnotes
Supporting Information Available: Experimental details including nucleic acid preparation, fabrication of sensors, measurement instrumentation, chemical and biochemical functionalization of sensors, DNA detection and surface regeneration, detection of SNPs, multiplexed detection of SNPs, non-complementary sequence specificity, determination of melting temperatures, detection of SNP heterozygotes and data analysis. This material is available free of charge via the Internet at http://pubs.acs.org.
References
- 1.Ferguson JA, Boles TC, Adams CP, Walt DR. Nature Biotech. 1996;14:1681. doi: 10.1038/nbt1296-1681. [DOI] [PubMed] [Google Scholar]
- 2.Lockhart DJ, Winzeler EA. Nature. 2000;405:827. doi: 10.1038/35015701. [DOI] [PubMed] [Google Scholar]
- 3.Giljohann DA, Mirkin CA. Nature. 2009;462:461. doi: 10.1038/nature08605. [DOI] [PMC free article] [PubMed] [Google Scholar]
- 4.Ge J, Budowle B, Planz J, Chakraborty R. Int. J. Legal Med. 2010;124:353. doi: 10.1007/s00414-009-0400-5. [DOI] [PubMed] [Google Scholar]
- 5.Gill P. Int. J. Legal Med. 2001;114:204. doi: 10.1007/s004149900117. [DOI] [PubMed] [Google Scholar]
- 6.Ramsay G. Nature Biotechnology. 1998;16:40. doi: 10.1038/nbt0198-40. [DOI] [PubMed] [Google Scholar]
- 7.Syvanen A-C. Nat Rev Genet. 2001;2:930. doi: 10.1038/35103535. [DOI] [PubMed] [Google Scholar]
- 8.Roses AD. Nature. 2000;405:857. doi: 10.1038/35015728. [DOI] [PubMed] [Google Scholar]
- 9.Qavi AJ, Washburn AL, Byeon JY, Bailey RC. Anal. Bioanal. Chem. 2009;394:121. doi: 10.1007/s00216-009-2637-8. [DOI] [PMC free article] [PubMed] [Google Scholar]
- 10.Vollmer F, Arnold S. Nature Methods. 2008;5:591. doi: 10.1038/nmeth.1221. [DOI] [PubMed] [Google Scholar]
- 11.Zhu HY, Suter JD, White IM, Fan XD. Sensors. 2006;6:785. [Google Scholar]
- 12.Ren HC, Vollmer F, Arnold S, Libchaber A. Optics Express. 2007;15:17410. doi: 10.1364/oe.15.017410. [DOI] [PubMed] [Google Scholar]
- 13.Armani AM, Kulkarni RP, Fraser SE, Flagan RC, Vahala KJ. Science. 2007;317:783. doi: 10.1126/science.1145002. [DOI] [PubMed] [Google Scholar]
- 14.Zhu HY, White IM, Suter JD, Dale PS, Fan XD. Optics Express. 2007;15:9139. doi: 10.1364/oe.15.009139. [DOI] [PubMed] [Google Scholar]
- 15.Suter JD, White IM, Zhu HY, Shi HD, Caldwell CW, Fan XD. Biosensors & Bioelectronics. 2008;23:1003. doi: 10.1016/j.bios.2007.10.005. [DOI] [PubMed] [Google Scholar]
- 16.Washburn AL, Gunn LC, Bailey RC. Analytical Chemistry. 2009;81:9499. doi: 10.1021/ac902006p. [DOI] [PMC free article] [PubMed] [Google Scholar]
- 17.Washburn AL, Luchansky MS, Bowman AL, Bailey RC. Analytical Chemistry. 2009;82:69. doi: 10.1021/ac902451b. [DOI] [PMC free article] [PubMed] [Google Scholar]
- 18.Luchansky MS, Bailey RC. Analytical Chemistry. 2010;82:1975. doi: 10.1021/ac902725q. [DOI] [PMC free article] [PubMed] [Google Scholar]
- 19.Qavi AJ, Bailey RC. Angewandte Chemie Intl. Ed. 2010;49:4608. doi: 10.1002/anie.201001712. [DOI] [PMC free article] [PubMed] [Google Scholar]
- 20.Iqbal M, Gleeson MA, Spaugh B, Tybor F, Gunn WG, Hochberg M, Baehr-Jones T, Bailey RC, Gunn LC. IEEE J. Sel. Topics Quantum Electron. 2010;16:654. [Google Scholar]
- 21.Guedon P, Livache T, Martin F, Lesbre F, Roget A, Bidan G, Levy Y. Analytical Chemistry. 2000;72:6003. doi: 10.1021/ac000122+. [DOI] [PubMed] [Google Scholar]
- 22.Nelson BP, Grimsrud TE, Liles MR, Goodman RM, Corn RM. Analytical Chemistry. 2000;73:1. doi: 10.1021/ac0010431. [DOI] [PubMed] [Google Scholar]
- 23.Okumura A, Sato Y, Kyo M, Kawaguchi H. Analytical Biochemistry. 2005;339:328. doi: 10.1016/j.ab.2005.01.017. [DOI] [PubMed] [Google Scholar]
- 24.Lee HJ, Li Y, Wark AW, Corn RM. Analytical Chemistry. 2005;77:5096. doi: 10.1021/ac050815w. [DOI] [PubMed] [Google Scholar]
- 25.Howell WM, Jobs M, Gyllensten U, Brookes AJ. Nature Biotechnology. 1999;17:87. doi: 10.1038/5270. [DOI] [PubMed] [Google Scholar]
- 26.Prince JA, Feuk L, Howell WM, Jobs M, Emahazion T, Blennow K, Brookes AJ. Genome Res. 2001;11:152. doi: 10.1101/gr.150201. [DOI] [PMC free article] [PubMed] [Google Scholar]
- 27.Jobs M, Howell WM, Stromqvist L, Mayr T, Brookes AJ. Genome Res. 2003;13:916. doi: 10.1101/gr.801103. [DOI] [PMC free article] [PubMed] [Google Scholar]
- 28.Urakawa H, Noble PA, El Fantroussi S, Kelly JJ, Stahl DA. Applied and Environmental Microbiology. 2002;68:235. doi: 10.1128/AEM.68.1.235-244.2002. [DOI] [PMC free article] [PubMed] [Google Scholar]
- 29.Urakawa H, El Fantroussi S, Smidt H, Smoot JC, Tribou EH, Kelly JJ, Noble PA, Stahl DA. Applied and Environmental Microbiology. 2003;69:2848. doi: 10.1128/AEM.69.5.2848-2856.2003. [DOI] [PMC free article] [PubMed] [Google Scholar]
- 30.Prigodich AE, Lee OS, Daniel WL, Seferos DS, Schatz GC, Mirkin CA. Journal of the American Chemical Society. 2010;132:10638. doi: 10.1021/ja104859j. [DOI] [PMC free article] [PubMed] [Google Scholar]
- 31.Shumaker JM, Metspalu A, Caskey CT. Human Mutation. 1996;7:346. doi: 10.1002/(SICI)1098-1004(1996)7:4<346::AID-HUMU9>3.0.CO;2-6. [DOI] [PubMed] [Google Scholar]
- 32.Pastinen T, Partanen J, Syvanen AC. Clinical Chemistry. 1996;42:1391. [PubMed] [Google Scholar]
- 33.Pack SP, Doi A, Choi YS, Kim HB, Makino K. Analytical Biochemistry. 2010;398:257. doi: 10.1016/j.ab.2009.11.014. [DOI] [PubMed] [Google Scholar]
- 34.Wegner GJ, Wark AW, Lee HJ, Codner E, Saeki T, Fang S, Corn RM. Analytical Chemistry. 2004;76:5677. doi: 10.1021/ac0494275. [DOI] [PubMed] [Google Scholar]
- 35.Wick LM, Rouillard JM, Whittam TS, Gulari E, Tiedje JM, Hashsham SA. Nucleic Acids Res. 2006;34 doi: 10.1093/nar/gnj024. [DOI] [PMC free article] [PubMed] [Google Scholar]
- 36.Doty P, Marmur J, Eigner J, Schildkraut C. Proceedings of the National Academy of Sciences of the United States of America. 1960;46:461. doi: 10.1073/pnas.46.4.461. [DOI] [PMC free article] [PubMed] [Google Scholar]
- 37.Freire E, Mayorga OL, Straume M. Anal Chem. 1990;62:A950. [Google Scholar]
- 38.Schwarz FP, Robinson S, Butler JM. Nucleic Acids Res. 1999;27:4792. doi: 10.1093/nar/27.24.4792. [DOI] [PMC free article] [PubMed] [Google Scholar]
Associated Data
This section collects any data citations, data availability statements, or supplementary materials included in this article.


