

Abstract
We have previously demonstrated that melatonin, at pharmacological concentrations, causes rapid reactive oxygen species (ROS) generation at the antimycin-A sensitive site of mitochondrial complex III (MC-3). In the current work, we used this melatonin response to investigate the role of mitochondrial dysfunction in the development of diabetic nephropathy. We find that the development of diabetic nephropathy, as indicated by hyperfiltration and histopathological lesions in the kidney of db/db mice, is associated with diminished melatonin-induced ROS generation and MC-3 activity, indicating impaired MC-3 at the antimycin-A site. The MC-3 protein level in the renal mitochondria was equivalent in db/db and the non-diabetic db/m mice whereas mitochondrial complex I (MC-1) protein was dramatically upregulated in the db/db mice. This differential regulation in mitochondrial complexes may alter the equilibrium of the electron transport in renal mitochondria and contribute to ROS overproduction. The study provides one mechanism of enhanced oxidative stress that may be involved in the pathogenesis of diabetic nephropathy in db/db mice.
Keywords: melatonin, mitochondria, mitochondrial complex I and III, reactive oxygen species, glomerular filtration rate, hyperfiltration, diabetic nephropathy
Introduction
Diabetic renal disease is a complication that develops in a subpopulation of patients with long standing diabetes [1]. During the development of diabetic nephropathy in human, a series of pathophysiological changes occur in the glomeruli and tubulointerstitium, leading to hyperfiltration followed by microalbuminuria, macroalbuminuria and eventually renal failure [2,3]. In patients with type 2 diabetes, the deterioration in kidney function is associated with histopathological alterations characterized by renal hypertrophy, glomerular enlargement, mesangial matrix expansion, glomerulosclerosis, tubular atrophy, and tubulointerstitial fibrosis [4]. These pathophysiological changes may be a result of an interaction between hyperglycemia-induced metabolic and hemodynamic changes and genetic predisposition [5]. The db/db mouse (BKS.Cg-Dock7m +/+ Leprdb/J) develops hyperfiltration, albuminuria, renal hypertrophy, basement membrane thickening, glomerulosclerosis, and mesangial matrix expansion and, thus, is a useful model for investigating the pathogenesis of diabetic nephropathy [4].
Mitochondria play a central role in numerous cellular functions including bioenergetics, apoptosis, Ca2+ homeostasis, and cell metabolism. ATP synthesis by oxidative phosphorylation depends on proton gradients and membrane potentials resulting from electron transport by the mitochondrial complexes I–IV. Failure of bioenergetics and excessive formation of reactive oxygen species (ROS) have been reported in the mitochondria of diabetic heart, brain and skeletal muscles [6–8]. Mitochondrial dysfunction in diabetic cardiomyopathy is associated with alterations in both protein expression and posttranslational modifications of mitochondrial proteins [6,9,10]. However, the nature of mitochondrial dysfunction in the diabetic kidney is incompletely defined.
Morphological and ultrastructural changes of the mitochondria of proximal tubules correlate with dysregulation of renal function in diabetes [11,12]. Increased posttranslational modification of renal mitochondrial proteins through glycation [13], nitration and oxidation [14] is associated with the development of diabetic nephropathy in animal models. Moreover, glycation of mitochondrial proteins is associated with excess superoxide generation [13]. Overproduction of superoxide and/or other ROS leads to oxidative stress and represent a unifying mechanism underlying all diabetic complications including nephropathy [15]. Substantial evidence suggests that ROS generation from the mitochondrial complexes I and III is a major contributor to oxidative stress in the diabetic kidney [13,14,16]. Melatonin, a potent free radical scavenger [17,18], has beneficial effects on diabetic nephropathy [19,20] although paradoxically it also causes rapid ROS production in cells and mitochondria [21–25]; this is often observed in cancer cells.
In human mesangial cells and in isolated mitochondria, melatonin causes rapid ROS generation by interacting with the antimycin A-sensitive site of mitochondrial complex III (MC-3) [25]. Although the biological significance of melatonin-induced ROS generation is yet to be defined, the unique feature of melatonin targeting the antimycin A-sensitive site of MC-3 resulting in ROS generation provides a convenient tool to investigate the role of mitochondrial dysfunction in diabetic nephropathy. Utilizing db/db mice, a model of type 2 diabetes, we demonstrate that the development of diabetic nephropathy as indicated by persistent hyperfiltration and histopathological lesions in the kidney is associated with reduction of melatonin-induced ROS generation and MC-3 activity in the renal mitochondria. Moreover, dramatic upregulation of MC-1 but not MC-3 protein levels in the kidney of db/db mice suggests altered equilibrium among individual complexes of the electron transport chain, which may contribute to mitochondrial ROS overproduction, oxidative stress and in turn to the pathogenesis of diabetic nephropathy.
Materials and Methods
Materials
X-rhod-1 diacetate, 2′,7′-dichlorodihydrofluorescein (DCF) diacetate, monoclonal antibodies against subunit NDUFS3 of mitochondrial complex I and ubiquinol-cytochrome c reductase core protein II (complex III subunit II, clone# 13G12AF12BB11) were purchased from Invitrogen (Eugene, OR, USA). Antibody to manganese superoxide dismutase (SOD2) was from Stressgen (Brussels, Belgium). Melatonin and other chemicals were from Sigma (St Louis, MO, USA).
Measurement of ROS in isolated mitochondria
Mitochondria were isolated from whole kidney tissue of db/db (BKS.Cg-Dock7m +/+ Leprdb/J) and gender and age matched non-diabetic db/m mice (Jackson Laboratories, Bar Harbor, ME) as previously described [16]. The mitochondrial samples were suspended in 0.1–0.2 ml MB1 buffer (containing 250 mM mannitol, 75 mM succinic acid, 0.1 mM EDTA, 0.5 mM EGTA, 10 mM HEPES, pH 7.4) and diluted with 10 volumes of HK buffer (20 mM NaCl, 100 mM KCl, 1 mM CaCl2, 1 mM MgCl2, 10 mM pyruvate, 20 mM HEPES, pH 7.4) and labeled with X-rhod-1 (2 μM) and DCF (1 μM) at 37°C for 60 min. The loaded mitochondria were resuspended in 0.1–0.2 ml HK buffer and the measurement of [Ca2+]m and ROS was performed upon dilution of the labeled mitochondrial samples to PBS0Ca buffer (containing 1 mM KH2PO4, 3 mM Na2HPO4, 154 mM NaCl, 200 μM EGTA, 1mM MgSO4, pH 7.2) to a final concentration of 40–80 μg/ml mitochondrial proteins. Simultaneous detection of [Ca2+]m and ROS were performed with fluorescence excited at 506 or 578 nm and emitted at 529 or 602 nm in PTI QM-6 fluorometer, respectively. Since melatonin-induced ROS generation did not couple to [Ca2+]m and melatonin had no effect on [Ca2+]m [16], the results on [Ca2+]m measurements are omitted for simplification.
Measurement of glomerular filtration rate
Ten weeks old male db/db mice, and age and gender matched control db/+ mice were housed 4/cage or less. Prior to any experimental procedures, animals were habituated for 2 weeks and continuously maintained in a temperature- and humidity-controlled facility with a 12:12-h light-dark cycle, fed ad libitum with RD (7012 Teklad LM-485, Harlan Laboratories) and with free access to water. All procedures were performed in compliance with the guidelines of the South Texas Veterans Health Care System Institutional Animal Care and Use Committee. Blood glucose in animals was assessed with a glucometer (Accu-Chek, Roche) following 6 h of fasting and withdrawal of water. Glomerular filtration rate (GFR) in conscious animals was measured by FITC-inulin clearance following previously reported methods [26,27] with modification and calculated using the one-compartment model [27,28]. Briefly, individual mice were injected intraperitoneally with 10 mg FITC-inulin dissolved in 1 ml saline as a single bolus. In our pilot experiments, blood samples of 10 μl were collected every 10–30 min and the dynamic changes of serum FITC-inulin concentrations were monitored using a PTI QM-6 fluorometer for 4.5 hours post-injection. We found that the plasma concentration of FITC-inulin continuously increased and peaked 45–60 min post-injection. The subsequent clearances of FITC-inulin from the blood were fitted to an exponential decay and the result of a typical experiment is shown in Fig. 1. In experiments with db/db and db/m mice, blood samples of approximately 10 μl were collected by tail-snip prior to injection and 30, 60, 90, 150, 210 min following the single bolus FITC-inulin injection. Serum was collected by centrifugation at 8000 rpm for 5 min. The FITC-inulin concentrations in the serum samples were determined in a SpectroMax M2 microplate reader (Molecular Devices, Sunnyvale, CA) with excitation of 488 nm and emission of 520 nm. The GFR was calculated according to the equation , where I is the total FITC-inulin injected and values of Px and B were determined as described [27].
Fig. 1.
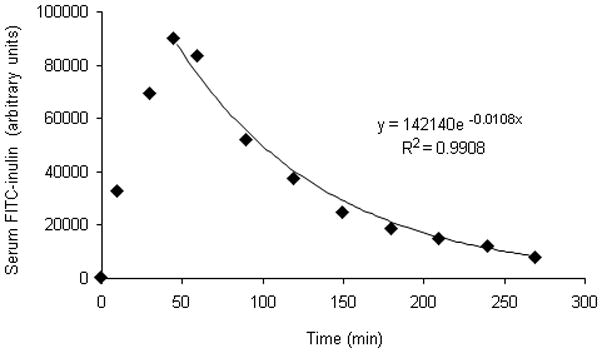
Dynamic changes of circulating FITC-inulin following single-bolus intraperitoneal injection. FITC-inulin (3 mg) dissolved in PBS 1 ml was injected intraperitoneally to C57B6 adult male mice. The changes of FITC-inulin concentrations over time were monitored in the serum. The result of a typical experiment is demonstrated in the plot and the exponential curve fitting was performed using Excel-07.
Histopathology
Formalin-fixed, paraffin-embedded kidney sections were stained with periodic acid-Schiff (PAS) and analyzed to evaluate kidney damage in a blinded manner. The volume of glomeruli and area of glomerular PAS staining (index of mesangial matrix) was measured by image analysis using Image-Pro Plus 4.5 (Media Cybernetics, Silverspring, MD) as described [29].
Assessment of protein level of mitochondrial complexes I and III
Mitochondria from the kidneys of db/db and db/m mice were isolated as previously described [17]. The mitochondrial samples (30–60 μg proteins) were separated in 4–20% gradient SDS-PAGE and analyzed by western blot to assess the protein levels of MC-1 and MC-3. The primary antibodies were diluted 1:2000 and the secondary antibodies 1:4000. Since it has previously been demonstrated that the protein level of manganese superoxide dismutase (SOD 2), which locates to the mitochondrial matrix, is equivalent in the kidneys of db/db and db/m mice [14], we used SOD 2 level to normalize and quantitatively analyze other mitochondrial proteins.
Measurement of MC-3 activity
In parallel with the measurement of [Ca2+]m and ROS, the same mitochondrial preparations were also used for MC-3 activity assessment according to the procedure previously described [14].
Statistical analysis
Results are presented as mean ± S.E. Unpaired Student’s t-test was used to analyze the difference between two groups. Differences were considered statistically significant at P < 0.05.
Results
The db/db mice are obese and develop hyperglycemia after 6 weeks of age and are widely used as a model of type 2 diabetic nephropathy [2]. As shown in figure 2, the db/db mice were hyperglycemic (Fig. 2A) and obese (Fig. 2B) although large variations in blood glucose levels were observed among individual animals. The development of diabetic nephropathy in db/db mice was indicated by hyperfiltration. Significantly increased GFR was observed in db/db mice and the high GFR persisted throughout the experimental period (Fig. 2C). Our results also indicate that the GFR in db/db mice peaks at 4 months. Furthermore, histopathology examination demonstrates glomerular hypertrophy and mesangial expansion in the kidney of db/db mice (Fig. 2D and E). The glomerular volume is 36.5% higher in the kidney of db/db (P=0.0007 db/db vs db/m, n=7) and the mesangial area as indicated by positive PAS staining in the glomeruli is significantly increased by 24.7% in db/db compared to control db/m mice (Fig. 2E).
Fig. 2.
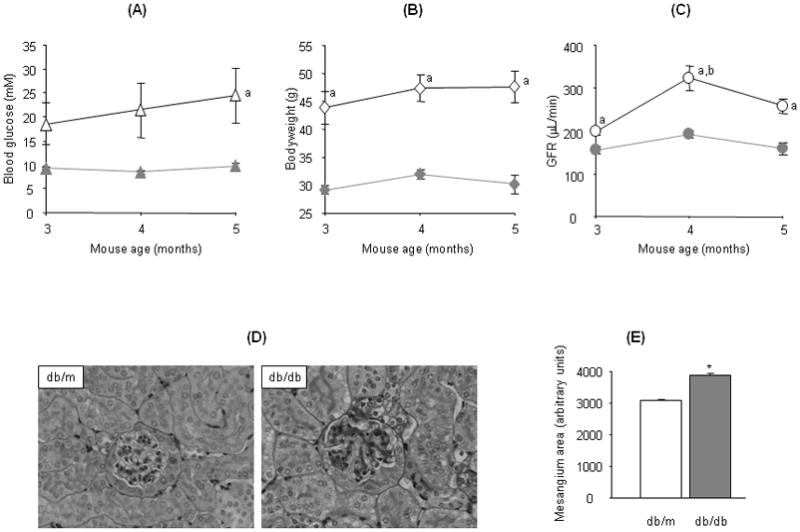
Glomerular filtration rate (GFR) and histopathology in the kidneys of db/db and db/m mice. GFR (C) in db/db (open symbols) and db/m mice (solid symbols) 3 to 5 months old was assessed to monitor kidney function along with changes in blood glucose (A) and bodyweight (B). Images in (D) are representative microphotographs of periodic acid Schiff (PAS) and hematoxylin stained kidney sections from 5 months old db/db (right panel) and db/m mice (left panel) originally taken at 200× magnification. (E) demonstrates the mesangial areas (PAS positive) measured in glomeruli of db/db and db/m mice. Values in this figure represent mean±SE from 6–8 animals: a, P<0.05 db/db vs db/m at corresponding time point; b, P<0.05 db/db mice 4 months vs 3 months; *P=0.0003 db/db vs db/m.
Melatonin has been shown to induce rapid ROS generation in isolated mitochondria dependent on the antimycin A-sensitive site of MC-3 [25]. To detect whether MC-3 dysfunction is connected with diabetic nephropathy, we compared melatonin responsive ROS generation between the kidney mitochondria of db/db and db/m mice. In association with the development of renal hyperfiltration and histopathological lesions, ROS generation in response to melatonin was dramatically reduced in the renal mitochondria of db/db mice (Fig. 3). The rates of melatonin-induced ROS generation were slower at all tested concentrations that demonstrated a measurable ROS signal (2–25 μM, Fig. 3A and B). At 25 μM, the maximum melatonin concentration tested, the rate of ROS generation was significantly slowed by >35% in db/db as compared to that of the non-diabetic db/m mice (Fig. 3C). Moreover, consistent with our previous observation [16], the rapid ROS generation in response to melatonin in both db/db and db/m mice was completely inhibited by antimycin A (5 μM) but not myxothiazol (5 μM) or rotenone (5 μM) (data not shown). The reduced rate of ROS generation in response to melatonin suggests abnormal or impaired electron transport at the antimycin A-sensitive site of MC-3 in the kidney of db/db mice.
Fig. 3.
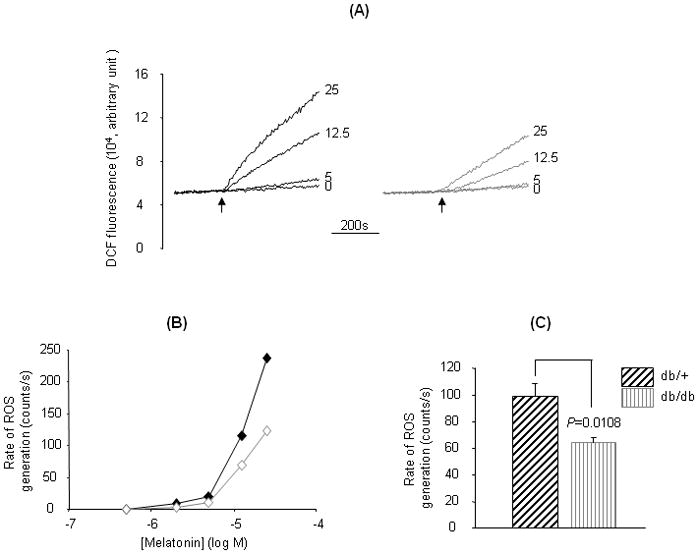
Melatonin-induced ROS generation in kidney mitochondria. Kidney mitochondria from 5-month old db/db and db/m mice were prepared and labeled with X-rhod-1 (2μM) (the data of this measurement was not shown) and DCF (1 μM) (37°C, 30 min), and melatonin-induced ROS generation was measured by increased DCF fluorescence. Traces in (A) represent typical responses of ROS generation to different concentrations of melatonin in kidney mitochondria of db/db (right panel) or db/m mice (left panel). Plots in (B) compare changes in the rate of ROS generation between db/db (open symbol) and db/m (solid symbol) mice in response to increasing melatonin concentrations from a typical experiment. Values in (C) are mean±SE rates of ROS generation in response to 25 μM melatonin. *P=0.0109 db/db vs db/m, n=8.
To determine whether the reduced melatonin responsive ROS generation is due to downregulation of MC-3 expression in the diabetic kidney, we examined the protein level and activity of MC-3 in kidney mitochondria. As shown in figure 4, there were no significant differences in the protein level of MC-3 in the kidney mitochondria between db/db and db/m mice (Fig. 4A and B). However, a significant reduction in the MC-3 activity was observed in db/db mice (Fig. 4C), indicating impaired MC-3 in the diabetic kidney. Intriguingly, the protein level of MC-1 was significantly increased in the kidney mitochondria of db/db mice (Fig. 4A and B), indicating an imbalanced regulation between different mitochondrial complexes in the diabetic kidney.
Fig. 4.
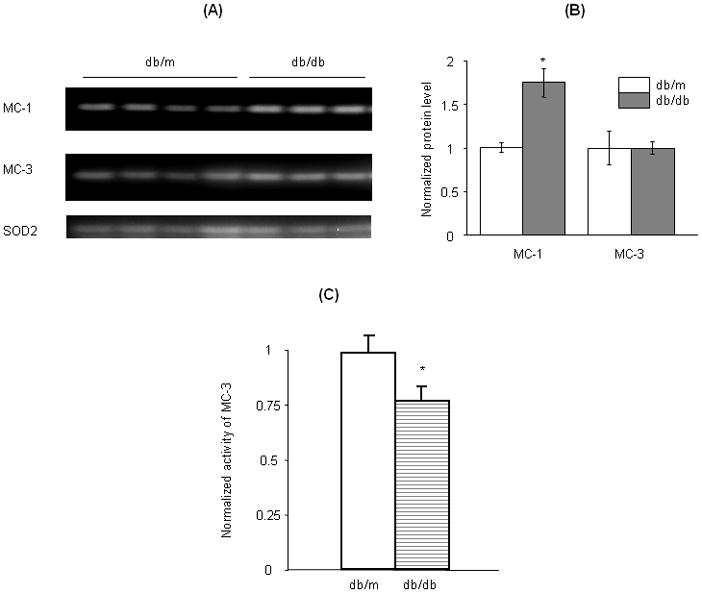
Expression of mitochondrial complexes in the kidney of db/db and db/m mice. Western blot analysis was performed to compare the protein levels of mitochondrial complexes I (MC-1) and III (MC-3) in kidneys of db/db and db/m mice (A and B). The activity of MC-3 was assessed with exogenous decylubiquinone and cytochrome C (>95% oxidized) as described (14) and the results are shown in (C). *P<0.05 db/db vs db/m.
Discussion
Consistent with previous findings (reviewed in [2]), our data demonstrate that diabetic nephropathy develops in db/db mice as indicated by persistent hyperfiltration, mesangial expansion and glomerulosclerosis (Fig. 2). The development of diabetic nephropathy is associated with impaired mitochondrial function as demonstrated by diminished melatonin responsive ROS generation and MC-3 activity. In previous studies, we showed that melatonin induces ROS generation by targeting the antimycin A-sensitive site of MC-3 in mitochondria [25]. The detailed mechanism of melatonin-induced rapid ROS formation in mitochondria is yet to be explored. Based on the constant rate of ROS generation at low concentrations of melatonin, we hypothesized that melatonin detoured the electron flow toward O2 at the antimycin A-sensitive site of MC-3 rather than functioning as an electron donor in the process of ROS generation [25]. Thus, reduced melatonin response in the kidney mitochondria of db/db mice implicates impaired electron transport at the antimycin A-sensitive site of MC-3, which is consistent with the diminished MC-3 activity in catalyzing cytochrome C reduction by exogenous ubiquinol in db/db mice despite equivalent MC-3 protein levels between db/db and db/m animals (Figs. 3 and 4).
Despite the prooxidant effect at pharmacological concentrations observed in cells and mitochondria (Fig. 3 and [25]), melatonin has consistently been shown to protect mitochondrial functions in animal models against aging and other ailments [30–32]. Injection of melatonin in rat significantly increased the activity of MC-1 and -4 in both liver and brain mitochondria although the treatment did not affect MC-2 and -3 activities [33]. A recent study from the same group demonstrated that after induction of sepsis in mice the specific activities of all mitochondrial complexes were significantly decreased in the skeletal muscle mitochondria and treatment with melatonin completely reversed the inhibitory effect of septic condition on mitochondrial complex activities [34]. The effects of melatonin on rat MC-1 and -4 correlate with melatonin concentration in the plasma [33]. These previous studies along with our observations (Fig. 3 and [25]) indicate that pharmacological concentrations of melatonin enhance electron transport in the respiratory chain and cause ROS generation at MC-3. Whether high concentrations of melatonin stimulate MC-3 activity or the induction of ROS generation by melatonin in renal mitochondria is coupled to stimulation of MC-3 activity is unclear at present and is our ongoing effort.
Our data indicate that MC-1 protein level was dramatically increased in association with diabetic nephropathy in db/db mice (Fig. 4). In the absence of a coordinated upregulation of other respiratory complexes, the marked increases of MC-1 level in the kidney of db/db mice can be detrimental as it may result in undesired accumulation of reduced coenzyme Q (ubiquinol) and increase the propensity of ROS production by MC-1 and MC-3. ROS overproduction and the resulting oxidative stress have been recognized as a unifying factor responsible for the pathogenesis of diabetic nephropathy and other vascular complications [35]. Upregulation of MC-1, but not MC-3, protein levels in the kidney mitochondria of db/db mouse indicates non-concordant regulation in the expression of individual electron transport chain components during the development of diabetic nephropathy in type 2 diabetes. Previous studies with gene profiling [36] demonstrated upregulation of the mRNA levels of various subunits of MC-1 and MC-3 although a subsequent study with proteomic analysis did not find upregulation of protein levels of most of these subunits [37]. Our results not only complement those observations, but also directly link the development of diabetic nephropathy with these mitochondrial abnormalities. The deregulation of individual protein components of the mitochondrial electron transport chain may disrupt the organization of normal and effective respiratory complexes and be responsible for ROS overproduction in diabetic nephropathy.
In the kidney of the streptozotocin (STZ)-treated rats (a type 1 diabetes model), persistent diabetes leads to mitochondrial dysfunction, including reduced O2 consumption and MC-3 activity, increased superoxide generation and protein oxidation [14,38]. The development of diabetic nephropathy in these STZ-treated animals was characterized by albuminuria, mesangial expansion and glomerulosclerosis [2]. In contrast, the major mitochondrial functions as well as the expression of a variety of mitochondrial proteins were maintained in the kidney of Insulin-2 Akita mice [39], a genetic model of type 1 diabetes which does not develop robust diabetic nephropathy [2]. These studies along with our observations implicate a potentially coordinated development of mitochondrial dysfunction and renal disease in both type 1 and 2 diabetes.
Virtually all kidney cells are vulnerable to the diabetic milieu, particularly the hyperglycemia and hyperlipidemia which cause tissue damage due to inability of the cells to control glucose uptake. Non-esterified fatty acids and other accumulated metabolites not only interrupt insulin signaling and cause insulin resistance, but also impair mitochondrial functions and lead to systemic mitochondrial defects in multiple tissues and organs, such as enhanced ROS generation and diminished ATP synthesis [14,40–45]. Our previous studies demonstrated that polyunsaturated fatty acids, such as linoleic acid (one of the most abundant fatty acids, the concentration of which is significantly increased in type 2 diabetes [46]), deplete [Ca2+]m by inducing Ca2+ efflux from mitochondria [47,48], and that heat shock protein 90β1 (hsp90β1) plays an essential role in mediating the fatty acid effect [48]. A major role of [Ca2+]m under physiological conditions is to stimulate oxidative phosphorylation [49,50] and ATP synthesis [51]. It is possible that [Ca2+]m depletion induced by excessive fatty acids in kidney cells of db/db mice may be partially responsible for the impaired MC-3 activity and the development of diabetic nephropathy that we have observed in the present study.
In summary, we provide evidence that reduction in melatonin-induced rapid ROS generation and MC-3 activities are associated with the development of diabetic nephropathy in db/db mice. The non-concordant regulation in the expression of individual electron transport chain components may contribute to ROS overproduction and oxidative stress during the development of diabetic nephropathy.
Acknowledgments
This work was partially supported by grants from NIH (R01 HL075011 to BXZ and R01 DK078971 to HEA) and the National Natural Science Foundation of China (No.30800409 to HZ and No. 30700812, 30900673, and SJ08-ZT10 to HMZ). The quantitative analysis of mesangial area was performed with the help of Dr. JL Barnes.
References
- 1.Caramori ML, Fioretto P, Mauer M. The need for early predictors of diabetic nephropathy risk: is albumin excretion rate sufficient? Diabetes. 2000;49:1399–1408. doi: 10.2337/diabetes.49.9.1399. [DOI] [PubMed] [Google Scholar]
- 2.Brosius FC, 3rd, Alpers CE, Bottinger EP, et al. Mouse models of diabetic nephropathy. J Am Soc Nephrol. 2009;20:2503–2512. doi: 10.1681/ASN.2009070721. [DOI] [PMC free article] [PubMed] [Google Scholar]
- 3.Breyer MD, Böttinger E, Brosius FC, 3rd, et al. Mouse models of diabetic nephropathy. J Am Soc Nephrol. 2005;16:27–45. doi: 10.1681/ASN.2004080648. [DOI] [PubMed] [Google Scholar]
- 4.Sharma K, Mccue P, Dunn SR. Diabetic kidney disease in the db/db mouse. Am J Physiol Renal Physiol. 2003;284:F1138–F1144. doi: 10.1152/ajprenal.00315.2002. [DOI] [PubMed] [Google Scholar]
- 5.Dronavalli S, Duka I, Bakris GL. The pathogenesis of diabetic nephropathy. Nat Clin Pract Endocrinol Metab. 2008;4(8):444–452. doi: 10.1038/ncpendmet0894. [DOI] [PubMed] [Google Scholar]
- 6.Boudina S, Sena S, Theobald H, et al. Mitochondrial energetics in the heart in obesity-related diabetes: direct evidence for increased uncoupled respiration and activation of uncoupling proteins. Diabetes. 2007;56:2457–2466. doi: 10.2337/db07-0481. [DOI] [PubMed] [Google Scholar]
- 7.Kaur G, Bhardwaj SK. The impact of diabetes on CNS. Role of bioenergetic defects. Mol Chem Neuropathol. 1998;35:119–131. doi: 10.1007/BF02815119. [DOI] [PubMed] [Google Scholar]
- 8.Kelley DE, He J, Menshikova EV, et al. Dysfunction of mitochondria in human skeletal muscle in type 2 diabetes. Diabetes. 2002;51:2944–2950. doi: 10.2337/diabetes.51.10.2944. [DOI] [PubMed] [Google Scholar]
- 9.Turko IV, Murad F. Quantitative protein profiling in heart mitochondria from diabetic rats. J Biol Chem. 2003;278:35844–35849. doi: 10.1074/jbc.M303139200. [DOI] [PubMed] [Google Scholar]
- 10.Turko IV, Li L, Aulak KS, et al. Protein tyrosine nitration in the mitochondria from diabetic mouse heart. Implications to dysfunctional mitochondria in diabetes. J Biol Chem. 2003;278:33972–33977. doi: 10.1074/jbc.M303734200. [DOI] [PubMed] [Google Scholar]
- 11.Kaneda K, Iwao J, Sakata N, et al. Correlation between mitochondrial enlargement in renal proximal tubules and microalbuminuria in rats with early streptozotocin-induced diabetes. Acta Pathol Jpn. 1992;42:855–860. doi: 10.1111/j.1440-1827.1992.tb01890.x. [DOI] [PubMed] [Google Scholar]
- 12.Nishi S, Ueno M, Hisaki S, et al. Ultrastructural characteristics of diabetic nephropathy. Med Electron Microsc. 2000;33:65–73. doi: 10.1007/s007950070004. [DOI] [PubMed] [Google Scholar]
- 13.Rosca MG, Mustata TG, Kinter MT, et al. Glycation of mitochondrial proteins from diabetic rat kidney is associated with excess superoxide formation. Am J Physiol Renal Physiol. 2005;289:F420–F430. doi: 10.1152/ajprenal.00415.2004. [DOI] [PubMed] [Google Scholar]
- 14.Ghosh S, Khazaei M, Moien-afshari F, et al. Moderate exercise attenuates caspase-3 activity, oxidative stress, and inhibits progression of diabetic renal disease in db/db mice. Am J Physiol Renal Physiol. 2009;296:F700–708. doi: 10.1152/ajprenal.90548.2008. [DOI] [PMC free article] [PubMed] [Google Scholar]
- 15.Brownlee M. The pathobiology of diabetic complications: a unifying mechanism. Diabetes. 2005;54:1615–1625. doi: 10.2337/diabetes.54.6.1615. [DOI] [PubMed] [Google Scholar]
- 16.Zhang HM, Dang H, Yeh CK, et al. Linoleic acid-induced mitochondrial Ca(2+) efflux causes peroxynitrite generation and protein nitrotyrosylation. PLoS One. 2009;4:e6048. doi: 10.1371/journal.pone.0006048. [DOI] [PMC free article] [PubMed] [Google Scholar]
- 17.Tan DX, Chen LD, Poeggeler B, et al. Melatonin: a potent endogenous hydroxyl radical scavenger. Endocrine J. 1993;1:57–60. [Google Scholar]
- 18.Hardeland R, Tan DX, Reiter RJ. Kynuramines, metabolites of melatonin and other indoles: the resurrection of an almost forgotten class of biogenic amines. J Pineal Res. 2009;47:109–26. doi: 10.1111/j.1600-079X.2009.00701.x. [DOI] [PubMed] [Google Scholar]
- 19.Ha H, Yu MR, Kim KH. Melatonin and taurine reduce early glomerulopathy in diabetic rats. Free Radic Biol Med. 1999;26:944–950. doi: 10.1016/s0891-5849(98)00276-7. [DOI] [PubMed] [Google Scholar]
- 20.Oktem F, Ozguner F, Yilmaz HR, et al. Melatonin reduces urinary excretion of N-acetyl-beta-D-glucosaminidase, albumin and renal oxidative markers in diabetic rats. Clin Exp Pharmacol Physiol. 2006;33:95–101. doi: 10.1111/j.1440-1681.2006.04330.x. [DOI] [PubMed] [Google Scholar]
- 21.Albertini MC, Radogna F, Accorsi A, et al. Intracellular pro-oxidant activity of melatonin deprives U937 cells of reduced glutathione without affecting glutathione peroxidase activity. Ann N Y Acad Sci. 2006;1091:10–16. doi: 10.1196/annals.1378.050. [DOI] [PubMed] [Google Scholar]
- 22.Büyükavci M, Ozdemir O, Buck S, et al. Melatonin cytotoxicity in human leukemia cells: relation with its pro-oxidant effect. Fundam Clin Pharmacol. 2006;20:73–79. doi: 10.1111/j.1472-8206.2005.00389.x. [DOI] [PubMed] [Google Scholar]
- 23.Osseni RA, Rat P, Bogdan A, et al. Evidence of prooxidant and antioxidant action of melatonin on human liver cell line HepG2. Life Sci. 2000;68:387–399. doi: 10.1016/s0024-3205(00)00955-3. [DOI] [PubMed] [Google Scholar]
- 24.Radogna F, Paternoster L, De nicola M, et al. Rapid and transient stimulation of intracellular reactive oxygen species by melatonin in normal and tumor leukocytes. Toxicol Appl Pharmacol. 2009;239:37–45. doi: 10.1016/j.taap.2009.05.012. [DOI] [PubMed] [Google Scholar]
- 25.Zhang HM, Zhang Y, Zhang BX. The role of mitochondrial complex III in melatonin-induced ROS production in cultured mesangial cells. J Pineal Res. 2011;50:78–82. doi: 10.1111/j.1600-079X.2010.00815.x. [DOI] [PMC free article] [PubMed] [Google Scholar]
- 26.Qi Z, Whitt I, Mehta A, et al. Serial determination of glomerular filtration rate in conscious mice using FITC-inulin clearance. Am J Physiol Renal Physiol. 2004;286:F590–596. doi: 10.1152/ajprenal.00324.2003. [DOI] [PubMed] [Google Scholar]
- 27.Sturgeon C, Sam AD, 2nd, Law WR. Rapid determination of glomerular filtration rate by single-bolus inulin: a comparison of estimation analyses. J Appl Physiol. 1998;84:2154–2162. doi: 10.1152/jappl.1998.84.6.2154. [DOI] [PubMed] [Google Scholar]
- 28.Sapirstein LA, Herrold MR, Janakis M, et al. Validity of values for glomerular filtration rate and extracellular fluid obtained from plasma concentration-time decay curves after single injections of mannitol in the dog. Am J Physiol. 1952;171:487–491. doi: 10.1152/ajplegacy.1952.171.2.487. [DOI] [PubMed] [Google Scholar]
- 29.Danda RS, Habiba NM, Rincon-choles H, et al. Kidney involvement in a nongenetic rat model of type 2 diabetes. Kidney Int. 2005;68:2562–2571. doi: 10.1111/j.1523-1755.2005.00727.x. [DOI] [PubMed] [Google Scholar]
- 30.Carretero M, Escames G, López LC, et al. Long-term melatonin administration protects brain mitochondria from aging. J Pineal Res. 2009;47:192–200. doi: 10.1111/j.1600-079X.2009.00700.x. [DOI] [PubMed] [Google Scholar]
- 31.Li Z, Nickkholgh A, Yi X, et al. Melatonin protects kidney grafts from ischemia/reperfusion injury through inhibition of NF-kB and apoptosis after experimental kidney transplantation. J Pineal Res. 2009;46:365–372. doi: 10.1111/j.1600-079X.2009.00672.x. [DOI] [PubMed] [Google Scholar]
- 32.Luchetti F, Canonico B, Betti M, et al. Melatonin signaling and cell protection function. FASEB J. 2010;24:3603–24. doi: 10.1096/fj.10-154450. [DOI] [PubMed] [Google Scholar]
- 33.Martín M, Macías M, Escames G, et al. Melatonin-induced increase activity of the respiratory chain complexes I and IV can prevent mitochondrial damage induced by ruthenium red in vivo. J Pineal Res. 2000;28:242–248. doi: 10.1034/j.1600-079x.2000.280407.x. [DOI] [PubMed] [Google Scholar]
- 34.Escames G, López LC, Tapias V, et al. Melatonin counteracts inducible mitochondrial nitric oxide synthase-dependent mitochondrial dysfunction in skeletal muscle of septic mice. J Pineal Res. 2006;40:71–78. doi: 10.1111/j.1600-079X.2005.00281.x. [DOI] [PubMed] [Google Scholar]
- 35.Giacco F, Brownlee M. Oxidative stress and diabetic complications. Circ Res. 2010;107:1058–1070. doi: 10.1161/CIRCRESAHA.110.223545. [DOI] [PMC free article] [PubMed] [Google Scholar]
- 36.Naito Y, Uchiyama K, Mizushima K, et al. Microarray profiling of gene expression patterns in glomerular cells of astaxanthin-treated diabetic mice: a nutrigenomic approach. Int J Mol Med. 2006;18:685–695. [PubMed] [Google Scholar]
- 37.Tilton RG, Haidacher SJ, Lejeune WS, et al. Diabetes-induced changes in the renal cortical proteome assessed with two-dimensional gel electrophoresis and mass spectrometry. Proteomics. 2007;7:1729–1742. doi: 10.1002/pmic.200700017. [DOI] [PubMed] [Google Scholar]
- 38.Munusamy S, Saba H, Mitchell T, et al. Alteration of renal respiratory Complex-III during experimental type-1 diabetes. BMC Endocr Disord. 2009;9:2. doi: 10.1186/1472-6823-9-2. [DOI] [PMC free article] [PubMed] [Google Scholar]
- 39.Bugger H, Chen D, Riehle C, et al. Tissue-specific remodeling of the mitochondrial proteome in type 1 diabetic akita mice. Diabetes. 2009;58:1986–1997. doi: 10.2337/db09-0259. [DOI] [PMC free article] [PubMed] [Google Scholar]
- 40.Houmard JA, Tanner CJ, Yu C, et al. Effect of weight loss on insulin sensitivity and intramuscular long-chain fatty acyl-CoAs in morbidly obese subjects. Diabetes. 2002;51:2959–2963. doi: 10.2337/diabetes.51.10.2959. [DOI] [PubMed] [Google Scholar]
- 41.Ellis BA, Poynten A, Lowy AJ, et al. Long-chain acyl-CoA esters as indicators of lipid metabolism and insulin sensitivity in rat and human muscle. Am J Physiol Endocrinol Metab. 2000;279:E554–E560. doi: 10.1152/ajpendo.2000.279.3.E554. [DOI] [PubMed] [Google Scholar]
- 42.Itani SI, Ruderman NB, Schmieder F, et al. Lipid-induced insulin resistance in human muscle is associated with changes in diacylglycerol, protein kinase C, and IkappaB-alpha. Diabetes. 2002;51:2005–2011. doi: 10.2337/diabetes.51.7.2005. [DOI] [PubMed] [Google Scholar]
- 43.Adams JM, 2nd, Pratipanawatr T, Berria R, et al. Ceramide content is increased in skeletal muscle from obese insulin-resistant humans. Diabetes. 2004;53:25–31. doi: 10.2337/diabetes.53.1.25. [DOI] [PubMed] [Google Scholar]
- 44.Abdul-ghani MA, Defronzo RA. Mitochondrial dysfunction, insulin resistance, and type 2 diabetes mellitus. Curr Diab Rep. 2008;8:173–178. doi: 10.1007/s11892-008-0030-1. [DOI] [PubMed] [Google Scholar]
- 45.Chavez AO, Kamath S, Jani R, et al. Effect of short-term free Fatty acids elevation on mitochondrial function in skeletal muscle of healthy individuals. J Clin Endocrinol Metab. 2010;95:422–429. doi: 10.1210/jc.2009-1387. [DOI] [PMC free article] [PubMed] [Google Scholar]
- 46.Yi L, He J, Liang Y, et al. Simultaneously quantitative measurement of comprehensive profiles of esterified and non-esterified fatty acid in plasma of type 2 diabetic patients. Chem Phys Lipids. 2007;150:204–216. doi: 10.1016/j.chemphyslip.2007.08.002. [DOI] [PubMed] [Google Scholar]
- 47.Zhang BX, Ma X, Zhang W, et al. Polyunsaturated fatty acids mobilize intracellular Ca2+ in NT2 human teratocarcinoma cells by causing release of Ca2+ from mitochondria. Am J Physiol Cell Physiol. 2006;290:C1321–333. doi: 10.1152/ajpcell.00335.2005. [DOI] [PubMed] [Google Scholar]
- 48.Zhang H, Li ZH, Zhang MQ, et al. Heat shock protein 90beta1 is essential for polyunsaturated fatty acid-induced mitochondrial Ca2+ efflux. J Biol Chem. 2008;283:7580–7589. doi: 10.1074/jbc.M707192200. [DOI] [PubMed] [Google Scholar]
- 49.Hansford RG, Zorov D. Role of mitochondrial calcium transport in the control of substrate oxidation. Mol Cell Biochem. 1998;184:359–369. [PubMed] [Google Scholar]
- 50.Hajnóczky G, Robb-gaspers LD, Seitz MB, et al. Decoding of cytosolic calcium oscillations in the mitochondria. Cell. 1995;82:415–424. doi: 10.1016/0092-8674(95)90430-1. [DOI] [PubMed] [Google Scholar]
- 51.Das AM, Harris DA. Control of mitochondrial ATP synthase in heart cells: inactive to active transitions caused by beating or positive inotropic agents. Cardiovasc Res. 1990;24:411–417. doi: 10.1093/cvr/24.5.411. [DOI] [PubMed] [Google Scholar]