Abstract
The critical time of avian leukosis virus subgroup J (ALV-J)-mediated immunosuppression was determined by body weight, relative immune organ weight, histopathology, and presence of group specific antigen and antibodies in specific pathogen-free (SPF) chickens. CD4+ and CD8+ cell activity in the spleen, total and differential leukocyte counts in blood, and viral RNA levels in spleen were measured. Significant growth suppression was observed in the two ALV-J-infected groups. A strong immune response by infected groups was present in spleen at 2-weeks-of-age, but after 4-weeks-of-age, the response decreased quickly. The thymus and bursa showed persistent immunosuppression until 4-weeks-of-age. Proliferation of fibroblasts and dendritic cells were observed in immune organs at 4- and 5-weeks-of-age. However, the granulocyte cell number was markedly lower in the infected groups than in the control group. In group 1 (day 1 infection) CD4+ cells increased during the second week but significantly decreased during the fourth week, while group 2 (day 7 infection) showed the opposite effect. Viral RNA increased significantly by the fourth week. These data identify 3~4 weeks post-infection as the key time at which the ALV-J virus exerts its immunosuppressive effects on the host.
Keywords: ALV-J, avian, immunosuppression, leukosis, leukosis virus subgroup J
Introduction
Avian leukosis virus subgroup J (ALV-J) is the most common subgroup of naturally occurring avian retroviruses associated with myelocytomas and has adverse effects on immunity in meat-type chickens. ALV-J has caused significant economic loss in the broiler breeder industry due to increased incidence of tumors and mortality [5,12,14]. Additionally, ALV-J induces late-onset myeloid leukosis [13]. Renal tumors and other sarcomas such as histiocytic sarcomas, hemangiosarcomas, mesotheliomas, granulosa cell tumors, pancreatic adenocarcinomas, fibromas, and an unclassified leukemia have also been observed [6,13,16]. In addition to inducing tumor growth and subsequent mortality, ALV-J imparts immunosuppressive effects that lead to decreases in weight gain, egg production, fertility, and hatchability [4,7]. As a result, ALV-J negatively affects the broiler breeder industry.
Eradication programs aimed at eliminating ALV are based on prior knowledge obtained from the eradication of lymphoid leukosis, a condition in which the virus is primarily transmitted vertically. In vertical transmission, ALV-J behaves like other exogenous ALVs, and an established ALV eradication program [1] is hypothesized to be effective in eradicating this type of ALV-J infection [8]. However, horizontal transmission is more common with ALV-J than other subgroups of ALV, and therefore a different eradication strategy is warranted. Recently, a novel infection profile was identified in ALV-J-infected broiler breeder flocks in which hens intermittently shed viral antigens into the cloaca [8]. However, the time at which immunosuppression occurs after infection with ALV-J remains unknown.
In this study, we attempted to determine the critical time at which ALV-J horizontal transmission-mediated immunosuppression occurs. We assessed the immunosuppressive effects of a Chinese isolate of ALV-J on the growth and performance of specific pathogen-free (SPF) broiler chickens upon infection.
Materials and Methods
Chickens
Serum samples from 1-day-old SPF Leghorn chickens (Saishi, China) were tested for the presence of ALV-J antibodies and cloaca swabs were tested for the presence of group specific antigen (p27). Blood samples for serological testing were taken from the jugular vein using sterile technique. Birds testing positive for antigen or antibody of ALV-J were culled and excluded from the experiment. A total of 36 birds were divided into 3 groups of 12 birds each. Groups 1 and 2 were intraperitoneally inoculated with a Chinese ALV-J strain (NX0101) at a 104 tissue-culture infective dose (TCID50) at day 1 and 7, respectively. Group 3 was not inoculated and served as the negative control. Three chickens from each group were euthanized at 2-, 3-, 4- and 5-weeks-of-age. The weight of each bird was recorded at birth and once every week thereafter to monitor growth. Detection of ALV-J antibodies and p27 antigen, as described above, was initiated in week 2 and continued each week until the experiment was terminated.
Virus preparation
ALV-J (strain NX0101, Avian Disease Diagnostic Lab, Shandong Agricultural University, China) was propagated in primary chicken embryo fibroblasts (CEF) and grown at 37℃. After propagation, the TCID50 was determined as follows: a 10-fold serial dilution of the stock virus was performed in cell culture media to a final dilution of 10-8; each dilution of the virus was cultured at 37℃ and 5% CO2 for 8 days on a monolayer of CEF. After freezing and thawing the cells 3 times, 100 µL of the cell lysate was used to detect p27 antigen of ALV-J using an ELISA kit (IDEXX, USA).
Histopathology
The liver, spleen, kidney, thymus, bursa of Fabricius, and bone marrow of 3 birds from each group were examined histologically postmortem at 2, 3, 4 and 5 weeks. Tissues that were fixed in 10% formalin, embedded in paraffin, sectioned 5-µm, and stained with hematoxylin and eosin were analyzed by light microscopy.
Antibody and p27 antigen detection
Antibodies against ALV-J present in serum samples were detected with ELISA kit (IDEXX, USA). The presence of p27 on the cloaca swabs was determined using a commercial antigen capture ELISA kit. Although a cut-off (s/p ratio) of 0.2 was recommended by the manufacturer, we used a more stringent cut-off of 0.08 for the cloaca swab test.
Total and differential leukocyte counts
Whole blood was collected in heparin-containing tubes to determine total leukocyte, lymphocyte, and granulocyte counts using a PE-6800VET Hematology Analyzer (Pukang, China). Recommended settings and calibrations for avian hematology were installed according to the manufacturer's instructions. Total and differential leukocyte counts were performed for all birds each week.
Preparation of splenocytes
Spleens were aseptically removed and incubated in 1 mg/mL of collagenase type IV (Sigma-Aldrich, USA) for 15 min at 37℃. Single-cell suspensions were made by straining the sections over a 70 µm filter (Falcon; Becton Dickinson Labware, USA). Mononucleated cells were isolated by standard Percoll-Isopaque density gradient separation (Amersham Pharmacia Biotech AB, Sweden) according to the manufacturer's instructions and used for flow cytometry.
Flow cytometry
Nonspecific binding to cellular Fc receptors was blocked using normal sera. Normal goat IgG (2 mg/mL) (Sigma Diagnostics, USA) was incubated with 1 × 10⁶ cells for 10 min at 4℃. Fluorescein isothiocyanate labeled anti-CD4 (diluted 1 : 100) and phycoerythrin-labeled anti-CD8 (diluted 1 : 50) (Southern Biotech, UK) antibodies were diluted in fluorescence-activated cell sorting (FACS) buffer (2% fetal serum in phosphate buffered saline) and incubated with the cells for 30 min on ice. The cells were then washed with FACS buffer two times, and resuspended in 200 µL of 2% paraformaldehyde, and incubated for 1 h at 4℃. Following paraformaldehyde fixation, the cells were washed twice with FACS buffer, resuspended in 200 µL of FACS buffer, and stored at 4℃. Secondary antibody and normal primary sera were included as controls. Flow cytometry analysis was performed within 24 to 48 h of sample processing using an Easycyte Mini (Guava, USA) at the Core Flow Cytometry Facility at Shandong Agricultural University, China.
Reverse transcriptase polymerase chain reaction (RT-PCR)
Spleen RNA was treated with DNase I using an RNeasy kit according to the manufacturer's instructions (Qiagen, USA). A 1 µg sample of RNA was reverse transcribed with a PrimeScript Kit (Takara, China) in a 10 µL reaction volume with the following reaction components: 2 µL of 5× buffer; 0.5 µL Primer Script RT enzyme mix; 0.5 µL Oligo dT primer (50 mmol/L); 0.5 µL random 6-mer (100 µmol/L); 1 µL total RNA; and 5.5 µL RNase-free dH2O. The reaction was performed at 37℃ for 15 min and 85℃ for 5 sec. Complementary DNA (cDNA) prepared from the control group were used as negative controls.
Amplifications of gp37 and chicken glyceraldehyde 3-phosphate dehydrogenase (GAPDH) gene sequences were carried out in separate reactions using the following primers: gp37 forward (P1), TGCGTGCGTGGTTATTATTTC; gp37 reverse (P2), AATGGTGAGGTCGCTGACTGT; GAPDH forward (S1), GAACATCATCCCAGCGTCCA; GAPDH reverse (S2), CGGCAGGTCAGGTCAACAAC. The PCR was performed in a 50 µL reaction containing 25 µL 2×PCR master mix (Promega, USA), 2 µL cDNA, and primers at 2.5 pmol each. The PCR cycle was as follows: 1 cycle for 5 min at 95℃, followed by 35 cycles for 30 sec at 95℃, 30 sec at 55℃, and 30 sec at 75℃. The predicted sizes of the gp37 and GAPDH products were 144 base pair (bp) and 132 bp, respectively. The amplified products were cloned into the Vector T plasmid and plasmid DNA was expanded, purified, and accurately quantified by UV light spectroscopy. Finally, serial dilutions of the plasmid were prepared (from 106 to 10-1 copies per reaction) and used to build a reference curve for quantification.
Real-time RT-PCR
Real-time RT-PCR was performed using reagents from the SYBR Premix Ex Taq kit (Roche Molecular Biochemicals, USA). Amplification of the target gene and reference gene was performed in a 20 µL reaction containing 10.4 µL of 2×SYBR Ex Taq (containing ROX), 0.2 µL of each primer (10 mmol/L), and 2 µL of cDNA. The P1 and P2 primers and S1 and S2 primers were used for amplification of gp37 and GAPDH, respectively. The reaction was conducted in a real-time PCR instrument using a two-step protocol as follows: 95℃ for 20 sec followed by 40 cycles of denature at 95℃ for 5 sec, annealing at 60℃ for 34 sec, and extension at 72℃ for 13 sec. The melting curve profiles for the fluorescent nucleic acid binding dye were checked to ensure that the products were specific.
Results
Body weight gain, relative weight of immune organs, and histopathology
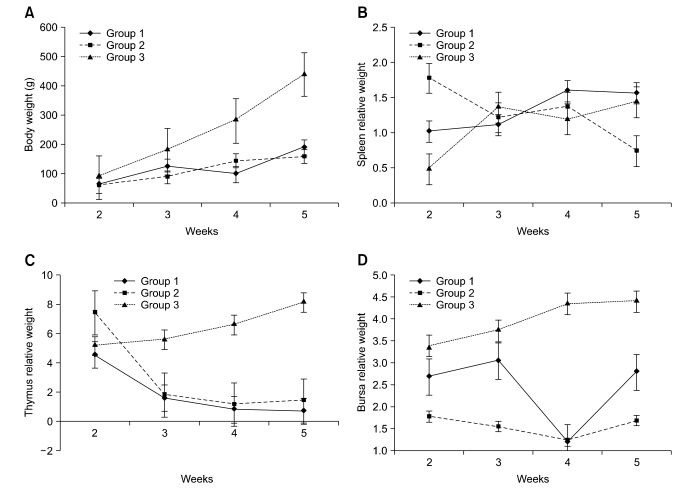
Growth suppression was found in 100% of the ALV-J-infected chickens. No significant differences (p > 0.05) were found between the ALV J-infected groups. Average body weight data measured during the 4 weeks post-inoculation are presented in Fig. 1A.
Fig. 1.
Dynamic change of body weight and relative weight of immune organs. (A) 100% of the avian leukosis virus subgroup J (ALV-J) infected groups showed growth suppression. (B) Spleen showed strong immune response until 4-weeks-of-age. (C) Thymus relative weigh of infected groups showed a persistent decrease. (D) Relative weigh of bursa of Fabricius were significantly lower than the control group.
Relative weight of the immune organs (RWIO) was measured for all of the groups (immune organ weight/body weight ×1,000). For the spleen, the RWIO of group 1 (1.027) and group 2 (1.784) were markedly higher than the control group (0.487) at 2-weeks-of-age. All three groups had similar RWIOs at 3- and 4-weeks-of-age. However, at 4 weeks, the RWIO of group 2 decreased significantly (from 1.379 to 0.75), while group 1 (1.579) remained elevated relative to the control group (1.45). In general, the RWIO of group 1 increased until 4-weeks-of-age and group 2 decreased from week 2 to week 5 as well (Fig. 1B). The data showed a strong immune response of splenetic cells upon infection with ALV-J at the initial 2 weeks. The RWIO values of the thymus and bursa of Fabricius continued to decrease until 4-weeks-of-age for infected groups, after which, the RWIO values showed a trend to increase (Figs. 1C and D). The thymus RWIO of group 2 (7.459) was higher than 1 (5.208) and the control group (4.579) at 2-weeks-of-age. These data suggest that an ALV-J infection at 7-days-of-age may cause an immune response of thymic cells during the first week, with a subsequent reduction in proliferation thereafter, indicating that ALV-J may cause immunosuppression by affecting this central immune organ.
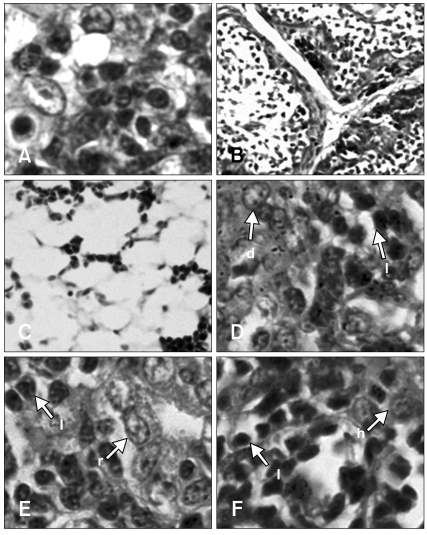
All tissue samples collected from necropsy were examined microscopically and the results showed no indication of neoplasia in infected groups. The chickens of infected groups developed depletion or infiltration of histiocytes in the bone marrow (Fig. 2C), spleen, kidney (Fig. 2E) and liver (Fig. 2F). The most remarkable changes in the spleen were the impairment of peri-ellipsoid and peri-arteriolar lymphocyte sheaths from 3-weeks-of-age. Proliferation of fibroblasts and dendritic cells (Fig. 2D) were observed in the central immune organs and spleen at 4- and 5-weeks-of-age, respectively. Lymphocyte depletion was observed in the thymus and bursa of Fabricius from 2 to 5 weeks (Figs. 2A and B). No difference in lesions was observed between infected groups.
Fig. 2.
Histopathology lesions from the ALV-J infected group at 4-weeks-of-age. No difference was found between group 1 (day 1 infection) and group 2 (day 7 infection). Depletion of lymphocytes in the thymus (A) and bursa of Fabricius (B). All types of cells in the bone marrow were depleted (C). Proliferation of dendritic cells in the spleen (D). Lymphocytes infiltration in the kidney (E) and liver (F). H&E stain. A, D, E and F: ×1,000, B: ×100, C: ×200. d: dendritic cell, h: hepatocyte, l: lymphocyte, r: renal tubule.
CD4+ and CD8+ T cells in spleens
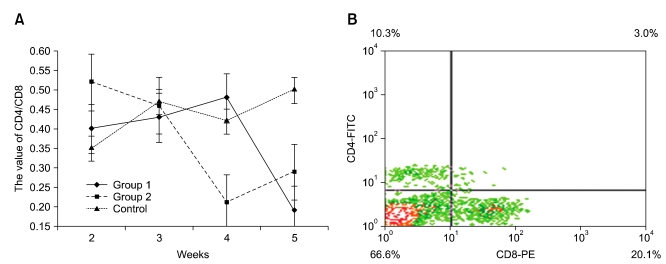
Flow cytometry with single color labeling was used to determine the percentage of CD4+ and CD8+ T cells within the spleen, of the three groups. The value of CD4+/CD8+ from group 1 birds increased up to 4-weeks-of-age compared to control birds. However, after 4-weeks-of-age, the value of CD4+/CD8+ decreased markedly. The CD4+/CD8+ cells in group 2 decreased during the first 4-weeks-of-age and then subsequently increased. In general, group 1 (0.4) and group 2 (0.52) had a higher CD4+/CD8+ values than the control group (0.35) at 2-weeks-of-age, but a much lower value (0.19 and 0.29) than the control group (0.5) at 5-weeks-of-age (Fig. 3).
Fig. 3.
Changes in CD4+/CD8+ cells number value (A) and flow cytometry analysis (B). (A) Group 1 increased until 4-weeks-of-age, then decreasing suddenly; group 2 decreased until 4-weeks-of-age, then increased. (B) Flow cytometry analysis showed the percentage of CD4+ and CD8+ T lymphocytes.
The mean percentage of CD8+ lymphocytes from infected birds was significantly higher (p < 0.05) than that in the control group. This suggests that specific suppression of CD4+ T cells may be a result of increased viral loads in tissues of ALV-J-infected chickens that occurs at 3 to 4 weeks post-infection. This may also be the key time to stimulate the immune system and reverse the immunosuppression due to infection.
Total and differential leukocyte counts
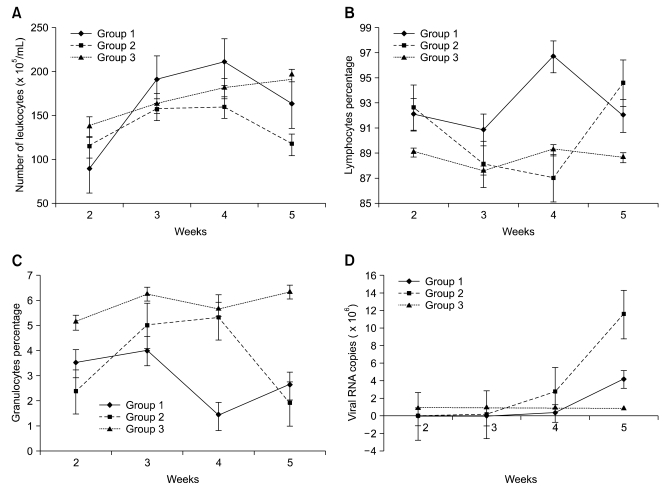
The total and differential leukocyte counts performed on blood samples from birds at 2-, 3-, 4-, and 5-weeks-of-age are depicted in Fig. 4. The percentage of lymphocytes in ALV-J infected birds was higher than in the control group at 2, 3, and 5 weeks. At week 4, the percentage of lymphocytes in group 1 (96.7%) birds was markedly higher than the control group (89.3%) while group 2 (86.95%) was lower than the control group. For granulocytes, infected groups (3.5% and 2.35%) showed significantly lower (p < 0.05) percentages than the control group (5.13%) at 2-weeks-of-age. For other types of leukocytes, no significant differences (p > 0.05) were found between the groups.
Fig. 4.
Total and differential leukocyte counts (A~C) and the quantity of viral RNA (D). A significant change took place at 4-weeks-of-age in ALV-J infected groups.
Quantity of virus and dynamic change
Real-time PCR results showed that the amount of viral RNA copy increased sharply at 4-weeks-of-age when group 1 (viral RNA copy number: 0.27 × 10⁶) had been infected for 4 weeks and group 2 (viral RNA copy number: 3.5 × 10⁶) had been infected for 3 weeks (Fig. 4D). The amount of viral RNA was significantly higher in group 2 (viral RNA copy number: 11.6 × 10⁶) birds than in group 1 (viral RNA copy number: 4.2 × 10⁶) birds at 5-weeks-of-age. This suggests that the virus replicates faster upon infection at day 7 than infection at day 1. The real-time PCR procedure was capable of detecting viral RNA levels at 250 fg/µL which corresponds to approximately 5×10⁵ RNA copies/µL.
ELISA of p27 and antibody detection
All birds in group 1 and 2 were p27 antigen-positive and ALV-J antibody negative as detected by ELISA. The data showed that all birds were viremic (virus positive and antibody negative in blood) irrespective of when they were inoculated. ALV-J belongs to a group of infectious agents that can efficiently establish persistent infection. The outcome of these infections often leads to wasting disease and immunosuppression, which results in myelocytoma and death of the host.
Discussion
Pathogenesis of immunosuppression caused by ALV-J appears to be associated with both T and B cells. Other subgroups, such as A, B, C, and D are well known potent inducers of wasting disease [2,3] and anemia, the severity of which, however, appears to be strain dependent [11,15]. Prior to our study, the critical time at which immunosuppression or wasting disease occurred in ALV-J-infected chickens remained unknown. In the present study, we have attempted to define the key time of ALV-J-mediated immunosuppression that occurs within 5 weeks post-infection. We also wanted to determine the difference in infection between day 1 and 7. Significant growth retardation of ALV-J-infected birds was observed from week 2 onwards. This difference was greatest at week 5, where the average weight of group 1 and group 2 birds was 190 g and 160 g, respectively while negative control birds had an average weight of 440 g.
The affinity of ALV-J for lymphoid tissues results in severe morphological alterations of the spleen, thymus, and bursa followed by suppression of the host immune system. These changes appears to be a unifying aspect of ALV-J acute pathogenicity. In the spleen, an increasing relative weight during the first 4 weeks indicated that inflammation took place during ALV-J infection. After 4-weeks-of-age, the relative weight of the spleen decreased, which suggests active viral replication was occurring. However, the relative weight of the thymus and bursa in infected groups was markedly lower than the control group, with the exception of the thymus from group 2 at 2-weeks-of-age. So, the pathogenesis of ALV-J-induced immune damage seems to be a main result of the viral effects on the central immune system. The data showed that 4-weeks-of-age (4 weeks post-inoculation for group 1, and 3 weeks post-inoculation for group 2) is a critical period in immunosuppression as the result of ALV-J infection.
Spleen changes were characterized by a marked reduction in the number of CD4+ lymphocytes and an increase in the CD8+ lymphocyte population. The changes resembled both damage of the marginal zone and shifts in CD8+ and CD4+ T lymphocyte populations, a condition similar to that observed in the spleens of HIV-infected patients [9,10]. The observed disruption in the sheath of ellipsoidal cells suggests that live virus attacked the immune cells in the spleen. Similar results were reported by Jeurissen et al. [7] in chickens infected with Marek's disease virus.
Real-time RT-PCR is widely used for detection and quantification of genes because it has a higher sensitivity than conventional RT-PCR. In our study, we were able to quantify ALV-J viral RNA and could differentiate 10-fold dilutions of the RNA from each other using one tube real-time RT-PCR reactions containing a fluorogenic probe system. The results of our real-time RT-PCR analysis explain why there was a marked decrease in the number of lymphocytes at 4 weeks post-inoculation.
The dynamic changes in the number of granulocyte and lymphocyte in blood indicated that the first target of ALV-J is a type of granulocyte rather than lymphocyte at the early stage of infection. At this stage, lymphocyte proliferation is significant, which indicates that a cellular immune response occurrs in the spleen and thymus. After 2 weeks of infection, the number of lymphocytes decreased markedly, so, lymphocytes might be a secondary target of ALV-J. At 4-weeks-of-age, the lowest suppressive condition resulted in an increased viral load in spleen.
Acknowledgments
This study was supported by grants from the National Natural Science Foundation (No. 30871856), Shandong Provincial Natural Science Foundation (Y2007D46) and Shandong key scientific and technological projects (2010GNC10943). The Vector T plasmid was kindly provided by Prof. Hongkun Zhao working in Shandong Agricultural University, China.
References
- 1.Arshad SS, Bland AP, Hacker SM, Payne LN. A low incidence of histiocytic sarcomatosis associated with infection of chickens with the HPRS-103 strain of subgroup J avian leukosis virus. Avian Dis. 1997;41:947–956. [PubMed] [Google Scholar]
- 2.Brojatsch J, Naughton J, Adkins HB, Young JAT. TVB receptors for cytopathic and noncytopathic subgroups of avian leukosis viruses are functional death receptors. J Virol. 2000;74:11490–11494. doi: 10.1128/jvi.74.24.11490-11494.2000. [DOI] [PMC free article] [PubMed] [Google Scholar]
- 3.Carter JK, Smith RE. Rapid induction of hypothyroidism by an avian leukosis virus. Infect Immun. 1983;40:795–805. doi: 10.1128/iai.40.2.795-805.1983. [DOI] [PMC free article] [PubMed] [Google Scholar]
- 4.Carter JK, Smith RE. Specificity of avian leukosis virus-induced hyperlipidemia. J Virol. 1984;50:301–308. doi: 10.1128/jvi.50.2.301-308.1984. [DOI] [PMC free article] [PubMed] [Google Scholar]
- 5.Elleder D, Stepanets V, Melder DC, Senigl F, Geryk J, Pajer P, Plachy J, Hejnar J, Svoboda J, Federspiel MJ. The receptor for the subgroup C avian sarcoma and leukosis viruses, Tvc, is related to mammalian butyrophilins, members of the immunoglobulin superfamily. J Virol. 2005;79:10408–10419. doi: 10.1128/JVI.79.16.10408-10419.2005. [DOI] [PMC free article] [PubMed] [Google Scholar]
- 6.Hafner S, Goodwin MA, Smith EJ, Fadly A, Kelley LC. Pulmonary sarcomas in a young chicken. Avian Dis. 1998;42:824–828. [PubMed] [Google Scholar]
- 7.Jeurissen SHM, Scholten R, Hilgers LAT, Pol JMA, De Boer GF. In situ detection by monoclonal antibody D-35.1 of cells infected with Marek's disease virus that interact with splenic ellipsoid-associated reticulum cells. Avian Dis. 1989;33:657–663. [PubMed] [Google Scholar]
- 8.Pandiri AR, Reed WM, Mays JK, Fadly AM. Influence of strain, dose of virus, and age at inoculation on subgroup J avian leukosis virus persistence, antibody response, and oncogenicity in commercial meat-type chickens. Avian Dis. 2007;51:725–732. doi: 10.1637/0005-2086(2007)51[725:IOSDOV]2.0.CO;2. [DOI] [PubMed] [Google Scholar]
- 9.Payne LN. HPRS-103: a retrovirus strikes back. The emergence of subgroup J avian leukosis virus. Avian Pathol. 1998;27:S36–S45. [Google Scholar]
- 10.Payne LN, Gillespie AM, Howes K. Myeloid leukaemogenicity and transmission of the HPRS-103 strain of avian leukosis virus. Leukemia. 1992;6:1167–1176. [PubMed] [Google Scholar]
- 11.Spencer JL. Progress towards eradication of lymphoid leukosis viruses - A review. Avian Pathol. 1984;13:599–619. doi: 10.1080/03079458408418560. [DOI] [PubMed] [Google Scholar]
- 12.Spencer JL, Chan M, Nadin-Davis S. Relationship between egg size and subgroup J avian leukosis virus in eggs from broiler breeders. Avian Pathol. 2000;29:617–622. doi: 10.1080/03079450020016878. [DOI] [PubMed] [Google Scholar]
- 13.Stedman NL, Brown TP. Body weight suppression in broilers naturally infected with avian leukosis virus subgroup J. Avian Dis. 1999;43:604–610. [PubMed] [Google Scholar]
- 14.Stepanets V, Vernerová Z, Vilhelmová M, Geryk J, Plachý J, Hejnar J, Weichold FF, Svoboda J. Intraembryonic avian leukosis virus subgroup C (ALV-C) inoculation producing wasting disease in ducks soon after hatching. Folia Biol (Praha) 2003;49:100–109. doi: 10.14712/fb2003049030100. [DOI] [PubMed] [Google Scholar]
- 15.Wilkins BS, Davis Z, Lucas SB, Delsol G, Jones DB. Splenic marginal zone atrophy and progressive CD8+ T-cell lymphocytosis in HIV infection: a study of adult postmortem spleens from Côte d'Ivoire. Histopathology. 2003;42:173–185. doi: 10.1046/j.1365-2559.2003.01569.x. [DOI] [PubMed] [Google Scholar]
- 16.Witter RL, Bacon LD, Hunt HD, Silva RE, Fadly AM. Avian leukosis virus subgroup J infection profiles in broiler breeder chickens: association with virus transmission to progeny. Avian Dis. 2000;44:913–931. [PubMed] [Google Scholar]


