

Abstract
Using functional magnetic resonance imaging, we found that cortical visual motion area MT+/V5 responded to auditory motion in two rare subjects who had been blind since early childhood and whose vision was partially recovered in adulthood. Visually normal control subjects did not show similar auditory responses. These auditory responses in MT+ were specific to motion compared with other complex auditory stimuli including frequency sweeps and speech. Thus, MT+ developed motion-specific responses to nonvisual input, suggesting that cross-modal plasticity can be influenced by the normal functional specialization of a cortical region. Regarding sight recovery after early blindness, our results further demonstrate that cross-modal responses coexist with regained visual responses within the visual cortex.
Keywords: multisensory, plasticity, blindness, motion, human, MT, V5
Introduction
Multiple brain imaging studies have shown that the visual cortex of people who become blind at an early age responds to a variety of auditory (Weeks et al., 2000; Gougoux et al., 2005), tactile (Sadato et al., 1996; Buchel et al., 1998), and verbal tasks (Burton et al., 2002a; Amedi et al., 2003). This cross-modal plasticity in blind people has been associated with superior performance in nonvisual tasks (Cohen et al., 1997; Amedi et al., 2003; Gougoux et al., 2005). However, it remains unclear how these nonvisual responses map onto specialized subregions of the visual cortex. This is because human visual cortical subregions cannot be reliably mapped based on anatomy and are therefore typically identified based on functional visual responses (either retinotopic or other stimulus preferences) that are not measurable in blind subjects.
Here, using functional magnetic resonance imaging (fMRI), we tested whether human cortical area MT+/V5, an area strongly implicated in visual motion processing (Watson et al., 1993; Tootell et al., 1995), was recruited for sound motion processing in two formerly early-blind persons with partial sight recovery in adulthood. Sight-recovery subjects afforded a unique opportunity to localize MT+ functionally based on responses to a moving versus stationary visual stimulus (as is the standard method with sighted subjects), while observing cross-modal responses (because these subjects had been blind most of their lives), all within the same individual's visual cortex. If MT+ in these subjects responded selectively to auditory motion, this would suggest that cross-modal reorganization can be guided by the normal functional specialization of a cortical region.
Sight-recovery subject M.M., age 53, was blinded in a chemical accident at age 3 and had vision partially restored (postoperative acuity, 20:1000) after a corneal stem cell replacement in the right eye 7 years ago at age 46. Postoperatively, M.M. showed successful performance on many visual motion tasks and exhibited normal MT+ responses to visual motion as measured using fMRI (Fine et al., 2003). Subject M.S., also age 53, whose blindness was congenital as a result of retinopathy of prematurity and cataracts, had vision partially restored (postoperative acuity, 20:400) after cataract removal in the right eye 10 years ago at age 43.
Our first goal was to determine whether cross-modal responses attributable to blindness would remain after the restoration of vision: would cross-modal responses within the visual cortex coexist with regained visual responses? Understanding the implications of cross-modal plasticity for visual restoration, and vice versa, is of increasing importance given current developments in technologies for restoring vision to the blind such as corneal stem cell transplants, retinal prosthetics, and gene therapy (Merabet et al., 2005; Aguirre et al., 2007). If we found cross-modal responses, our second goal was to determine whether responses in MT+ would be functionally selective: would the auditory responses within MT+ be motion specific? We tested these two hypotheses by functionally identifying MT+ in two sight-recovery subjects using moving visual stimuli and measuring responses within this region for a wide range of auditory stimuli that included auditory motion.
Materials and Methods
Subjects
Twelve subjects (two partial sight recovery: both age 53, one man; 10 normally sighted controls: ages 21–53, six men) without neurological or psychiatric problems participated having given written, informed consent. Data from one additional control subject were excluded from analysis because of significant head-motion artifacts. Experimental procedures were approved by the Caltech Institutional Review Board.
MRI scanning
Blood oxygenation-level dependent (BOLD) functional imaging was performed with a 3 tesla Siemens (Erlangen, Germany) TRIO scanner at Caltech (3 × 3 × 3 mm voxels; repetition time, 12 s; echo time, 30 ms; flip angle, 90°; field of view, 192; 30 slices). Slices were obliquely oriented for optimal coverage of visual and auditory cortices. Three-dimensional (3D) anatomical images were acquired using a T1-weighted MPRAGE (magnetization-prepared rapid gradient echo) sequence.
A sparse echo planar imaging pulse sequence was used in all experiments so that the presentation of stimuli (both auditory and visual) was uninterrupted by MRI scanner noise (Hall et al., 1999). Two-second volume acquisitions were preceded by 8–10 s quiet delay periods (10 s in experiment 1, 8 s in experiments 2 and 3) during which visual or auditory stimuli were presented. Because of the hemodynamic delay [∼5 s to peak response (Boynton et al., 1996)], each volume acquisition measured the BOLD response to stimulation during the middle of the stimulus presentation period, with relatively little contribution from the auditory noise of the previous acquisition. Note that the shorter delay period of experiments 2 and 3 may have resulted in lower measured response amplitudes in those experiments.
Auditory stimuli
Stimuli were generated using MATLAB and the psychophysics toolbox (www.psychtoolbox.org). See http://www.klab.caltech.edu/∼saenz/soundstimuli.html for samples of the auditory stimuli. Auditory stimuli were delivered via MRI-compatible stereo headphones (MRCONFON), and all subjects were instructed to keep their eyes closed during all auditory scans.
Interaural level difference (ILD) motion noise bursts (experiments 1–3) were created by linearly ramping (between 0 and maximum intensity) the volume of a white noise stimulus in opposite directions between the left and right speakers, creating the vivid perception of a sound source moving horizontally from one side of the head to the other. Maximum auditory intensity was ∼50 dB and was adjusted to a comfortable level for individual subjects. All subjects reported a strong motion perception. ILD motion responses were contrasted with responses to stationary auditory white noise bursts that had equal intensity (0.5 of maximum) in the two speakers, creating the perception of a centrally located stationary sound source. All noise bursts had a duration of 1 s ± 200 ms.
Interaural time difference (ITD) motion noise bursts (experiment 2) consisted of low-pass-filtered (at 2 kHz) auditory white noise presented to the two ears. The time lag between the two ears was stepped from +1 to −1 ms in 16 evenly spaced increments. In experiment 3, noise bursts were resampled so that interaural time lags could be smoothly and linearly ramped. The corresponding stationary stimulus had an interaural time lag of 0.
Volume changing stimuli (experiment 2) were stationary auditory white noise bursts presented binaurally. These stimuli (identical in both speakers) alternated between half and maximum volume. Volume levels were chosen to match the maximum monaural sound difference present in the ILD moving versus stationary stimuli.
Frequency-modulated (FM) sweeps (experiment 2) were generated by linearly ramping the auditory frequency from 75 to 800 Hz over time. FM sweeps were normalized using ISO226 equal-loudness curves to minimize perceived loudness changes that could be associated with spatial motion in depth. FM sweeps were contrasted with an unchanging, mid-range monotone (438 Hz).
Speech stimuli (experiment 2) consisted of nouns (recorded voice) spoken by a male native English speaker. Common concrete nouns (e.g., “chair,” “fork”) were chosen from the MRC psycholinguistic database (www.psy.uwa.edu.au/MRCDataBase/uwa_mrc.htm). Speech stimuli were contrasted with the same speech recordings played in reverse.
Stimulus procedures
Sight-recovery subjects M.M. and M.S. participated in experiments 1–3. Six control subjects (C1–C6) participated in experiment 1 (ILD motion responses). An additional four control subjects (C7–C10) were tested for auditory ITD motion responses in experiment 2. Two control subjects (C3, C7) participated in experiment 3.
Experiment 1: ILD auditory motion versus stationary white noise and rest.
Auditory scans (four per subject) consisted of thirty 12 s blocks of moving white noise (ILD motion), stationary white noise, and silent rest (10 alternated blocks of each condition, for a total of 372 s total including an initial dropped acquisition). Block order was counterbalanced across subjects. Each 12 s block consisted of a 10 s stimulation period followed by a 2 s data acquisition period.
Each stimulation period contained four two-alternative forced choice (2-AFC) trials (2500 ms each). During each trial, two noise bursts were presented, separated by a 100 ms blank interval, followed by a 400 ms response interval. During motion blocks, the sound moved in opposite directions during the two intervals. Each trial contained one shorter noise burst (800 ms) and one longer noise burst (1200 ms), the order of which was randomized across trials. Subjects pressed one of two keys to indicate which interval contained the longer-duration noise burst. The same task was used on both moving and stationary trials, so task demands did not vary across the compared conditions. Task performance was not significantly different across moving versus stationary conditions (93.1 vs 92.1% correct; p = 0.56) nor across control versus sight-recovery subjects (91.7 vs 93.7% correct; p = 0.22).
Experiment 2: measuring responses to auditory ITD motion, ILD motion, volume changes, frequency sweeps, and speech.
Auditory scans (two per subject per condition) consisted of forty 10 s blocks that alternately presented the given test stimulus and its respective contrast stimulus. We measured responses to (1) ITD motion versus stationary noise bursts, (2) ILD motion versus stationary noise bursts, (3) stationary volume changes (white noise bursts at maximum vs half-maximum volume, (4) frequency sweeps versus mid-range monotone (438 Hz), and (5) forward spoken words versus unintelligible reverse spoken words. Two additional conditions were run with subject M.S. only (with whom we had more time): (6) peripheral versus central stationary white noise bursts and (7) ILD moving versus stationary noise bursts played monaurally (thus removing the motion information).
The same 2-AFC duration judgment task from experiment 1 was used in all conditions of experiment 2 (except the speech condition) to keep task demands as similar as possible across all experiments. Each 10 s block contained three 2-AFC trials (2500 ms) that fit within the 8 s silent delay period followed by a 2 s scanning period. During FM sweep trials, the two intervals swept in opposite directions (from low to high and high to low), to parallel the motion conditions. In the speech condition, a single noun was presented every 2 s during the 8 s stimulation periods (four words per stimulation period). Subjects were asked to make a covert word association with the heard noun during forward speech blocks and to listen passively during the reverse speech blocks. The stimulus presentation and task for speech blocks were modeled after those used in previous studies of cross-modal verbal responses in blind subjects (Burton et al., 2002b; Amedi et al., 2003).
Experiment 3: measuring responses as a function of ITD and ILD motion strength.
ITD and ILD motion strength were parametrically varied by changing the slopes of the interaural temporal and volume ramps, respectively, as shown in Figure 4. For the ITD data session, each scan (five per subject) consisted of forty 10 s blocks of ITD motion presented at five different motion strengths (eight blocks per motion strength). The same procedure was repeated for the ILD data session on a separate day. During both sessions, single 1 s noise bursts were presented every 2 s during each 8 s stimulation period (four noise bursts per stimulation period) followed by 2 s of scanning. Each single noise burst swept from left to right or right to left in randomized order, and subjects indicated the perceived direction by pressing one of two keys (2-AFC direction discrimination task). Trials were blocked by motion strength and were presented either in order of increasing or decreasing motion strength (counterbalanced across scans). Task performance for the sight-recovery subjects at the 0, 25, 50, 75, and 100% levels of motion strength was 51% (chance level since there was no motion), 88, 90, 92, and 93% correct for ITD stimuli and 56, 93, 95, 93, and 91% correct for ILD stimuli.
Figure 4.

Experiment 3: MT+ responds to a range of auditory motion strengths. A, For ITD motion, interaural temporal differences were linearly ramped from positive to negative (e.g., leading in left ear to leading in right ear, or vice versa). The slope of the ITD ramp was parametrically varied using even increments. The 0% condition (stationary perception, no temporal lags) and the 100% condition (temporal lag ramped from +1 to −1 ms during the stimulus duration of 1 s) were equivalent to the stationary and moving conditions of experiment 2. B, MT+ responses (% fMRI signal change) to each motion condition are relative to the response to the 0% (stationary) condition for sight-recovery subjects (n = 2) and controls (n = 2). MT+ responded to all ITD motion strengths within sight-recovery subjects, but not controls. C, For ILD motion, interaural level (volume) differences were linearly ramped from positive to negative (e.g., louder in left ear to louder in right ear, or vice versa), with the slope again varying between 0% (stationary) and 100% (volume difference ramped from positive to negative maximum value). D, MT+ responses to each motion condition are plotted relative to the 0% (stationary) condition. MT+ responses increased linearly (R 2 = 0.97) with ILD motion strength within sight-recovery subjects, but not controls. Error bars denote SEM. Asterisks denote significant differences from zero (*p < 0.05; **p < 0.01).
Data analysis
Brain Voyager QX (Brain Innovation, Maastricht, The Netherlands) and MATLAB were used for data analysis. fMRI data preprocessing included linear trend removal, temporal high-pass filtering, and motion correction.
For general linear model (GLM) analyses (experiment 1 only), individual 3D anatomical images were transformed into Talairach space and were segmented at the gray/white matter boundary allowing for cortical surface reconstruction of each individual subject's brain hemispheres. Cortex-based alignment was applied to further improve intersubject alignment beyond Talairach correspondence. The reconstructed cortical surfaces were each transformed into a spherical representation that was subjected to nonrigid alignment to a selected target brain sphere based on the gyral/sulcal folding pattern (Fischl et al., 1999). fMRI data were aligned to same-session anatomical volumes and transformed into the cortex-based aligned coordinate space. Fixed-effects GLM analyses were corrected for serial correlations and for multiple comparisons using the false discovery rate (FDR) method (Genovese et al., 2002).
Region-of-interest (ROI) analyses (as used in experiments 1–3) have the benefit of being based on individual subject data and are more sensitive than whole-brain analyses. This allows us to localize regions with more precision and to quantify responses to multiple auditory stimulus conditions. ROIs were defined within each subject's 3D Talairached anatomical coordinate space (not on 2D surfaces).
Defining MT+ ROIs
MT+, the probable human homolog of visual motion-responsive macaque areas MT and MST, is typically located posterior to the intersection of the lateral occipital sulcus (LOS) and the inferior temporal sulcus (ITS). However, identifying human MT+ by anatomical landmarks and/or stereotaxic coordinates alone is problematic because of significant anatomical variability across individuals (Watson et al., 1993; Dumoulin et al., 2000), and because of its proximity to polysensory temporal lobe regions (Beauchamp et al., 2004). As a result, the location of MT+ is normally defined functionally, by its response to moving visual stimuli (Watson et al., 1993; Tootell et al., 1995).
The visual MT+ localizer stimulus was projected onto a rear-projection screen visible from within the MRI scanner via an angled mirror. There were two to four visual scans per subject, each consisting of 30 alternating blocks of moving (8°/s radially inward and outward) versus stationary white dots on a black background. Random dot arrays subtended ±10° from a central fixation point. Individual dots (50 per field) subtended 1°. This large dot size was used with all subjects to compensate for M.M.'s and M.S.'s limited acuity. Both M.M. and M.S., despite very low spatial acuity, reliably reported when the visual stimulus was moving versus stationary. MT+ ROIs for sight-recovery subjects and controls were individually selected as contiguous 3D regions near the LOS/ITS that responded more to moving than to stationary conditions [q(FDR) < 0.05]. To show that results did not depend on the particular threshold used for defining the ROI, MT+ ROI thresholds were also defined at q(FDR) < 0.01 and q(FDR) < 0.1 (supplemental Figs. 2, 3, available at www.jneurosci.org as supplemental material).
ROI analyses (as used in experiments 1–3) have the benefit of being based on each individual subject's data, thereby allowing us to localize (and measure responses to multiple auditory stimulus conditions within) regions sensitive to visual motion with precision for each individual subject. It was important to precisely define MT+ because of its proximity to multimodal areas. ROIs were defined within each subject's 3D Talairached anatomical coordinate space (not on 2D surfaces).
Defining other ROIs
Auditory cortex ROIs were defined as contiguous regions on the lateral sulcus that responded more to stationary white noise than to silent conditions [q(FDR) < 0.05]. This ROI likely included primary and secondary regions of auditory cortex. Ventral occipito-temporal voxels (inferior to MT+) that responded to ILD motion in experiment 1 were chosen as a third ROI (from subject M.M. only, because no such activation was evident in subject M.S.).
ROI statistics
In Figures 2 –4, error bars represent SEM. In all cases, t tests are performed over repeated scan runs per hemisphere per subject. The following are examples: auditory ILD motion responses of each subject (see Fig. 1): four repeated runs × two hemispheres yields (n = 8); ITD motion responses in MT+ of sight-recovery subjects (see Fig. 3 A): two repeated runs × two hemispheres × two subjects yields (n = 8).
Figure 2.

Experiment 1: ROI analysis. MT+ responds to both visual and auditory motion stimuli in sight-recovery subjects. Responses (% fMRI signal change) to moving versus stationary visual stimuli and to moving (ILD) versus stationary auditory stimuli within visually defined MT+ ROIs are shown. MT+ responded to visual motion in all individual subjects. MT+ responded to auditory ILD motion in sight-recovery subjects M.M. and M.S. but not in normally sighted controls. Error bars denote SEM. Asterisks denote significant differences from zero (**p < 0.01).
Figure 3.
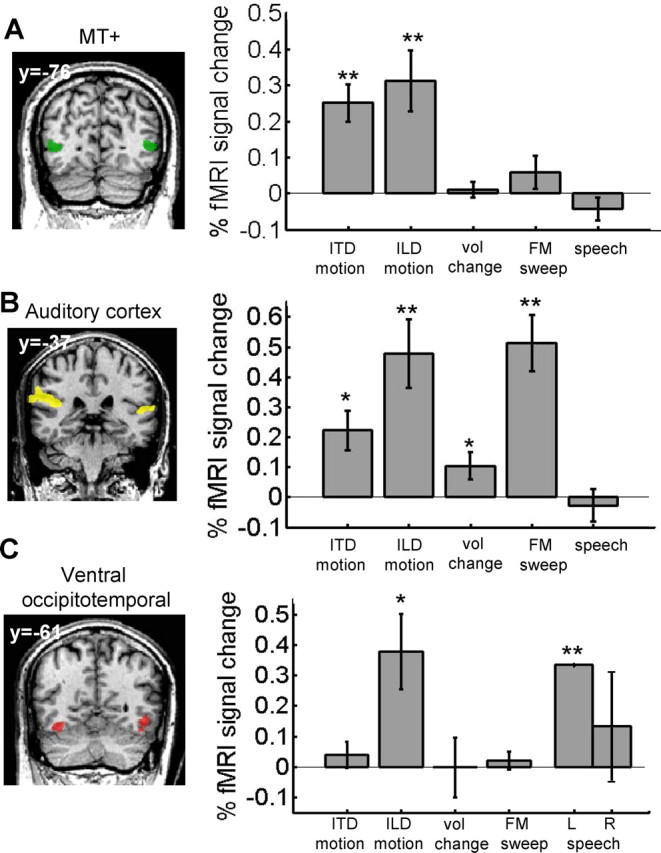
Experiment 2: MT+ auditory responses are motion specific. A–C, Responses (% fMRI signal change) from M.M. and M.S. to ITD motion, ILD motion, stationary volume changes, FM sweeps, and human speech within MT+ (A), auditory cortex (B), and ventral occipitotemporal cortex ROIs (C) are shown. Responses to all stimuli are relative to their respective baseline control stimuli. Only area MT+ had motion-specific responses. In the left column, sample coronal slice views from subject M.M. illustrate ROI locations (Talairach y-coordinates are given). Note that ventral occipitotemporal ROIs were identified in M.M. only, and left/right-hemispheric responses within that ROI are shown separately for the speech condition because it evoked a highly lateralized response. All other responses are averaged across the LH and RH. Error bars denote SEM. Asterisks denote significant differences from zero (*p < 0.05; **p < 0.01). vol, Volume; L, left; R, right.
Figure 1.
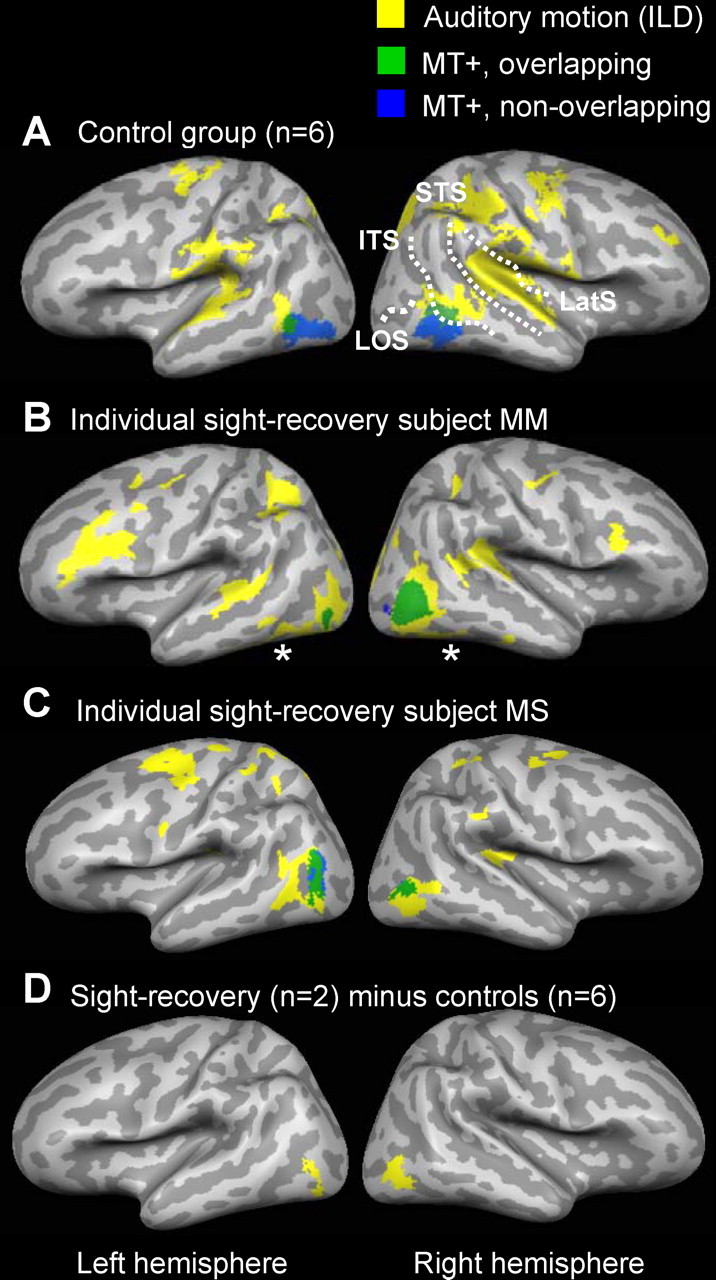
Experiment 1: surface maps of auditory ILD motion responses and MT+. A–C, Yellow regions responded more to moving (ILD) versus stationary auditory white noise in the control group (A), subject M.M. (B), and subject M.S. (C). Statistical activation maps are the result of a fixed-effects GLM analysis [q(FDR) < 0.01]. Green and blue regions show MT+ location as determined by visual MT+ localizer scans run in the same subjects (green, MT+ overlapped by auditory ILD motion responses; blue, MT+ not overlapped by auditory ILD motion responses). Note the near-complete overlap (very little blue) in subjects M.M. and M.S. indicating colocalization of auditory ILD responses with their visually defined MT+. D, A subtraction analysis shows regions more activated by auditory ILD motion (vs stationary) in sight-recovery subjects compared with controls [q(FDR) < 0.05]. Data from all subjects are projected onto a single anatomical image (inflated cortical surface) using cortex-based alignment. LatS, Lateral sulcus.
Results
We first present statistical activation maps that give an initial broad overview of cortical responses to auditory ILD motion in sight-recovery subjects and controls. Then, we use specific ROI analyses and a range of auditory stimuli to specifically test for the motion specificity of auditory responses within MT+ on an individual-subject basis. Samples of auditory stimuli can be found at http://www.klab.caltech.edu/∼saenz/soundstimuli.html. A sparse MRI pulse sequence was used in all experiments so that stimulus presentation was uninterrupted by scanner noise.
Experiment 1: cross-modal auditory motion responses coexist with regained visual responses in MT+
In experiment 1, we measured responses to visual motion (standard MT+ localizer stimulus) and to auditory ILD motion in the two sight-recovery subjects (M.M. and M.S.) and six normally sighted controls.
GLM analyses
In Figure 1, yellow regions show cortical brain areas that responded more to moving (ILD) than to stationary auditory white noise stimuli. Statistical activation maps are the result of fixed-effects GLM analyses, corrected for multiple comparisons [q(FDR)<0.01]. In both the control group and in subjects M.M. and M.S., auditory ILD motion activated the auditory cortex with a right-hemispheric dominance along the planum temporale (Fig. 1 A–C) [Talairach coordinates, control group: right hemisphere (RH): 50, −31,19; left hemisphere (LH): −48, −33, 17], consistent with previous reports of auditory motion responses in sighted subjects (Baumgart et al., 1999; Warren et al., 2002).
In the control group (Fig. 1 A), auditory ILD motion also activated the bilateral temporal lobes, beginning on the ITS and extending across the middle temporal gyri (MTG) toward the superior temporal sulci (STS) (RH: 52, −57, 6.4; LH: −51, −62, 3.1). The auditory response partially overlapped with the anterior end of MT+ in the control group analysis (Fig. 1 A, green), although blurring attributable to intersubject averaging contributes to this overlap in the group-averaged analysis. (See supplemental Fig. 1, available at www.jneurosci.org as supplemental material, for individual control subject activation maps.) This auditory response is consistent with previously reported responses to complex auditory stimuli (not limited to motion) on the posterior MTG, which may partially overlap with the anterior end of MT+ (Lewis et al., 2004). The existence of auditory responses adjacent to MT+ in control subjects further emphasizes the importance of functionally verifying MT+ location on an individual-subject basis.
Auditory ILD motion responses from subjects M.M. and M.S. are shown individually (Fig. 1 B,C). M.M. and M.S. had auditory ILD motion responses that extended posteriorly into the visual occipital lobe (q(FDR)<0.01). Unlike control subjects, their auditory responses colocalized very well with their own visually defined MT+.
A subtraction analysis (Fig. 1 D) shows regions that were more strongly activated during auditory ILD motion (vs auditory stationary) in sight-recovery subjects compared with controls [q(FDR)<0.01]. Auditory ILD motion more strongly activated a bilateral occipital region in the sight-recovery subjects (LH: −40, −78, −2.6; RH: 42, −70, −0.7), consistent with MT+ location in those subjects. Thus, these initial results are consistent with auditory ILD motion responses colocalizing with MT+ in sight-recovery subjects but not controls.
ROI analyses
Next, we sought to further verify this result by performing ROI analyses to measure the amplitude of the BOLD response to auditory ILD motion within the MT+ ROI of all subjects. These ROI analyses offer several important advantages. First, these ROI analyses are performed separately on each individual subject and are performed in 3D anatomical space (not surface projections). This avoids potential distortions resulting from group averaging and transformation onto surface representations. These concerns are of particular importance in a region of the cortex that shows high anatomical intersubject variability. Second, the ROI analyses report actual BOLD response amplitudes (not statistical values) and are therefore capable of revealing any auditory responses within MT+ that might be subthreshold in a given GLM analysis.
Bilateral MT+ ROIs were individually defined in each subject (in 3D coordinate space) based on that individual subject's response to the visual MT+ localizer stimulus (visual moving vs stationary). The stereotaxic locations (Table 1) and volumes (supplemental Table 1, available at www.jneurosci.org as supplemental material) of the MT+ ROIs in subjects M.M. and M.S. were consistent with previous studies (Watson et al., 1993; Tootell et al., 1995; Dumoulin et al., 2000) and were within the ranges found in our own control subjects.
Table 1.
Center-of-gravity Talairach coordinates for MT+ ROIs
| Subject | LH |
RH |
||||
|---|---|---|---|---|---|---|
| x | y | z | x | y | z | |
| M.M. | −44 | −77 | 4 | 40 | −73 | 4 |
| M.S. | −40 | −67 | 9 | 39 | −65 | 1 |
| C1 | −42 | −67 | 0 | 45 | −67 | −1 |
| C2 | −49 | −70 | 14 | 45 | −67 | 2 |
| C3 | −46 | −60 | −11 | 42 | −63 | −9 |
| C4 | −41 | −66 | −9 | 49 | −64 | −9 |
| C5 | −51 | −67 | 1 | 43 | −67 | −1 |
| C6 | −45 | −69 | −4 | 49 | −62 | −5 |
| C7 | −47 | −64 | −6 | 44 | −59 | −5 |
| C8 | −47 | −61 | 2 | 47 | −60 | −4 |
| C9 | −48 | −67 | −5 | 39 | −61 | −2 |
| C10 | −49 | −69 | −5 | 43 | −68 | −7 |
In Figure 2, fMRI response magnitudes (percentage of BOLD signal change) to visual motion and to auditory ILD motion are plotted within each subject's MT+ ROI. In each control subject, MT+ responded positively to visual motion (t test, p < 0.001 for each subject; as expected because the MT+ ROI was defined using this condition) but not to auditory ILD motion (p > 0.07, minimum for each subject). For each control subject, there was a significant difference between their own visual and auditory motion responses (p < 0.001, each subject). In M.M. and M.S., MT+ responded to both visual motion (p < 0.001, each subject) and auditory ILD motion (p < 0.001, each subject; with no significant difference between visual and auditory responses: M.M., p = 0.6; M.S., p = 0.9).
In additional control analyses, we verified that these results were highly consistent over a range of thresholds used to define the MT+ ROI, which included equating MT+ ROI size across subjects (supplemental Fig. 2, available at www.jneurosci.org as supplemental material).
Experiment 2: MT+ auditory response is specific to motion
In experiment 2, we sought to verify whether the sight-recovery subjects' auditory responses within MT+ were specific to motion. If motion specific, MT+ should also respond to auditory motion defined by ITDs but should not respond to other complex or temporally changing auditory stimuli that do not induce the perception of motion.
We measured responses within the MT+ ROIs of M.M. and M.S. to (1) moving versus stationary noise defined by ITDs; (2) moving versus stationary white noise defined by ILD (replication of experiment 1); (3) stationary volume changes (white noise at maximum vs half-maximum volume); (4) FM tonal sweeps versus monotone (FM sweeps are a rising and falling of pitch); and (5) human speech versus unintelligible reverse speech. Additionally, in subject M.S. only, we measured responses to two other control conditions: (6) peripheral versus central stationary white noise (to test for peripheral bias); and (7) the ILD moving versus stationary stimulus played monaurally (thus removing the motion information).
Consistent with the hypothesis of motion specificity in sight-recovery subjects, MT+ (Fig. 3 A) responded both to ITD motion (p < 0.001) and to ILD motion (p < 0.003), consistent with experiment 1, with no difference between responses to the two types of motion (p = 0.5). MT+ did not respond to stationary volume changes (p = 0.7), frequency sweeps (p = 0.22), or speech (p = 0.21). Nor did MT+ (measured in M.S. only; data not shown) respond to peripheral stationary stimuli (mean, 0.06% signal change ± 0.1; p = 0.6) or to ILD stimuli played monaurally (mean, 0.01% signal change ± 0.03; p = 0.9). The same pattern of results was observed for M.M. and M.S. individually (ITD, p < 0.01 each; ILD, p < 0.01 each; volume change, p > 0.4 each; frequency sweeps, p > 0.1 each; speech, p > 0.2 each). We also verified that these results were consistent over a range of thresholds used to define the MT+ ROI (supplemental Fig. 3, available at www.jneurosci.org as supplemental material)
We also measured auditory ITD motion responses within the MT+ ROI of four normally sighted control subjects (data not shown). In contrast to the sight-recovery subjects, MT+ in controls was weakly inhibited by ITD motion (mean, −0.11% signal change ± 0.05; p < 0.05). This is consistent with a previous study that reported slight deactivation of MT+ by auditory ITD motion stimuli (Lewis et al., 2000).
Next, we defined bilateral auditory cortex ROIs in M.M. and M.S. based on responses to stationary auditory white noise versus silence (Fig. 3 B). Responses within this ROI were significant for ITD motion (p < 0.05), ILD motion (p < 0.01), FM sweeps (p < 0.001), and for volume changes (p = 0.05). Unlike MT+, this region responded to auditory stimuli that were not limited to motion.
We also defined bilateral ventral occipitotemporal ROIs (Fig. 3 C) in subject M.M. because this region responded to ILD motion in experiment 1 (see asterisked region inferior to MT+ in Fig. 1; no such activation was evident for subject M.S.). We chose to investigate this region further, because it is more typically associated with object than with motion processing (Grill-Spector et al., 2001). In M.M., responses were marginally significant to ILD motion (p = 0.05) but not to ITD motion (p = 0.4), volume changes (p = 0.9), or to FM sweeps (p = 0.5). The LH of this region responded strongly to speech (LH, p < 0.01; RH, p = 0.6), consistent with previous reports of left-hemispheric verbal responses within visual cortex of early-blind subjects (Amedi et al., 2003). Thus, visual regions adjacent to MT+ that are not normally implicated in visual motion processing did not respond specifically to auditory motion.
The results of experiment 2 demonstrated that, in sight-recovery subjects, volume changes were neither necessary nor sufficient to evoke an MT+ response, nor did MT+ respond more generally to complex, continuously changing, peripheral, and/or meaningful stimuli including frequency sweeps or speech. Other regions of the brain that were not expected to show motion specificity responded more generally to this battery of auditory stimuli.
Experiment 3: MT+ is sensitive to weak auditory motion signals
In normally sighted subjects, MT+ is highly motion sensitive, responding even to weak motion signals (Britten et al., 1992). In experiment 3, we tested whether MT+ in the sight-recovery subjects was sensitive to a range of auditory motion signal strengths. For the ITD stimulus (low-pass-filtered auditory white noise), motion was generated by linearly ramping interaural temporal differences. We parametrically varied ITD motion strength by varying the slope of that linear ramp (Fig. 4 A). For the ILD stimulus (auditory white noise), motion was generated by linearly ramping ITDs. We parametrically varied ILD motion strength by varying the slope of that volume ramp (Fig. 4 C). In both cases, increasing the slope of the ramp effectively increased both the apparent speed and path length of the motion stimuli.
Within sight-recovery subjects M.M. and M.S., MT+ was highly sensitive to ITD motion, responding to motion stimuli with small ITD ramps (Fig. 4 B) (p < 0.005 at all motion strengths) and rapidly saturating. In contrast, MT+ of controls (n = 2) was not activated by ITD motion of any strength and was, in some cases, weakly inhibited (not different from zero at 50 and 75% levels, p > 0.3; below zero at 25 and 100% levels, p < 0.05). For ILD motion, MT+ responses within sight-recovery subjects increased monotonically with motion level and were well fit by a linear model (Fig. 4 D) (R 2 = 0.97; slope, 0.34/100; intercept, 0.01 of linear fit; difference from zero at 50, 75, and 100% levels; p < 0.001; individual-subject data also had a good linear dependence: M.M., R 2 = 0.97; M.S., R 2 = 0.95). In controls (n = 2), MT+ did not respond to ILD motion at any level (p > 0.1; R 2 = 0.31). These results were consistent over a range of thresholds used to define the MT+ ROI. Additionally, the response within the ventral occipitotemporal ROI of subject M.M. did not show a linear dependence on ILD motion strength (R 2 = 0.01).
Discussion
To summarize, we have shown that (1) MT+ responded to two types of auditory motion as a result of cross-modal plasticity in two sight-recovery subjects and did not respond to either type of auditory motion in visually normal controls; (2) this auditory response in MT+ was motion specific and could not be attributed to volume changes, a peripheral bias, or a responsiveness to complex or changing auditory stimuli, in general; and (3) MT+ responded to a range of auditory motion strengths, consistent with high sensitivity to visual motion in MT+ of normally sighted subjects. Furthermore, these results demonstrate for the first time that robust and specific auditory responses coexist with regained visual responses after sight recovery after long-term blindness.
Experiment 3 demonstrated that MT+ in the sight-recovery subjects was sensitive to a range of auditory motion strengths. One possible explanation for the observed linear dependence with ILD motion stimuli (but not ITD) is that with the ILD stimulus the motion information, such as the noise, is carried by the volume. Previous results in normally sighted subjects have shown that MT+ population responses increase linearly when the visual motion signal is increased relative to noise (i.e., visual motion coherence) (Rees et al., 2000), whereas MT+ responses as a function of speed are relatively invariant.
Previous studies of cross-modal responses in MT+
In subjects M.M. and M.S., we do not know to what extent cross-modal plasticity occurred during their years of blindness or in the time after sight recovery (or both). M.M.'s and M.S.'s sight had been restored for over 7 and 10 years, respectively. Thus, cross-modal responses coexist with restored visual responses in MT+, even many years after sight recovery in adulthood.
A previous study of early-blind subjects reported auditory ILD motion responses in a region consistent with MT+ location, and we have replicated this result in five blind subjects (data not shown), suggesting that similar cross-modal responses may exist in individuals who are still blind (Poirier et al., 2005, 2006). However, as described above, it is not possible to functionally verify MT+ location in subjects who are blind. Nor did Poirier et al. (2005, 2006) test whether the responses that they found near the presumed location of MT+ were selective for motion stimuli. Interestingly, another study in early-blind subjects reported acquired tactile motion responses in a region consistent with MT+ (Ricciardi et al., 2007). Independent of when plasticity occurred in our sight-recovery subjects, what is remarkable is the specificity of the acquired MT+ response to auditory motion and the consistency of these findings across two rare individuals.
Some previous studies have measured both auditory and visual motion responses in normally sighted subjects. In these studies, auditory motion stimuli were found to have a suppressive effect (Lewis et al., 2000) or no effect (Baumann and Greenlee, 2007) on MT+ responses. More recently, Alink et al. (2008) found that MT+ responses to combined audiovisual motion stimuli were modulated by whether or not the auditory and visual stimuli moved in congruent directions. Overall, these studies suggest a modulatory, but not driving, effect of auditory motion on MT+ responses in normally sighted subjects.
Functional specificity of cross-modal plasticity
Some previous studies have suggested that during cross-modal reorganization, cortical regions may retain their normal functional specialization, regardless of the input modality. For example the LOtv, a subregion of the lateral occipital complex that is normally responsive to object-related tactile and visual information, became responsive to object-related auditory information in blind and sighted users trained on a visual-to-auditory sensory substitution device (Amedi et al., 2007). Our results provide further evidence that during cross-modal reorganization, the colonization of a cortical region by a novel modality can be influenced by the normal functional specialization of the region.
Retaining functional specificity may make efficient use of existing neural circuitry both within and between cortical areas that are already optimized for a particular function (in this case, motion processing). One possibility is that MT+ is susceptible to “colonization” by auditory motion processing because the computational principles underlying the representation of auditory motion may have similarities to those underlying the representation of visual motion. A second possibility, not mutually exclusive with the first, is that retaining functional specificity may help a colonized area to continue to play its functional role within a pathway of multiple cortical areas.
However, it may not be the case that all instances of cross-modal plasticity retain functional specificity. Some studies report that in blind subjects, early visual areas are recruited to serve verbal and memory functions that do not clearly map onto to the known function of the visual cortex (Burton et al., 2002b; Amedi et al., 2003; Raz et al., 2005; Ofan and Zohary, 2007). In these cases, cross-modal plasticity could potentially lead to competition between the acquired function and any later restored visual function. In the case of MT+, we speculate that the preservation of motion responses by cross-modal plasticity may even contribute to the relatively good restoration of visual motion perception (compared with acuity and form perception) that has been consistently reported within the few documented accounts of sight recovery after long-term, early blindness (Gregory and Wallace, 1963; Sacks, 1995; Fine et al., 2003).
Conclusions
Much remains to be learned about the nature of these cross-modal responses in MT+. One question is where these cross-modal signals originate. Multiple mechanisms for cross-modal plasticity have been proposed including the growth of new axons, altered synaptic pruning during development, and the unmasking of cross-modal connections that are weak, modulatory, or silent in the mature brain (Bavelier and Neville, 2002; Pascual-Leone et al., 2005). Projections from auditory cortex to primary visual cortex have been reported in the adult primate (Falchier et al., 2002; Clavagnier et al., 2004), but there have been no reports yet of direct projections between auditory cortex and MT. Nearby multisensory regions of the temporal lobe are a potential source of cross-modal connections to MT+ during cross-modal reorganization (Beauchamp, 2005).
In our sight-recovery subjects, it remains an open question to what extent single neurons in MT+ respond to both visual and auditory motion and whether these neurons show directional tuning. Neither subject M.M. nor M.S. reported obvious difficulty in distinguishing visual from auditory events or synesthetic motion perceptions. However, cross-modal interactions, in which auditory stimulation influences visual motion perception, are measurable even in visually normal subjects (Sekuler et al., 1997; Seitz et al., 2006; Brooks et al., 2007). Additional testing will be needed to determine whether audiovisual interactions are enhanced in sight-recovery patients. Improved knowledge of how visual and auditory responses interact in sight-recovery patients may be important in aiding patients to achieve optimal use of their restored vision.
Footnotes
This work was supported by the Gordon and Betty Moore Foundation, the Mind Science Foundation, the Caltech Summer Undergraduate Research Fellowships program, the National Institutes of Health, and the National Science Foundation. We thank our study participants, in particular M.M. and M.S., and also thank Ulrik Beierholm for help with the sparse MRI pulse sequence design.
References
- Aguirre GK, Komaromy AM, Cideciyan AV, Brainard DH, Aleman TS, Roman AJ, Avants BB, Gee JC, Korczykowski M, Hauswirth WW, Acland GM, Aguirre GD, Jacobson SG. Canine and human visual cortex intact and responsive despite early retinal blindness from RPE65 mutation. PLoS Med. 2007;4:e230. doi: 10.1371/journal.pmed.0040230. [DOI] [PMC free article] [PubMed] [Google Scholar]
- Alink A, Singer W, Muckli L. Capture of auditory motion by vision is represented by an activation shift from auditory to visual motion cortex. J Neurosci. 2008;28:2690–2697. doi: 10.1523/JNEUROSCI.2980-07.2008. [DOI] [PMC free article] [PubMed] [Google Scholar]
- Amedi A, Raz N, Pianka P, Malach R, Zohary E. Early “visual” cortex activation correlates with superior verbal memory performance in the blind. Nat Neurosci. 2003;6:758–766. doi: 10.1038/nn1072. [DOI] [PubMed] [Google Scholar]
- Amedi A, Stern WM, Camprodon JA, Bermpohl F, Merabet L, Rotman S, Hemond C, Meijer P, Pascual-Leone A. Shape conveyed by visual-to-auditory sensory substitution activates the lateral occipital complex. Nat Neurosci. 2007;10:687–689. doi: 10.1038/nn1912. [DOI] [PubMed] [Google Scholar]
- Baumann O, Greenlee MW. Neural correlates of coherent audiovisual motion perception. Cereb Cortex. 2007;17:1433–1443. doi: 10.1093/cercor/bhl055. [DOI] [PubMed] [Google Scholar]
- Baumgart F, Gaschler-Markefski B, Woldorff MG, Heinze HJ, Scheich H. A movement-sensitive area in auditory cortex. Nature. 1999;400:724–726. doi: 10.1038/23390. [DOI] [PubMed] [Google Scholar]
- Bavelier D, Neville HJ. Cross-modal plasticity: where and how? Nat Rev Neurosci. 2002;3:443–452. doi: 10.1038/nrn848. [DOI] [PubMed] [Google Scholar]
- Beauchamp MS. See me, hear me, touch me: multisensory integration in lateral occipital-temporal cortex. Curr Opin Neurobiol. 2005;15:145–153. doi: 10.1016/j.conb.2005.03.011. [DOI] [PubMed] [Google Scholar]
- Beauchamp MS, Lee KE, Argall BD, Martin A. Integration of auditory and visual information about objects in superior temporal sulcus. Neuron. 2004;41:809–823. doi: 10.1016/s0896-6273(04)00070-4. [DOI] [PubMed] [Google Scholar]
- Boynton GM, Engel SA, Glover GH, Heeger DJ. Linear systems analysis of functional magnetic resonance imaging in human V1. J Neurosci. 1996;16:4207–4221. doi: 10.1523/JNEUROSCI.16-13-04207.1996. [DOI] [PMC free article] [PubMed] [Google Scholar]
- Britten KH, Shadlen MN, Newsome WT, Movshon JA. The analysis of visual motion: a comparison of neuronal and psychophysical performance. J Neurosci. 1992;12:4745–4765. doi: 10.1523/JNEUROSCI.12-12-04745.1992. [DOI] [PMC free article] [PubMed] [Google Scholar]
- Brooks A, van der Zwan R, Billard A, Petreska B, Clarke S, Blanke O. Auditory motion affects visual biological motion processing. Neuropsychologia. 2007;45:523–530. doi: 10.1016/j.neuropsychologia.2005.12.012. [DOI] [PubMed] [Google Scholar]
- Buchel C, Price C, Frackowiak RS, Friston K. Different activation patterns in the visual cortex of late and congenitally blind subjects. Brain. 1998;121:409–419. doi: 10.1093/brain/121.3.409. [DOI] [PubMed] [Google Scholar]
- Burton H, Snyder AZ, Conturo TE, Akbudak E, Ollinger JM, Raichle ME. Adaptive changes in early and late blind: a fMRI study of Braille reading. J Neurophysiol. 2002a;87:589–607. doi: 10.1152/jn.00285.2001. [DOI] [PMC free article] [PubMed] [Google Scholar]
- Burton H, Snyder AZ, Diamond JB, Raichle ME. Adaptive changes in early and late blind: a FMRI study of verb generation to heard nouns. J Neurophysiol. 2002b;88:3359–3371. doi: 10.1152/jn.00129.2002. [DOI] [PMC free article] [PubMed] [Google Scholar]
- Clavagnier S, Falchier A, Kennedy H. Long-distance feedback projections to area V1: implications for multisensory integration, spatial awareness, and visual consciousness. Cogn Affect Behav Neurosci. 2004;4:117–126. doi: 10.3758/cabn.4.2.117. [DOI] [PubMed] [Google Scholar]
- Cohen LG, Celnik P, Pascual-Leone A, Corwell B, Falz L, Dambrosia J, Honda M, Sadato N, Gerloff C, Catala MD, Hallett M. Functional relevance of cross-modal plasticity in blind humans. Nature. 1997;389:180–183. doi: 10.1038/38278. [DOI] [PubMed] [Google Scholar]
- Dumoulin SO, Bittar RG, Kabani NJ, Baker CL, Jr, Le Goualher G, Bruce Pike G, Evans AC. A new anatomical landmark for reliable identification of human area V5/MT: a quantitative analysis of sulcal patterning. Cereb Cortex. 2000;10:454–463. doi: 10.1093/cercor/10.5.454. [DOI] [PubMed] [Google Scholar]
- Falchier A, Clavagnier S, Barone P, Kennedy H. Anatomical evidence of multimodal integration in primate striate cortex. J Neurosci. 2002;22:5749–5759. doi: 10.1523/JNEUROSCI.22-13-05749.2002. [DOI] [PMC free article] [PubMed] [Google Scholar]
- Fine I, Wade AR, Brewer AA, May MG, Goodman DF, Boynton GM, Wandell BA, MacLeod DI. Long-term deprivation affects visual perception and cortex. Nat Neurosci. 2003;6:915–916. doi: 10.1038/nn1102. [DOI] [PubMed] [Google Scholar]
- Fischl B, Sereno MI, Tootell RB, Dale AM. High-resolution intersubject averaging and a coordinate system for the cortical surface. Hum Brain Mapp. 1999;8:272–284. doi: 10.1002/(SICI)1097-0193(1999)8:4<272::AID-HBM10>3.0.CO;2-4. [DOI] [PMC free article] [PubMed] [Google Scholar]
- Genovese CR, Lazar NA, Nichols T. Thresholding of statistical maps in functional neuroimaging using the false discovery rate. NeuroImage. 2002;15:870–878. doi: 10.1006/nimg.2001.1037. [DOI] [PubMed] [Google Scholar]
- Gougoux F, Zatorre RJ, Lassonde M, Voss P, Lepore F. A functional neuroimaging study of sound localization: visual cortex activity predicts performance in early-blind individuals. PLoS Biol. 2005;3:e27. doi: 10.1371/journal.pbio.0030027. [DOI] [PMC free article] [PubMed] [Google Scholar]
- Gregory RL, Wallace JG. Experimental Psychological Society Monograph 2. Cambridge, UK: Heffer and Sons; 1963. [Google Scholar]
- Grill-Spector K, Kourtzi Z, Kanwisher N. The lateral occipital complex and its role in object recognition. Vis Res. 2001;41:1409–1422. doi: 10.1016/s0042-6989(01)00073-6. [DOI] [PubMed] [Google Scholar]
- Hall DA, Haggard MP, Akeroyd MA, Palmer AR, Summerfield AQ, Elliott MR, Gurney EM, Bowtell RW. “Sparse” temporal sampling in auditory fMRI. Hum Brain Mapp. 1999;7:213–223. doi: 10.1002/(SICI)1097-0193(1999)7:3<213::AID-HBM5>3.0.CO;2-N. [DOI] [PMC free article] [PubMed] [Google Scholar]
- Lewis JW, Beauchamp MS, DeYoe EA. A comparison of visual and auditory motion processing in human cerebral cortex. Cereb Cortex. 2000;10:873–888. doi: 10.1093/cercor/10.9.873. [DOI] [PubMed] [Google Scholar]
- Lewis JW, Wightman FL, Brefczynski JA, Phinney RE, Binder JR, DeYoe EA. Human brain regions involved in recognizing environmental sounds. Cereb Cortex. 2004;14:1008–1021. doi: 10.1093/cercor/bhh061. [DOI] [PubMed] [Google Scholar]
- Merabet LB, Rizzo JF, Amedi A, Somers DC, Pascual-Leone A. What blindness can tell us about seeing again: merging neuroplasticity and neuroprostheses. Nat Rev Neurosci. 2005;6:71–77. doi: 10.1038/nrn1586. [DOI] [PubMed] [Google Scholar]
- Ofan RH, Zohary E. Visual cortex activation in bilingual blind individuals during use of native and second language. Cereb Cortex. 2007;17:1249–1259. doi: 10.1093/cercor/bhl039. [DOI] [PubMed] [Google Scholar]
- Pascual-Leone A, Amedi A, Fregni F, Merabet LB. The plastic human brain cortex. Annu Rev Neurosci. 2005;28:377–401. doi: 10.1146/annurev.neuro.27.070203.144216. [DOI] [PubMed] [Google Scholar]
- Poirier C, Collignon O, Devolder AG, Renier L, Vanlierde A, Tranduy D, Scheiber C. Specific activation of the V5 brain area by auditory motion processing: an fMRI study. Brain Res Cogn Brain Res. 2005;25:650–658. doi: 10.1016/j.cogbrainres.2005.08.015. [DOI] [PubMed] [Google Scholar]
- Poirier C, Collignon O, Scheiber C, Renier L, Vanlierde A, Tranduy D, Veraart C, De Volder AG. Auditory motion perception activates visual motion areas in early blind subjects. NeuroImage. 2006;31:279–285. doi: 10.1016/j.neuroimage.2005.11.036. [DOI] [PubMed] [Google Scholar]
- Raz N, Amedi A, Zohary E. V1 activation in congenitally blind humans is associated with episodic retrieval. Cereb Cortex. 2005;15:1459–1468. doi: 10.1093/cercor/bhi026. [DOI] [PubMed] [Google Scholar]
- Rees G, Friston K, Koch C. A direct quantitative relationship between the functional properties of human and macaque V5. Nat Neurosci. 2000;3:716–723. doi: 10.1038/76673. [DOI] [PubMed] [Google Scholar]
- Ricciardi E, Vanello N, Sani L, Gentili C, Scilingo EP, Landini L, Guazzelli M, Bicchi A, Haxby JV, Pietrini P. The effect of visual experience on the development of functional architecture in hMT+ Cereb Cortex. 2007;17:2933–2939. doi: 10.1093/cercor/bhm018. [DOI] [PubMed] [Google Scholar]
- Sacks O. An anthropolgist on Mars. New York: Knopf; 1995. [Google Scholar]
- Sadato N, Pascual-Leone A, Grafman J, Ibanez V, Deiber MP, Dold G, Hallett M. Activation of the primary visual cortex by Braille reading in blind subjects. Nature. 1996;380:526–528. doi: 10.1038/380526a0. [DOI] [PubMed] [Google Scholar]
- Seitz AR, Kim R, Shams L. Sound facilitates visual learning. Curr Biol. 2006;16:1422–1427. doi: 10.1016/j.cub.2006.05.048. [DOI] [PubMed] [Google Scholar]
- Sekuler R, Sekuler AB, Lau R. Sound alters visual motion perception. Nature. 1997;385:308. doi: 10.1038/385308a0. [DOI] [PubMed] [Google Scholar]
- Tootell RB, Reppas JB, Kwong KK, Malach R, Born RT, Brady TJ, Rosen BR, Belliveau JW. Functional analysis of human MT and related visual cortical areas using magnetic resonance imaging. J Neurosci. 1995;15:3215–3230. doi: 10.1523/JNEUROSCI.15-04-03215.1995. [DOI] [PMC free article] [PubMed] [Google Scholar]
- Warren JD, Zielinski BA, Green GG, Rauschecker JP, Griffiths TD. Perception of sound-source motion by the human brain. Neuron. 2002;34:139–148. doi: 10.1016/s0896-6273(02)00637-2. [DOI] [PubMed] [Google Scholar]
- Watson JD, Myers R, Frackowiak RS, Hajnal JV, Woods RP, Mazziotta JC, Shipp S, Zeki S. Area V5 of the human brain: evidence from a combined study using positron emission tomography and magnetic resonance imaging. Cereb Cortex. 1993;3:79–94. doi: 10.1093/cercor/3.2.79. [DOI] [PubMed] [Google Scholar]
- Weeks R, Horwitz B, Aziz-Sultan A, Tian B, Wessinger CM, Cohen LG, Hallett M, Rauschecker JP. A positron emission tomographic study of auditory localization in the congenitally blind. J Neurosci. 2000;20:2664–2672. doi: 10.1523/JNEUROSCI.20-07-02664.2000. [DOI] [PMC free article] [PubMed] [Google Scholar]