
Figure 3. Projections from Splenium to left hemisphere V1.
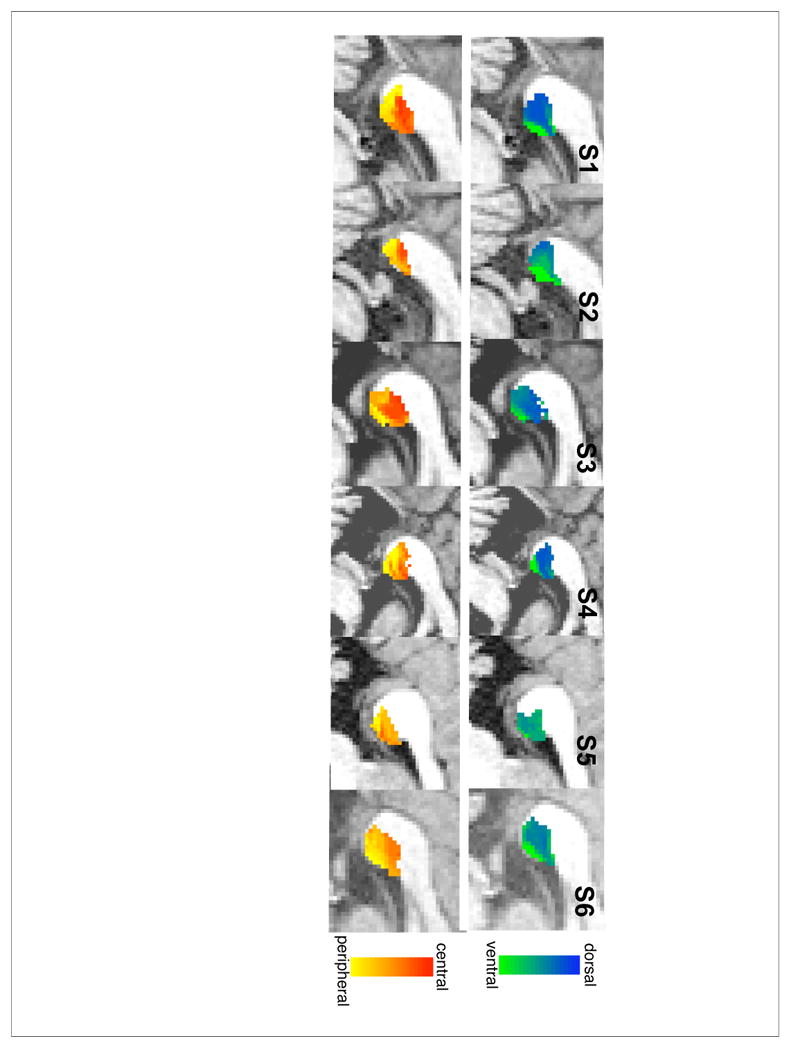
Each splenium voxel is classified based upon the proportional number of its streamline connections reaching V1 ventral (green) vs. V1 dorsal (blue) subregions in the top row, and V1 central (red) vs. middle (orange) vs. peripheral (yellow) subregions in the bottom row.