

Abstract
Objective
To examine the cost-effectiveness of improving blood pressure management from the payer perspective.
Data Source/Study Setting
Medical record data for 4,500 U.S. adults with hypertension from the Community Quality Index (CQI) study (1996–2002), pharmaceutical claims from four Massachusetts health plans (2004–2006), Medicare fee schedule (2009), and published literature.
Study Design
A probability tree depicted blood pressure management over 2 years.
Data Collection/Extraction Methods
We determined how frequently CQI study subjects received recommended care processes and attained accepted treatment goals, estimated utilization of visits and medications associated with recommended care, assigned costs based on utilization, and then modeled how hospitalization rates, costs, and goal attainment would change if all recommended care was provided.
Principal Findings
Relative to current care, improved care would cost payers U.S.$170 more per hypertensive person annually (2009 dollars). The incremental cost per person newly attaining treatment goals over 2 years would be U.S.$1,696 overall, U.S.$801 for moderate hypertension, and U.S.$850 for severe hypertension. Among people with severe hypertension, blood pressure would decline substantially but seldom reach goal; the incremental cost per person attaining a relaxed goal (≤stage 1) would be U.S.$185.
Conclusions
Under the Health Care Effectiveness Data and Information Set program, which monitors the attainment of blood pressure treatment goals, payers will find it slightly more cost-effective to improve care for moderate than severe hypertension. Having a secondary, relaxed goal would substantially increase payers' incentive to improve care for severe hypertension.
Keywords: Quality of health care, cost and cost analysis, cost-benefit analysis, hypertension
Despite being one of the most important and common chronic diseases, hypertension is substantially underdiagnosed and undertreated. Reducing blood pressure by 10/5 mmHg lowers the risk of coronary heart disease events by 22 percent and strokes by 41 percent over about 5 years (Law, Morris, and Wald 2009). Of U.S. adults, 23 percent report having hypertension while another 7 percent have elevated blood pressures without a diagnosis. Only 68 percent of people with hypertension are taking medications (Ong et al. 2007; Ostchega et al. 2008;). Suboptimal management by health care providers contributes to poor control (Wang and Vasan 2005). According to the most comprehensive assessment of quality of care to date, the Community Quality Index (CQI) study, U.S. adults receive 65 percent of recommended care processes for hypertension (McGlynn et al. 2003). Basic elements of blood pressure management are substantially underused, including making a diagnosis, initiating and adjusting medications, and monitoring blood pressure (Berlowitz et al. 1998; Andrade et al. 2004; Spranger et al. 2004; Wang and Vasan 2005; Milchak et al. 2008;).
The National Committee on Quality Assurance's Health Care Effectiveness Data and Information Set (HEDIS) enables health plans to monitor and report the quality of the care their enrollees receive. Ninety percent of health plans participate in the HEDIS program and employers consider HEDIS scores in health care purchasing decisions (National Committee for Quality Assurance 2009), giving health plans incentives to improve quality of care. The HEDIS measure for hypertension assesses a short-term outcome, the attainment of treatment goals (blood pressure <140/90 overall and <130/80 with diabetes mellitus). Eddy et al. (2008) recently determined that increasing the attainment of HEDIS goals from 28 percent to 100 percent of U.S. adults with hypertension would prevent 719,000 myocardial infarctions, 379,000 deaths from coronary heart disease, and 1,200,000 strokes over 10 years.
Although improved control would offer substantial health benefits, health care payers may be concerned about the potential cost. The cost-effectiveness of treating hypertension is well established from the societal perspective, but most studies are 10–20 years old, address nonrepresentative populations, and compare treatment with no treatment (Brown and Garber 2000; Krumholz et al. 2002; Mullins, Blak, and Akhras 2002;). Data are limited on the cost of improving quality relative to current levels (Lapuerta et al. 2001; Paramore et al. 2001; Kahn et al. 2008;). Further, although payers play major roles in quality assessment and can align financial incentives with improvement, costs and benefits of interest to payers have received limited attention. Private payers are likely to consider short-term costs and cost-effectiveness, such as the cost of improving adherence to HEDIS measures, because enrollee turnover is substantial (Cunningham 2000). Longer-term costs may be more important to payers with lower turnover, such as public payers, but much of the U.S. population has private insurance.
Our objective was to estimate the cost and cost-effectiveness to payers of consistently providing the basic elements of blood pressure management to U.S. adults with hypertension. We focused on process-of-care criteria because they can account for variations in patients' needs, identify which processes warrant improvement, and isolate aspects of care under providers' rather than patients' control. Also, the cost associated with providing recommended care processes is readily quantifiable (Brook, McGlynn, and Cleary 1996). Taking the payer perspective influenced the study time horizon (2 years) and measure of clinical effectiveness (attainment of treatment goals). While accounting practices involve a 1-year horizon, a 2-year horizon is preferable for examining hypertension care processes in detail because blood pressure varies across visits and 6 months can pass between recommended visits. Although conducting cost-effectiveness studies alongside randomized controlled trials produces precise estimates for the enrolled populations, we used a modeling approach because it can generate estimates representative of the U.S. population. To date, the CQI study represents the only nationally representative data on the quality of care processes for hypertension. Using data from this study, we identified care processes that are recommended for individual patients, assessed how frequently those processes were provided, and determined how often patients attained treatment goals over 2 years. We then modeled how direct costs to payers and goal attainment would change if all recommended care processes were provided. We considered coronary heart disease events and strokes in supplemental analyses because they involve longer time horizons.
METHODS
To achieve our study objective, we compared the costs and proportions of hypertensive individuals attaining treatment goals between a “status quo” scenario (blood pressure management in the CQI study) and an “improved care” scenario (100 percent provision of recommended care processes). First, we identified recommended care processes and treatment goals, and used them to develop a probability tree. Second, we created the status quo scenario by applying the probability tree to CQI study subjects with hypertension. This included defining episodes of hypertension care and then determining, for each episode, when subjects should have received recommended care processes and when they did receive them. Third, we created the improved care scenario from the status quo scenario by modifying certain parameters: we assumed that subjects received 100 percent of the recommended care processes, and we estimated the effect of receiving this care on blood pressure. Fourth, we estimated the utilization of physician visits and medications associated with receiving recommended care processes, and then calculated costs for each scenario based on utilization. Finally, we used the model to calculate cost-effectiveness ratios and perform sensitivity analyses. Appendix SA2 contains additional detail.
Study Subjects
In the CQI study, random-digit-dial telephone surveys identified 6,712 adults from 12 metropolitan areas (round 1) and a national sample of 7,598 adults (round 2). In both rounds, trained nurses collected data from medical records in up to two 2-year waves per patient from 1996 to 2002. The data from outpatient physician visits included blood pressures, medication initiation/adjustment, and laboratory tests; however, hospitalizations, medication utilization, and expenditures were not included.
For the current study, subjects included 4,500 adults with either a diagnosis of hypertension or no diagnosis but at least two blood pressures above goal. We examined the first available 2-year wave of data for each subject. The status quo scenario was based on the care that these subjects actually received. The institutional Human Subjects Protection Committee exempted this study.
Recommended Care Processes and Treatment Goals
Recommended care processes, timeframes for providing this care, and treatment goals were drawn from The Seventh Report of the Joint National Committee on Prevention, Detection, Evaluation, and Treatment of High Blood Pressure (“JNC 7,” the principal guideline for hypertension care), current HEDIS measures, and other sources (Chobanian et al. 2003; McGlynn et al. 2003; Agency for Healthcare Research and Quality 2005; National Committee for Quality Assurance 2005; American College of Cardiology, American Heart Association, Physician Consortium for Performance Improvement 2005; Milchak et al. 2006; Arguedas, Perex, and Wright 2009; Office of Quality Performance 2009;).
Probability Tree
The probability tree characterized patients and overall patterns of blood pressure management over the 2-year study period. It enabled us to estimate rates of goal attainment and costs for each scenario, determine how costs and goal attainment vary with hypertension severity, and perform sensitivity analyses. Figure 1 includes part of the probability tree; Table 2 lists clinical parameters used in the tree.
Figure 1.
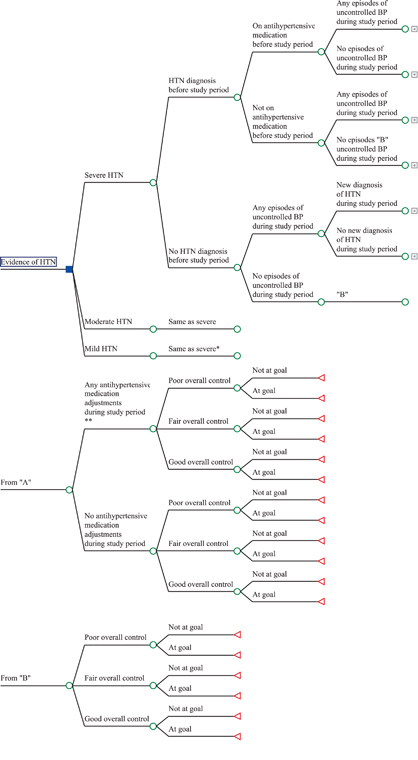
Probability Tree
Table 2.
Clinical Parameters: Base Case and Ranges for Sensitivity Analyses (SA)
| Model Parameters | Base Case | Range for SA | References |
|---|---|---|---|
| Status quo scenario: Based on 4,500 hypertensive adults from CQI study | |||
| Parameters from episodes-of-care analysis | |||
| Number of episodes-of-care per patient during study period, mean (SD)* | Ong et al. (2007), Cutler et al. (2008), Ostchega et al. (2007) | ||
| Urgency episodes per patient | 0.16 (0.55) | (a) 0.14–0.16 | |
| Stage 2 episodes per patient | 0.78 (1.10) | (a) 0.68–0.78 | |
| Stage 1 episodes per patient | 1.76 (1.16) | (a) 1.53–1.76 | |
| (b) 0.84–1.76 | |||
| At-goal episodes per patient | 0.81 (0.97) | ||
| Number of visits involving recommended care per episode, mean | Decker et al. (2009) | ||
| Urgency episodes | |||
| First visit with medication change | 0.55 | 0.55–0.825 | |
| Additional visits with medication changes | 0.09 | 0.09–0.135 | |
| Follow-up visit | 0.11 | 0.11–0.165 | |
| Stage 2 episodes | |||
| Visits with medication changes | 0.43 | 0.43–0.645 | |
| Follow-up visit | 0.10 | 0.10–0.15 | |
| Stage 1 episodes | |||
| Visits with medication changes | 0.27 | 0.27–0.41 | |
| Visits with only lifestyle counseling | 0.19 | 0.19–0.29 | |
| Follow-up visit | 0.05 | 0.05–0.08 | |
| At-goal episodes | |||
| Follow-up visit | 0.28 | 0.28–0.42 | |
| Parameters in probability tree† | |||
| Underlying severity of hypertension | |||
| Severe, N (%) | 329 (7) | ||
| Moderate, N (%) | 1,291 (29) | ||
| Mild, N (%) | 2,880 (64) | ||
| Diagnosis of hypertension before study period, N (%) | 2,875 (64) | ||
| Elevated BP at two visits in study period but no diagnosis before study period, N (%) | 1,625 (36) | ||
| New diagnosis during study period, N (%) | 379 (23) | ||
| No new diagnosis during study period, N (%) | 1,246 (77) | ||
| Treatment with antihypertensive medications before study period, N (% of those diagnosed) | 1,102 (38) | ||
| Any episodes of care involving BP above goal, N (%) | 4,184 (93) | ||
| Any medication adjustments during study period among those with episodes of care involving BP above goal, N (%) | 2,132 (51) | ||
| Systolic and diastolic blood pressures over 2 years, mean (SD) | 138/82 (12.2/7.6) | ||
| Overall control over 2 years | |||
| Poor, N (%) | 281 (6.2) | ||
| Fair, N (%) | 1,002 (22) | ||
| Good, N (%) | 3,217 (71) | ||
| Supplemental analysis of hospitalizations | |||
| Hospitalizations for BP per patient over 2 years | 0.014 | Appendix SA2 | |
| Improved care scenario: Parameters from status quo scenario adjusted to reflect 100% provision of recommended care processes for hypertension | |||
| Parameters from episodes-of-care analysis | |||
| Number of episodes-of-care per patient during study period | |||
| Urgency episodes per patient | 0.09 | (a) 0.08–0.14 | |
| (c) 0.08–0.16 | |||
| Stage 2 episodes per patient | 0.49 | (a) 0.43–0.49 | |
| (c) 0.47–1.76 | |||
| Stage 1 episodes per patient | 1.59 | (a) 1.38–1.99 | |
| (b) 0.76–1.59 | |||
| (c) 1.59–1.76 | |||
| At-goal episodes per patient | 1.05 | (a) 1.05–1.31 | |
| (c) 0.81–1.10 | |||
| Number of visits involving recommended care per episode | |||
| Urgency episodes | |||
| First visit with medication change | 1 | 1–2 | |
| Additional visits with medication changes | 1.5 | 1–3 | |
| Follow-up visit | 1 | 0.5–1.5 | |
| Stage 2 episodes | |||
| Visits with medication changes | 1.5 | 1–3 | |
| Follow-up visit | 1 | 0.5–1.5 | |
| Stage 1 episodes | |||
| Visits with medication changes | 0.75 | 0.5–2 | |
| Visits with only lifestyle counseling | 0.25 | 0–1 | Horvath et al. (2008), Dickinson et al. (2006) |
| Follow-up visit | 1 | 0.5–1.5 | |
| At-goal episodes | |||
| Follow-up visits | 1 | 0.5–1.5 | |
| Parameters in probability tree | |||
| Decline in mean systolic and diastolic blood pressures from status quo to improved care scenario | Law, Morris, and Wald (2009), Law et al. (2003), Jamerson et al. (2007), Walsh et al. (2006), Roumie et al. (2006), Horvath et al. (2008), Dickinson et al. (2006), Wu et al. (2005), Turnbull et al. (2008), Messerli, Williams, and Ritz (2007), Heran et al. (2008a, b), Fahey, Schroeder, and Ebrahim (2006), Wiysonge et al. (2007), Bonds et al. (2009) | ||
| Severe hypertension, decline in mmHg | 12.4/6.8 | 0–24.9/0–13.7 | |
| Moderate hypertension, decline in mmHg | 8.0/5.0 | 0–12.4/0–6.8 | |
| Mild hypertension, decline in mmHg | 3.5/1.5 | 0–8.0/0–5.0 | |
| Systolic and diastolic blood pressures over 2 years, mean (SD) | 132/79 (10.5/6.5) | ||
| Overall control over 2 years | |||
| Poor, N (%) | 53 (1.2) | ||
| Fair, N (%) | 333 (7.4) | ||
| Good, N (%) | 4,114 (91) | ||
| Supplemental analysis of hospitalizations | |||
| Hospitalizations for BP per patient over 2 years | 0.008 | Appendix SA2 | |
Ranges used in sensitivity analyses: (a) temporal improvements in control rates may affect the number of episodes per patient, (b) definition of a stage 1 episode changed to two blood pressures in that range during the 120 days of the episode, and (c) range associated with decline in blood pressure from status quo to improved care.
Parameters in probability tree: The table displays averages for the population as a whole. Parameters used in the probability tree were based on averages for patients in a particular branch. An example of data pertaining to a single branch is provided in Appendix SA2, as well as frequencies for each branch in the tree.
CQI study, Community Quality Index study.
“Underlying severity of hypertension” was the first branch point in the tree because it is an intrinsic characteristic of individuals' hypertension that influences goal attainment and costs. Determining severity for each patient required us to address two issues. First, blood pressure can vary substantially from visit to visit; therefore, severity should be based on multiple measurements. Second, blood pressure reflects both underlying severity and the adequacy of treatment; therefore, we needed to distinguish these two effects. A hierarchical linear regression model (HLM) addressed these issues. We fit the HLM using subjects' mean arterial pressures (MAPs) from individual visits during the 2-year period. A person-level random-effects coefficient accounted for blood pressure variability over time. A variable representing treatment with antihypertensive medications enabled us to predict what each subject's average MAP would have been without treatment. Mild hypertension was defined as an average untreated MAP <106 mmHg (<96 mmHg for diabetes mellitus), moderate was 106–119 mmHg (96–119 mmHg for diabetes mellitus), and severe was ≥120 mmHg (categories correspond to JNC 7 at-goal, stage 1, and stage 2 ranges, respectively).
“Overall control during the study period,” the second-to-last branch, linked our analysis of episodes of hypertension care (explained below) to the probability tree. We defined overall control as the MAP with treatment, averaged over the entire 2-year study period. For the status quo scenario, the HLM predicted this parameter for each subject. Then, using the same blood pressure thresholds as for underlying severity, we classified each subject's overall control as good, fair, or poor and sorted subjects to corresponding branches in the tree. Finally, for each of these branches, we created a table listing the results of the episodes-of-care analysis for subjects in that branch.
“Attainment of treatment goals during the study period,” the final branch in the tree and main outcome measure, was defined as having both systolic and diastolic pressures, averaged over the study period, within the at-goal ranges listed in Table 1. We selected this outcome measure, rather than overall control, because it enabled us to determine the cost-effectiveness of improving adherence to HEDIS measures, a metric of potential interest to payers.
Table 1.
Definitions of Episodes of Hypertension Care, Recommended Care Processes, and Visits for Recommended Care
| Episode Type | Initial BP | Definition of Episode | Care Processes Recommended to Occur during Episode* | Types of Visits Associated with Receipt of Recommended Care Processes |
|---|---|---|---|---|
| Urgency | SBP ≥ 180 or DBP ≥ 120 | A single blood pressure in the urgency range and all subsequent measurements of equal or lower stage within 28 days. | 1. Antihypertensive medications should be initiated or adjusted within 7 days | 1. Urgency visit with medication changes |
| 2. Additional (nonurgency) visit with medication changes (some patients may have more than one visit for medication changes | ||||
| 2. After such medication changes, blood pressure should be reassessed within 14 days | 3. Follow-up visit | |||
| Stage 2 | SBP ≥ 160–179or DBP ≥ 100–120 | A single blood pressure in the stage 2 range and all subsequent measurements of equal or lower stage within 60 days. | 1. Antihypertensive medications should be initiated or adjusted within 28 days | 1. Visit with medication changes |
| 2. After such medication changes, blood pressure should be reassessed within 28 days | 2. Follow-up visit | |||
| Stage 1 | SBP ≥ 140–159 orDBP ≥ 90–100 With diabetes mellitus, SBP ≥ 130–159 orDBP ≥ 80–100 | A single blood pressure in the stage 1 range and all subsequent measurements of equal or lower stage within 120 days. | 1. Antihypertensive medications should be initiated or adjusted or lifestyle counseling should be given within 60 days† | 1. Visit with medication changes (with or without counseling) |
| 2. Visit with lifestyle counseling (no medication change) | ||||
| 2. After such medication changes or counseling, blood pressure should be reassessed within 60 days | 3. Follow-up visit | |||
| At goal | SBP <140 and DBP <90 with diabetes mellitus; SDP <130 and DBP <80 | A single blood pressure in the at-goal range and all subsequent measurements of the same stage within 180 days | Blood pressure should be reassessed within 180 days | Follow-up visit |
These recommended care processes are intended to be minimum standards; therefore, when the Seventh Report of the Joint National Committee on Prevention, Detection, Evaluation, and Treatment of High Blood Pressure (JNC 7) provides a range for when care should occur, we used the longest time period.
In sensitivity analyses, we considered the effect of recommended medication changes and counseling being based on two, rather than one, blood pressure in the stage 1 range.
DBP, diastolic blood pressure; SBP, systolic blood pressure.
Sources. Chobanian et al. 2003; Agency for Healthcare Research and Quality 2005; American College of Cadiology, American Heart Association, Physician Consortium for Performance Improvement 2005; National Committee for Quality Assurance 2005; Milchak et al. 2006; Arguedas, Perez, and Wright 2009; Office of Quality Performance 2009.
Episodes-of-Care Analysis
While the tree's 2-year timeframe is appropriate for examining overall patterns of care, JNC 7 recommends responding to individual blood pressure measurements within weeks to months. Consequently, analyzing multiple brief episodes of care for each subject enabled us to determine when he/she should have received recommended care processes, when he/she did receive them, and what types and numbers of outpatient visits were associated with providing the recommended care.
JNC 7 classifies blood pressure into four categories: urgency, stage 2, stage 1, and at goal. In response to individual blood pressure measurements, the guideline recommends treatment and follow-up within specific time frames, depending on the degree of elevation. Corresponding to the four JNC 7 categories, we defined four types of episodes of hypertension care (Table 1). During the 2-year study period, each patient could experience multiple episodes of different types. Each episode began with an initial blood pressure measurement, ended 28–180 days later, and encompassed all pressures of equal or lower stage within that period. The initial blood pressure determined the episode type, recommended care processes, and the types of visits for recommended care. We identified episodes in order of descending severity so that all instances of poorly controlled pressure would be counted among the episodes.
The episodes-of-care analysis enabled us to account for three factors that vary over time: the frequency of blood pressure measurement, blood pressure itself, and recommended care processes. For example, consider an individual with one stage 2 pressure and two stage 1 pressures within a 2-week period but otherwise adequate control. The three elevated pressures may share a common cause (e.g., recent medication nonadherence) and should be managed as one clinical event (i.e., with prompt counseling or medication adjustment and follow-up); therefore, grouping them into a single stage 2 episode makes sense.
We used the episodes-of-care analysis to create a table for each “overall control” branch in the tree. Each table listed the mean number of episodes of each type per person and the types and numbers of visits per episode. Table 2 lists parameters derived from the episodes-of-care analysis.
Improved Care Scenario
This scenario was based on the care that CQI study subjects should, ideally, have received. It involved the same methods as for the status quo scenario except that three additional steps reflected the assumption that subjects received 100 percent of recommended care processes (see Table 2).
First, for the episodes-of-care analysis, we estimated the type and number of visits per episode that would be associated with providing all recommended care processes. We assumed that each medication adjustment and follow-up assessment would entail one face-to-face visit, rather than occur by telephone or during visits for other conditions, because payment may be an incentive for providing recommended care. Sensitivity analyses considered alternative possibilities.
Second, for the probability tree, we searched PubMed for systematic reviews and meta-analyses of randomized controlled trials and quality improvement interventions to estimate how much each subject's average systolic and diastolic pressures would decline over the study period with improved care. Sensitivity analyses considered a range of plausible declines, including no change. Based on the results of this step, we determined whether each subject would now attain treatment goals and classified his/her new overall control as good, fair, or poor.
Third, we assumed that, as overall control improved, the number and stage of episodes would decline in a corresponding manner. For example, for subjects shifting from poor control in the status quo scenario to fair control in the improved care scenario, we based their new episodes-of-care patterns on patients who were under fair control in the status quo scenario. Doing so enabled us to estimate how improved control would affect the utilization of visits.
Cost Parameters
Table 3 lists cost parameters. All costs are represented in 2009 U.S. dollars without discounting.
Table 3.
Cost Parameters: Base Case Analysis and Sensitivity Analyses (SA) (2009 Dollars)
| Model Parameters | Base Case | Range for SA | References |
|---|---|---|---|
| Status quo scenario | |||
| Days of medication costs | |||
| Not on meds at study entry, after initiation | 365 | ||
| On meds at study entry, no adjustment | 730 | ||
| On meds at study entry, before Adjustment | 365 | ||
| On meds at study entry, after adjustment | 365 | ||
| Number of medications per patient per day | |||
| Not on meds at study entry, after initiation | 1.8 | 1.8–2.3 | Spranger et al. (2004), Turner et al. (2008), Jamerson et al. (2007) |
| On meds at study entry, before adjustment | 1.8 | 1.8–2.3 | |
| On meds at study entry, after adjustment | 2.3 | 2.3–2.8 | Keyhani et al. (2008) |
| Improved care scenario | |||
| Days of medication costs | 730 | ||
| Number of medications per patient per day | Law, Morris, and Wald (2009), Jamerson et al. (2007), Wu et al. (2005), Siegel, Lopez, and Meier (2007) | ||
| Severe hypertension | 3 | 2.5–3.5 | |
| Moderate hypertension | 2 | 1.5–2.5 | |
| Mild hypertension | 1 | 0.5–1.5 | |
| Adherence to medications under improved care | 100% | 60–100% | Cooper, (2009), Siegel, Lopez, and Meier (2007), Lee, Grace, and Taylor (2006) |
| Both status quo and improved care scenarios | |||
| Cost per visit (U.S.$) | Medicare Physician Fee Schedule Look-Up (2010), Fahey, Schroeder, and Ebrahim (2006), Billing Medicare for the Services of NPs and PAs (2003) | ||
| Urgency visits with medication changes, level 5 physician visit (CPT 99215) | 124.79 | 124.79 | |
| Visits with medication changes, level 4 physician visit (CPT 99214) versus nurse practitioner visit (85% of CPT 99214) | 92.33 | 78.48–92.33 | |
| Visits with only lifestyle counseling, level 3 physician visit (CPT 99213) versus dietician visit (CPT 97802) | 61.31 | 29.21–61.31 | |
| Follow-up visit, level 2 physician visit (CPT 99212) versus level 1 nurse visit (CPT 99211) | 37.15 | 18.75–37.15 | |
| Cost per medication per day (U.S.$) | |||
| Average cost per medication per patient per day based on medication expenditure data | 0.52 | 0.26–2.74 | Spranger et al. (2004), Paramore et al. (2001), Lapuerta et al. (2001), Turner et al. (2008), Jamerson et al. (2007), Lloyd-Jones et al. (2009), Hodgson and Cai (2001) |
| Average cost per medication per patient per day based on medication price information | NA | 0.09–3.51 | Kahn et al. (2008), Heidenreich et al. (2008), National Collaborating Centre for Chronic Conditions (2006) |
| Costs including minimum and maximum possible effects of medication rebates | NA | 0.44–0.52 | |
| Cost per hospitalization | 30,479 | Appendix SA2 | |
Provider Visits
For each type of visit from the episodes-of-care analysis, we assigned current procedural terminology codes based on the severity of the blood pressure elevation and the complexity of the hypertension care. We determined visit costs using the 2009 Medicare fee schedules (Physician Fee Schedule Search 2009; Medicare Physician Fee Schedule Look-Up 2010;). We assumed that physicians provided all care; sensitivity analyses considered alternatives.
Medications
To estimate medication costs, we sought a dataset that included diagnosis codes (to identify people with hypertension), drug names (to identify antihypertensive medications), and actual medication expenditures rather than prices (to account for patient nonadherence). Consequently, we obtained pharmacy claims data for 166,000 nonelderly adults with hypertension who were continuously enrolled in four health plans in Massachusetts from 2004 to 2006. We calculated total average expenditures per patient per day (see Appendix SA2) and inflated these expenditures to 2009 (U.S. Department of Labor: Bureau of Labor Statistics 1997–2007). To estimate average expenditures per medication per patient per day, we divided by an assumed number of medications per patient per day (Spranger et al. 2004; Jamerson et al. 2007; U.S. Department of Labor: Bureau of Labor Statistics 1997–2007; Turner et al. 2008;). Sensitivity analyses considered a range of medication expenditures and prices reported by prior studies (see Table 3).
Hospitalizations
Hypertensive urgency occasionally results in hospitalization. Because the CQI data did not include data on hospitalizations, we considered hospitalization costs in supplemental analyses based on published literature (see Appendix SA2). Hypertensive emergencies can lead to severe complications, such as intracranial bleeding, etc.; however, these events are rare and data on their incidence and costs are limited.
Costs and Incremental Cost-Effectiveness Ratios (ICERs)
Using the probability tree, we determined the costs and proportions of subjects attaining treatment goals for the status quo and improved care scenarios. Next, we calculated ICERs, defined as incremental costs per individual newly attaining treatment goals ([costimproved care−coststatus quo]/[proportion at goalimproved care−proportion at goalstatus quo].
Sensitivity Analyses
We varied the parameters in Tables 2 and 3; assumed uniform distributions for each parameter; and calculated costs, goal attainment, and ICERs in the R programming language.
RESULTS
Episodes of Care and Adherence to Recommended Care Processes
Table 2 includes the results of the episodes-of-care analysis for the status quo scenario. The average number of episodes per patient during the 2-year study period was 3.51, including 0.16 urgency episodes, 0.78 stage 2 episodes, 1.76 stage 1 episodes, and 0.81 at-goal episodes.
The proportions of stage 2 and urgency episodes involving recommended medication changes were 0.43–0.55, respectively. The proportion of stage 1 episodes involving recommended medication changes was 0.27 and the proportion involving lifestyle counseling was 0.19. The proportions of episodes involving recommended follow-up visits were 0.05–0.28. (Table 2 lists these results as the number of visits for recommended care processes per episode, which equates with the proportion of recommended care processes provided because we assumed each process required one visit.)
Cost-Effectiveness
In the status quo scenario, recommended care processes cost U.S.$187 per person annually (U.S.$61 for visits, U.S.$126 for medications), hospitalizations for hypertension cost U.S.$213, and the proportion of all subjects attaining treatment goals was 0.51 (Table 4). In the improved care scenario, recommended care cost U.S.$449 (U.S.$177 for visits, U.S.$272 for medications), hospitalizations cost U.S.$122, and the proportion of patients at goal rose to 0.70. Thus, relative to the status quo scenario, improved care cost payers U.S.$170 per person annually, or U.S.$1,696 per person newly attaining treatment goals over 2 years.
Table 4.
Results of Base Case Analysis: Cost-Effectiveness of Providing All Recommended Medication Adjustments and Follow-Up Visits among 4,500 Hypertensive Adults from the CQI Study
| Costs per Patient per Year (2009)* | ||||||
|---|---|---|---|---|---|---|
| Scenario | Provider Visits(U.S.$) | Medication(U.S.$) | Hospitalization(U.S.$) | Total(U.S.$) | Effectiveness over 2 Years(Proportion of PatientsAttaining Treatment Goal) | Cost-Effectiveness over Two Years(Incremental Cost Per Patient NewlyAttaining Treatment Goal) (U.S.$) |
| Severe hypertension | ||||||
| Status quo | 94.02 | 172.41 | 918.61 | 1,185.04 | 0.00 | |
| Improved care | 278.56 | 569.40 | 400.93 | 1,248.89 | 0.15 | |
| Difference | 184.54 | 396.99 | −517.68 | 63.86 | 0.15 | 850 |
| Moderate hypertension | ||||||
| Status quo | 79.72 | 143.86 | 287.32 | 510.90 | 0.08 | |
| Improved care | 164.04 | 379.60 | 131.57 | 675.21 | 0.49 | |
| Difference | 84.32 | 235.74 | −155.75 | 164.31 | 0.41 | 801 |
| Mild hypertension | ||||||
| Status quo | 49.12 | 112.89 | 106.11 | 268.12 | 0.75 | |
| Improved care | 163.63 | 189.80 | 106.11 | 459.54 | 0.86 | |
| Difference | 114.51 | 76.91 | 0 | 191.42 | 0.11 | 3,480 |
| All patients | ||||||
| Status quo | 61.17 | 126.11 | 213.35 | 400.63 | 0.51 | |
| Improved care | 176.53 | 271.99 | 121.72 | 570.24 | 0.70 | |
| Difference | 115.36 | 145.88 | −91.63 | 169.61 | 0.20† | 1,696 |
Although our study period was 2 years, we report annual costs for ease of interpretation. However, the incremental cost effectiveness ratios are based on 2 years.
Difference in proportions is 0.20 rather than 0.19 due to rounding.
CQI study, Community Quality Index study.
As underlying severity increased, the cost of improved care rose and goal attainment declined. Improved care for moderate hypertension yielded the lowest ICER (U.S.$801).
For individuals with severe hypertension, improved care yielded a slightly higher ICER (U.S.$850) because the proportion of newly attaining treatment goals was only 0.15. However, this subgroup's overall control improved substantially between the status quo (0.85 poor and 0.15 fair control) and improved care scenarios (0.16 poor, 0.60 fair, and 0.23 good control). Using a relaxed outcome measure for this subgroup, achieving fair or good control (i.e.,≤stage 1), the ICER declined to U.S.$185 ([U.S.$63.86 × 2)/[0.84–0.15]).
In sensitivity analyses (Table 5), the ICER was most affected by the cost per medication per day, the optimal number of visits for recommended care, the number of medications in the improved care scenario, and the decline in blood pressure with improved care.
Table 5.
Results of Sensitivity Analyses
| Costs per Patient per Year (2009) | |||||
|---|---|---|---|---|---|
| Scenario | Provider Visits (U.S.$) | Medication (U.S.$) | Hospitalization (U.S.$) | Effectiveness over 2 Years (Proportion of Patients Attaining Treatment Goal) | Cost-Effectiveness over 2 Years (Incremental Cost per Patient Newly Attaining Treatment Goal) (U.S.$) |
| Base case values (BCVs)* | |||||
| Status quo | 61.17 | 126.11 | 213.35 | 0.51 | |
| Improved care | 176.53 | 271.99 | 121.72 | 0.70 | 1,696 |
| Parameters from episodes-of-care analysis (fromTable 2) | |||||
| Number of episodes-of-care during study period | |||||
| Temporal improvements in control rates (see (a) in Table 2) | |||||
| Status quo | 53.63 to BCV | BCV | 186.68 to BCV | BCV | |
| Improved care | 164.61 to BCV | BCV | 69.50 to BCV | BCV | 1,397–2,018 |
| Relaxed definition of stage 1 episode (see (b) in Table 2) | |||||
| Status quo | 43.65 to BCV | BCV | BCV | BCV | |
| Improved care | 130.46 to BCV | BCV | BCV | BCV | 1,411 to BCV |
| Number of visits involving recommended care per episode | |||||
| Number in status quo | |||||
| Status quo | 61.00–91.76 | BCV | BCV | BCV | |
| Improved care | BCV | BCV | BCV | BCV | 1,390–2,698 |
| Number in improved care (reduced via alternatives to face-to-face visits) | |||||
| Status quo | BCV | BCV | BCV | BCV | |
| Improved care | 98.56–375.36 | BCV | BCV | BCV | 916–3,684 |
| Parameters in probability tree (fromTable 2) | |||||
| Decline in blood pressure from status quo to improved care | |||||
| Status quo | BCV | BCV | BCV | BCV | |
| Improved care | BCV to 213.76† | BCV | 106.79 to BCV | 0.85–0.51 | 941 to dominated‡ |
| Cost parameters (fromTable 3) | |||||
| Medications per patient per day in status quo | |||||
| Status quo | BCV | BCV to 150.18 | BCV | BCV | |
| Improved care | BCV | BCV | BCV | BCV | 1,455 to BCV |
| Medications per patient per day in improved care | |||||
| Status quo | BCV | BCV | BCV | BCV | |
| Improved care | BCV | 177.09–366.89 | BCV | BCV | 747–2,645 |
| Adherence to medications in improved care | |||||
| Status quo | BCV | BCV | BCV | BCV | |
| Improved care | 143.58 to BCV | 163.19 to BCV | 121.72–158.37 | 0.63 to BCV | 993 to BCV |
| Cost per visit (reduced via greater role of nonphysician providers) | |||||
| Status quo | 46.42 to BCV | BCV | BCV | BCV | |
| Improved care | 122.00 to BCV | BCV | BCV | BCV | 1,298 to BCV |
| Cost per medication per day | |||||
| Based on expenditures in prior studies | |||||
| Status quo | BCV | 63.06–664.50 | BCV | BCV | |
| Improved care | BCV | 136.00–1,433 | BCV | BCV | 967–7,924 |
| Based on prices in prior studies | |||||
| Status quo | BCV | 21.83–851.23 | BCV | BCV | |
| Improved care | BCV | 47.08–1,836 | BCV | BCV | 490–10,084 |
| Considering maximum versus minimum possible rebates | |||||
| Status quo | BCV | 107.19 to BCV | BCV | BCV | |
| Improved care | BCV | 231.19 to BCV | BCV | BCV | 1,477 to BCV |
| Cost of hospitalization | |||||
| Cost per person annually | |||||
| Status quo | BCV | BCV | BCV to 283.73 | BCV | |
| Improved care | BCV | BCV | BCV to 121.91 | BCV | 994 to BCV |
| Excluding hospitalization costs | BCVs | BCVs | — | BCVs | 2,612 |
Base case values (BCV) are reiterated here for comparison with sensitivity analyses. To facilitate interpretation, BCV rather than the actual value is used in subsequent cells.
This means that, if lower blood pressure reduces the number of episodes of care as assumed in the main model, this would produce a cost offset of U.S.$37.23 per person with hypertension per year; this offset is included in the results in Table 5.
Dominated: When improved care does not improve blood pressure, then no additional patients achieve goal. Approaches that are more costly and no more effective than the status quo scenario are generally referred to as dominated.
DISCUSSION
Our findings are nationally representative estimates of the short-term cost and cost-effectiveness to payers of consistently providing the basic recommended elements of blood pressure management to U.S. adults with both diagnosed and undiagnosed hypertension. These essential care processes are substantially underprovided and only half of people achieve treatment goals. We estimate that providing 100 percent of the care processes would increase health plans' expenditures by U.S.$170 per hypertensive patient annually (relative to current spending) and enable 20 percent more patients to attain treatment goals. Nationally, the cost of providing essential care processes would increase from U.S.$29.5 billion to U.S.$42 billion annually.
By focusing on the specific processes that individuals need at various times and whether those processes are provided, these estimates account for variability in the resources required to bring blood pressure under control. For example, annual costs for improved care are twofold higher for the 7 percent of patients with severe hypertension than for the 64 percent with mild hypertension. The likelihood of goal attainment varies even more because patients with severe hypertension need substantial declines in blood pressure to reach goal and many never make it. Even in successful clinical trials, 20–25 percent of patients remain uncontrolled (Jamerson et al. 2007; Law, Morris, and Wald 2009;).
The most immediate implications of these findings pertain to the HEDIS measure for hypertension (O'Kane et al. 2008; National Committee for Quality Assurance 2009;). For many patients with severe hypertension, current treatment goals may not be attainable, but even modest reductions in blood pressure substantially reduce their risk of cardiovascular events over the long term (Prospective Studies Collaboration 2002). Yet health plans can improve HEDIS scores somewhat more per dollar spent by focusing on moderate rather than severe hypertension. Although receiving recommended care would lower hospitalization costs, offsetting some of the cost of providing the recommended care, the proportion of individuals who would newly attain control is much smaller for severe than moderate hypertension. However, we found that many people with severe hypertension could attain stage 1 pressures at a much lower cost per person newly attaining goal. If HEDIS included a secondary, relaxed performance target for hypertension, as they do for diabetes mellitus and other conditions (National Committee for Quality Assurance 2005), this would give health plans a much greater incentive to improve care for severe hypertension.
In addition to HEDIS scores, health plans are also likely to be interested in how providing 100 percent of recommended care processes would affect expenditures. Currently, hypertension-related expenditures range from U.S.$736 to U.S.$1,226 per person annually (inflated to 2009 and excluding complications) (Hodgson and Cai 2001; Lapuerta et al. 2001; DeVol and Bedroussian 2007; Trogdon et al. 2007; Lloyd-Jones et al. 2009; Roehrig et al. 2009;), including U.S.$181 to U.S.$269 for provider visits and U.S.$345 to U.S.$462 for medications (Hodgson and Cai 2001; Lloyd-Jones et al. 2009;). Thus, if improving care raises expenditures by U.S.$170, this will represent a 14–23 percent increase relative to current levels.
Alternatives to traditional physician visits could attenuate the cost of improving care, however (Roumie et al. 2006; Walsh et al. 2006; Green et al. 2008; Cooper 2009; Parati et al. 2009;). The most effective quality improvement interventions for hypertension shift tasks from physicians to other providers (Walsh et al. 2006). Such shifts would reduce the cost of improved care by U.S.$55 (i.e., from U.S.$170 to U.S.$115). Telecommunication of home blood pressures to physicians also improves control (Parati et al. 2009), and electronic messaging between physicians and patients can reduce primary care visits (Chen et al. 2009). With physicians handling about half of recommended care processes electronically, the cost of improved care would decline by U.S.$78 (i.e., from U.S.$170 to U.S.$92).
Compared with provider visits, medications influence the cost of improved care more. We used actual medication expenditures, rather than average wholesale prices, to account for negotiated price discounts and patient nonadherence. Our sensitivity analyses considered 38-fold variations in prices from published literature, which produced 20.6-fold variations in the total cost of improved care. Although we did not quantify the effects of the ongoing shifts toward generic medications and combination pills, most generic and brand prices likely fall within the range that we considered.
Lower blood pressures would also affect the cost of improved care. The number of medication adjustments and follow-up visits needed would decline as control improves, which saves U.S.$37 per person annually (i.e., without this, improved care would cost U.S.$207 rather than U.S.$170). Additionally, declines in hospitalizations for hypertensive urgency would reduce costs per hypertensive individual by U.S.$92 (included in our base case estimate of U.S.$170) to U.S.$162 annually. Including these offsets and the alternative strategies for providing care, the incremental cost of improved care would range from U.S.$21 to U.S.$114 per person annually, or U.S.$1.5 to U.S. $8.4 billion annually for the 73.6 million U.S. adults who have hypertension (Lloyd-Jones et al. 2009).
Whereas health plans may be interested in expenditures per patient attaining HEDIS goals, policy makers may wonder how improving care would affect cost-effectiveness over the longer term. However, this raises a limitation of the CQI data: being cross-sectional rather than longitudinal, it does not include long-term outcomes such as myocardial infarction and stroke (Mullins, Blak, and Akhras 2002). Although the data were well suited to estimating cost-effectiveness from the payer perspective, estimating long-term outcomes and cost-offsets required extrapolation from published literature. We addressed this issue by examining recent publications on the effectiveness and cost-effectiveness of attaining treatment goals for hypertension (Eddy et al. 2008; Kahn et al. 2008;); and by performing limited analyses of potential changes in clinical outcomes and cost-offsets over 10 years.
Kahn and colleagues recently used the Archimedes model to determine the cost-effectiveness of ensuring that 75 percent of hypertensive patients attain HEDIS treatment goals over 30 years. Relative to current care, ICERs were U.S.$61,575 per quality adjusted life year (QALY) for nondiabetics and U.S.$29,423 for diabetics (inflated to 2009), within desirable ranges. However, Kahn et al. (2008) lacked data on the cost of improving care and, therefore, assumed that the cost would be U.S.$1,787 per patient annually (inflated to 2009). Our detailed analysis of care processes suggests that the cost could be as low as U.S.$21–U.S.$170. We estimated that 70 percent of hypertensive patients would attain treatment goals with basic recommended care, a slightly lower percentage. Because these differences from the Kahn study reduce both costs and effectiveness, we cannot predict the net effect on the long-term cost-effectiveness ratios. Earlier studies have demonstrated that, in general, blood pressure management can be cost saving for elderly patients at high risk of cardiovascular events and is more cost-effective for severe than moderate hypertension (Brown and Garber 2000; Krumholz et al. 2002; Montgomery et al. 2003;). Consequently, improving care relative to current levels might also be cost saving for higher risk groups over the long term.
We used two alternative methods to estimate the potential clinical benefits associated with providing 100 percent of recommended care processes for hypertension over 10 years (Appendix SA2). Extrapolating from the recent study by Eddy and colleagues, providing 100 percent of recommended care processes for hypertension could prevent 139,000 myocardial infarctions, 73,000 coronary heart deaths, and 259,000 strokes. Extrapolating from Framingham risk calculators and recent meta-analyses instead, such improvements could prevent 609,000 myocardial infarctions and 2,000,000 strokes. Although imprecise, these estimates indicate that the potential long-term benefits of improved care are substantial.
Because myocardial infarctions and strokes generate substantial costs (Lloyd-Jones et al. 2009), improved hypertension control over 10 years could generate large cost-offsets. Considering the cost of hospitalizations for myocardial infarction and stroke, we estimate that the potential cost-offsets associated with improved care are at least U.S.$231–U.S.$1,186 per person with hypertension over 10 years (Appendix SA2). Thus, the net incremental cost of improved care could range from −U.S.$98 (i.e., cost saving) to U.S.$91 per person annually. Cost-offsets could be much greater if outpatient medical care costs and the indirect costs borne by patients and their employers were considered (Grover et al. 2003).
Despite these optimistic estimates of the potential benefits, quality improvement programs have had variable success at controlling blood pressure (Agency for Healthcare Research and Quality 2005; Walsh et al. 2006; Cooper 2009;). Primary care physicians lack sufficient time to provide all care that guidelines recommend for common chronic diseases, let alone acute and preventive care (Østbye et al. 2005). Existing fee schedules reward some services, such as performing procedures, more than follow-up visits. Many practices lack the infrastructure to manage chronic diseases. Attaining the improvements in care processes considered by our analysis would, therefore, require a concerted and multifaceted effort. A national effort to improve care for hypertension in Canada did succeed at substantially reducing deaths and hospitalizations due to myocardial infarction, stroke, and heart failure (Campbell et al. 2009).
Our analysis has several limitations. First, we set arbitrary cut-points to assess hypertension outcomes. In reality, blood pressure and costs may vary substantially across patients within each outcome category. Also, while we used outcome measures that reflect the current standard of care, the optimal blood pressure target may vary across patients depending on their other cardiovascular risk factors. For example, 2007 guidelines from the European Society of Hypertension and European Society of Cardiology explicitly consider such risk factors in both diagnosing hypertension and setting treatment goals (Mancia et al. 2007).
Second, since the CQI study began, blood pressure control has improved in the United States and hypertension-related visits have risen (Chobanian et al. 2003; Ostchega et al. 2008; Decker, Schappert, and Sisk 2009;). However, our rates of blood pressure control for the status quo scenario actually appear higher than reported in the most recent National Health and Nutrition Examination Survey (NHANES). This is likely due to the fact that we averaged blood pressure over a 2-year period, whereas the NHANES used a single examination. Averaging multiple blood measurements reduces the possibility of misclassification due to spurious values. In addition, our sensitivity analyses considered utilization trends. Third, the CQI data do not include factors that providers consider when determining whether medication adjustments are warranted (Safford et al. 2007; Heisler et al. 2008; Holland et al. 2008; Kerr et al. 2008;). For example, some authors argue that adjusting medications is mainly appropriate when patients are adherent (Heisler et al. 2008), while others describe how simplifying dosing schedules improves adherence (Law et al. 2003; Schroeder, Fahey, and Ebrahim 2004; Osterberg and Blaschke 2005;). Two sensitivity analyses addressed the cost implications of these debates: basing stage 1 episodes on two elevated pressures rather than one, and varying the optimal number of medication adjustment visits per episode. Fourth, we based physician visit costs on the Medicare fee schedule; for office visits, private health plans generally pay about 104 percent of what Medicare does (Bodenheimer, Berenson, and Rudolf 2007). Fifth, estimating hospitalization costs related to hypertensive urgency involved published data as well as multiple assumptions; however, omitting hospitalization costs would bias our estimates. Finally, we did not include costs relating to the infrastructure of quality improvement programs because they have seldom been described (Walsh et al. 2006).
In conclusion, ensuring that patients with hypertension receive recommended care processes could improve control and would increase health care expenditures in the short term. Alternatives to traditional physician visits and lower medication costs would attenuate these costs. HEDIS and other quality improvement initiatives that monitor the attainment of a single treatment goal create modest short-term financial incentives to focus on individuals with moderate hypertension, potentially to the detriment of those with severe hypertension. Adding a higher, secondary goal would substantially increase the incentive to manage severe hypertension. Over the long-term, attaining treatment goals for hypertension can be cost-effective and prevent many cardiovascular events, and it might be cost saving to payers. The cost of improving the quality of care processes should be assessed for other conditions.
Acknowledgments
Joint Acknowledgment/Disclosure Statement: Steven M. Asch, M.D., M.P.H.; Paul Shekelle, M.D., Ph.D.; David O. Meltzer, M.D., Ph.D.; and Gene Oppeneheim, M.D. provided assistance with the development of the probability trees. By contractual agreement with the funder, the National Pharmaceutical Council, RAND had complete control over the design and conduct of the study; the collection, management, analysis, and interpretation of the data; and the reporting of results. Teryl K. Nuckols is currently supported by a Mentored Clinical Scientist Career Development Award (K08) from the Agency for Healthcare Research and Quality (grant number HS17954).
Disclosures: None.
Disclaimers: None.
SUPPORTING INFORMATION
Additional supporting information may be found in the online version of this article:
Appendix SA1: Author Matrix.
Appendix SA2: Additional Details.
Please note: Wiley-Blackwell is not responsible for the content or functionality of any supporting materials supplied by the authors. Any queries (other than missing material) should be directed to the corresponding author for the article.
REFERENCES
- Agency for Healthcare Research and Quality. 2005. Closing the Quality Gap: A Critical Analysis of Quality Improvement Strategies: Volume 3—Hypertension Care” [accessed on June 17, 2010]. Available at http://www.arhq.gov/clinic/tp/hypergap3tp.htm. [DOI] [PubMed]
- American College of Cadiology, American Heart Association, Physician Consortium for Performance Improvement. 2005. Clinical Performance Measures: Hypertension” [accessed on June 17, 2010]. Available at http://www.americanheart.org/presenter.jhtml?identifier=3012905.
- Andrade SE, Gurwitz JH, Field TS, Kelleher M, Majumdar SR, Reed G, Black R. Hypertension Management: The Care Gap between Clinical Guidelines and Clinical Practice. American Journal of Managed Care. 2004;10(7, part 2):481–6. [PubMed] [Google Scholar]
- Arguedas JA, Perez MI, Wright JM. Treatment Blood Pressure Targets for Hypertension. Cochrane Database of Systematic Reviews. 2009;8 doi: 10.1002/14651858.CD004349.pub2. no. 3: CDOO4349. [DOI] [PubMed] [Google Scholar]
- Berlowitz DR, Ash AS, Hickey EC, Friedman RH, Glickman M, Kader B, Moskowitz MA. Inadequate Management of Blood Pressure in a Hypertensive Population. New England Journal of Medicine. 1998;339(27):1957–63. doi: 10.1056/NEJM199812313392701. [DOI] [PubMed] [Google Scholar]
- Bodenheimer T, Berenson RA, Rudolf P. The Primary Care—Specialty Income Gap: Why it Matters. Annals of Internal Medicine. 2007;146:301–6. doi: 10.7326/0003-4819-146-4-200702200-00011. [DOI] [PubMed] [Google Scholar]
- Bonds DE, Hogan PE, Bertoni AG, Chen H, Clinch CR, Hiott AE, Rosenberger EL, Goff DC. A Multifaceted Intervention to Improve Blood Pressure Control: The Guideline Adherence for Heart Health (GLAD) Study. American Heart Journal. 2009;157(2):278–84. doi: 10.1016/j.ahj.2008.09.021. [DOI] [PMC free article] [PubMed] [Google Scholar]
- Brook RH, McGlynn EA, Cleary PD. Quality of Health Care. Part 2: Measuring Quality of Care. New England Journal of Medicine. 1996;335(13):966–70. doi: 10.1056/NEJM199609263351311. [DOI] [PubMed] [Google Scholar]
- Brown AI, Garber AM. A Concise Review of the Cost-Effectiveness of Coronary Heart Disease Prevention. Medical Clinics of North America. 2000;84(1):279–97. doi: 10.1016/s0025-7125(05)70219-4. xi. [DOI] [PubMed] [Google Scholar]
- Burke MR. Billing Medicare for the Services of NPs and PAs.”Physician' News Digest 2003 [accessed on February 9, 2010]. Available at http://www.physiciansnews.com/business/403burke.html.
- Campbell NR, Brant R, Johansen H, Walker RL, Wielgosz A, Onysko J, Gao RN, Sambell C, Phillips S, McAlister FA, Canadian Hypertension Education Program Outcomes Research Task Force Increases in Antihypertensive Prescriptions and Reductions in Cardiovascular Events in Canada. Hypertension. 2009;53(2):128–34. doi: 10.1161/HYPERTENSIONAHA.108.119784. [DOI] [PubMed] [Google Scholar]
- Chen C, Garrido T, Chock D, Okawa G, Liang L. The Kaiser Permanente Electronic Health Record: Transforming and Streamlining Modalities of Care. Health Affiliation (Millwood) 2009;28(2):323–33. doi: 10.1377/hlthaff.28.2.323. [DOI] [PubMed] [Google Scholar]
- Chobanian AV, Bakris GL, Black HR, Cushman WC, Green LA, Izzo, Jr JL, Jones DW, Materson BJ, Oparil S, Wright JT, Jr, Roccella EJ, Detection Joint National Committee on Prevention, Evaluation, and Treatment of High Blood Pressure, Lung National Heart and Blood Institute, and National High Blood Pressure Education Program Coordinating Committee Seventh Report of the Joint National Committee on Prevention, Detection, Evaluation, and Treatment of High Blood Pressure. Hypertension. 2003;42(6):1206–52. doi: 10.1161/01.HYP.0000107251.49515.c2. [DOI] [PubMed] [Google Scholar]
- Cooper LA. A 41-Year-Old African American Man with Poorly Controlled Hypertension: Review of Patient and Physician Factors Related to Hypertension Treatment Adherence. Journal of the American Medical Association. 2009;301(12):1260–72. doi: 10.1001/jama.2009.358. [DOI] [PMC free article] [PubMed] [Google Scholar]
- Cunningham PJ. Health Plan Switching: Choice or Circumstance? Health Affiliation. 2000;19(3):158–64. doi: 10.1377/hlthaff.19.3.158. [DOI] [PubMed] [Google Scholar]
- Cutler JA, Sorlie PD, Wolz M, Thom T, Fields LE, Roccella EJ. Trends in Hypertension Prevalence, Awareness, Treatment, and Control Rates in United States Adults between 1988–1994 and 1999–2004. Hypertension. 2008;52(5):818–27. doi: 10.1161/HYPERTENSIONAHA.108.113357. [DOI] [PubMed] [Google Scholar]
- Decker SL, Schappert SM, Sisk JE. Use of Medical Care for Chronic Conditions. Health Affiliation (Millwood) 2009;28(1):26–35. doi: 10.1377/hlthaff.28.1.26. [DOI] [PubMed] [Google Scholar]
- DeVol R, Bedroussian A. An Unhealthy America: The Economic Burden of Chronic Disease. Santa Monica, CA: Milken Institute; 2007. [Google Scholar]
- Dickinson HO, Mason JM, Nicolson DJ, Cambell F, Beyer FR, Cook JV, Williams B, Ford GA. Lifestyle Interventions to Reduce Raised Blood Pressure: A Systematic Review of Randomized Controlled Trials. Journal of Hypertension. 2006;24(2):215–33. doi: 10.1097/01.hjh.0000199800.72563.26. [DOI] [PubMed] [Google Scholar]
- Eddy DM, Pawlson LG, Schaaf D, Peskin B, Scheprov A, Dziuba J, Bowman J, Eng B. The Potential Effects of HEDIS Performance Measures on the Quality of Care. Health Affiliation (Millwood) 2008;27(5):1429–41. doi: 10.1377/hlthaff.27.5.1429. [DOI] [PubMed] [Google Scholar]
- Fahey T, Schroeder K, Ebrahim S. Interventions Used to Improve Control of Blood Pressure in Patients with Hypertension. Cochrane Database of Systematic Reviews. 2006 doi: 10.1002/14651858.CD005182.pub2. no. 4: CD005182. [DOI] [PubMed] [Google Scholar]
- Green BB, Cook AJ, Ralston JD, Fishman PA, Cartz SL, Carlson J, Carrell D, Tyll L, Larson EB, Thompson RS. Effectiveness of Home Blood Pressure Monitoring, Web Communication, and Pharmacist Care on Hypertension Control: A Randomized Controlled Trial. Journal of the American Medical Association. 2008;299(24):2857–67. doi: 10.1001/jama.299.24.2857. [DOI] [PMC free article] [PubMed] [Google Scholar]
- Grover SA, Ho V, Lavoie F, Coupal L, Zowall H, Pilote L. The Importance of Indirect Costs in Primary Cardiovascular Disease Prevention Can We Save Lives and Money with Statins? Achieves of Internal Medicine. 2003;163:333–9. doi: 10.1001/archinte.163.3.333. [DOI] [PubMed] [Google Scholar]
- Heidenreich PA, Davis BR, Cutler JA, Furberg CD, Lairson DR, Shlipak MG, Pressel SL, Nwachuku C, Goldman L. Cost-Effectiveness of Chlorthalidone, Amlodipine, and Lisinopril as First-Step Treatment for Patients with Hypertension: An Analysis of the Antihypertensive and Lipid-Lowering Treatment to Prevent Heart Attack Trial (ALLHAT) Journal of General Internal Medicine. 2008;23(5):509–16. doi: 10.1007/s11606-008-0515-2. [DOI] [PMC free article] [PubMed] [Google Scholar]
- Heisler M, Hogan MM, Hofer TP, Schmittdiel JA, Pladevall M, Kerr EA. When More Is Not Better: Treatment Intensification among Hypertensive Patients with Poor Medication Adherence. Circulation. 2008;117(22):2884–92. doi: 10.1161/CIRCULATIONAHA.107.724104. [DOI] [PubMed] [Google Scholar]
- Heran BS, Wong MM, Heran IK, Wright JM. Blood Pressure Lowering Efficacy of Angiotensin Converting Enzyme (ACE) Inhibitors for Primary Hypertension. Cochrane Database of Systematic Reviews. 2008a doi: 10.1002/14651858.CD003823.pub2. no. 4: CD003823. [DOI] [PMC free article] [PubMed] [Google Scholar]
- Heran BS. Blood Pressure Lowering Efficacy of Angiotensin Receptor Blockers for Primary Hypertension. Cochrane Database of Systematic Reviews. 2008b doi: 10.1002/14651858.CD003822.pub2. no. 4: CD003822. [DOI] [PMC free article] [PubMed] [Google Scholar]
- Hodgson TA, Cai L. Medical Care Expenditures for Hypertension, its Complications, and its Comorbidities. Medical Care. 2001;39(6):599–615. doi: 10.1097/00005650-200106000-00008. [DOI] [PubMed] [Google Scholar]
- Holland N, Segraves D, Nnadi VO, Belletti DA, Wogen J, Arcona S. Identifying Barriers to Hypertension Care: Implications for Quality Improvement Initiatives. Disease Management. 2008;11(2):71–7. doi: 10.1089/dis.2008.1120007. [DOI] [PubMed] [Google Scholar]
- Horvath K, Jeitler K, Siering U, Stich AK, Skipka G, Gratzer TW, Siebenhofer A. Long-Term Effects of Weight-Reducing Interventions in Hypertensive Patients: Systematic Review and Meta-Analysis. Achieves of Internal Medicine. 2008;168(6):571–80. doi: 10.1001/archinte.168.6.571. [DOI] [PubMed] [Google Scholar]
- Jamerson K, Bakris GL, Dahlöf B, Pitt B, Velazquez E, Gupte J, Lefkowitz M, Hester A, Shi V, Kjeldsen SE, Cushman W, Papademetriou V, Weber M, ACCOMPLISH Investigators Exceptional Early Blood Pressure Control Rates: The ACCOMPLISH Trial. Blood Pressure. 2007;16(2):80–6. doi: 10.1080/08037050701395571. [DOI] [PubMed] [Google Scholar]
- Kahn R, Robertson RM, Smith R, Eddy D. The Impact of Prevention on Reducing the Burden of Cardiovascular Disease. Diabetes Care. 2008;31(8):1686–96. doi: 10.2337/dc08-9022. [DOI] [PMC free article] [PubMed] [Google Scholar]
- Kerr EA, Zikmund-Fisher BJ, Klamerus ML, Subramanian U, Hogan MM, Hofer TP. The Role of Clinical Uncertainty in Treatment Decisions for Diabetic Patients with Uncontrolled Blood Pressure. Annals of Internal Medicine. 2008;148(10):717–27. doi: 10.7326/0003-4819-148-10-200805200-00004. [DOI] [PubMed] [Google Scholar]
- Keyhani S, Scobie JV, Hebert PL, McLaughlin MA. Gender Disparities in Blood Pressure Control and Cardiovascular Care in a National Sample of Ambulatory Care Visits. Hypertension. 2008;51(4):1149–55. doi: 10.1161/HYPERTENSIONAHA.107.107342. [DOI] [PubMed] [Google Scholar]
- Krumholz HM, Weintraub WS, Bradford WD, Heidenreich PA, Mark DB, Paltiel AD. Task Force #2—the Cost of Prevention: Can We Afford it? Can We Afford Not to Do It? 33rd Bethesda Conference. Journal of the American College of Cardiology. 2002;40(4):603–15. doi: 10.1016/s0735-1097(02)02083-1. [DOI] [PubMed] [Google Scholar]
- Lapuerta P, Simon T, Smitten A, Caro J CHOICE Study Group. Caring for Hypertension on Initiation: Costs and Effectiveness. Assessment of the Association between Blood Pressure Control and Health Care Resource Use. Clinical Therapeutics. 2001;23(10):1773–82. doi: 10.1016/s0149-2918(01)80143-0. [DOI] [PubMed] [Google Scholar]
- Law MR, Morris JK, Wald NJ. Use of Blood Pressure Lowering Drugs in the Prevention of Cardiovascular Disease: Meta-Analysis of 147 Randomised Trials in the Context of Expectations from Prospective Epidemiological Studies. British Medical Journal. 2009;338:1–19. doi: 10.1136/bmj.b1665. [DOI] [PMC free article] [PubMed] [Google Scholar]
- Law MR, Wald NJ, Morris JK, Jordan RE. Value of Low Dose Combination Treatment with Blood Pressure Lowering Drugs: Analysis of 354 Randomised Trials. British Medical Journal. 2003;326(7404):1427–31. doi: 10.1136/bmj.326.7404.1427. [DOI] [PMC free article] [PubMed] [Google Scholar]
- Lee JK, Grace KA, Taylor AJ. Effect of a Pharmacy Care Program on Medication Adherence and Persistence, Blood Pressure, and Low-Density Lipoprotein Cholesterol: A Randomized Controlled Trial. Journal of the American Medical Association. 2006;296(21):2563–71. doi: 10.1001/jama.296.21.joc60162. [DOI] [PubMed] [Google Scholar]
- Lloyd-Jones D, Adams R, Carnethon M, De Simone G, Ferguson TB, Flegal K, Ford E, Furie K, Go A, Greenlud K, Haase N, Hailpern S, Ho M, Howard V, Kissela B, Kittner S, Lackland D, Lisabeth L, Marelli A, McDermott M, Meigs J, Mozaffarian D, Nichol G, O'Donnell C, Roger V, Rosamond W, Sacco R, Sorlie P, Stafford R, Steinberger J, Thom T, Wasserthiel-Smoller S, Wong N, Wyle-Rosett J, Hong Y, American Heart Association Statistics Committee and Stroke Statistics Subcommittee Heart Disease and Stroke Statistics—2009 Update: A Report from the American Heart Association Statistics Committee and Stroke Statistics Subcommittee. Circulation. 2009;119(3):e21–181. doi: 10.1161/CIRCULATIONAHA.108.191261. [DOI] [PubMed] [Google Scholar]
- Mancia G, De Backer G, Dominiczak A, Cifkova R, Fagard R, Germano G, Grassi G, Heagerty AM, Kjeldsen SE, Laurent S, Narkiewicz K, Ruilope L, Rynkiewicz A, Schmieder RE, Boudier HA, Zanchetti A, Vahanian A, Camm J, De Caterina R, Dean V, Dickstein K, Filippatos G, Funck-Brentano C, Hellemans I, Kristensen SD, McGregor K, Sechtem U, Silber S, Tendera M, Widimsky P, Zamorano JL, Erdine S, Kiowski W, Agabiti-Rosei E, Ambrosioni E, Lindholm LH, Viigimaa M, Adamopoulos S, Bertomeu V, Clement D, Farsang C, Gaita D, Lip G, Mallion JM, Manolis AJ, Nilsson PM, O'Brien E, Ponikowski P, Redon J, Ruschitzka F, Tamargo J, van Zwieten P, Waeber B, Williams B. 2007 Guidelines for the Management of Arterial Hypertension: The Task Force for the Management of Arterial Hypertension of the European Society of Hypertension (ESH) and of the European Society of Cardiology (ESC) Journal of Hypertension. 2007;25(6):1105–87. doi: 10.1097/HJH.0b013e3281fc975a. [DOI] [PubMed] [Google Scholar]
- McGlynn EA, Asch SM, Adams J, Keesey J, Hicks J, DeCristofaro A, Kerr EA. The Quality of Health Care Delivered to Adults in the United States. New England Journal of Medicine. 2003;348(26):2635–45. doi: 10.1056/NEJMsa022615. [DOI] [PubMed] [Google Scholar]
- Medicare Physician Fee Schedule Look-Up. 2010. [accessed on February 9, 2010]. Available at http://www.cms.hhs.gov/PFSlookup/
- Messerli FH, Williams B, Ritz E. Essential Hypertension. Lancet. 2007;370(9587):591–603. doi: 10.1016/S0140-6736(07)61299-9. [DOI] [PubMed] [Google Scholar]
- Milchak JL, Carter BL, Ardery G, Black HR, Bakris GL, Jones DW, Kreiter CD. Development of Explicit Criteria to Measure Adherence to Hypertension Guidelines. Journal of Human Hypertension. 2006;20(6):426–33. doi: 10.1038/sj.jhh.1002005. [DOI] [PMC free article] [PubMed] [Google Scholar]
- Milchak JL, Carter BL, Ardery G, Dawson JD, Harmston M, Franciscus CL, Detection Joint National Committee on Prevention, Evaluation, and Treatment of High Blood Pressure Physician Adherence to Blood Pressure Guidelines and Its Effect on Seniors. Pharmacotherapy. 2008;28(7):843–51. doi: 10.1592/phco.28.7.843. [DOI] [PubMed] [Google Scholar]
- Montgomery AA, Fahey T, Ben-Shlomo Y, Harding J. The Influence of Absolute Cardiovascular Risk, Patient Utilities, and Costs on the Decision to Treat Hypertension: A Markov Decision Analysis. Journal of Hypertension. 2003;21:1753–9. doi: 10.1097/00004872-200309000-00026. [DOI] [PubMed] [Google Scholar]
- Mullins CD, Blak BT, Akhras KS. Comparing Cost-Effectiveness Analyses of Anti-Hypertensive Drug Therapy for Decision Making: Mission Impossible? Value Health. 2002;5(4):359–71. doi: 10.1046/j.1524-4733.2002.54142.x. [DOI] [PubMed] [Google Scholar]
- National Collaborating Centre for Chronic Conditions. 2006. “Hypertension: Management in Adults in Primary Care: Pharmacological Update.” Available at http://www.nice.org.uk/CG034.
- National Committee for Quality Assurance. Health Plan Employer Data and Information Set 2005, vol. 2: Effectiveness of Care Measures. Washington, DC: NCQA; 2005. [Google Scholar]
- National Committee for Quality Assurance. 2009. “What Is HEDIS?” [accessed on October 2009]. Available at http://www.ncqa.org/tabid/187/Default.aspx.
- Office of Quality Performance. 2009. FY 2009, Q2 Technical Manual for the VHA Performance Measurement System.
- O'Kane M, Corrigan J, Foote SM, Tunis SR, Isham GJ, Nichols LM, Fisher ES, Ebeler JC, Block JA, Bradley BE, Cassel CK, Ness DL, Tooker J. Crossroads in Quality. Health Affiliation (Millwood) 2008;27(3):749–58. doi: 10.1377/hlthaff.27.3.749. [DOI] [PubMed] [Google Scholar]
- Ong KL, Cheung BM, Man YB, Lau CP, Lam KS. Prevalence, Awareness, Treatment, and Control of Hypertension among United States Adults 1999–2004. Hypertension. 2007;49(1):69–75. doi: 10.1161/01.HYP.0000252676.46043.18. [DOI] [PubMed] [Google Scholar]
- Østbye T, Yarnall KS, Krause KM, Pollak KI, Gradison M, Michener JL. Is There Time for Management of Patients with Chronic Diseases in Primary Care? Annals of Family Medicine. 2005;3(3):209–14. doi: 10.1370/afm.310. [DOI] [PMC free article] [PubMed] [Google Scholar]
- Ostchega Y, Dillon CF, Hughes JP, Carroll M, Yoon S. Trends in Hypertension Prevalence, Awareness, Treatment, and Control in Older U.S. Adults: Data from the National Health and Nutrition Examination Survey 1988 to 2004. Journal of the American Geriatric Society. 2007;55(7):1056–65. doi: 10.1111/j.1532-5415.2007.01215.x. [DOI] [PubMed] [Google Scholar]
- Ostchega Y, Yoon SS, Hughes J, Tatiana Louis T. Division of Health and Nutrition Examination Surveys. Hypertension Awareness, Treatment, and Control—Continued Disparities in Adults: United States, 2005–2006. NCHS Data Brief No. 3. Washington, DC: U.S. Department of Health and Human Services, Centers for Disease Control and Prevention, National Center for Health Statistics; 2008. [PubMed] [Google Scholar]
- Osterberg L, Blaschke T. Adherence to Medication. New England Journal of Medicine. 2005;353(5):487–97. doi: 10.1056/NEJMra050100. [DOI] [PubMed] [Google Scholar]
- Paramore LC, Halpern MT, Lapuerta P, Hurley JS, Frost FJ, Fairchild DG, Bates D. Impact of Poorly Controlled Hypertension on Healthcare Resource Utilization and Cost. American Journal of Managed Care. 2001;7(4):389–98. [PubMed] [Google Scholar]
- Parati G, Omboni S, Albini F, Piantoni L, Giuliano A, Revera M, Illyes M, Mancia G, TeleBPCare Study Group Home Blood Pressure Telemonitoring Improves Hypertension Control in General Practice. The TeleBPCare Study. Journal of Hypertension. 2009;27(1):198–203. doi: 10.1097/hjh.0b013e3283163caf. [DOI] [PubMed] [Google Scholar]
- Physician Fee Schedule Search. 2009. Available at http://www.cms.hhs.gov/PFSlookup/02_PFSSearch.asp#TopOfPage.
- Prospective Studies Collaboration. Age-Specific Relevance of Usual Blood Pressure to Vascular Mortality: A Meta-Analysis of Individual Data for One Million Adults in 61 Prospective Studies. Lancet. 2002;360:1903–13. doi: 10.1016/s0140-6736(02)11911-8. [DOI] [PubMed] [Google Scholar]
- Roehrig C, Miller G, Lake C, Bryant J. National Health Spending by Medical Condition, 1996–2005. Health Affiliation (Millwood) 2009;28(2):w358–67. doi: 10.1377/hlthaff.28.2.w358. [DOI] [PubMed] [Google Scholar]
- Roumie CL, Elasy TA, Greevy R, Griffin MR, Liu X, Stone WJ, Wallston KA, Dittus RS, Alvarez V, Cobb J, Speroff T. Improving Blood Pressure Control Through Provider Education, Provider Alerts, and Patient Education: A Cluster Randomized Trial. Annals of Internal Medicine. 2006;145(3):165–75. doi: 10.7326/0003-4819-145-3-200608010-00004. [DOI] [PubMed] [Google Scholar]
- Safford MM, Shewchuk R, Qu H, Williams JH, Estrada CA, Ovalle F, Allison JJ. Reasons for Not Intensifying Medications: Differentiating “Clinical Inertia” from Appropriate Care. Journal of General Internal Medicine. 2007;22(12):1648–55. doi: 10.1007/s11606-007-0433-8. [DOI] [PMC free article] [PubMed] [Google Scholar]
- Schroeder K, Fahey T, Ebrahim S. Interventions for Improving Adherence to Treatment in Patients with High Blood Pressure in Ambulatory Settings. Cochrane Database of Systematic Reviews. 2004 doi: 10.1002/14651858.CD004804. no. 3: CD004804. [DOI] [PMC free article] [PubMed] [Google Scholar]
- Siegel D, Lopez J, Meier J. Antihypertensive Medication Adherence in the Department of Veterans Affairs. American Journal of Medicine. 2007;120(1):26–32. doi: 10.1016/j.amjmed.2006.06.028. [DOI] [PubMed] [Google Scholar]
- Spranger CB, Ries AJ, Berge CA, Radford NB, Victor RG. Identifying Gaps between Guidelines and Clinical Practice in the Evaluation and Treatment of Patients with Hypertension. American Journal of Medicine. 2004;117(1):14–8. doi: 10.1016/j.amjmed.2004.01.024. [DOI] [PubMed] [Google Scholar]
- Trogdon JG, Finkelstein EA, Nwaise IA, Tangka FK, Orenstein D. The Economic Burden of Chronic Cardiovascular Disease for Major Insurers. Health Promotion Practice. 2007;8(3):234–42. doi: 10.1177/1524839907303794. [DOI] [PubMed] [Google Scholar]
- Turnbull F, Neal B, Blood Pressure Lowering Treatment Trialists' Collaboration. Ninomiya T, Algert C, Arima H, Barzi F, Bulpitt C, Chalmers J, Fagard R, Gleason A, Heritier S, Li N, Perkovic V, Woodward M, McMahon S. Effects of Different Regimens to Lower Blood Pressure on Major Cardiovascular Events in Older and Younger Adults: Meta-Analysis of Randomised Trials. British Medical Journal. 2008;336(7653):1121–3. doi: 10.1136/bmj.39548.738368.BE. [DOI] [PMC free article] [PubMed] [Google Scholar]
- Turner BJ, Hollenbeak CS, Weiner M, Ten Have T, Tang SS. Effect of Unrelated Comorbid Conditions on Hypertension Management. Annals of Internal Medicine. 2008;148(8):578–86. doi: 10.7326/0003-4819-148-8-200804150-00002. [DOI] [PubMed] [Google Scholar]
- U.S. Department of Labor: Bureau of Labor Statistics. 2007. “Consumer Price Index, all Urban Consumers, 1997–2007” [accessed on June 17, 2010]. Available at http://data.bls.gov.
- Walsh JM, McDonald KM, Shojania KG, Sundarum V, Nayak S, Lewis R, Owens DK, Goldstein MK. Quality Improvement Strategies for Hypertension Management: A Systematic Review. Medial Care. 2006;44(7):646–57. doi: 10.1097/01.mlr.0000220260.30768.32. [DOI] [PubMed] [Google Scholar]
- Wang TJ, Vasan RS. Epidemiology of Uncontrolled Hypertension in the United States. Circulation. 2005;112(11):1651–62. doi: 10.1161/CIRCULATIONAHA.104.490599. [DOI] [PubMed] [Google Scholar]
- Wiysonge CS, Bradley H, Mayosi BM, Maroni R, Mbewu A, Opie LH, Volmink J. Beta-Blockers for Hypertension. Cochrane Database of Systematic Reviews. 2007 doi: 10.1002/14651858.CD002003.pub2. no. 1: CD002003. [DOI] [PubMed] [Google Scholar]
- Wu J, Kraja AT, Oberman A, Lewis CE, Ellison RC, Arnett DK, Heiss G, Lalouel JM, Turner ST, Hunt SC, Province MA, Rao DC. A Summary of the Effects of Antihypertensive Medications on Measured Blood Pressure. American Journal of Hypertension. 2005;18(7):935–42. doi: 10.1016/j.amjhyper.2005.01.011. [DOI] [PubMed] [Google Scholar]
Associated Data
This section collects any data citations, data availability statements, or supplementary materials included in this article.