

Abstract
Leptin is a hormone that regulates body weight by decreasing food intake and increasing energy expenditure. ob/ob mice carry leptin mutations and are obese and hyperphagic. Leptin administration to lean and ob/ob mice activates a novel metabolic program that depletes adipose tissue. Although this response is physiologically distinct from that evident after food restriction, the molecular nature of these differences is as yet unknown. Expression monitoring of 6500 genes using oligonucleotide microarrays in wild-type, ob/ob, and transgenic mice expressing low levels of leptin revealed that differences in ambient leptin levels have dramatic effects on the phenotype of white adipose tissue. These data identified a large number of genes that are differentially expressed in ob/ob mice. To delineate the components of the transcriptional program specifically affected by leptin, the level of the same 6500 genes was monitored in wild-type and ob/ob mice at various times after leptin treatment or food restriction. A novel application of k-means clustering identified 8 clusters of adipose tissue genes whose expression was different between leptin treatment and food restriction in ob/ob mice and 10 such clusters in wild-type experiments. One of the clusters was repressed specifically by leptin in both wild-type and ob/ob mice and included several genes known to be regulated by SREBP–1/ADD1. Further studies confirmed that leptin decreases the levels of SREBP–1/ADD1 RNA and transcriptionally active SREBP–1/ADD1 protein in white adipose tissue. Future studies of the molecular basis for the apparent coordinate regulation of the other clusters of leptin-regulated genes may reveal additional mechanisms by which leptin exerts its weight-reducing effects.
Keywords: Leptin, microarray, cluster, obesity, SREBP, adipocyte
Leptin, an adipocyte-derived hormone, functions as the afferent signal in a feedback loop regulating adipose tissue mass (Friedman and Halaas 1998). Leptin also has effects on a number of cell types and appears to be a key link by which alterations in nutritional state modulate a number of physiologic processes (Lord 1998; Morton et al. 1998; Sierra-Honigmann et al. 1998). Mice with mutations in leptin (ob/ob) or its receptor (db/db) exhibit marked obesity, hyperphagia, and a number of other abnormalities (Zhang et al. 1994; Lee et al. 1996). Leptin administration to both wild-type and ob/ob mice causes significant reductions in food intake and body weight (Campfield et al. 1995; Halaas et al. 1995; Pelleymounter et al. 1995). These findings confirm that leptin is a key regulator of energy balance.
Current evidence suggests that the hypothalamus is an important site of leptin's action. The signaling-competent form of the leptin receptor, Ob-Rb, is expressed at high levels in specific neuronal populations in the hypothalamus and to a lesser extent in other brain regions (Fei et al. 1997). Leptin has similar effects whether delivered centrally or peripherally (Halaas et al. 1997). Intracerebroventricular (ICV) administration of leptin completely recapitulates the reduction of body mass and food intake and the novel effects on glucose metabolism of peripheral leptin with much greater potency (Campfield et al. 1995; Halaas et al. 1997; Kamohara et al. 1997). These findings suggest that leptin acts by modulating a neuronal circuit that controls energy balance and metabolism. The nature of the efferent signals from the CNS that regulate metabolism in response to leptin are not well characterized, although some evidence suggests that the sympathetic nervous system may play a role (Collins et al. 1996; Dunbar et al. 1997; Haynes et al. 1997; Elmquist et al. 1999).
Animals treated with leptin voluntarily decrease food intake, whereas a novel metabolic program selectively depletes body adipose stores (Halaas et al. 1997). Although decreased food intake is a prominent effect of leptin treatment, the decrease in food intake alone cannot account for the metabolic changes that are observed. Thus, there are a number of physiological differences between leptin and food restriction. First, pair-fed ob/ob mice that are food restricted to the level of intake of leptin-treated ob/ob mice lose significantly less weight than the leptin-treated mice (Levin et al. 1996). Second, whereas starvation causes a loss of both lean body mass and fat mass, leptin treatment selectively reduces fat mass (Halaas et al. 1995; Pelleymounter et al. 1995). Third, the increase in circulating free fatty acids and ketone bodies typical of starvation is not observed during weight loss induced by leptin treatment in wild-type rats (Shimabukuro et al. 1997). Finally, leptin treatment does not lead to the compensatory drop in energy expenditure generally evident with decreased food intake (Halaas et al. 1997). Many hormonal changes evident after food restriction can be blunted by administration of exogenous leptin (Ahima et al. 1996). This constellation of findings suggests that leptin elicits a novel metabolic program of weight loss that is physiologically distinct from that of food restriction. However, molecular markers that are specific for leptin's response have not been identified.
Here we report the use of oligonucleotide microarrays (Affymetrix, Santa Clara, CA) to characterize the response to both leptin and food restriction in wild-type and ob/ob mice as well as in transgenic mice that express a constitutively low level of leptin. An analytical method using k-means clustering was developed to group genes with similar expression patterns. This method proved to have several advantages relative to other clustering algorithms.
These data revealed that different levels of ambient plasma leptin have dramatic effects on the gene expression profile and phenotype of white adipose tissue. Many white adipose tissue genes were found to be differentially expressed between ob/ob and lean mice, thus revealing several novel molecular features of the obese phenotype. Expression analysis of leptin administration in ob/ob and wild-type mice identified a series of kinetically distinguishable gene clusters that are specifically regulated by leptin and that distinguish leptin treatment from food restriction. Other clusters responded similarly to leptin treatment and food restriction. These results emphasize the dynamic nature of adipose tissue and underscore leptin's role in modulating its phenotype. Two of the leptin-regulated clusters that were identified are composed largely of genes known to be regulated by sterol regulatory element-binding protein 1 (SREBP-1, also known as ADD1) and include SREBP-1 itself. Leptin was found to modulate SREBP-1 activity by decreasing the amount of SREBP-1 RNA and cleaved (transcriptionally active) SREBP-1 protein in adipose tissue. Although other transcription factors were detected in several of the other clusters, the molecular basis for the coordinate regulation of genes in these clusters is as yet unknown. The genes in these clusters can serve as molecular markers for leptin's novel effects. Further analysis of the proteins encoded by the genes in these clusters may also provide new insights into the mechanism of leptin-induced depletion of adipose tissue and lead to the elucidation of the leptin-stimulated signals that regulate metabolism.
Results
Leptin modulates white adipose tissue gene expression
Whereas the absence of leptin has easily discernible gross effects on adipose tissue, relatively little is known about the cellular and molecular effects of leptin deficiency. To analyze the patterns of gene expression in white adipose tissue in the presence or absence of leptin, RNA isolated from unmanipulated, 8-week-old C57BL/6J wild-type and genetically obese (ob/ob) mice was analyzed using murine 6500 gene oligonucleotide microarrays (Affymetrix).
Of the ∼6500 genes and ESTs analyzed (hereafter referred to as genes), 1875 and 1976 were expressed at sufficient levels for detection in the wild-type and ob/ob samples, respectively. Of these, the level of expression of 476 (25%) was significantly different in the adipose tissue RNA from ob/ob mice. One hundred and thirty-seven RNAs (7% of the total) with an average difference change of >250 were differentially expressed twofold or more in the ob/ob adipose tissue RNA. The average difference is an arbitrary number that measures the intensity of hybridization of a given RNA to the oligonucleotides on the array. A total of 77 genes were differentially expressed threefold or more in the ob/ob sample (Table 1). Northern blotting with independently generated RNA samples with probes corresponding to these differentially expressed genes was used to corroborate the qualitative and quantitative changes in gene expression derived from the analysis of genes above this threshold (Table 1; Fig. 1). Northern blots confirmed that the data from the chips were robust and that in many cases, the intensity of fold changes was underestimated on the microarrays. The complete list of differentially expressed genes is available at the following web site: http://arrays.rockefeller.edu/obesity/adipose.
Table 1.
Genes differentially expressed between ob/ob and wild-type white adipose tissue
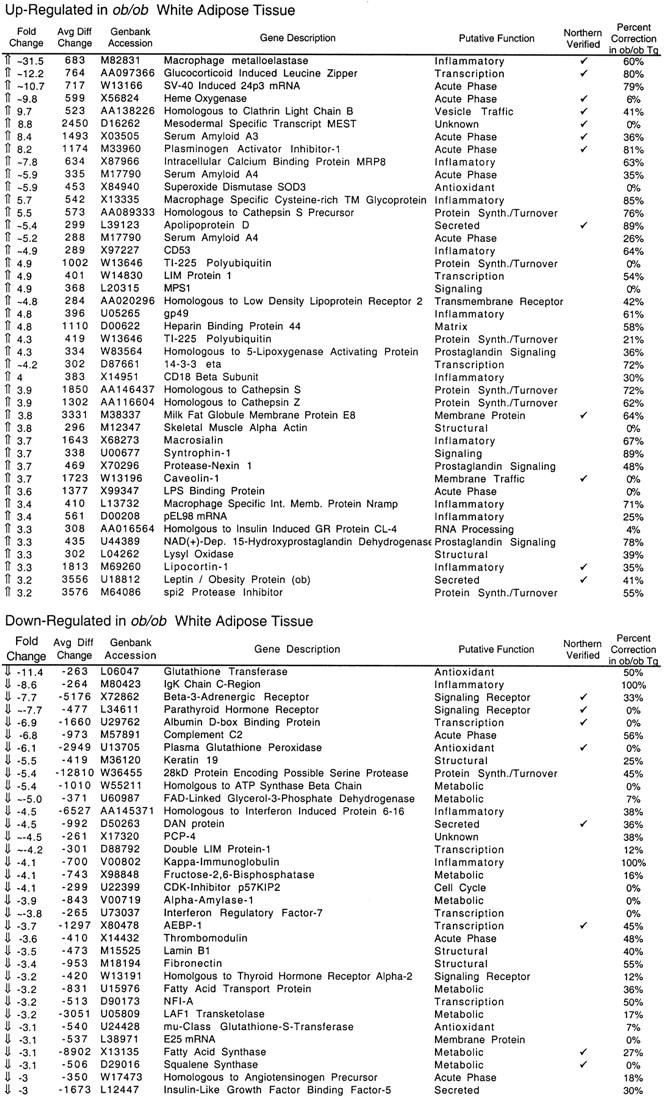 |
Genes three-fold or more different in abundance between ob/ob and wild-type adipose tissue are shown. Only genes whose average difference is >250 are shown. The average difference is an indication of hybridization intensity to perfect match oligonucleotide probe sets vs. hybridization to mismatch oligonucleotide probe sets. The number 250 was the threshold chosen for robust expression. Putative gene functions are listed based on literature searches. The expression of many of these genes was verified independently by Northern blotting, as indicated. These dysregulated genes were variably corrected in the ob/ob Tg animal, which expresses constitutively low levels of leptin. ob/ob Tg expression level is displayed as a percent of the observed change in ob/ob RNA. 0% indicates that the level of expression in ob/ob Tg adipose tissue was similar to that of ob/ob mice; 100% indicates an expression level simmilar to that of wild-type mice.
Figure 1.


Northern blots of differentially expressed genes. Northern blots were used to confirm the data for the differences in expression on the microarrays. DNA fragments from several genes with the fold change and average difference values as indicated were used as probes. (A) A total of 20 μg of wild-type and ob/ob white adipose tissue total RNA was analyzed by Northern blotting as described (see Materials and Methods) for genes up-regulated in ob/ob mice. (B) Northern blotting also confirmed the down-regulation of genes relative to wild-type in ob/ob white adipose tissue. Fold change and average difference (hybridization to perfect match probe sets minus hybridization to mismatch probe sets) values derived from Affymetrix Genechip software are shown below the relevant blots. Fold change values calculated in an instance where a gene was undetectable in one sample are preceded by the symbol ∼ and the undetected average difference value is marked by an asterisk (*). Blots were probed with cyclophilin to confirm equal loading. These data confirmed that robust expression data could be extracted from analysis of the microarrays for those genes with average difference values >250.
The abundance of several genes that play a role in fatty acid or cholesterol biosynthesis, or in generating reducing power for the synthetic processes within the cell, such as fatty acid synthase, squalene synthase, LAF-1 transketolase, and FAD-linked glycerol-3-phosphate dehydrogenase, was decreased. This result is surprising given that the adipose tissue mass of ob/ob mice is greatly increased. Other genes that play a role in fatty acid biosynthesis are similarly regulated, including two copies of ATP-citrate lyase (−2.6- and −2.0-fold), malate-NADP oxidoreductase (−2.0-fold), and the transcription factor SREBP-1/ADD1 (−2.1-fold).
Numerous other changes in ob/ob adipose tissue gene expression were also observed, including an increased level of expression of inflammatory markers and acute phase proteins, such as serum amyloid A3 and A4 proteins, LPS-binding protein, SV40-induced 24p3, heme oxygenase, and plasminogen activator inhibitor-1. Several of these transcripts were absent from lean adipose tissue, indicating that their expression is unique to the leptin-deficient state (Table 1). Furthermore, RNAs for a number of markers generally expressed on macrophages or inflammatory cells were increased in the white adipose tissue of ob/ob mice. These included macrophage metalloelastase, macrophage-specific cysteine-rich transmembrane glycoprotein MS2, MRP8, macrosialin, CD53, and cathepsin proteases implicated in tissue remodeling. Several of these markers are expressed in adipocytes, as assessed by Northern blotting on RNA from fractionated adipose tissue (data not shown). These data indicate that leptin deficiency produces dysregulated expression of genes that generally function in response to infection and inflammation in the adipocyte lineage. The signal-transduction pathway that mediates this previously unappreciated aspect of the adipose tissue phenotype of ob/ob mice is unknown.
The effect of an ambient leptin concentration intermediate between that of ob/ob and wild-type mice on adipose tissue gene expression was next assessed in studies of ob/ob mice expressing a human leptin transgene. These mice express constitutively low levels of leptin under the control of the adipocyte-specific aP2 promoter (henceforth referred to as ob/ob Tg mice). The plasma leptin concentration of ob/ob Tg mice is ∼50% that of wild-type mice, and these animals exhibit an obese phenotype that is intermediate between wild-type and ob/ob (Ioffe et al. 1998). RNA from ob/ob Tg adipose tissue was analyzed by hybridization to oligonucleotide microarrays. Fifty of the 137 genes that were dysregulated twofold or more in the ob/ob mouse were corrected in the ob/ob Tg mice to levels approaching those in wild-type mice. The remaining 87 of the 137 genes that were dysregulated in ob/ob mice (59%) were not corrected significantly in ob/ob Tg adipose tissue. The effect of the intermediate plasma leptin levels of ob/ob Tg mice on the level of expression of genes that were threefold or more different between ob/ob and wild-type tissue is shown (Table 1). Thus, subnormal levels of leptin correct some of the abnormalities evident with complete leptin deficiency, but not others. For example, the group of genes generally expressed in macrophages, including macrophage metalloelastase, macrophage-specific cysteine-rich transmembrane glycoprotein MS2, MRP8, macrosialin, CD53, and cathepsin proteases, were all corrected significantly in the white adipose tissue of ob/ob Tg mice. However, low levels of leptin did not significantly correct the abnormalities in genes that play a role in metabolism, including FAS, squalene synthase, FAD-linked glycerol-3-phosphate dehydrogenase, ATP-citrate lyase, malate-NADP oxidoreductase, aldehyde dehydrogenase, Spot14, and LAF-1 transketolase. These data further demonstrate that different classes of genes (i.e., inflammatory vs. metabolic) are differentially responsive to different levels of leptin.
Leptin treatment and pair feeding reduce body mass in ob/ob and wild-type mice
The effect of exogenous leptin on the gene expression profile of white adipose tissue was scored in groups of ob/ob and wild-type mice. Leptin treatment of ob/ob and wild-type mice reduced food intake and body mass (Fig. 2) as has been documented previously (Halaas et al. 1995, 1997). In these studies, groups of pair-fed mice were also analyzed to differentiate specific effects of leptin from those attributable to a decrease in food intake.
Figure 2.
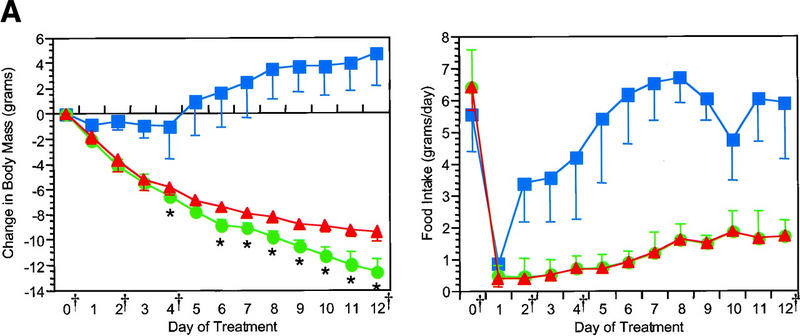
Reduction in body mass and food intake after leptin treatment. Leptin caused a rapid reduction in body mass and food intake in both ob/ob (A) and wild-type mice (B). Pair feeding of ob/ob mice but not lean mice demonstrated a kinetically and statistically distinguishable pattern of weight loss from leptin treatment (green circles) [(*) P < 0.05 relative to pair-fed(red triangles)]. At all points except the wild-type day 0 measurement for body mass, leptin treatment was significantly different from PBS (blue squares) in body mass and food intake (P < 0.01). The time points used for microarray expression analysis are indicated (†). These were ob/ob, untreated ob/ob, days 2, 4, and 12 of leptin treatment or pair feeding, and day 4 of PBS treatment; wild-type, untreated, days 1, 2, 3, and 5 of leptin treatment or pair feeding, and day 3 of PBS treatment.
K-means cluster analysis indicates that leptin activates distinct programs of gene expression in white adipose tissue
Expression analysis was first performed with RNAs isolated from ob/ob white adipose tissue after leptin treatment or pair feeding. A PBS group was included to control for the effects of the experimental manipulation. The level of expression for all genes at each time point was expressed as a fold change value relative to the wild-type sample. As a prelude to cluster analysis, data was filtered on the basis of fold change and abundance (average difference change) values (see Materials and Methods). Criteria for inclusion were made on the basis of Northern blotting, which established a boundary above which detected fold changes were quantitatively reliable (see Fig. 1; Table 1). A total of 410 genes satisfied these criteria in the experiments with ob/ob mice.
K-means clustering was used to group genes with similar expression patterns (Hartigan 1975; Kohonen 1997). To begin this analysis, a database of the fold change values for the 410 genes meeting the aforementioned criteria was assembled for each of eight ob/ob experiments, untreated, days 2, 4, and 12 of leptin treatment, days 2, 4, and 12 of pair feeding, and 4 days of PBS treatment. Data for each gene was represented as an 8-dimensional vector, each dimension representing expression data from one experimental sample. K-means clustering was performed using a dot product metric to determine the distance between gene vectors. This operation served to group genes with similar patterns of expression independent of differences in the magnitude of the fold changes.
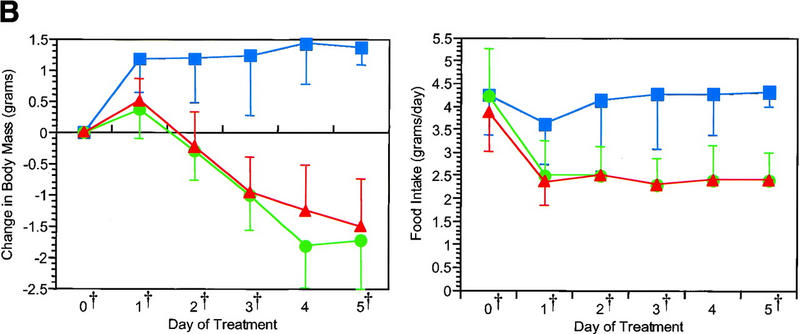
K-means clustering indicated that leptin specifically regulates kinetically distinguishable clusters of genes in ob/ob white adipose tissue. Each of the clusters that were identified by k-means analysis is shown with their mean pattern of expression (Fig. 3). Several clusters were composed of genes that are specifically regulated by leptin (Fig. 3A,C,H,I,L–O). The mean pattern of expression within these clusters clearly demonstrates statistically significant differences between leptin treatment and pair feeding. In some cases, the clusters are composed of genes that are dysregulated in the ob/ob mouse, which are specifically corrected toward wild-type levels by leptin (Fig. 3A,O). In other leptin regulated clusters, genes were expressed at approximately normal levels at baseline and affected selectively by leptin or pair feeding (Fig. 3C,H,I,L–N). Some clusters reveal acute responses to leptin or pair feeding that were not sustained for the duration of the treatment period (Fig. 3D,J,K). Another cluster is composed of genes that are repressed by pair feeding but not by leptin (Fig. 3M). Genes within this cluster may be regulated by physiologic changes seen in pair feeding but not during leptin treatment. Other clusters revealed patterns of gene expression that could not be readily described (Fig. 3E–G). Finally, clusters were identified that included genes that were dysregulated in ob/ob mice but were not corrected by leptin (Fig. 3B,P). In some cases, the genes in these clusters were normalized in the ob/ob TG mice, whereas in other cases, they were not (see below). Owing to space restrictions, the cluster outputs including all gene names could not be included here. All of these data are available via the internet at this web address: http://arrays.rockefeller.edu/obesity/adipose. The k-means algorithm always places genes into the cluster with the mean to which they are mathematically closest. However, all genes within a cluster were not always adequately represented by their mean. To evaluate cluster fit, genes were sorted within clusters according to their distance from the mean in units of standard deviation (see Fig. 4 and web site).
Figure 3.
K-means cluster analysis of leptin treatment and pair feeding in ob/ob white adipose tissue. (Left) The complete output of k-means cluster analysis is shown with the fold change indicated colorimetrically (see legend, bottom). Individual genes are represented along the vertical axis, whereas the experimental conditions (i.e., treatment group, day) are represented horizontally. The 16 ob/ob clusters are labeled with letters (A–P). The separations between clusters are indicated by the alternating red and blue bar on the left side of the colorimetric output. (Right) The mean expression pattern for the genes in each cluster was calculated and normalized so that 1 unit represents maximal repression/induction. Instances in which significant differences distinguish leptin treatment from pair feeding in clusters A, C, H, I, L–O are indicated [(*) P < 0.001 relative to pair feeding].
Figure 4.
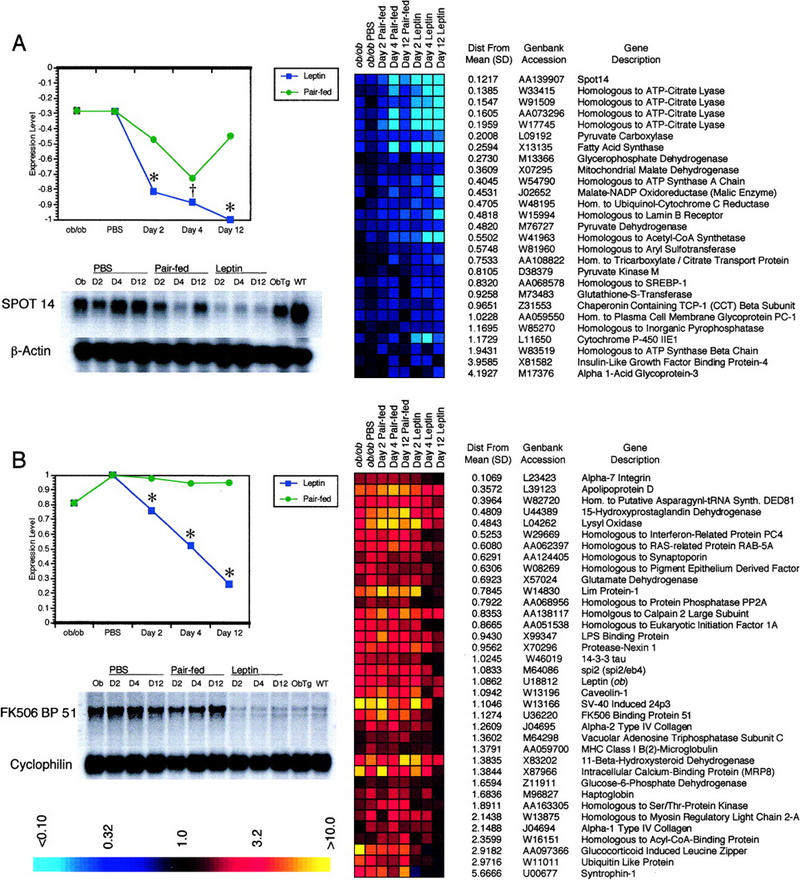
Clusters of genes specifically repressed by leptin in ob/ob white adipose tissue. Leptin specifically repressed expression of genes in at least two kinetically distinguishable clusters. (A) Leptin selectively repressed genes in cluster 3L. Many of these genes play a role in fatty acid biosynthesis. Genes are ordered by distance from the mean expression level, with distance from the mean for each gene indicated in units of standard deviation. Pair feeding only weakly repressed genes within the cluster. The transcription factor SREBP-1, which has been shown to regulate many genes in the cluster, is also present, along with four copies of ATP-citrate lyase. This pattern of expression was confirmed on Northern blots of RNA from ob/ob PBS, leptin, or pair-fed-treated, wild-type, or ob/ob Tg white adipose tissue using a Spot14 probe (bottom). Spot14 is a representative SREBP-1-regulated gene in the cluster. β-actin was used to confirm equal loading. At all time points, mean expression level for the leptin-treated group differed significantly from pair feeding [(†) P < 0.005, (*) P < 0.001]. (B) In cluster 3A, leptin specifically repressed genes up-regulated in the ob/ob animal, whereas pair feeding had no effect. Differences in mean expression pattern of these genes between leptin treatment and pair feeding were highly significant at all time points, as indicated. Northern blotting with a probe for FK506 Binding Protein 51, a representative gene in the cluster, confirmed the observed pattern of expression (bottom). Cyclophilin was used as a loading control.
In aggregate, the data clearly indicate that leptin activates a program of gene expression in white adipose tissue that is distinct from food restriction. The data also illustrate the complexity of the response to this hormone. Two kinetically distinguishable clusters comprised of genes that are repressed by leptin treatment are shown in detail (Fig. 4). In one cluster, the genes were initially decreased in ob/ob white adipose tissue relative to wild type and were strongly repressed by leptin, but only transiently by pair feeding (Figs. 3L and 4A). A different cluster included genes that were up-regulated in ob/ob white adipose tissue. In this case, leptin restored their expression level to that of wild-type mice, whereas pair feeding had no effect (Figs. 3A and 4B).
In some cases, important biologic conclusions could be drawn from this information. The specific characteristics of these clusters, which include a cluster of SREBP-1 regulated genes, are discussed below.
Comparison of k-means clustering to other cluster methods
The k-means cluster output was evaluated by examining the χ2 statistic (the sum of the deviations of each gene in a cluster relative to the cluster mean) and the trace of the scattering matrices (a measure of cluster separation relative to cluster width; Duda and Hart 1973). A variety of other clustering algorithms have been applied previously to the analysis of microarray data, including hierarchical organizations (Eisen 1998) and self-organizing maps (Tamayo et al. 1999). For comparison, hierarchical clustering was also carried out using single, average, centroid, Ward, or complete linkages, as well as self-organizing map analysis. Although no one method did the best in all statistical measures, a combined analysis indicated that k-means performed better than other methods on this data set (statistics available via internet). Examination of cluster outputs revealed a tendency of algorithms other than k-means to create a number of isolated clusters with few genes and larger clusters that were poorly represented by their means. Notably, robust patterns of expression (i.e., Fig. 3L) were evident independent of cluster method used, whereas subtle patterns were more variable (data not shown).
Leptin selectively represses a cluster of SREBP-1-regulated genes
An analysis of the genes in Cluster 3L demonstrates that leptin selectively represses the expression of genes that regulate fatty acid biosynthesis in white adipose tissue (Fig. 4A). These genes are selectively repressed by leptin treatment at day 2 and are further repressed on days 4 and 12. This temporal pattern of gene expression differs substantially from that seen in pair-fed animals. The cluster is only transiently depressed by pair feeding on day 4 and expression levels rebound to near baseline after 12 days. This pattern of expression was confirmed by Northern blotting of Spot14, a representative gene in the cluster and a known SREBP-1 target (Shimomura et al. 1998).
This cluster includes several genes known to be positively regulated by the transcription factor SREBP-1, also known as ADD1 (Tontonoz et al. 1993; Yokoyama et al. 1993; Shimomura et al. 1998). Members of this cluster include fatty acid synthase, pyruvate kinase, pyruvate carboxylase, mitochondrial malate dehydrogenase, and malate-NADP oxidoreductase. This cluster also contains several genes that were not known previously to be regulated by SREBP-1, including acetyl-CoA synthetase, citrate transporter, glycerophosphate dehydrogenase, pyruvate dehydrogenase, and glutathione-S-transferase. Notably, the cluster includes SREBP-1 itself, suggesting that the transcription factor is regulated coordinately with the genes it activates, and may regulate its own expression. The robustness of these data is also indicated by the fact that four independent copies of ATP-citrate lyase are present in the cluster and all show identical expression profiles over the time course of leptin treatment. ATP-citrate lyase is responsible for generating the cytosolic pool of acetyl-CoA for fatty acid synthesis. The effects of leptin on SREBP-1 itself are discussed below. However, not all SREBP-1-regulated genes exhibited this pattern of expression. For example, stearoyl-CoA desaturase-2, although repressed by leptin treatment, is initially increased in ob/ob adipose tissue, unlike the genes of cluster 3L, which are initially decreased (cluster 3I). Whereas SCD2 has also been reported to be regulated by SREBP-1 (Shimomura et al. 1998; Tabor et al. 1998), this observation indicates that factors other than SREBP-1 may also play a role in regulating fatty acid metabolism in response to leptin.
Leptin affects the expression of markers of adipocyte differentiation in ob/ob white adipose tissue
A number of genes associated with adipocyte differentiation in vitro were found to be dysregulated in obese white adipose tissue. Leptin normalized the level of expression of the genes in these clusters, whereas pair feeding did not. Two such patterns of leptin-specific gene expression were evident. In the first, genes whose expression is increased in ob/ob mice were repressed to wild-type levels (Figs. 3A and 4B). In the second, genes that were decreased in ob/ob mice were returned toward wild-type levels by leptin (Fig. 3O). These clusters include FK506-binding protein 51, an RNA that is increased during the clonal expansion phase of adipocyte differentiation in vitro (Yeh et al. 1995). This transcript is increased threefold in ob/ob adipose tissue and returns to wild-type levels after 12 days of leptin treatment. AEBP-1 is a transcriptional repressor that binds the adipocyte-specific aP2 promoter and is down-regulated during adipocyte differentiation in vitro (He et al. 1995). This RNA is decreased 3.7-fold in ob/ob WAT but is similarly returned to wild-type levels by leptin (Cluster 3O).
Some genes dysregulated in the ob/ob animal are not corrected by exogenous leptin, but are normalized by chronically low leptin levels
Two clusters of genes were identified that were differentially expressed between wild-type and ob/ob white adipose tissue, but which were unaffected by leptin treatment or pair feeding (Fig. 3B,P). Cluster 3P includes 63 genes that are decreased, whereas cluster 3B includes 61 genes that are increased in ob/ob WAT that are unaffected by leptin treatment. Long-term leptin treatment (i.e., longer than 12 days) and/or complete correction of obesity may be necessary to normalize expression of these genes. Alternatively, the finding that these genes are unchanged after 12 days of leptin treatment could indicate that they are dysregulated as a result of a developmental abnormality consequent to congenital leptin deficiency.
To address this, the expression of these same genes was examined in ob/ob Tg mice. Forty of the 124 genes (32%) that were unaffected by 12 days of exogenous leptin treatment are either partially or completely returned to wild-type levels by the chronically low levels of leptin in the ob/ob TG mice (i.e., at least 50% corrected). These included a complete correction of adipose differentiation-related protein and cdk 4 and 6 inhibitor p18, a 94% correction of growth arrest-specific protein 6 (GAS6), an 86% correction in plasminogen activator inhibitor-1, and a 71% correction of insulin-like growth factor binding protein 5. The complete list of genes in clusters 3B and 3P and their level of correction in the ob/ob Tg WAT is available via the internet. The fact that in some cases the low leptin levels present from birth in ob/ob Tg mice remedies abnormalities that are not corrected by high doses of leptin administered in adulthood, suggests that congenital leptin deficiency contributes to some aspects of the phenotype of ob/ob mice. Notably, age-matched ob/ob Tg animals are more obese than ob/ob mice treated with leptin for 12 days.
Leptin and food restriction produce characteristic patterns of gene expression in wild-type white adipose tissue
To study the effects of exogenous leptin on animals with normal hormone levels, gene expression in the white adipose tissue of wild-type animals treated with leptin was analyzed. Gene expression data from wild-type white adipose tissue isolated after 1, 2, 3, and 5 days of leptin treatment and pair feeding, or 3 days of PBS treatment was compared with data from an untreated wild-type sample to compile fold change values. A total of 336 genes satisfied the clustering selection criteria on the basis of fold change and average difference change values (see Materials and Methods).
K-means cluster analysis generated 13 kinetically distinguishable clusters (Fig. 5), several of which distinguished leptin treatment from pair feeding (Fig. 5B–I,K,M). In general, the magnitude of differences in the response of lean mice to a dynamic change in leptin level was more similar to pair feeding than that observed for leptin treatment of ob/ob mice. Still, leptin-specific patterns of gene expression could be subdivided into those that differ from food restriction at early (Fig. 5C,E,H,I,M) and at later times after leptin treatment (Fig. 5D,F,G,K). Thus, leptin activates a distinct transcriptional program in wild-type white adipose tissue.
Figure 5.
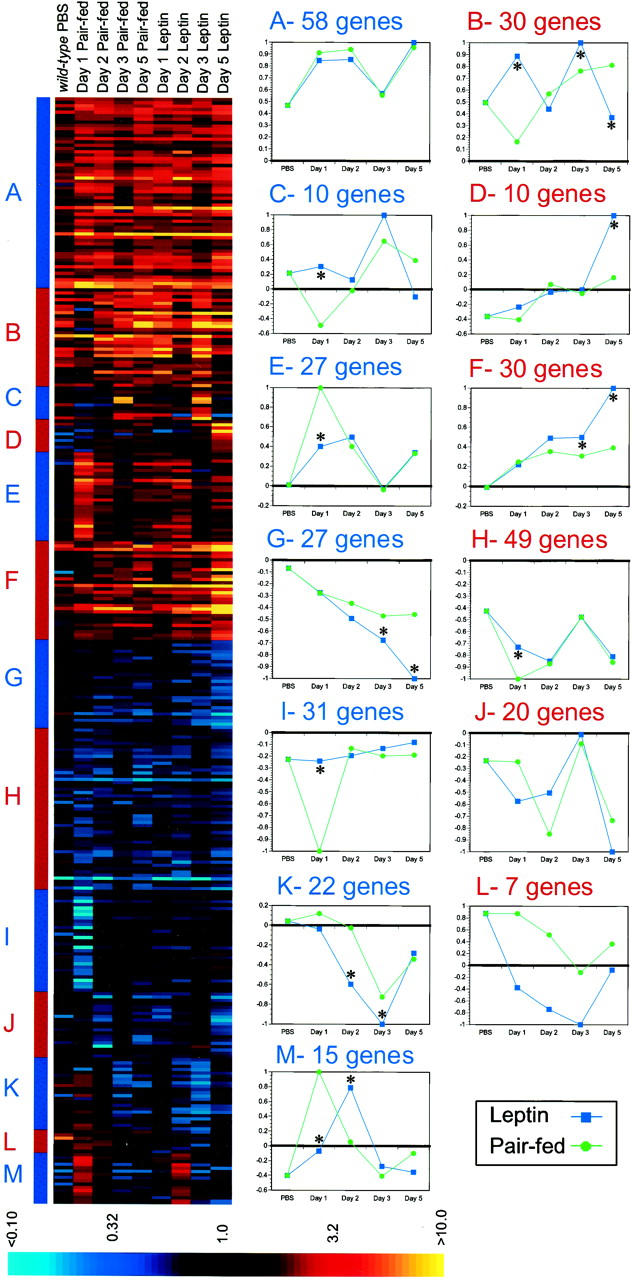
K-means cluster analysis of genes regulated by leptin treatment and pair feeding in wild-type white adipose tissue. (Left) The complete cluster output is shown with the fold change indicated colorimetrically (see legend, bottom). Individual genes are represented along the vertical axis, whereas the experimental conditions (i.e., treatment group, day) are represented horizontally. Thirteen clusters are shown (labeled A–M), with boundaries between clusters indicated by the alternating red and blue bar to the left of the complete colorimetric output. (Right) Mean expression pattern was calculated for each cluster and normalized so that 1 unit represents maximal repression/induction. Significant differences between leptin and pair feeding exist in clusters B–I, K, and M as indicated [(*) P < 0.001 relative to pair feeding].
K-means clustering of the wild-type expression data also produced the best χ2 and trace values when compared with other cluster methods (statistics available via the internet). Hierarchical clustering performed relatively poorly with single, average, centroid, Ward, or complete linkages. Self-organizing map analysis performed intermediate to k-means analysis and hierarchical methods.
Leptin treatment produced a rapid, pronounced repression of genes known to be associated with fatty acid biosynthesis (Fig. 5K; in detail in Fig. 6A). This cluster of genes is nearly identical to the group that was also repressed by leptin treatment in ob/ob white adipose tissue (see Fig. 4A). Genes in this cluster include four copies of ATP-citrate lyase, malate-NADP oxidoreductase, fatty acid synthase, stearoyl-CoA desaturase 2, and two copies of SREBP-1. The genes in this cluster were only transiently repressed by leptin on days 2 and 3, with levels returning largely to baseline by day 5 of treatment. Pair feeding only weakly decreased the level of expression of these same genes on day 3. This result indicates that leptin activates a transcriptional program in wild-type white adipose tissue independent of its effects on food intake. Furthermore, the repression of these same genes in both ob/ob and wild-type adipose tissue suggests their importance in mediating the response to leptin.
Figure 6.
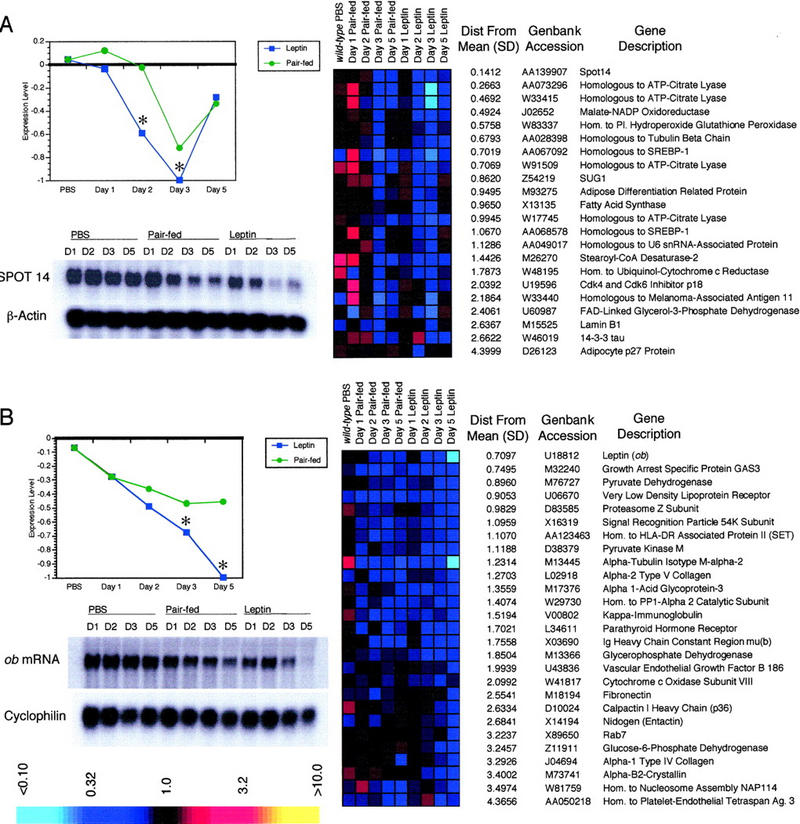
Clusters of genes specifically repressed by leptin in wild-type white adipose tissue. Leptin specifically repressed two kinetically distinguishable clusters in lean white adipose tissue. (A) The genes in cluster 5K are repressed selectively by leptin and to a much lesser extent by pair feeding. Many of these genes play a role in fatty acid biosynthesis. Genes are ordered by distance from the mean expression level, with distance from the mean for each gene indicated in units of standard deviation. Two copies of the transcription factor SREBP-1, which controls the transcription of many genes in the cluster, are also present. Pair feeding produced significantly less of an effect on these same genes as indicated [(*) P < 0.001 relative to pair feeding]. Northern analysis of RNA from treated wild-type, white adipose tissue for a representative gene in the cluster, Spot14, demonstrates the selective, transient repression by leptin (bottom). β-actin was used as a loading control. (B) The genes in cluster 5G are repressed by leptin but with a different kinetic pattern than the genes in cluster 5K. This cluster of genes includes leptin itself. Pair feeding produced significantly less repression of these same genes as indicated. Northern analysis with a probe for leptin confirmed the efficacy of treatment and the observed pattern of expression (bottom). Cyclophilin was used as a control.
Additional clusters distinguish leptin from pair feeding. Among these is a cluster that also includes leptin itself (Fig. 5G; in detail in Fig. 6B). It has been shown previously that treatment with exogenous leptin leads to a decrease in the abundance of its own RNA (Slieker et al. 1996). As the weight of leptin-treated and pair-fed mice at 3 days of treatment is the same, these results add further evidence to the possibility that leptin elicits a novel metabolic response. Cluster 5G also includes genes involved in generating reducing power for the cell via glycolysis or the pentose phosphate pathway, a heterogeneous group of structural genes, and proteasome-related genes. In contrast to the SREBP-1-regulated cluster, inspection of cluster 6G does not suggest a unifying function for the genes in this cluster. Further studies may reveal the basis for their apparent coordinate regulation. In addition, the genes in this cluster can serve as markers for this leptin-specific response.
SREBP-1 RNA and transcriptionally active protein are regulated by leptin
The importance of SREBP-1 in the regulation of the leptin-specific patterns of gene expression in clusters 3L and 5K was further investigated by measuring the levels of SREBP-1 RNA. Northern blotting demonstrated that SREBP-1 RNA was depressed early in the white adipose tissue of leptin-treated ob/ob mice and remained depressed throughout the period of leptin treatment (Fig. 7A, top). This is in contrast to the response in pair-fed animals in which the level of SREBP-1 RNA is depressed on day 2 but returned to that of untreated mice after 12 days. Northern blots of SREBP-1 in leptin-treated, wild-type adipose tissue revealed a specific, pronounced, but transient reduction in RNA levels (Fig. 7A, bottom). Pair feeding appeared to have little effect on SREBP-1 RNA levels aside from a moderate induction on day 1 of treatment.
Figure 7.
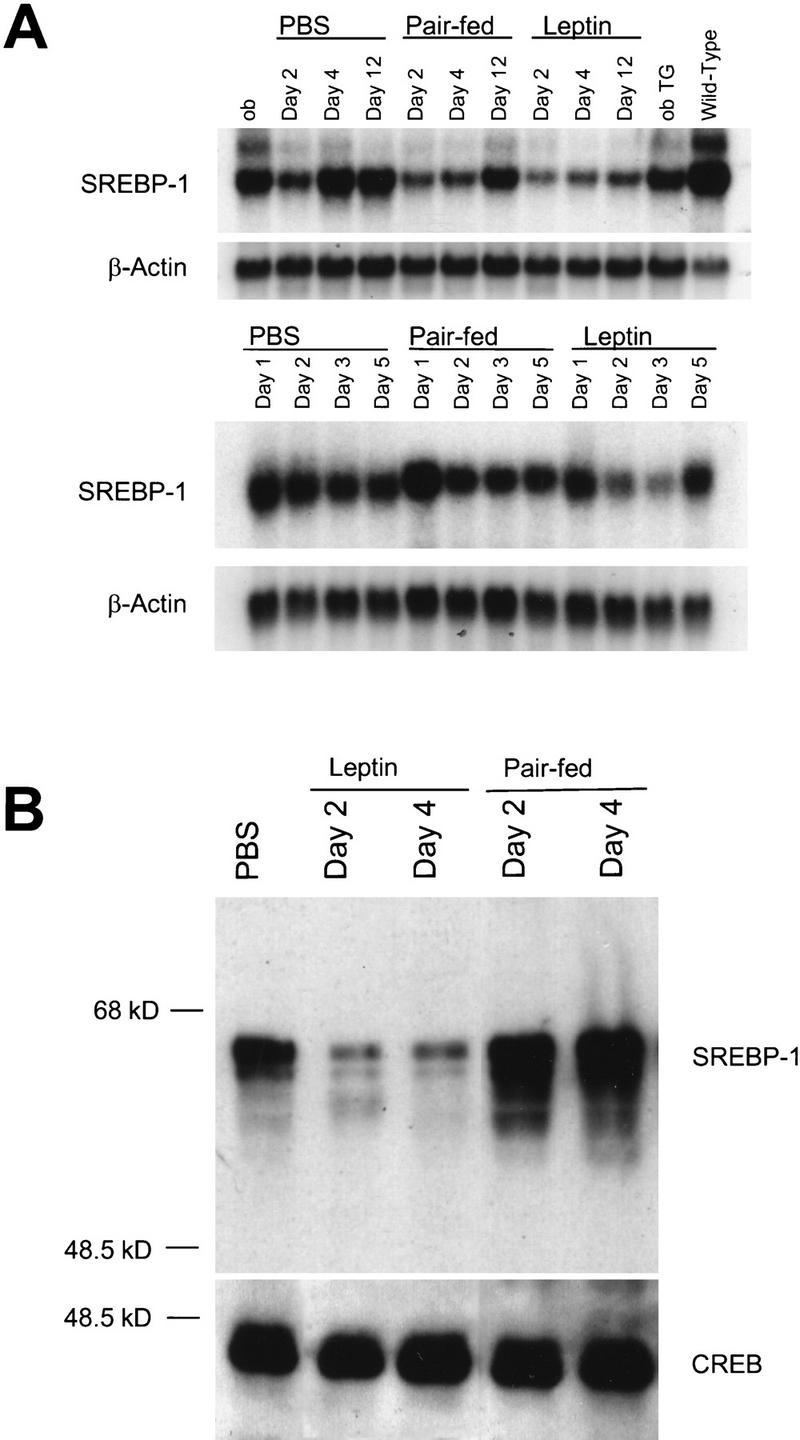
Repression of SREBP-1 RNA and transcriptionally active protein by leptin. (A) Northern blotting with a probe for SREBP-1 of RNA from leptin-treated ob/ob white adipose tissue is shown (top). Leptin significantly repressed SREBP-1 RNA at days 2, 4, and 12, whereas pair feeding decreased SREBP-1 RNA slightly only on days 2 and 4, with levels returning to baseline by day 12. In wild-type mice, leptin produced a transient depression in SREBP-1 RNA levels, as assessed by Northern blot, which correlated with the state of energy balance (bottom). SREBP-1 RNA was depressed during the period of leptin-induced negative energy balance, and returned when animals re-enter a state of energy balance at day 5 of leptin treatment. No such depression was observed in the pair-fed, wild-type samples. (B) Immunoblotting of leptin treated, ob/ob, white adipose tissue nuclear extracts (15 μg) revealed that leptin decreased the levels of the transcriptionally active, 68-kD form of SREBP-1. Pair feeding appeared to moderately induce levels of nuclear SREBP-1 protein relative to PBS-treated samples. Immunoblotting with anti-CREB antibody was used as a control.
To correlate a transcriptional mechanism with the observed patterns of gene expression, the levels of transcriptionally active SREBP-1 protein in white adipose tissue following leptin treatment or pair feeding were measured. Immunoblots of nuclear extracts from ob/ob white adipose tissue revealed that the amount of nuclear, transcriptionally active SREBP-1 protein (i.e., the 68-kD form) was dramatically reduced after 2 or 4 days of leptin treatment (Fig. 7B). In pair-fed animals, the amount of protein was increased relative to PBS controls at day 2 of treatment and remained elevated on day 4. This observation provides a potential mechanism by which some of the differences in gene expression after leptin treatment are effected.
Leptin regulates the expression of transcription factors
The molecular mechanisms by which leptin regulates gene expression in the other clusters is as yet unclear. However in many clusters, leptin specifically modulated the RNA levels of transcription factors. In cluster 3A, leptin specifically corrected the increased levels of the glucocorticoid-induced leucine zipper transcription factor. In other leptin-regulated clusters, additional transcription factors were coordinately regulated such as LIM-1 and 14-3-3 tau (cluster 3A), Kruppel-like factor (cluster 3C), NFκB p65 (cluster 3G), NF-E2 (cluster 3H), DSS1 homolog, Y-box BP (cluster 3N), albumin D-box BP, AEBP-1, the iron responsive element-binding protein (cluster 3M) YL-1 DNA-binding protein (cluster 5A), C/EBPα (cluster 5E), Phox2 (cluster 5F), Stat3, NFI-a, DSS1 homolog (cluster 5I) and SUG1 (cluster 5K). Notably, neither PPARγ (cluster 3P) nor PPARα, both of which have been suggested to play a role in mediating some of leptin's effects (Zhou et al. 1999), changed appreciably in the white adipose tissue of leptin-treated, ob/ob, or wild-type mice. The identity of all of the genes, including transcription factors not mentioned here, are available via the internet at http://arrays.rockefeller.edu/obesity/adipose.
Discussion
Leptin treatment of wild-type and ob/ob mice reduces food intake, body weight, and adipose tissue mass (Halaas et al. 1995). Leptin also has novel effects on fat and glucose metabolism (Kamohara et al. 1997). The molecular features of this novel response are largely unknown. In this report oligonucleotide microarrays have been used to further elucidate the biologic response to this hormone. These data indicate that leptin elicits a unique biologic response that is independent of its effects on food intake. A novel application of k-means clustering has been used to identify clusters of genes that are specifically regulated by leptin in vivo in white adipose tissue. The patterns of leptin-specific gene expression indicate that the response to leptin in adipose tissue is novel and complex. In some cases, the transcriptional response to leptin is mediated by SREBP-1, whereas in other cases the mechanism of gene regulation within a cluster remains to be determined. The identification of the molecular mechanisms that regulate the genes in these clusters is likely to have important implications for understanding the processes regulating body weight and metabolism. More generally, these results indicate that microarrays can be used to generate robust data from dynamic processes in higher organisms in vivo.
To characterize the response of white adipose tissue to changes in leptin concentration at the level of gene expression, oligonucleotide microarrays were used to compare the gene expression profiles in adipose tissue in leptin-deficient ob/ob and wild-type mice. This analysis indicated that the expression profile of ob/ob white adipose tissue is markedly different from that of a lean mouse. This point is illustrated by the fact that 25% of the expressed transcripts on the Affymetrix murine 6500 microarrays are differentially expressed in ob/ob adipose tissue. Northern blots validated the microarray data and established a threshold above which robust data was generated.
The pair-wise comparison of the levels of gene expression in ob/ob and wild-type adipose tissue establishes that leptin deficiency has a global effect on the phenotype of adipose tissue at the molecular level. The identity of the genes that are differentially expressed between wild-type and ob/ob adipose tissue also revealed a number of previously unknown aspects of the response of white adipose tissue to leptin deficiency. Differential expression of several serum proteins not known previously to be expressed in adipose tissue including serum amyloid A4, lipopolysaccharide binding protein, Spi-2 protease inhibitor, cystatin B, and chemokine C10 was observed. The abundance of each of these genes, including those for complement c1q α and β, as well as gene products expressed in macrophages, was markedly increased in ob/ob adipose tissue. Although several links between leptin and immune system function have been reported previously (Lord 1998; Lee et al. 1999), the detected differences in gene expression indicate that leptin deficiency has a more global effect on the expression of inflammatory markers and of acute-phase genes in adipose tissue. These data, together with the observation that these genes are overexpressed in adipocytes, add an important dimension to our understanding of the ob/ob phenotype and of how leptin deficiency perturbs gene expression in adipose tissue. The molecular basis for the altered synthesis of these RNAs awaits further experiments. However, a more complete analysis of the regulatory mechanisms that control these genes may lead to the elucidation of the underlying signal-transduction pathways.
Leptin deficiency also has prominent effects on the expression of genes important in fatty acid biosynthesis. Fatty acid synthase (FAS) RNA was decreased 3.1-fold in the white fat of the ob/ob mouse. FAS catalyzes the reactions leading to de novo fatty acid biosynthesis from malonyl-CoA. This finding would seem to indicate that the rate of fatty acid biosynthesis is not maximal in the adipose tissue of 8-week-old ob/ob mice, despite the fact that these animals exhibit a rapidly increasing size of the adipose tissue mass. Previous studies have established that the activity of key lipogenic enzymes is increased in very young ob/ob mice, even before the obese phenotype is morphologically apparent (Coleman 1978). In other studies, FAS enzymatic activity, transcription, and RNA have been reported to be increased between 2- and 14-fold in the white adipose tissue of young obese Zucker rats examined at 30 days of age (Guichard et al. 1992; Rolland et al. 1995; Boizard et al. 1998). As the age of the animals in these reports was different, the data suggest that the primary source of fatty acid synthesis may shift from adipose tissue to other sites such as liver as ob/ob mice age. This hypothesis is supported by the observed 2.1-fold decrease in the level of SREBP-1 RNA in ob/ob adipose tissue and by other data demonstrating increased amounts of transcriptionally active, nuclear SREBP-1 protein in the liver of 12-week-old ob/ob mice (Shimomura et al. 1999). SREBP-1 has been shown to be important for the transcription of the entire complement of genes necessary for unsaturated fatty acid synthesis in liver (Shimomura et al. 1998). This is also consistent with the finding that many of the genes important for fatty acid synthesis are induced in the ob/ob liver (P. Cohen, in prep.). The transition from adipose to liver as the primary site of fatty acid synthesis could play a role in the generation of the fatty liver seen in the ob/ob mouse. These observations also raise the possibility that the fat content of adipocytes influences their own synthetic processes via an autocrine or other pathway.
Studies of gene expression in ob/ob Tg mice revealed that the subnormal levels of leptin correct some of the abnormalities evident in ob/ob mice, but not others. Furthermore, the level of expression for a subset of genes was normalized in the ob/ob TG mice, but not in ob/ob animals treated with 12 days of leptin (see Fig. 3B,P). The normalization of the expression of these genes was observed despite the fact that the ob/ob animals treated with exogenous leptin were less obese than the age-matched ob/ob TG mice. This group (i.e., normalized in the ob/ob TG mice but not in the leptin-treated group) includes many genes generally thought to play a role in the immune system, including macrophage-related gene Nramp, macrophage metalloelastase, macrosialin, CD53, and GP49 as well as cathepsin S and plasminogen activator inhibitor-1 (see Fig. 3B,P). This finding suggests that some of the changes in gene expression evident in ob/ob white adipose tissue are the result of leptin deficiency during development. Thus, these abnormalities are not corrected acutely by even high levels of the hormone, but are corrected if at least some leptin is present from birth. These findings emphasize the complex nature of the fully developed ob/ob phenotype.
Comprehensive expression monitoring in leptin-treated and pair-fed ob/ob and wild-type white adipose tissue clearly distinguished the effects of leptin treatment from food restriction on a molecular level (see Fig. 3A,C,H,I,L–O; Fig. 5B–I,K,M). These data confirm that leptin has a large number of effects that are independent of its known anorectic actions. The differentially expressed genes in these clusters can serve as molecular markers of the leptin-specific response in ob/ob and wild-type mice.
Cluster analysis of the genes that are regulated by leptin and food restriction identified a group of SREBP-1-regulated genes that are repressed by leptin both in ob/ob and wild-type animals. The genes in obese cluster 3L and wild-type cluster 5K are down-regulated by leptin and include the SREBP-1 transcription factor itself as well as several genes known to be regulated by SREBP-1. In addition, the clusters contain several genes that play a role in fatty acid metabolism that had not been suggested previously to be SREBP regulated. The observation that leptin repressed a largely identical group of genes in both wild-type and ob/ob mice emphasizes their importance in mediating some of leptin's effects. These results also indicate that the repression of SREBP-1-regulated genes that is observed after leptin treatment is independent of its effects on food intake.
The SREBP transcription factors 1 and 2 control the transcription of genes important for fatty acid and cholesterol homeostasis, respectively (Brown and Goldstein 1997; Pai et al. 1998). Adipocyte determination and differentiation factor 1 (ADD1), which is identical to SREBP-1c, was cloned independently as a factor regulated during adipocyte determination and differentiation (Tontonoz et al. 1993). SREBP transcription factors are primarily regulated through sterol-dependent proteolytic cleavage of an endoplasmic reticulum membrane-bound precursor (for review, see Brown and Goldstein 1997, 1999). After cleavage, transcriptionally active SREBP translocates to the nucleus. In leptin-treated white adipose tissue, there is a decrease in both SREBP-1 RNA levels and a coordinate decrease in transcriptionally active SREBP-1 protein. It thus appears that leptin suppresses fatty acid biosynthesis, at least in part, by a reduction of the levels of cleaved, nuclear SREBP-1 protein. It is as yet unknown whether the effects of leptin are a consequence of its effects on the lipid content of adipocytes, the efficiency of SREBP-1 cleavage, or another mechanism.
The level of expression of SREBP-1-regulated genes in leptin-treated wild-type mice is correlated with the state of energy balance. The data from both the microarrays and the accompanying Northern blots indicate that leptin only transiently depressed the abundance of the RNAs encoding the SREBP-1-regulated genes. During leptin-mediated weight loss, a state of negative energy balance persists until adipose tissue is depleted (Halaas et al. 1997). This interval coincided with the suppression of SREBP-1-regulated genes. The level of expression of these genes returns to baseline at day 5 of leptin treatment, at which point animals are known to reenter a state of neutral energy balance (Halaas et al. 1997). Thus it appears that the potential for biosynthesis of fatty acids in leptin-treated adipose tissue returns to normal once a state of energy balance is achieved.
Minimal changes were seen in other factors reported previously to be regulated in adipose tissue by leptin. Of note, neither the previously reported down-regulation of PPARγ nor the coordinate up-regulation of PPARα RNAs were observed in either ob/ob or wild-type mice treated with leptin (Zhou et al. 1999). Similarly, the RNA levels of uncoupling proteins 1 and 2 did not change across the experimental manipulations. PPARα and PPARγ are key regulators of adipose fatty acid synthesis and degradation and their RNAs as well as those for UCP-1 and UCP-2 have been shown to be leptin responsive in rats (Zhou et al. 1997, 1999). The basis for this discrepancy is not known. Leptin may have effects on PPARγ and PPARα that are not at the level of gene expression. Given the recent demonstration that SREBP-1 can modulate PPARγ activity through production of an endogenous ligand (Kim et al. 1998), leptin could decrease PPARγ activity through SREBP-1.
Genes identified previously as in vitro markers of adipocyte differentiation are also differentially regulated in ob/ob and wild-type adipose tissue. Cluster analysis revealed that these genes are present in clusters that are abnormal in the ob/ob mouse and that are specifically normalized by leptin (clusters 3A and 3O). The abnormal expression of these markers indicates that white adipose tissue without leptin can be considered to be in a state of increased adipocyte differentiation. Furthermore, leptin replacement corrected the expression of these markers largely to wild-type levels. Pair feeding had no apparent effect on the expression of these genes. This suggests that leptin's weight-reducing effects are in part due to a correction of the augmented expression of the genes in these clusters. It has been suggested previously that leptin activates a program of adipocyte reverse differentiation (Zhou et al. 1999). The increased level of expression of these genes in ob/ob adipose tissue is consistent with this possibility. However, these same genes were largely unaffected by leptin treatment of wild-type mice, indicating that leptin does not lead to the global dedifferentiation of adipose tissue, at least as assessed with these markers. The observation that leptin normalizes the expression of these genes, but that there is no additional effect of leptin in treated wild-type animals, is one of many examples in which the response of an ob/ob animal to leptin differs from the response of a lean (wild-type) animal. These findings suggest that leptin has different effects in a setting of leptin deficiency (i.e., ob/ob mice) as compared with its effects in animals that have physiologic levels of the hormone.
These data also suggest the possibility that a number of hormonal or neural factors are likely to be involved in effecting leptin's response in white adipose tissue in vivo. In ob/ob mice, leptin normalized the expression of the glucocorticoid-induced leucine zipper transcription factor, which is up-regulated 12.2-fold in untreated obese adipose (Figs. 3A and 4B). The regulation of glucocorticoid-responsive molecules is physiologically relevant as the ob/ob mouse has an elevated plasma corticosterone level that is normalized by leptin (Coleman 1978; Harris et al. 1998). Additionally, leptin partially normalized the expression of a cluster of genes that includes the β-3 adrenergic receptor, the insulin-like growth hormone-binding protein-6, which is involved in growth hormone action, and an insulin-induced protein PHAS-1 (Fig. 3O). None of these effects were seen with pair feeding, adding further evidence to the possibility that leptin activates a novel set of effectors, which in turn elicit a complex set of effects in adipose tissue.
It is as yet unknown whether these actions of leptin are direct (autocrine) or indirect. These two possibilities can be resolved by generating tissue-specific knockouts of the leptin receptor now underway. However, the available published evidence supports the hypothesis that leptin acts indirectly via the hypothalamus. If true, the genes in this (and other) cluster can serve as markers for a set of novel efferent signals from the CNS that regulate adipose tissue metabolism. Further studies of the factors regulating their expression is likely to reveal the components of the signal transduction pathway activated directly or indirectly by leptin.
The studies reported here represent a successful clustering of genes in a higher organism in vivo in response to a dynamic stimulus, changing leptin concentrations. In this study, novel application of k-means clustering to mammalian microarray data was used to elucidate patterns of leptin-specific gene expression. K-means clustering organizes data by fitting the best k examples (means) with no prior knowledge of patterns of expression within the data. This modified k-means algorithm (1) did not subtract out mean expression level prior to clustering, (2) used a recursive procedure to find initial conditions, and (3) used multiple (1000) iterations over varying random initial conditions. Final cluster output was chosen to optimize the χ2 statistic (which measures dispersion about the cluster means) and the trace of the scattering matrices (which measures cluster separation relative to cluster width). A priori selection of genes with robust expression changes combined with the use of this algorithm allowed the identification of kinetically distinct clusters and minimization of noise bias in the clustering output without any other manipulation of the data. Thus the patterns represented in the cluster output are strictly those inherent in the data. Independent clustering of genes in ob/ob and wild-type experiments allowed for elucidation of both robust and subtle patterns of gene expression evident in each data set. The large differences in the range of expression data in ob/ob and wild-type experiments prevented their simultaneous clustering, as ob/ob data tended to obscure patterns within wild-type expression data.
A similar method of k-means clustering has been used recently to characterize patterns of gene expression in the yeast cell cycle (Tavazoie et al. 1999). However, that report did not utilize the modifications outlined above, which were critical in generating kinetically distinct clusters from this data set. The algorithm that was used proved superior to algorithms such as hierarchical clustering or self-organizing maps for this data set. However, as the success of cluster methods is to some extent data-set specific, it remains to be seen whether the performance of this method can be reproduced with other data sets.
The principle challenge now turns to the ways in which the data generated in these studies can be used to extract additional information. The development of better analytic techniques for examining subtle changes in gene expression will be necessary for a fuller understanding of the molecular basis of the response to leptin. The reduction of large amounts of data to patterns of expression allowed us and others to attempt, with follow up studies, to validate and interpret the significance of the observed expression changes. The functional importance of the genes in the clusters can be tested by conventional methods. This possibility was validated by the observation that leptin regulated the activity of SREBP-1 and the genes that it in turn regulates. Many of the genes in other clusters are also likely to be regulated coordinately. Further studies of the gene regulatory mechanisms of the genes in each cluster may reveal important insights into the mechanisms of leptin's actions and the regulation of adipose tissue mass and body weight.
Materials and methods
Animal experiments
Eight-week-old C57Bl/6J+/+ or ob/ob female mice purchased from Jackson Laboratories were used for all experiments, except ob/ob Tg mice, which were generated as described previously (Ioffe et al. 1998). Alzet 2002 mini-osmotic pumps (Alza, Palo Alto, CA) were filled with PBS (control and pair-fed groups) or 400 ng/μl leptin (Amgen, Thousand Oaks, CA), incubated overnight at 37°C in sterile 0.9% NaCl, and implanted subcutaneously under anesthesia. Body mass and food intake were measured daily at 0800 hr. Wild-type animals were injected intraperitoneally twice daily at 0800 hr and 1830 hr with PBS (control and pair-fed groups) or leptin (20 mg/kg/injection) and daily body mass and food intake were monitored at 0800 hr. In both ob/ob and wild-type experiments, pair-fed animals were staggered one day behind the other groups and fed an amount equal to the average amount of food consumed by the leptin group the previous day. Statistical significance in body mass and food intake between groups was determined using an unequal variance Student's t-test. Animals were sacrificed by cervical dislocation and periuterine white adipose tissue was excised, frozen on liquid nitrogen, and kept at −80°C until further processing.
Northern blotting analysis
Total RNA from white adipose tissue was isolated using Trizol (GIBCO BRL, Rockville, MD). Between 5 and 20 μg of Total RNA was separated by denaturing formaldehyde electrophoresis and transferred by capillary blot to positively charged nylon membranes as described (Sambrook et al. 1989). Blots were prehybridized at 42°C with Ultra-hyb (Ambion, Austin, TX), and hybridized with 1 MCPM/ml of [32P]dCTP-labeled DNA probe generated by random labeling or PCR, washed to high stringency, and exposed to radiographic film as described (Ausubel et al. 1999).
Analysis of nuclear SREBP-1 protein
ob/ob female mice were treated with PBS, leptin, or PBS and pair fed as described above. Fresh tissue was rinsed in ice cold PBS with 1 mm DTT and 0.5 mm PMSF, minced, and homogenized with 10 strokes of a dounce homogenizer in NDS buffer at 4°C (10 mm Tris at pH 7.5, 10 mm NaCl, 60 mm KCl, 0.15 mm spermine, 0.5 mm spermidine, 14 mm β-mercaptoethanol, 0.5 mm EGTA, 2 mm EDTA, 0.5% NP-40, 1 mm DTT, and 0.1 mm PMSF) supplemented with protease inhibitors (Complete, Roche, Indianapolis, IN). NP-40 concentration was increased to 1% and nuclei were pelleted at 700g for 5 min, washed once with NDS buffer (1% NP-40), pelleted at 500g for 5 min, resuspended in 1 volume of 1% citric acid, lysed by the addition of 2.5 volumes of 0.1 m Tris, 2.5% SDS, and 0.1 m DTT, sonicated briefly, and heated to 90°C for 5 min. Western blotting was carried out using 15 μg of nuclear extract as described previously (Sambrook et al. 1989). SREBP-1 was detected using a 5 μg/ml rabbit anti-mouse SREBP-1 (kindly provided by M. Brown, University of Texas Southwest, Brownsville, TX). CREB was detected using a 1:1000 dilution of anti-CREB (NEB, Beverly, MA). Bound antibodies were detected using a HRP-coupled anti-rabbit IgG secondary antibody (Organon Teknika, West Chester, PA) and visualized using Enhanced Chemiluminesence Plus (Amersham, UK).
Oligonucleotide microarray analysis
Total RNA from white adipose tissue was pooled from at least four animals for each experiment. Biotin-labeled cRNA synthesis was completed with either 20 μg of total RNA cleaned with RNeasy columns (Qiagen, Valencia, CA) or 2.5 μg of poly(A)+ RNA isolated with Oligotex oligo(dT) beads (Qiagen) according to the Affymetrix technical manual. Hybridization, washing, and staining of Affymetrix Genechip Mu6500 probe arrays was carried out according to the Affymetrix technical manual in an Affymetrix hybridization oven and fluidics station. The arrays were scanned using a Hewlett Packard confocal laser scanner and visualized using Affymetrix Genechip 3.1 software (Affymetrix). Technical details of this analysis are available via the internet at http://arrays.rockefeller.edu/obesity/adipose.
K-means cluster analysis
The abundance of each gene was scored as an average difference value by comparing the intensity of hybridization to 20 sets of perfect match 25-mer oligonucleotides relative to 20 sets of mismatched oligonucleotides using Affymetrix Genechip 3.1 software. Each experiment was compared with wild-type untreated baseline to evaluate fold change and average difference change values. The complete data sets were filtered to include only those genes that met the following criteria in at least one (wild-type clustering) or two (ob/ob clustering) time points. (1) Fold change, >2.0, and average difference change, >250, or (2) fold change, >1.5 and average difference change, >1000. In addition, genes were not included in the analysis unless given a score of I (increased) or D (decreased) by the Affymetrix Genechip software in these same time points. Many different selection criteria were evaluated using Northern analysis and clustering output to determine the optimal cutoffs for each group of experiments.
Filtered data was clustered on the basis of the values of the fold change quantity. Prior to clustering, the fold change parameter was transformed as follows: logFC = log(FC) if FC > = 0 and logFC = log(−1/FC) if FC < 0. The logFC values were then used to create a d-dimensional vector (d = number of experiments included in the clustering) for each of N genes included from the filtered data set. These N, d-dimensional vectors were normalized to the unit sphere and used as input into the clustering algorithm.
Clustering was completed using a variation of the k-means clustering algorithm (Hartigan 1975; Kohonen 1997). To prevent the algorithm from getting trapped in a local minimum, we used a recursive technique (Duda and Hart 1973) to begin clustering. Briefly, the mean of the entire sample was determined, followed by the calculation of up to k means. To go from any j − 1 to j means, the mean associated with the cluster with the largest scatter was split into two closely separated points. The means were then allowed to relax according to the standard k-means iteration as follows: (1) initialize the k-mean vectors, (2) add each data point to the closest mean vector, (3) update the value of the mean vectors by assigning them to the mean of their respective group, and (4) repeat steps 2 and 3 until the change in the mean vectors is smaller than some user-specified tolerance. The clustering output was further optimized by running 1000 iterations of the above algorithm. To evaluate the output of cluster analysis and to determine the optimal number of clusters, both the χ2 statistic and the trace of the scattering matrices were utilized, calculated as described (Duda and Hart 1973). Mean expression pattern was calculated from the normalized gene vectors in a cluster. Statistical significance was determined using an unequal variance Student's t-test.
Self-organizing map and hierarchical cluster analysis
Data was clustered as described by standard Hierarchical techniques (Everitt 1993) and Self-organizing maps (Kohonen 1997) using the dot-product metric. Five linkage methods were used for hierarchical analysis as follows: single, complete, average, centroid, and Ward. For the SOM, the learning rate and the neighborhood topology functions described previously were used (Tamayo et al. 1999). However, the update rule was modified to keep the mean vectors normalized by using the dot-product SOM (Kohonen 1997) and iterated 1000 and 5000 times through the data set. Cluster number was chosen to match the k-means analysis (16 for the obese data set and 13 for the wild-type data set), except the wild-type SOM, which was run for 12 and 14 clusters to preserve even geometry.
Acknowledgments
We thank S. Korres for assistance in preparing the manuscript. We also thank Drs. M. Brown, E. Siggia, M. Stoffel, A. Viale, and J. Montez for discussions and critical readings. Thanks to M. Brown for generously providing the SREBP-1 antibody. We thank G. Fergus, A. Szabo, B. Holbrook, B. Shiels, J. Lescallett, and R. Diskin at Affymetrix. Thanks to F. Isdell and M. Genova for Genechip technical assistance. This work was supported by NIH/NINDS NS39662 (J.M.F.), by NIH MSTP grant GM07739 (A.S. and P.C.) and by NSF grant DMR7932803 and Alfred P. Sloan Foundation (N.D.S.).
The publication costs of this article were defrayed in part by payment of page charges. This article must therefore be hereby marked “advertisement” in accordance with 18 USC section 1734 solely to indicate this fact.
Footnotes
E-MAIL friedj@rockvax.rockefeller.edu; FAX (212) 327-7420.
References
- Ahima RS, Prabakaran D, Mantzoros C, Qu D, Lowell B, Maratos-Flier E, Flier JS. Role of leptin in the neuroendocrine response to fasting. Nature. 1996;382:250–252. doi: 10.1038/382250a0. [DOI] [PubMed] [Google Scholar]
- Ausubel FM, Brent R, Kingston RE, Moore DD, Seidman JG, Smith JA, Struhl K. Current protocols in molecular biology. New York, NY: Wiley and Sons; 1999. [Google Scholar]
- Boizard M, Le Liepvre X, Lemarchand P, Foufelle F, Ferre P, Dugail I. Obesity-related overexpression of fatty-acid synthase gene in adipose tissue involves sterol regulatory element-binding protein transcription factors. J Biol Chem. 1998;273:29164–29171. doi: 10.1074/jbc.273.44.29164. [DOI] [PubMed] [Google Scholar]
- Brown MS, Goldstein JL. The SREBP pathway: Regulation of cholesterol metabolism by proteolysis of a membrane-bound transcription factor. Cell. 1997;89:331–340. doi: 10.1016/s0092-8674(00)80213-5. [DOI] [PubMed] [Google Scholar]
- ————— A proteolytic pathway that controls the cholesterol content of membranes, cells and blood. Proc Natl Acad Sci. 1999;96:11041–11048. doi: 10.1073/pnas.96.20.11041. [DOI] [PMC free article] [PubMed] [Google Scholar]
- Campfield LA, Smith FJ, Guisez Y, Devos R, Burn P. Recombinant mouse OB protein: Evidence for a peripheral signal linking adiposity and central neural networks. Science. 1995;269:546–549. doi: 10.1126/science.7624778. [DOI] [PubMed] [Google Scholar]
- Coleman DL. Obese and Diabetes: Two mutant genes causing diabetes-obesity syndromes in mice. Diabetologia. 1978;14:141–148. doi: 10.1007/BF00429772. [DOI] [PubMed] [Google Scholar]
- Collins S, Kuhn CM, Petro AE, Swick AG, Chrunyk BA, Surwit RS. Role of leptin in fat regulation. Nature. 1996;380:677. doi: 10.1038/380677a0. [DOI] [PubMed] [Google Scholar]
- Duda RO, Hart PE. Pattern classification and scene analysis. New York, NY: Wiley & Sons; 1973. [Google Scholar]
- Dunbar JC, Hu Y, Lu H. Intracerebroventricular leptin increases lumbar and renal sympathetic nerve activity and blood pressure in normal rats. Diabetes. 1997;46:2040–2043. doi: 10.2337/diab.46.12.2040. [DOI] [PubMed] [Google Scholar]
- Eisen MB, Spellman PT, Brown PO, Botstein D. Cluster analysis and display of genome-wide expression patterns. Proc Natl Acad Sci. 1998;95:14863–14868. doi: 10.1073/pnas.95.25.14863. [DOI] [PMC free article] [PubMed] [Google Scholar]
- Elmquist JE, Elias CF, Saper CB. From lesions to leptin: Hypothalamic control of food intake and body weight. Neuron. 1999;22:221–232. doi: 10.1016/s0896-6273(00)81084-3. [DOI] [PubMed] [Google Scholar]
- Everitt BS. Cluster analysis. 3rd Ed Edition. New York, NY: Oxford University Press; 1993. [Google Scholar]
- Fei H, Okano HJ, Li C, Lee G-H, Zhao C, Darnell R, Friedman JM. Anatomic localization of alternatively spliced leptin receptors (Ob-R) in mouse brain and other tissues. Proc Natl Acad Sci. 1997;94:7001–7005. doi: 10.1073/pnas.94.13.7001. [DOI] [PMC free article] [PubMed] [Google Scholar]
- Friedman JM, Halaas JL. Leptin and the regulation of body weight in mammals. Nature. 1998;395:763–770. doi: 10.1038/27376. [DOI] [PubMed] [Google Scholar]
- Guichard C, Dugail I, Le Liepvre X, Lavau M. Genetic regulation of fatty acid synthase expression in adipose tissue: Overtranscription of the gene in genetically obese rats. J Lipid Res. 1992;33:679–687. [PubMed] [Google Scholar]
- Halaas JL, Gajiwala KS, Maffei M, Cohen SL, Chait BT, Rabinowitz D, Lallone RL, Burley SK, Friedman JM. Weight-reducing effects of the plasma protein encoded by the obese gene. Science. 1995;269:543–546. doi: 10.1126/science.7624777. [DOI] [PubMed] [Google Scholar]
- Halaas JL, Boozer C, Blair-West J, Fidahusein N, Denton D, Friedman JM. Physiological response to long-term peripheral and central leptin infusion in lean and obese mice. Proc Natl Acad Sci. 1997;94:8878–8883. doi: 10.1073/pnas.94.16.8878. [DOI] [PMC free article] [PubMed] [Google Scholar]
- Harris RB, Zhou J, Redmann SM, Jr, Smagin GN, Smith SR, Rodgers E, Zachwieja JJ. A leptin dose-response study in obese (ob/ob) and lean (+/?) mice. Endocrinology. 1998;139:8–19. doi: 10.1210/endo.139.1.5675. [DOI] [PubMed] [Google Scholar]
- Hartigan JA. Clustering algorithms. New York, NY: Wiley & Sons; 1975. [Google Scholar]
- Haynes WG, Morgan DA, Walsh SA, Mark AL, Sivitz WI. Receptor-mediated regional sympathetic nerve activation by leptin. J Clin Invest. 1997;100:270–278. doi: 10.1172/JCI119532. [DOI] [PMC free article] [PubMed] [Google Scholar]
- He GP, Muise A, Li AW, Ro HS. A eukaryotic transcriptional repressor with carboxypeptidase activity. Nature. 1995;378:92–96. doi: 10.1038/378092a0. [DOI] [PubMed] [Google Scholar]
- Ioffe E, Moon B, Connolly E, Friedman JM. Abnormal regulation of the leptin gene in the pathogenesis of obesity. Proc Natl Acad Sci. 1998;95:11852–11857. doi: 10.1073/pnas.95.20.11852. [DOI] [PMC free article] [PubMed] [Google Scholar]
- Kamohara S, Burcelin R, Halaas JL, Friedman JM, Charron MJ. Acute intravenous and intracerebroventricular leptin infusion increases glucose uptake and glucose turnover by an insulin independent mechanism. Nature. 1997;389:374–377. [Google Scholar]
- Kim JB, Wright HM, Wright M, Spiegelman BM. ADD1/SREBP1 activates PPARgamma thorugh the production of endogenous ligand. Proc Natl Acad Sci. 1998;95:4333–4337. doi: 10.1073/pnas.95.8.4333. [DOI] [PMC free article] [PubMed] [Google Scholar]
- Kohonen T. Self-organizing maps. 2nd ed, Springer series in information sciences. Vol. 426. 1997. Berlin, Germany. [Google Scholar]
- Lee FY, Li Y, Yang EK, Yang SQ, Lin HZ, Trush MA, Dannenberg AJ, Diehl AM. Phenotypic abnormalities in macrophages from leptin-deficient, obese mice. Am J Physiol. 1999;276:C386–C394. doi: 10.1152/ajpcell.1999.276.2.C386. [DOI] [PubMed] [Google Scholar]
- Lee GH, Proenca R, Montez JM, Carroll KM, Darvishzadeh JG, Lee JI, Friedman JM. Abnormal splicing of the leptin receptor in diabetic mice. Nature. 1996;379:632–635. doi: 10.1038/379632a0. [DOI] [PubMed] [Google Scholar]
- Levin N, Nelson C, Gurney A, Vandlen R, de Sauvage F. Decreased food intake does not completely account for adiposity reduction after ob protein infusion. Proc Natl Acad Sci. 1996;93:1726–1730. doi: 10.1073/pnas.93.4.1726. [DOI] [PMC free article] [PubMed] [Google Scholar]
- Lord G. Leptin modulates the T-cell immune response and reverses starvation induced immunosuppression. Nature. 1998;394:897–891. doi: 10.1038/29795. [DOI] [PubMed] [Google Scholar]
- Maffei M, Halaas J, Ravussin E, Pratley RE, Lee GH, Zhang Y, Fei H, Kim S, Lallone R, Ranganathan S, Kern PA, Friedman JM. Leptin levels in human and rodent: Measurement of plasma leptin and ob RNA in obese and weight-reduced subjects. Nat Med. 1995;1:1155–1161. doi: 10.1038/nm1195-1155. [DOI] [PubMed] [Google Scholar]
- Morton NM, Emilsson V, Liu YL, Cawthorne MA. Leptin action in intestinal cells. J Biol Chem. 1998;273:26194–26201. doi: 10.1074/jbc.273.40.26194. [DOI] [PubMed] [Google Scholar]
- Pai JT, Guryev O, Brown MS, Goldstein JL. Differential stimulation of cholesterol and unsaturated fatty acid biosynthesis in cells expressing individual nuclear sterol regulatory element-binding proteins. J Biol Chem. 1998;273:26138–26148. doi: 10.1074/jbc.273.40.26138. [DOI] [PubMed] [Google Scholar]
- Pelleymounter MA, Cullen MJ, Baker MB, Hecht R, Winters D, Boone T, Collins F. Effects of the obese gene product on body weight regulation in ob/ob mice. Science. 1995;269:540–543. doi: 10.1126/science.7624776. [DOI] [PubMed] [Google Scholar]
- Rolland V, Dugail I, Le Lepvre X, Lavau M. Evidence of increased glyceraldehyde-3-phosphate dehydrogenase and fatty acid synthetase promoter activities in transiently transfected adipocytes from genetically obese rats. J Biol Chem. 1995;270:1102–1106. doi: 10.1074/jbc.270.3.1102. [DOI] [PubMed] [Google Scholar]
- Sambrook J, Fritsch EF, Maniatis T. Molecular cloning: A laboratory manual. 2nd ed. Cold Spring Harbor, NY: Cold Spring Harbor Laboratory Press; 1989. [Google Scholar]
- Shimabukuro M, Koyama K, Chen GX, Wang MY, Trieu F, Lee Y, Newgard CB, Unger RH. Direct antidiabetic effect of leptin through triglyceride depletion of tissues. Proc Natl Acad Sci. 1997;94:4637–4641. doi: 10.1073/pnas.94.9.4637. [DOI] [PMC free article] [PubMed] [Google Scholar]
- Shimomura I, Shimano H, Korn BS, Bashmakov Y, Horton JD. Nuclear sterol regulatory element-binding proteins activate genes responsible for the entire program of unsaturated fatty acid biosynthesis in transgenic mouse liver. J Biol Chem. 1998;273:35299–35306. doi: 10.1074/jbc.273.52.35299. [DOI] [PubMed] [Google Scholar]
- Shimomura I, Bashmakov Y, Horton JD. Increased levels of nuclear SREBP-1c associated with fatty livers in two mouse models of diabetes mellitus. J Biol Chem. 1999;274:30028–30032. doi: 10.1074/jbc.274.42.30028. [DOI] [PubMed] [Google Scholar]
- Sierra-Honigmann M, Nath A, Murakami C, Garcia-Cardena G, Papapetropoulos A, Sessa W, Madge L, Schechner J, Schwabb M, Polverini P, Flores-Riveros J. Biologic action of leptin as an angiogenic factor. Science. 1998;281:1683–1686. doi: 10.1126/science.281.5383.1683. [DOI] [PubMed] [Google Scholar]
- Slieker LJ, Sloop KW, Surface PL, Kriauciunas A, LaQuier F, Manetta J, Bue-Valleskey J, Stephens TW. Regulation of expression of ob mRNA and protein by glucocorticoids and cAMP. J Biol Chem. 1996;271:5301–5304. doi: 10.1074/jbc.271.10.5301. [DOI] [PubMed] [Google Scholar]
- Tabor E, Kim JB, Spiegelman BM, Edwards PA. Transcriptional activation of the stearoyl-CoA desaturase 2 gene by sterol regulatory element-binding protein/adipocyte determination and differentiation factor 1. J Biol Chem. 1998;273:22052–22058. doi: 10.1074/jbc.273.34.22052. [DOI] [PubMed] [Google Scholar]
- Tamayo P, Slonim D, Mesirov J, Zhu Q, Kitareewan S, Dmitrovsky E, Lander ES, Golub TR. Interpreting patterns of gene expression with self-organizing maps: Methods and application to hematopoietic differentiation. Proc Natl Acad Sci. 1999;96:2907–2912. doi: 10.1073/pnas.96.6.2907. [DOI] [PMC free article] [PubMed] [Google Scholar]
- Tavazoie S, Hughes JD, Campbell MJ, Cho RJ, Church GM. Systematic determination of genetic network architecture. Nat Genet. 1999;22:281–285. doi: 10.1038/10343. [DOI] [PubMed] [Google Scholar]
- Tontonoz P, Kim JB, Graves RA, Spiegelman BM. ADD1: A novel helix-loop-helix transcription factor associated with adipocyte determination and differentiation. Mol Cell Biol. 1993;13:4753–4759. doi: 10.1128/mcb.13.8.4753. [DOI] [PMC free article] [PubMed] [Google Scholar]
- Yeh WC, Li TC, Bierer BE, McKnight SL. Identification and characterization of an immunophilin expressed during the clonal expansion phase of adipocyte differentiation. Proc Natl Acad Sci. 1995;92:11081–11085. doi: 10.1073/pnas.92.24.11081. [DOI] [PMC free article] [PubMed] [Google Scholar]
- Yokoyama C, Wang X, Briggs MR, Admon A, Wu J, Hua X, Goldstein JL, Brown MS. SREBP-1, a basic-helix-loop-helix-leucine zipper protein that controls transcription of the low density lipoprotein receptor gene. Cell. 1993;75:187–197. [PubMed] [Google Scholar]
- Zhang Y, Proenca P, Maffei M, Barone M, Leopold L, Friedman JM. Positional cloning of the mouse obese gene and its human homologue. Nature. 1994;372:425–432. doi: 10.1038/372425a0. [DOI] [PubMed] [Google Scholar]
- Zhou Y-T, Shimabukuro M, Koyama K, Lee Y, Wang M-Y, Trieu F, Newgard CB, Unger RH. Induction by leptin of uncoupling protein-2 and enzymes of fatty acid oxidation. Proc Natl Acad Sci. 1997;94:6386–6390. doi: 10.1073/pnas.94.12.6386. [DOI] [PMC free article] [PubMed] [Google Scholar]
- Zhou YT, Wang ZW, Higa M, Newgard CB, Unger RH. Reversing adipocyte differentiation: Implications for treatment of obesity. Proc Natl Acad Sci. 1999;96:2391–2395. doi: 10.1073/pnas.96.5.2391. [DOI] [PMC free article] [PubMed] [Google Scholar]