

Abstract
To maintain cellular ATP levels, hypoxia leads to Na,K-ATPase inhibition in a process dependent on reactive oxygen species (ROS) and the activation of AMP-activated kinase α1 (AMPK-α1). We report here that during hypoxia AMPK activation does not require the liver kinase B1 (LKB1) but requires the release of Ca2+ from the endoplasmic reticulum (ER) and redistribution of STIM1 to ER-plasma membrane junctions, leading to calcium entry via Ca2+ release-activated Ca2+ (CRAC) channels. This increase in intracellular Ca2+ induces Ca2+/calmodulin-dependent kinase kinase β (CaMKKβ)-mediated AMPK activation and Na,K-ATPase downregulation. Also, in cells unable to generate mitochondrial ROS, hypoxia failed to increase intracellular Ca2+ concentration while a STIM1 mutant rescued the AMPK activation, suggesting that ROS act upstream of Ca2+ signaling. Furthermore, inhibition of CRAC channel function in rat lungs prevented the impairment of alveolar fluid reabsorption caused by hypoxia. These data suggest that during hypoxia, calcium entry via CRAC channels leads to AMPK activation, Na,K-ATPase downregulation, and alveolar epithelial dysfunction.
INTRODUCTION
Alveolar hypoxia occurs in patients with respiratory failure due to lung injury and also while climbing at high altitudes, which may result in pulmonary edema and impaired gas exchange (42, 45). Alveolar fluid reabsorption (AFR) is effected by active Na+ transport across the epithelium, mostly via apical sodium channels and the basolateral Na,K-ATPase (34, 52). The Na,K-ATPase transports Na+ and K+ across the cell to maintain ionic gradients, while consuming ∼40% of cellular ATP in mammalian cells (32). Hypoxia inhibits Na,K-ATPase activity by decreasing the number of active Na+ pump molecules at the plasma membrane (11), which impairs lung fluid clearance (26, 51).
Hypoxia-induced Na,K-ATPase downregulation requires the generation of mitochondrial reactive oxygen species (ROS) and the phosphorylation of the Na,K-ATPase α-subunit by protein kinase Cζ (PKCζ) (11). More recently, we have reported that the activation of AMP-activated kinase (AMPK) by hypoxia/ROS inhibits Na,K-ATPase activity by directly phosphorylating PKCζ which triggers the hypoxia-induced Na,K-ATPase endocytosis (14).
AMPK is a serine/threonine kinase consisting of a catalytic subunit (α1 or α2) and β and γ regulatory subunits. In mammals, AMPK is regulated allosterically by AMP and by reversible phosphorylation of a conserved threonine (Thr-172) in the activation loop of its α catalytic subunit by upstream kinases (8). At least two kinases have been described to phosphorylate AMPK: liver kinase B1 (LKB1), which transduces signals that are generated by changes in the cellular energy status, and Ca2+/calmodulin-dependent kinase kinase β (CaMKKβ), which senses changes in intracellular calcium (16, 18, 20, 50, 53, 54). It has been recently reported that LKB1 is the predominant upstream kinase for AMPKα2 activation in skeletal muscle and heart, while other kinases activate AMPKα1 (39). Activation of CaMKKβ occurs following increases in intracellular Ca2+, and it has been described as the main kinase that activates AMPK in the response of endothelial cells to thrombin, in activated T lymphocytes, and in the response of alveolar epithelial cells to hypercapnia and glucose uptake through the activation of the M3-muscarinic acetylcholine receptor in muscle cells (30, 31, 44, 50). However, the source of calcium regulating AMPK has not been elucidated.
Store-operated calcium (SOC) entry, a major route of Ca2+ influx in nonexcitable cells, is activated by the depletion of endoplasmic reticulum (ER) Ca2+ stores (36). The best characterized store-operated current (ICRAC) is carried by calcium release-activated calcium (CRAC) channels (36). The opening of CRAC channels refills the Ca2+ stores at the ER, leading to long-lasting calcium signals which modulate biological responses (37). Significant breakthroughs in the field occurred with the identification of stromal interaction molecule 1 (STIM1) as the sensor for ER Ca2+ depletion and of Orai1 (also known as CRACM1) as the pore-forming subunit of CRAC channels (7, 24). Recent studies have shown that Orai1 is constitutively present in the plasma membrane, while STIM1, an ER resident, is rapidly redistributed into discrete puncta that accumulate near the plasma membrane upon store depletion (27, 33, 35, 55). However, the relevance of Ca2+ influx via CRAC channels in AMPK activation and/or hypoxia-induced alveolar epithelial physiology has not been elucidated. In the present study, we provide evidence that hypoxia triggers CRAC channel activation via mitochondrial ROS, leading to Ca2+/CaMKKβ-dependent AMPK activation and thus to Na,K-ATPase endocytosis and inhibition of alveolar fluid clearance.
MATERIALS AND METHODS
Animals.
Pathogen-free adult male Sprague-Dawley rats (300 to 325 g) were from Harlan. Animals were provided with food and water ad libitum, were maintained on a 12-hour light/12-hour dark cycle, and were handled according to NIH guidelines and the Northwestern University Animal Care and Use Committee-approved experimental protocols.
Reagents.
All cell culture reagents were from Mediatech Inc. 22Na+ and [3H]mannitol were from Perkin-Elmer. 1,2-Bis(2-aminophenoxy)ethane-N,N,N′,N′-tetraacetic acid-acetoxymethyl ester (BAPTA-AM), thapsigargin (TG), ionomycin, lanthanum(III) chloride, nifedipine, and tert-butyl hydroperoxide (t-H2O2) were from Sigma-Aldrich. STO-609 and human CaMKKβ siRNA duplexes were purchased from Qiagen. Human STIM1, Orai1, and a nonsilencing small interfering RNA (siRNA) were purchased from Ambion. Lipofectamine RNAiMAX and Lipofectamine 2000 were from Invitrogen. EZ-Link N-hydroxysuccinimide-SS-biotin and streptavidin-agarose beads were purchased from Pierce Biotechnology. All other chemicals were the highest grade available.
Alveolar type II (ATII) cell isolation and cell culture.
ATII cells were isolated from the lungs of pathogen-free adult male Sprague-Dawley rats (200 to 225 g) at the Cell Culture and Physiology Core in the Division of Pulmonary and Critical Care Medicine at Northwestern University, as described previously (38). Cells were used on days 2 and 3 after the isolation. Human A549 cells (ATCC CCL 185; a human adenocarcinoma cell line) were grown in Dulbecco's modified Eagle's medium (DMEM) supplemented with 10% fetal bovine serum, 100 U/ml penicillin, 100 μg/ml streptomycin, and 20 μM HEPES. A549 cells transfected with the mammalian expression plasmid p-Babe-puro (A549 p-Babe cells), with pBabe plus LKB1 (A549+LKB1 cells), or with pBabe plus kinase-dead LKB1 (A549+LKB1 KD cells) (14, 22) were grown in DMEM supplemented with 400 μg/ml of Geneticin. To generate mitochondrion-deficient ρ0-A549 cells, A549 cells were incubated in DMEM containing ethidium bromide (50 ng/ml) as described previously (11, 21). Prior to hypoxia exposure, cells were serum starved for 4 h. Hypoxic conditions (1.5% O2, 93.5% N2, and 5% CO2) were achieved by equilibrating the medium overnight in a humidified workstation (In Vivo 300; Ruskinn Technology) that continuously monitors the chamber's oxygen tension as described previously (11).
Biotinylation of cell surface proteins.
Cells were labeled for 20 min using 1 mg/ml EZ-Link N-hydroxysuccinimide-SS-biotin and lysed in modified radioimmunoprecipitation assay (RIPA) buffer (50 mM Tris-HCl [pH 8], 150 mM NaCl, 1% NP-40, 1% sodium deoxycholate, and protease inhibitors) as previously described (11). Surface proteins were pulled down with streptavidin-agarose beads and analyzed by sodium dodecyl sulfate-polyacrylamide gel electrophoresis (SDS-PAGE) and Western blotting.
Transfection of A549 cells with siRNA.
A549, A549 p-Babe, A549+LKB1, or A549 +LKB1 KD cells were transfected with human CaMKKβ, STIM1, and Orai1 siRNA duplexes (100 pmol) by using Lipofectamine RNAiMAX according to the manufacturer's recommended protocol, and experiments were performed 48 h later. A nonsilencing siRNA was used as a control.
Transient transfections.
A549 cells were transiently transfected either with yellow fluorescent protein (YFP)-tagged full-length wild-type (WT) STIM1 or with YFP-tagged D76A mutant STIM1 (35) by using Lipofectamine 2000 following the manufacturer's recommended protocol. Experiments were carried out at 24 h after transfection.
Cell lysis and Western blot analysis.
After treatment, ATII and A549 cells were washed in ice-cold phosphate-buffered saline (PBS) and solubilized in lysis buffer. The lysates were cleared by centrifugation for 10 min at 14,000 × g. Protein concentrations were determined by the Bradford assay using a commercial dye reagent (Bio-Rad), and samples containing equal amounts (50 to 75 μg) of proteins were separated by SDS-PAGE and transferred onto nitrocellulose membranes (Optitran; Schleicher & Schuell) by using a semidry transfer apparatus (Bio-Rad). The following commercially available antibodies and dilutions were used for Western blotting: rabbit anti-pPKCζ (Τ410), anti-pAMPKα (T172), anti-AMPKα, anti-pACC (S79), anti-ACC and anti-STIM1 were from Cell Signaling Technology and were used at 1:1,000; mouse anti-Na,K-ATPase subunit α1 (clone 464.6; 1:10,000) was from Upstate Biotechnology; mouse anti-PKCζ (clone H-1; 1:500), rabbit anti-E-cadherin (1:200), rabbit anti-CaMMKα, rabbit (1:1,000) and mouse (1:100) anti-CaMMKβ, rabbit anti-LKB1 (1:200), and normal rabbit IgG were from Santa Cruz Biotechnology Inc.; rabbit anti-β-actin (clone AC-15; 1:5,000) and anti-Orai1 were from Sigma-Aldrich; rabbit anti-mCherry (1:1,000) was from Molecular Probes; and mouse anti-complex III subunit Rieske Fe-S (1:1,000) was from MitoScience. Primary antibodies were detected with horseradish peroxidase-conjugated secondary goat anti-mouse antibodies (1:10,000; Bio-Rad) or goat anti-rabbit antibodies (1:2,000; Cell Signaling Technology) by using a chemiluminescence detection kit (Perkin-Elmer Life Sciences). Quantification of protein levels was performed by densitometric scanning with ImageJ 1.29X (NIH).
Measurement of intracellular Ca2+.
ATII or A549 cells plated on 40-mm coverslips were loaded with 2 μM fura-2-acetoxymethyl ester (Fura2-AM) (Invitrogen) for 30 min at room temperature in standard buffer solution (150 mM NaCl, 5 mM KCl, 1 mM MgCl2, 10 mM glucose, 10 mM HEPES, and either 1 mM CaCl2 or 0.5 mM EGTA pH 7.4) in the dark and further incubated for 30 min at room temperature to complete deesterification of the dye. Fura2 dye was excited through 340-nm and 380-nm interference filters housed in a computer-controlled filter wheel. The fluorescence emitted was collected at 510 nm. The data acquisition of Fura2 video imaging was done using a Nikon TE2000 (Nikon Instruments Inc.) equipped with an environmental control system chamber (FCS2 system; Bioptechs Inc.) and a Plan Super Fluor 40× oil objective (Nikon Instruments Inc.). Images were collected with a Cascade electron-multiplying charge-coupled device (EMCCD) camera TC285 with on-chip multiplication gain (Photometrics) driven by MetaFluor software (Molecular Devices Corp.). For all the experiments, the exposure time was 100 ms and to decrease phototoxic effects a 0.5 neutral-density filter was used. Changes in [Ca2+]i were obtained from the F340/F380 ratio and expressed as nM concentrations. To convert Fura2 fluorescence measurements, a calcium imaging calibration kit (Invitrogen) was used to generate a titration standard curve. Different oxygen concentrations and drugs were perfused to the cells using a pumping system with tubes equipped with stopcocks.
Immunofluorescence.
After treatment, ATII or A549 cells were washed with PBS, fixed in 3.7% formaldehyde in PBS for 15 min, rinsed with PBS, and permeabilized with methanol for 5 min at −20°C. Cells were stained using anti-STIM1 antibody (1:100) in combination with anti-rabbit Alexa Fluor 568 IgG (Molecular Probes). Fluorescence was obtained using a Nikon TE2000 instrument (Nikon Instruments Inc.). Contrast and brightness settings were adjusted so that all pixels were in the linear range.
Measurement of adenine nucleotide concentrations in cells.
Cell concentrations of ATP, ADP, and AMP were determined with the use of high-performance liquid chromatography (HPLC) as we have previously described (6) with modifications. Briefly, ATII cells were incubated in 300 μl of medium containing 20 μl of 1 M HClO4 and centrifuged at maximum speed for 15 min. HClO4 was removed by mixed-phase extraction employing an 11.75:13.25 (vol/vol) ratio of tri-n-octylamine and Freon 11. Concentrations of adenine nucleotides in alveolar epithelial cell lysates were analyzed with Hitachi D-7000 HPLC equipment with a Supelcosil C18 column (Sigma) and an elution flow rate of 1 ml/min in HPLC-grade methanol, H2O, buffer B (50 mM KH2PO4, 8 mM tetrabutylammonium hydrogen sulfate [TBAS]), and 40% [vol/vol] acetonitrile at pH 5.8), and buffer A (50.0 mM KH2PO, and 8 mM TBAS at pH 5.8). The injection volume was 100 μl. A linear gradient of 15 min from 10% buffer B and 90% buffer A to 45% buffer B and 55% buffer A was employed to elute nucleotides in a total analysis time of 30 min. Areas under the AMP, ADP, and ATP peaks were quantified with the use of an electronic integrator and in comparison to the standard curves created for each adenosine nucleotide at 254 nm.
shRNA and generation of stable cell lines.
The pLKO.1 vector was used to express short hairpin RNA (shRNA) targeting Rieske Fe-S protein (RISP). Constructs were ordered from Sigma; the following two validated hairpin sequences were used: TRCN0000046518 (Fe-S shRNA1), 5′CCGGCGAAATCAAGTTATCCGATATCTCGAGATATCGGATAACTTGATTTCGTTTTTG3′; TRCN0000046520 (Fe-S shRNA2), 5′CCGGAGTGACGATATGGTGATTGTTCTCGAGAACAATCACCATATCGTCACTTTTTTG3′. The nonsilencing (control) shRNA was ordered from Addgene (plasmid 1864, 5′ CCTAAGGTTAAGTCGCCCTCGCTCTAGCGAGGGCGACTTAACCTTAGG3′ (41). Cell lines were generated by lentiviral infection using the 293FT packaging cell line, psPAX2 (Addgene 12260) and pMD2.G (Addgene 12259) as packaging vectors, and puromycin selection. At 48 h posttransfection, viral supernatants were collected and used to infect target cells with 8 μg/ml Polybrene.
Isolated perfused rat lung model.
shRNAs against STIM1 and a nontargeting negative control were generated using the mCherry version of the pG-SUPER vector (a gift from Shin Kojima, Northwestern University, Evanston, IL) (47). The targeting sequence (sense) was 5′-AGGGAGGGTACCGAGAAT-3′. Plasmid DNA was purified using an endotoxin-free plasmid DNA isolation kit (Qiagen) following the manufacturer's instructions. Plasmid DNA was dissolved in sterile deionized water, and the osmolality was adjusted to ∼100 mosmol/kg H2O using sterile NaCl. Plasmid DNA solutions were prepared by mixing 0.1 μg/μl endotoxin-free plasmid DNA of either STIM1 or scramble shRNA with Lipofectamine 2000 at a 1:1 ratio of plasmid DNA (μg) and Lipofectamine 2000 (μl), generating a solution with a concentration of 100 μg plasmid DNA/kg of body weight in a final volume of 300 μl for each rat. Plasmid DNA was administered using a tracheal instillation procedure (24a). Following a brief sodium pentobarbital anesthesia (40 mg/kg body weight), rats were placed on a slanted board and the prepared plasmid DNA-Lipofectamine solution was then administered via an endotracheal tube (14-gauge catheter) to the lungs in 3 boluses of 100 μl each, followed by 200 μl of air. Rats were allowed to recover in cages for 48 h prior to performance of experimental protocols.
Alveolar fluid reabsorption was determined as previously described (4a, 39a, 50). Briefly, the lungs and hearts of anesthetized rats were removed en bloc. The pulmonary artery and left atrium were catheterized and perfused continuously with a solution of 3% bovine serum albumin (BSA) in buffered physiological salt solution (135.5 mM Na+, 119.1 Cl−, 25 mM HCO3−, 4.1 mM K+, 2.8 mM Mg+, 2.5 mM Ca2+, 0.8 mM SO42−, 8.3 mM glucose). Trace amounts of fluorescein isothiocyanate (FITC)-albumin were also added to the perfusate. The recirculating volume of the constant-pressure perfusion system was 90 ml; arterial and venous pressures were set at 12 and 0 cm H2O, respectively. The vascular pressures were recorded every 10 s with a multichannel recorder (Cyber Sense Inc.). The lungs were immersed in a “pleural” bath (100 ml) filled with the same BSA solution. The entire system was maintained at 37°C in a water bath. The perfusate pH was maintained at 7.40 by bubbling with a gas mixture of 95% O2 and 5% CO2. The lungs were then instilled via the tracheal cannula in two sequential phases with a total of 5 ml volume of the BSA solution containing 0.1 mg/ml Evans blue dye (EBD)-albumin, 0.02 μCi/ml of 22Na+, and 0.12 μCi/ml of [3H]mannitol. Samples were taken from the instillate, perfusate, and bath solutions after an equilibration time of 10 min from the instillation and again 60 min later. To ensure a homogenous sampling of the instillate, a volume of 1 ml was aspirated and reintroduced into the airspaces three times before removing each sample. All samples were centrifuged at 3,000 × g for 10 min. Absorbance analysis of the supernatant or EBD-albumin was performed at 620 nm in a Hitachi model U2000 spectrometer. Analysis of FITC-albumin (excitation at 487 nm and emission at 520 nm) was performed in a Perkin-Elmer fluorometer (model LS-3B; Perkin-Elmer). Scintillation counts for 22Na+ and [3H]mannitol were measured in a Beckman beta counter (model LS 6500).
Statistics.
Data are presented as means ± standard errors of the means (SEM) and were statistically analyzed using one-way analysis of variance (ANOVA) followed by a multiple comparison with the Dunnet test or t test. P values of less than 0.05 were considered statistically significant.
RESULTS
Intracellular Ca2+ increase and CaMKKβ mediate the hypoxia-induced activation of AMPK.
In alveolar epithelial cells, hypoxia leads to the phosphorylation of the AMPK-α1 subunit at Thr-172 which reflects AMPK activation (14, 17). Interestingly, hypoxia promotes Na,K-ATPase endocytosis in rat alveolar type II (ATII) cells and in A549 LKB1-deficient cells (11, 14). To determine whether during hypoxia CaMKKβ leads to AMPK activation, ATII cells were incubated in the presence of STO-609, a CaMKK inhibitor (18, 53), which decreased baseline phosphorylation of AMPKα at Thr-172 and prevented hypoxia-induced AMPK activation and Na,K-ATPase endocytosis (Fig. 1A and B). To confirm the data obtained with STO-609, we utilized an siRNA approach to knock down CaMKKβ expression in A549 cells (lacking LKB1, A549 p-Babe), A549+LKB1 cells, and A549+LKB1 KD cells. A549 cells, a human alveolar epithelial cell line, share many of the characteristics of alveolar type II cells (25) and have the advantage of being more easily transfected than the primary cells. We and others have previously used them to study the regulation of Na,K-ATPase and Na+ transport (4, 11, 13, 23, 28). A Western blot showing the expression of LKB1 in isolated rat ATII cells, in A549 cells, and in A549 cells reconstituted with LKB1 is shown in Fig. 1C. As depicted in Fig. 1D, E, and F, transient transfection of A549, A549+LKB1, and A459+LKB1KD cells with siRNA to silence CaMKKβ did not change the levels of expression of CaMKKα but reduced the CaMKKβ protein expression by ∼ 90%. Similar to the effects of STO-609, baseline AMPK phosphorylation was barely detectable and remained unchanged upon exposure to hypoxia. Moreover, transfection of A549+LKB1 cells with CaMKKβ siRNA prevented Na,K-ATPase endocytosis (Fig. 1G). These data suggest that LKB1 does not contribute to acute hypoxia-induced AMPK phosphorylation and that CaMKKβ is the upstream kinase. In agreement with a previous report (11), exposing alveolar epithelial cells to hypoxia did not significantly alter the AMP/ATP and ADP/ATP ratios (Fig. 1H and I).
Fig. 1.

Hypoxia-induced activation of AMPK is Ca2+/CaMKKβ dependent. (A) ATII cells were exposed to 21% (N) or 1.5% (H) O2 for 10 min in the presence or absence of STO-609 (20 μM, 30-min preincubation). The graph represents activation of AMPK measured as the ratio of AMPK phosphorylation at Thr-172 (pAMPKα) and total AMPKα by Western blot analysis. Values are expressed as means ± SEM (n = 4). **, P < 0.01. Representative Western blots for phosphorylation of AMPK and total AMPK protein levels are shown. (B) ATII cells were exposed to 21 or 1.5% O2 for 60 min in the presence or absence of STO-609. The Na,K-ATPase α1 subunit (NKA-α1) plasma membrane abundance was determined by cell surface biotinylation followed by streptavidin pulldown and Western blot analysis using specific antibodies. Representative Western blots of the NKA-α1 at the plasma membrane and E-cadherin as a loading control are shown. Results are means ± SEM (n = 4). **, P < 0.01. (C) Western blot showing the expression of LKB1 in alveolar epithelial cells. (D to F) A549 p-Babe (D) A549+LKB1 (E), and A549+LKB1 KD (F) cells were transfected with siRNA against CaMKKβ or scrambled siRNA, and 48 h later cells were exposed to 21 or 1.5% O2 for 10 min. pAMPKα and total AMPKα were determined by Western blotting. β-Actin was used as a loading control. (G) A549+LKB1 cells transfected with CaMKKβ siRNA were exposed to hypoxia, and Na,K-ATPase protein expression was assessed as for panel B. Values are expressed as means ± SEM (n = 4). **, P < 0.01. (H and I) AMP/ATP (H) and ADP/ATP (I) ratios in ATII cells exposed to 1.5% O2 for 0, 5, and 30 min were assessed by HPLC (n = 6).
Chelation of intracellular Ca2+ with 1,2-bis(2-aminophenoxy)ethane-N,N,N′,N′-tetraacetic acid-acetoxymethyl ester (BAPTA-AM) prevented the hypoxia-induced phosphorylation of AMPK at Thr-172 (Fig. 2A). In agreement with this result, thapsigargin (an irreversible sarco/endoplasmic reticulum Ca2+-ATPase inhibitor) led to AMPK activation (Fig. 2I). We tested whether hypoxia leads to increased intracellular Ca2+ concentrations ([Ca2+]i) by perfusing fura-2-acetoxymethyl ester (Fura2-AM)-loaded ATII cells with 21% O2 followed by 1.5% O2. As depicted in Fig. 2B, hypoxia resulted in a rapid increase in [Ca2+]i followed by a slowly declining plateau, suggesting that hypoxia-induced AMPK activation involves a Ca2+-dependent step. Moreover, the hypoxia-triggered increase in [Ca2+]i was not prevented by the L-type voltage-gated Ca2+ channel blocker nifedipine (Fig. 2C).
Fig. 2.

CRAC channel activity is necessary for hypoxia-induced AMPK activation and Na,K-ATPase downregulation in alveolar epithelial cells. (A) ATII cells were exposed to 21% (N) or 1.5% (H) O2 for 10 min in the presence or absence of BAPTA-AM (20 μM, 15-min preincubation), and pAMPKα and total AMPKα were determined. Representative Western blots are shown (n = 4). (B and C) Representative traces of [Ca2+]i in ATII cells exposed to hypoxia or nifedipine plus hypoxia are illustrated. Fura2-loaded cells were initially perfused with medium containing 21% O2, and then perfusion was switched to 1.5% O2 in absence (B) or in the presence (C) of nifedipine (5 μM, 10-min preincubation). Results are for 7 experiments with 10 to 30 cells each. (D to F) Calcium influx into ATII cells exposed to hypoxia, treated with thapsigargin (TG) (1 μM), or pretreated with LaCl3 (5 μM, 5-min preincubation) and then exposed to hypoxia. Perfusion was started in Ca2+-free medium and switched to 2 mM Ca2+ as indicated. Results are for 5 experiments with 10 to 30 cells each. (G to I) pAMPKα and total AMPKα were determined in ATII cells preincubated with LaCl3 and then exposed to 1.5% O2, incubated in the presence or absence of 2 mM Ca2+, and exposed to 21% (N) or 1.5% (H) O2 for 10 min or treated with vehicle (V) or TG for 10 min. Representative Western blots are shown (n = 3). (J) ATII cells were exposed to 21% (N) or 1.5% (H) O2 for 60 min in the presence or absence of LaCl3. The Na,K-ATPase-α1 subunit plasma membrane abundance was determined. Representative Western blots of Na,K-ATPase α1 (NKA-α1) at the plasma membrane and E-cadherin are shown. Results are means ± SEM (n = 4). **, P < 0.01.
Hypoxia-mediated Ca2+ entry via CRAC channels leads to Na,K-ATPase downregulation.
In the absence of extracellular Ca2+, alveolar epithelial cells exposed to hypoxia showed a rapid increase followed by a slow decline of [Ca2+] i, suggesting a depletion of stores (Fig. 2D). Increasing the extracellular Ca2+concentration to 2 mM caused a sustained increase in [Ca2+]i (Fig. 2D). This trace is similar to the one obtained when cells were treated with thapsigargin, a known activator of CRAC channel activity (Fig. 2E). Depletion of external Ca2+ for 10 min had no effect on the resting Ca2+ levels in control ATII cells, and perfusion with medium containing 2 mM Ca2+ did not result in Ca2+ influx (data not shown). Treatment with 5 μM La3+ (a concentration known to inhibit CRAC channels [2]) did not prevent the ER store release-dependent [Ca2+]i peak but blocked Ca2+ influx (Fig. 2F) and the hypoxia-induced AMPK activation (Fig. 2G). Incubation of ATII cells in a calcium-free medium prevented both thapsigargin- and hypoxia-induced AMPK phosphorylation (Fig. 2H and I). Importantly, hypoxia-induced Na,K-ATPase downregulation was prevented by preincubation of cells with 5 μM La3+ (Fig. 2J).
STIM1 senses ER Ca2+ depletion and redistributes to ER-plasma membrane junctions, where it plays a role in Ca2+ entry through CRAC channels (7, 24). We studied the effects of hypoxia on the cellular localization of STIM1 in A549 cells transfected with STIM1-YFP. In control A549 cells, YFP-tagged WT STIM1 distributed diffusely throughout cytoplasm, while hypoxia led to redistribution of STIM1 from diffuse localization in the ER to the cell periphery, where it accumulates into discrete puncta within seconds (Fig. 3A). Neither STIM1 nor Orai1 knockdown altered the basal Ca2+ levels (100.0 ± 2.1 and 100.8 ± 2.3, respectively, versus the control value of 100.4 ± 1.8) or the Ca2+ released from intracellular stores elicited by hypoxia (158.4 ± 5.9 STIM1 and 157.0 ± 7.7, respectively, versus the control value of 170.5 ± 7.1) or TG (168.1 ± 7.4 and 151.3 ± 7.3, respectively, versus the control value of 174.7 ± 5.7); however, their knockdown prevented the extracellular entry of calcium (Fig. 3B and C). As shown in Fig. 3D, transfection of A549 cells with scrambled siRNA had no effect on the hypoxia-induced cytosolic Ca2+ increase. Transfection with siSTIM1 or siOrai1 reduced the expression of these proteins by ∼95% and ∼92%, respectively, compared to that in scrambled siRNA-transfected cells (Fig. 3E). The inhibition of CRAC channel function by STIM1 or Orai1 depletion decreased the hypoxia-induced phosphorylation of AMPK, ACC, and PKCζ (Fig. 3F and G) and the expression of Na,K-ATPase at the plasma membrane (Fig. 3H and I).
Fig. 3.

Hypoxia-induced STIM1 redistribution results in CRAC channel activity following AMPK activation and Na,K-ATPase downregulation. (A) A549 cells were transiently transfected with full-length WT STIM1-YFP and 24 h later were exposed 21% (normoxia) or 1.5% (hypoxia) O2, and the WT STIM1-YFP distribution was assessed. (B to D) Measurement of calcium in A549 cells transfected with siRNA against STIM1 (B), against Orai1 (C), or scrambled (D) and then exposed to hypoxia. Perfusion was started in Ca2+-free medium and switched to 2 mM Ca2+ as indicated. Results are from 4 experiments with 20 to 35 cells each. (E) Representative Western blot of the expression levels of STIM1 and Orai1 in A549 cells transfected with the respective siRNA. β-Actin was used as a loading control. (F and G) A549 cells were transfected with siRNA against STIM1 or Orai1 or with scrambled siRNA, and 48 h later cells were exposed to 21 or 1.5% O2 for 10 min. pAMPKα, AMPKα, pACC, pPKCζ, STIM1, and Orai1 protein levels are shown. (H and I) Cells transfected as for panel E were exposed to 21 or 1.5% O2 for 60 min, and the Na,K-ATPase α1 subunit plasma membrane (NKA-α1) abundance was determined. Representative Western blots of the NKA-α1 at the plasma membrane and in total cell lysates and STIM1 or Orai1 are shown. Results are means ± SEM (n = 4). **, P < 0.01.
Mitochondrial ROS mediate the hypoxia-induced increase in [Ca2+]i via CRAC channels.
Alveolar epithelial cells generate mitochondrial ROS when exposed to hypoxia (9, 11). We investigated whether ROS act upstream of Ca2+ signaling to induce AMPK activation by pretreating ATII cells with BAPTA-AM or STO-609 and found that t-H2O2-induced phosphorylation of AMPK at Thr-172 was prevented (Fig. 4A and B). We analyzed whether the generation of ROS correlates with the translocation of STIM1. As shown in Fig. 4C, both hypoxia and t-H2O2 induced the clustering of endogenous STIM1 into puncta, while pretreatment with the ROS scavenger Eukarion-134 (EUK-134) prevented the clustering. Also, we generated mitochondrion-deficient ρ0-A549 cells in which hypoxia fails to generate ROS, activate AMPK, and promote Na,K-ATPase endocytosis (11, 14). In these cells hypoxia did not elicit ER Ca2+ store depletion or Ca2+ influx via CRAC channels (Fig. 4D); however, they remained sensitive to the store depletion by treatment with t-H2O2 or thapsigargin (Fig. 4E and F). ROS are generated at complexes I, II, and III of the mitochondrial electron transport chain (48). We and others have reported that transfection of cells with siRNA against the Rieske Fe-S protein, a component of mitochondrial complex III, inhibits the hypoxia increase in cytosolic ROS, HIF1-α stabilization, and Na,K-ATPase degradation (5, 10, 15). To determine whether the ROS generated at the complex III-ubiquinone site are required for the release of calcium from the ER and AMPK phosphorylation during hypoxia, we infected A549 cells with two different lentiviruses containing shRNA against the Rieske Fe-S protein. In the absence of the Rieske Fe-S protein, the ubiquinone cycle is not initiated, and ROS are not released (3). As shown in Fig. 5A and B, in Rieske Fe-S-deficient cells the release of Ca2+ from the ER were prevented, as was the activation of AMPK (Fig. 5E). However, when the Rieske Fe-S-deficient cells were treated with t-H2O2, the intracellular Ca2+ increase and AMPK phosphorylation were recovered (Fig. 5C, D, and F). Taken together these results suggest that during hypoxia the generation of ROS at mitochondrial complex III is upstream of the increase in intracellular Ca2+.
Fig. 4.

Mitochondrial ROS mediate the hypoxia-induced increase in [Ca2+]i. (A and B) ATII cells were treated with 100 μM t-H2O2 or vehicle for 10 min in the presence or absence of BAPTA-AM (20 μM, 15-min preincubation) (A) or STO-609 (20 μM, 30-min preincubation) (B), and pAMPKα and total AMPKα were determined by Western blot analysis. Representative Western blots are shown. (C) ATII cells were exposed to 21% (normoxia) or 1.5% (hypoxia) O2 for 10 min in the presence or absence of EUK-134 (20 μM, 15-min preincubation) or were treated with t-H2O2 (100 μM, 10 min). Endogenous STIM1 was detected by immunofluorescence microscopy using an anti-STIM1 antibody. (D to F) Calcium influx into ρ0-A549 cells exposed to hypoxia, t-H2O2, or thapsigargin (TG). Perfusion was started in Ca2+-free medium and switched to 2 mM Ca2+ as indicated. Results are from 5 experiments with 17 to 43 cells each.
Fig. 5.

ROS generated at mitochondrial complex III are required for the hypoxia-induced increase in [Ca2+]i and AMPK activation. A549 cells were infected with two different shRNAs against Rieske F-S (an Fe protein). (A and B) Calcium influx profiles for cells transfected with Fe-S shRNA1 or shRNA2 and exposed to hypoxia. Results are for 8 experiments with 7 to 15 cells each. (C and D) Profiles for cells treated with 100 μM t-H2O2. Results are for 5 experiments with 7 to 15 cells each. Perfusion was started in Ca2+-free medium and switched to 2 mM Ca2+ as indicated. (E and F) pAMPKα and total AMPKα were determined in cells exposed to 21% (N) or 1.5% (H) O2 (E) or treated with t-H2O2 100 μM (F). Representative Western blots for pAMPKα, AMPKα, and the Rieske Fe-S protein are shown (n = 3).
Expression of STIM1 D76A leads to AMPK activation and Na,K-ATPase downregulation.
To determine whether the influx of Ca2+ through CRAC channels is sufficient to activate AMPK and Na,K-ATPase endocytosis in alveolar epithelial cells, we utilized the EF-hand dominant-positive mutant form of STIM1 (STIM1 D76A) (19), which aggregates into the puncta regardless of ER calcium levels. As expected, A549 cells transfected with STIM1 D76A have higher basal intracellular Ca2+ levels than A549 cells transfected with WT STIM1, but they retain the ability to respond to TG (data not shown). Under normoxic conditions transfection with STIM1 D76A led to increased AMPK, ACC, and PKCζ phosphorylation, while overexpression of WT STIM1 did not (Fig. 6A). Transfection of A549 cells with WT STIM1 did not affect the hypoxia-induced Na,K-ATPase endocytosis, while expression of STIM1 D76A or ER Ca2+ depletion by thapsigargin led to Na,K-ATPase endocytosis in the absence of hypoxia (Fig. 6B). This suggests that Ca2+ influx via CRAC channels is sufficient to trigger Na,K-ATPase endocytosis. Importantly, STIM1 D76A expression or thapsigargin treatment led to the Na,K-ATPase endocytosis in ρ0-A549 cells, while the WT STIM had no effect (Fig. 6C). These results suggest that hypoxia-generated ROS lead to depletion of Ca2+ from the ER stores, resulting in Ca2+ entry via CRAC channels, to cause AMPK activation and Na,K-ATPase downregulation.
Fig. 6.

Expression of STIM1 D76A leads to AMPK activation and Na,K-ATPase downregulation. (A) A549 cells were transiently transfected with WT STIM1-YFP (WT), STIM1-YFP D76A (D76A), or empty vector (EV) and 24 h later pAMPKα, AMPKα, pACC, ACC, pPKCζ, pPKCζ, STIM1, and β-actin were determined by Western blotting. Representative Western blots are shown. (B and C) A549 cells (B) or ρ0-A549 cells (C) were transiently transfected with WT STIM1-YFP, STIM1-YFP D76A, or empty vector, and 24 h later cells were exposed to 21% (N) or 1.5% (H) O2 for 60 min or treated with thapsigargin (TG) (1 μM). Na,K-ATPase α1 subunit plasma membrane abundance (NKA-α1), E-cadherin, and STIM1 were determined by Western blotting as described in the text. Values are expressed as means ± SEM (n = 5). **, P < 0.01. Representative Western blots are shown.
Role of STIM1 in hypoxia-induced inhibition of AFR.
To investigate whether STIM1 plays role in the hypoxia-induced impairment of alveolar fluid reabsorption (AFR), shRNA against STIM1 was delivered in vivo to rat lungs, 48 h later the rat heart and lungs were removed and exposed to hypoxia for 60 min, and AFR was studied. Consistent with the findings in alveolar epithelial cells, the hypoxia-induced impairment of AFR was prevented in rat lungs transfected with STIM1 shRNA (Fig. 7A) without altering permeability to solutes (data not shown). Examination of peripheral lung tissue from rats treated with the shRNA revealed that STIM1 expression was decreased by ∼70%, as assessed by Western blot analysis (Fig. 7B).
Fig. 7.
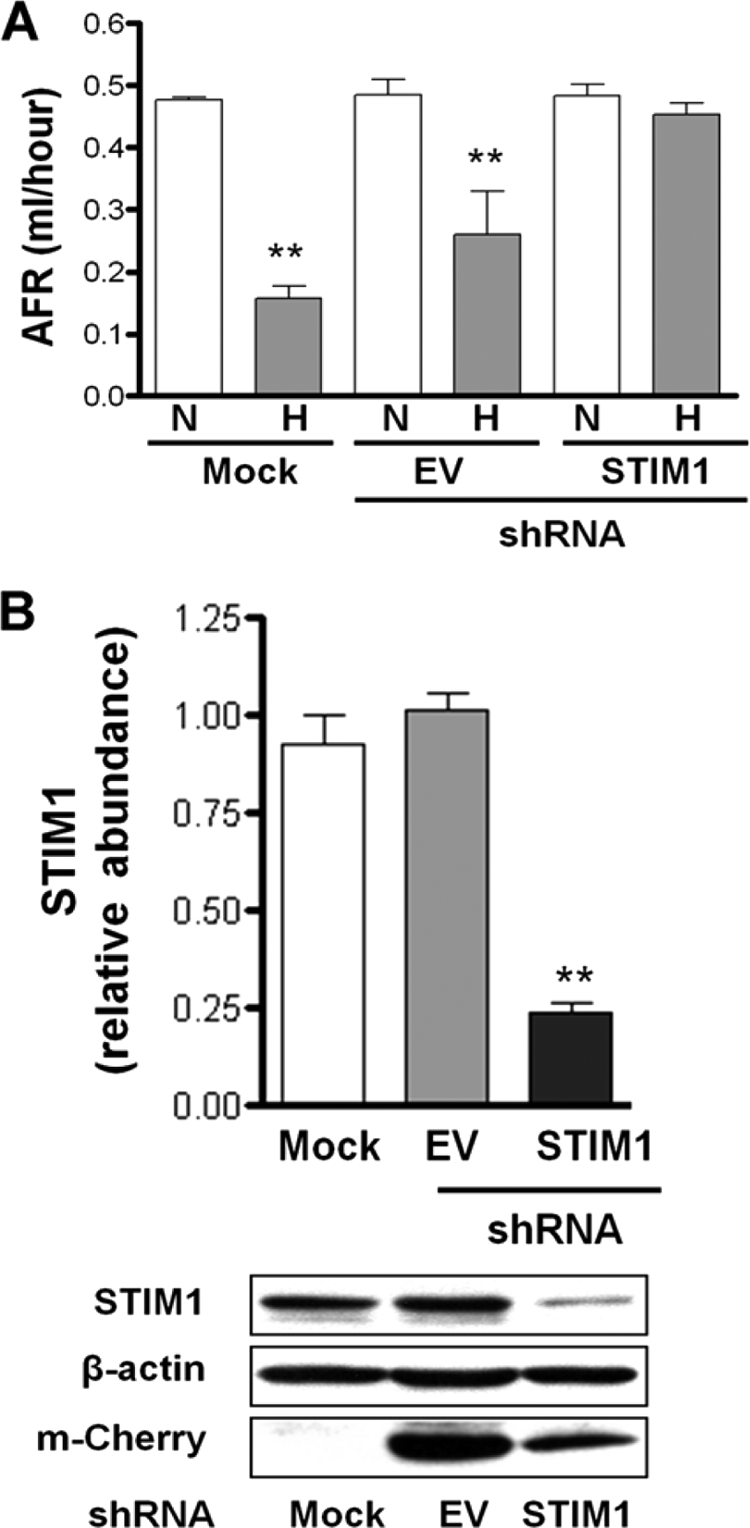
STIM1 mediates the hypoxia-induced impairment of AFR in rat lungs. (A) Isolated lungs from rats instilled with empty vector (EV) or shRNA-STIM1 were perfused for 1 h with 21% O2 (N) and then switched to approximately 1.5% O2 (H), and AFR was measured as described in the text. Bars represent means ± SEM (n = 3). **, P < 0.01. (B) Representative Western blots of STIM1, β-actin, and m-Cherry in peripheral lung tissue homogenates from mock-, EV- and shRNA-STIM1-instilled rats.
DISCUSSION
We provide evidence that hypoxia, via mitochondrial ROS generated at complex III, leads to calcium influx through CRAC channels, which is necessary and sufficient to phosphorylate AMPK via CaMKKβ, leading to Na,K-ATPase endocytosis in alveolar epithelial cells.
We have previously reported that the effects of hypoxia on Na,K-ATPase involved mitochondrial ROS-mediated activation of AMPK, which phosphorylates PKCζ, triggering Na,K-ATPase endocytosis (11, 14). It has been described that the specificity of the AMPK isoform activated is dependent on the stimulus that regulates the upstream kinases (49). For example, the increase in AMPK activity via the catalytic α2 isoform has been associated with metabolic homeostasis due to increases in the AMP/ATP ratio and LKB1-dependent phosphorylation, whereas α1-containing complexes can be activated either by LKB1 or by CaMKKβ (40). We found that during hypoxia AMPK activation is mediated by calcium signals and CaMKKβ in the absence of an increased AMP/ATP ratio, which is in agreement with previous reports that short-term hypoxia does not decrease the ATP levels (11) and activates the AMPK-α1 isoform (14). Moreover, it has been described that oxygen becomes rate limiting and inhibits the mitochondrial respiratory chain in alveolar epithelial cells only when its concentration is lower than 0.5% (43). In ATII cells, inhibition of CaMKKβ by STO-609 prevented the AMPK activation and the hypoxia-induced Na,K-ATPase endocytosis. STO-609 has been described to inhibit other kinases in vitro (18). To confirm the effects of STO-609, we used an siRNA approach in A549 cells reconstituted with LKB1. The A549 cell line bears some of the characteristics of ATII cells, including the regulation of Na,K-ATPase (4, 11, 23). Transfection of siRNA against CaMKKβ abolished hypoxia-induced AMPK activation in A549+LKB1 cells and the endocytosis of the Na,K-ATPase. Both CaMKK isoforms were expressed in A549 cells, but the transfection with siRNA affected only the expression of CaMKKβ, suggesting a role for CaMKKβ in hypoxia-induced AMPK activation. The hypoxia-induced AMPK activation is transient (14), which coincides with previous studies where CaMKKβ-mediated responses returned to baseline levels when the intracellular Ca2+ levels declined (18, 44, 46), while AMPK activation via LKB1 was sustained (54). Taken together, these results suggest that CaMKKβ is the main kinase mediating the hypoxia-induced AMPK activation in alveolar epithelial cells.
Low oxygen concentrations have been shown to modulate the intracellular calcium concentrations in excitable and nonexcitable cells (1). In alveolar epithelial cells, we found that hypoxia increased [Ca2+]i and that it occurs in a fashion consistent with store-operated calcium entry through CRAC channels. Several pieces of evidence support this conclusion. First, removal of extracellular calcium during hypoxia resulted in ER Ca2+ store depletion, followed by Ca2+ influx when cells were perfused with 2 mM Ca2+. Second, preventing calcium influx with La3+ during hypoxia had no influence on Ca2+ release from stores, yet it was able to prevent the extracellular calcium influx, which was sufficient to inhibit AMPK activation and Na,K-ATPase endocytosis. Finally, hypoxia caused STIM1 to redistribute into discrete puncta at the cell periphery, and silencing of STIM1 and Orai1 in alveolar epithelial cells prevented the hypoxia-induced Ca2+ influx. STIM1 appears to be the limiting step of this process leading to Ca2+ entry by interacting with Orai1, the pore-forming component of CRAC channels (7, 24). We found that STIM1 depletion prevented AMPK and PKCζ activation and Na,K-ATPase endocytosis during hypoxia, while overexpression of STIM1 mutants with impaired Ca2+ binding was sufficient to enhance AMPK and PKCζ phosphorylation and mimicked the effect of hypoxia and ROS on Na,K-ATPase endocytosis. These data suggest that AMPK activation is dependent on the rise of the Ca2+ level following Ca2+ entry via CRAC channels.
An important finding of the present study is that mitochondrial ROS generated during hypoxia are required and sufficient for Ca2+ release from ER stores and activation of CRAC channels. It has been proposed that mitochondria act as the oxygen sensor (5, 29), and recent reports indicate that mitochondrial ROS are required during hypoxia-induced AMPK activation (12, 14). Here we report that t-H2O2-induced AMPK activation was prevented in alveolar epithelial cells pretreated with BAPTA-AM or STO-609. Similar to hypoxia, H2O2 increased [Ca2+]i secondary to Ca2+ release from ER stores, which led to CRAC channel activity. Pretreatment of ATII cells with the antioxidant Eukarion-134 prevented the hypoxia-induced redistribution of STIM1 near the plasma membrane. Furthermore, hypoxia failed to induce release of ER Ca2+ and Ca2+ influx via CRAC channels in ρ0-A549 cells, which lack functional mitochondrial electron transfer complexes III and IV (3). We also transfected A549 cells with shRNA against Rieske Fe-S (a component of complex III), and these cells displayed a significant decrease in Fe-S protein levels, and, importantly, had no increase in cytosolic Ca2+ or AMPK activation in response to hypoxia. Importantly, these effects were rescued by treatment H2O2. Moreover, in ρ0-A549 cells STIM1 D76A expression resulted in the Na,K-ATPase endocytosis, further supporting the role of mitochondrial ROS in the hypoxia induced CRAC channels' activity. Collectively, our data suggest that the mitochondrial ROS generated at complex III are required to release Ca2+ from the ER, and that the Ca2+ influx through CRAC channels is sufficient to activate CaMKKβ and AMPK.
Alveolar epithelial cells through the concerted actions of the Na,K-ATPase and ENaC clear fluid from airspaces to maintain normal gas exchange. Hypoxia impairs this important function of the alveolar epithelium (26, 51). The data showing the role of CRAC channels in Na,K-ATPase downregulation during hypoxia in isolated alveolar epithelial cells were confirmed in animals, where rats were instilled in vivo with an shRNA against STIM1. The absence of STIM1 protected the rats from the hypoxia-induced impairment in fluid reabsorption, suggesting a role for Ca2+ influx in the regulation of Na,K-ATPase activity and alveolar epithelial function.
In summary, we propose that the influx of Ca2+ through CRAC channels is a key link between mitochondrial ROS and CaMKKβ/AMPK activation leading to Na,K-ATPase endocytosis and alveolar epithelial dysfunction during hypoxia.
ACKNOWLEDGMENTS
We thank G. R. Scott Budinger and Angel Gonzalez for their help with the measurement of adenine nucleotide concentrations.
This work was supported in part by NIH grants PO1-HL071643 (Project 1) and NIH grants RO1CA123067 and PO1-HL071643 (Project 3).
Footnotes
Published ahead of print on 5 July 2011.
REFERENCES
- 1. Aley P. K., Murray H. J., Boyle J. P., Pearson H. A., Peers C. 2006. Hypoxia stimulates Ca2+ release from intracellular stores in astrocytes via cyclic ADP ribose-mediated activation of ryanodine receptors. Cell Calcium 39:95–100 [DOI] [PubMed] [Google Scholar]
- 2. Aussel C., Marhaba R., Pelassy C., Breittmayer J. P. 1996. Submicromolar La3+ concentrations block the calcium release-activated channel, and impair CD69 and CD25 expression in CD3- or thapsigargin-activated Jurkat cells. Biochem. J. 313:909–913 [DOI] [PMC free article] [PubMed] [Google Scholar]
- 3. Bell E. L., Klimova T. A., Eisenbart J., Schumacker P. T., Chandel N. S. 2007. Mitochondrial reactive oxygen species trigger hypoxia-inducible factor-dependent extension of the replicative life span during hypoxia. Mol. Cell. Biol. 27:5737–5745 [DOI] [PMC free article] [PubMed] [Google Scholar]
- 4. Bertorello A. M., et al. 2003. Analysis of Na+,K+-ATPase motion and incorporation into the plasma membrane in response to G protein-coupled receptor signals in living cells. Mol. Biol. Cell 14:1149–1157 [DOI] [PMC free article] [PubMed] [Google Scholar]
- 4a. Briva A., Vadasz I., Lecuona E., Welch L. C., Chen J., Dada L. A., Trejo H. E., Dumasius V., Azzam Z. S., Myrianthefs P. M., Batlle D., Gruenbaum Y., Sznajder J. I. 2007. High CO2 levels impair alveolar epithelial function independently of pH. PLoS One 2:e1238. [DOI] [PMC free article] [PubMed] [Google Scholar]
- 5. Brunelle J. K., et al. 2005. Oxygen sensing requires mitochondrial ROS but not oxidative phosphorylation. Cell Metab. 1:409–414 [DOI] [PubMed] [Google Scholar]
- 6. Budinger G. R., et al. 1996. Cellular energy utilization and supply during hypoxia in embryonic cardiac myocytes. Am. J. Physiol. Lung Cell. Mol. Physiol. 270:L44–L53 [DOI] [PubMed] [Google Scholar]
- 7. Cahalan M. D. 2009. STIMulating store-operated Ca(2+) entry. Nat. Cell Biol. 11:669–677 [DOI] [PMC free article] [PubMed] [Google Scholar]
- 8. Carling D., Sanders M. J., Woods A. 2008. The regulation of AMP-activated protein kinase by upstream kinases. Int. J. Obes. 32(Suppl. 4):S55–S59 [DOI] [PubMed] [Google Scholar]
- 9. Chandel N. S., et al. 1998. Mitochondrial reactive oxygen species trigger hypoxia-induced transcription. Proc. Natl. Acad. Sci. U. S. A. 95:11715–11720 [DOI] [PMC free article] [PubMed] [Google Scholar]
- 10. Comellas A. P., et al. 2006. Hypoxia-mediated degradation of Na,K-ATPase via mitochondrial reactive oxygen species and the ubiquitin-conjugating system. Circ. Res. 98:1314–1322 [DOI] [PubMed] [Google Scholar]
- 11. Dada L. A., et al. 2003. Hypoxia-induced endocytosis of Na,K-ATPase in alveolar epithelial cells is mediated by mitochondrial reactive oxygen species and PKC-zeta. J. Clin. Invest. 111:1057–1064 [DOI] [PMC free article] [PubMed] [Google Scholar]
- 12. Emerling B. M., et al. 2009. Hypoxic activation of AMPK is dependent on mitochondrial ROS but independent of an increase in AMP/ATP ratio. Free Radic. Biol. Med. 46:1386–1391 [DOI] [PMC free article] [PubMed] [Google Scholar]
- 13. Fukuda N., et al. 2001. Mechanisms of TNF-alpha stimulation of amiloride-sensitive sodium transport across alveolar epithelium. Am. J. Physiol. Lung Cell. Mol. Physiol. 280:L1258–L1265 [DOI] [PubMed] [Google Scholar]
- 14. Gusarova G. A., et al. 2009. Alpha1-AMP-activated protein kinase regulates hypoxia-induced Na,K-ATPase endocytosis via direct phosphorylation of protein kinase C zeta. Mol. Cell. Biol. 29:3455–3464 [DOI] [PMC free article] [PubMed] [Google Scholar]
- 15. Guzy R. D., et al. 2005. Mitochondrial complex III is required for hypoxia-induced ROS production and cellular oxygen sensing. Cell Metab. 1:401–408 [DOI] [PubMed] [Google Scholar]
- 16. Hawley S. A., et al. 2003. Complexes between the LKB1 tumor suppressor, STRAD alpha/beta and MO25 alpha/beta are upstream kinases in the AMP-activated protein kinase cascade. J. Biol. 2:28. [DOI] [PMC free article] [PubMed] [Google Scholar]
- 17. Hawley S. A., et al. 1996. Characterization of the AMP-activated protein kinase kinase from rat liver and identification of threonine 172 as the major site at which it phosphorylates AMP-activated protein kinase. J. Biol. Chem. 271:27879–27887 [DOI] [PubMed] [Google Scholar]
- 18. Hawley S. A., et al. 2005. Calmodulin-dependent protein kinase kinase-beta is an alternative upstream kinase for AMP-activated protein kinase. Cell Metab. 2:9–19 [DOI] [PubMed] [Google Scholar]
- 19. Huang G. N., et al. 2006. STIM1 carboxyl-terminus activates native SOC, I(crac) and TRPC1 channels. Nat. Cell Biol. 8:1003–1010 [DOI] [PubMed] [Google Scholar]
- 20. Hurley R. L., et al. 2005. The Ca2+/calmodulin-dependent protein kinase kinases are AMP-activated protein kinase kinases. J. Biol. Chem. 280:29060–29066 [DOI] [PubMed] [Google Scholar]
- 21. King M. P., Attardi G. 1996. Isolation of human cell lines lacking mitochondrial DNA. Methods Enzymol. 264:304–313 [DOI] [PubMed] [Google Scholar]
- 22. Klimova T. A., et al. 2009. Hyperoxia-induced premature senescence requires p53 and pRb, but not mitochondrial matrix ROS. FASEB J. 23:783–794 [DOI] [PMC free article] [PubMed] [Google Scholar]
- 23. Lecuona E., et al. 2006. Na,K-ATPase alpha1-subunit dephosphorylation by protein phosphatase 2A is necessary for its recruitment to the plasma membrane. FASEB J. 20:2618–2620 [DOI] [PubMed] [Google Scholar]
- 24. Lewis R. S. 2007. The molecular choreography of a store-operated calcium channel. Nature 446:284–287 [DOI] [PubMed] [Google Scholar]
- 24a. Li T., Folkesson H. G. 2006. RNA interference for alpha-ENaC inhibits rat lung fluid absorption in vivo. Am. J. Physiol. Lung Cell. Mol. Physiol. 290:L649–L660 [DOI] [PubMed] [Google Scholar]
- 25. Lieber M., Smith B., Szakal A., Nelson-Rees W., Todaro G. 1976. A continuous tumor-cell line from a human lung carcinoma with properties of type II alveolar epithelial cells. Int. J. Cancer 17:62–70 [DOI] [PubMed] [Google Scholar]
- 26. Litvan J., et al. 2006. Beta-adrenergic receptor stimulation and adenoviral overexpression of superoxide dismutase prevent the hypoxia-mediated decrease in Na,K-ATPase and alveolar fluid reabsorption. J. Biol. Chem. 281:19892–19898 [DOI] [PubMed] [Google Scholar]
- 27. Luik R. M., Wu M. M., Buchanan J., Lewis R. S. 2006. The elementary unit of store-operated Ca2+ entry: local activation of CRAC channels by STIM1 at ER-plasma membrane junctions. J. Cell Biol. 174:815–825 [DOI] [PMC free article] [PubMed] [Google Scholar]
- 28. Mairbaurl H., Wodopia R., Eckes S., Schulz S., Bartsch P. 1997. Impairment of cation transport in A549 cells and rat alveolar epithelial cells by hypoxia. Am. J. Physiol. 273:L797–L806 [DOI] [PubMed] [Google Scholar]
- 29. Mansfield K. D., et al. 2005. Mitochondrial dysfunction resulting from loss of cytochrome c impairs cellular oxygen sensing and hypoxic HIF-alpha activation. Cell Metab. 1:393–399 [DOI] [PMC free article] [PubMed] [Google Scholar]
- 30. Martinelli R., et al. 2009. ICAM-1-mediated endothelial nitric oxide synthase activation via calcium and AMP-activated protein kinase is required for transendothelial lymphocyte migration. Mol. Biol. Cell 20:995–1005 [DOI] [PMC free article] [PubMed] [Google Scholar]
- 31. Merlin J., et al. 2010. The M3-muscarinic acetylcholine receptor stimulates glucose uptake in L6 skeletal muscle cells by a CaMKK-AMPK-dependent mechanism. Cell Signal. 22:1104–1113 [DOI] [PubMed] [Google Scholar]
- 32. Milligan L. P., McBride B. W. 1985. Energy costs of ion pumping by animal tissues. J. Nutr. 115:1374–1382 [DOI] [PubMed] [Google Scholar]
- 33. Muik M., et al. 2008. Dynamic coupling of the putative coiled-coil domain of ORAI1 with STIM1 mediates ORAI1 channel activation. J. Biol. Chem. 283:8014–8022 [DOI] [PubMed] [Google Scholar]
- 34. Mutlu G. M., Sznajder J. I. 2005. Mechanisms of pulmonary edema clearance. Am. J. Physiol. Lung Cell. Mol. Physiol. 289:L685–L695 [DOI] [PubMed] [Google Scholar]
- 35. Navarro-Borelly L., et al. 2008. STIM1-Orai1 interactions and Orai1 conformational changes revealed by live-cell FRET microscopy. J. Physiol. 586:5383–5401 [DOI] [PMC free article] [PubMed] [Google Scholar]
- 36. Parekh A. B., Putney J. W., Jr 2005. Store-operated calcium channels. Physiol. Rev. 85:757–810 [DOI] [PubMed] [Google Scholar]
- 37. Prakriya M. 2009. The molecular physiology of CRAC channels. Immunol. Rev. 231:88–98 [DOI] [PMC free article] [PubMed] [Google Scholar]
- 38. Ridge K. M., et al. 2003. Alveolar type 1 cells express the alpha2 Na,K-ATPase, which contributes to lung liquid clearance. Circ. Res. 92:453–460 [DOI] [PubMed] [Google Scholar]
- 39. Sakamoto K., et al. 2006. Deficiency of LKB1 in heart prevents ischemia-mediated activation of AMPKalpha2 but not AMPKalpha1. Am. J. Physiol. Endocrinol. Metab. 290:E780–E788 [DOI] [PMC free article] [PubMed] [Google Scholar]
- 39a. Saldias F. J., Azzam Z. S., Ridge K. M., Yeldandi A., Rutschman D. H., Schraufnagel D., Sznajder J. I. 2001. Alveolar fluid reabsorption is impaired by increased left atrial pressures in rats. Am. J. Physiol. Lung Cell Mol. Physiol. 281:L591–L597 [DOI] [PubMed] [Google Scholar]
- 40. Salt I., et al. 1998. AMP-activated protein kinase: greater AMP dependence, and preferential nuclear localization, of complexes containing the alpha2 isoform. Biochem. J. 334:177–187 [DOI] [PMC free article] [PubMed] [Google Scholar]
- 41. Sarbassov D. D., Guertin D. A., Ali S. M., Sabatini D. M. 2005. Phosphorylation and regulation of Akt/PKB by the rictor-mTOR complex. Science 307:1098–1101 [DOI] [PubMed] [Google Scholar]
- 42. Sartori C., et al. 2002. Salmeterol for the prevention of high-altitude pulmonary edema. N. Engl. J. Med. 346:1631–1636 [DOI] [PubMed] [Google Scholar]
- 43. Schroedl C., McClintock D. S., Budinger G. R., Chandel N. S. 2002. Hypoxic but not anoxic stabilization of HIF-1alpha requires mitochondrial reactive oxygen species. Am. J. Physiol. Lung Cell. Mol. Physiol. 283:L922–L931 [DOI] [PubMed] [Google Scholar]
- 44. Stahmann N., Woods A., Carling D., Heller R. 2006. Thrombin activates AMP-activated protein kinase in endothelial cells via a pathway involving Ca2+/calmodulin-dependent protein kinase kinase beta. Mol. Cell. Biol. 26:5933–5945 [DOI] [PMC free article] [PubMed] [Google Scholar]
- 45. Sznajder J. I., Wood L. D. 1991. Beneficial effects of reducing pulmonary edema in patients with acute hypoxemic respiratory failure. Chest 100:890–892 [DOI] [PubMed] [Google Scholar]
- 46. Tamas P., et al. 2006. Regulation of the energy sensor AMP-activated protein kinase by antigen receptor and Ca2+ in T lymphocytes. J. Exp. Med. 203:1665–1670 [DOI] [PMC free article] [PubMed] [Google Scholar]
- 47. Trejo H. E., et al. 2010. Role of kinesin light chain-2 of kinesin-1 in the traffic of Na,K-ATPase-containing vesicles in alveolar epithelial cells. FASEB J. 24:374–382 [DOI] [PMC free article] [PubMed] [Google Scholar]
- 48. Turrens J. F. 2003. Mitochondrial formation of reactive oxygen species. J. Physiol. 552:335–344 [DOI] [PMC free article] [PubMed] [Google Scholar]
- 49. Tzatsos A., Tsichlis P. N. 2007. Energy depletion inhibits phosphatidylinositol 3-kinase/Akt signaling and induces apoptosis via AMP-activated protein kinase-dependent phosphorylation of IRS-1 at Ser-794. J. Biol. Chem. 282:18069–18082 [DOI] [PubMed] [Google Scholar]
- 50. Vadasz I., et al. 2008. AMP-activated protein kinase regulates CO2-induced alveolar epithelial dysfunction in rats and human cells by promoting Na,K-ATPase endocytosis. J. Clin. Invest. 118:752–762 [DOI] [PMC free article] [PubMed] [Google Scholar]
- 51. Vivona M. L., Matthay M., Chabaud M. B., Friedlander G., Clerici C. 2001. Hypoxia reduces alveolar epithelial sodium and fluid transport in rats: reversal by beta-adrenergic agonist treatment. Am. J. Respir. Cell Mol. Biol. 25:554–561 [DOI] [PubMed] [Google Scholar]
- 52. Ware L. B., Matthay M. A. 2005. Clinical practice. Acute pulmonary edema. N. Engl. J. Med. 353:2788–2796 [DOI] [PubMed] [Google Scholar]
- 53. Woods A., et al. 2005. Ca2+/calmodulin-dependent protein kinase kinase-beta acts upstream of AMP-activated protein kinase in mammalian cells. Cell Metab. 2:21–33 [DOI] [PubMed] [Google Scholar]
- 54. Woods A., et al. 2003. LKB1 is the upstream kinase in the AMP-activated protein kinase cascade. Curr. Biol. 13:2004–2008 [DOI] [PubMed] [Google Scholar]
- 55. Wu M. M., Buchanan J., Luik R. M., Lewis R. S. 2006. Ca2+ store depletion causes STIM1 to accumulate in ER regions closely associated with the plasma membrane. J. Cell Biol. 174:803–813 [DOI] [PMC free article] [PubMed] [Google Scholar]