Abstract
AMP-activated protein kinase (AMPK) is an energy sensor activated by increases in [AMP] or by oxidant stress (reactive oxygen species [ROS]). Hypoxia increases cellular ROS signaling, but the pathways underlying subsequent AMPK activation are not known. We tested the hypothesis that hypoxia activates AMPK by ROS-mediated opening of calcium release-activated calcium (CRAC) channels. Hypoxia (1.5% O2) augments cellular ROS as detected by the redox-sensitive green fluorescent protein (roGFP) but does not increase the [AMP]/[ATP] ratio. Increases in intracellular calcium during hypoxia were detected with Fura2 and the calcium-calmodulin fluorescence resonance energy transfer (FRET) sensor YC2.3. Antioxidant treatment or removal of extracellular calcium abrogates hypoxia-induced calcium signaling and subsequent AMPK phosphorylation during hypoxia. Oxidant stress triggers relocation of stromal interaction molecule 1 (STIM1), the endoplasmic reticulum (ER) Ca2+ sensor, to the plasma membrane. Knockdown of STIM1 by short interfering RNA (siRNA) attenuates the calcium responses to hypoxia and subsequent AMPK phosphorylation, while inhibition of L-type calcium channels has no effect. Knockdown of the AMPK upstream kinase LKB1 by siRNA does not prevent AMPK activation during hypoxia, but knockdown of CaMKKβ abolishes the AMPK response. These findings reveal that hypoxia can trigger AMPK activation in the apparent absence of increased [AMP] through ROS-dependent CRAC channel activation, leading to increases in cytosolic calcium that activate the AMPK upstream kinase CaMKKβ.
INTRODUCTION
Energy-dependent cellular processes require ATP, which is derived from mitochondrial oxidative phosphorylation and/or from glycolysis. Conditions that limit the cellular oxygen supply to the point that oxidative metabolism suffers can threaten cell survival because they undermine the ability of the cell to sustain essential ATP-dependent processes. Given that ATP supply is critical for survival, multiple systems have evolved to protect cells from the consequences of oxygen supply limitation and metabolic substrate deprivation. In this regard, defense of cellular energy substrates is mediated by the AMP-activated protein kinase (AMPK) system, which has been described as a “fuel gauge of the cell” (17). Activation of AMPK leads to increased glucose uptake via translocation of the transporter GLUT4 to the plasma membrane (42) and activation of glycolytic enzymes such as 6-phosphofructo-2-kinase, leading to enhanced glycolytic capacity via increases in fructose-2,6-bisphosphate (36). These and other responses triggered by AMPK activation confer protection against hypoxic injury in tissues such as the heart by preserving energy supply, mitochondrial metabolism, and glycolytic flux (43).
AMPK activation requires phosphorylation of Thr-172 in the activation loop of its α subunit (21) and is regulated by increases in cellular AMP and decreases in ATP via allosteric mechanisms and by the activity of upstream kinases and phosphatases that control AMPK phosphorylation and dephosphorylation at the critical threonine residue (8, 23). Perhaps the best-described AMPK kinase is the tumor suppressor LKB1, which phosphorylates the catalytic α subunit of AMPK in an AMP-dependent manner (20, 53). A second activation pathway occurs independently of cellular AMP levels and involves Ca2+/calmodulin-dependent protein kinase kinase (CaMKKβ) (25, 52). In that pathway, activation is initiated by a rise in [Ca2+]i which increases the activity of CaMKKβ, which then phosphorylates AMPK. In vitro studies using both endogenous and recombinant proteins show that LKB1 and CaMKKβ phosphorylate AMPK at Thr-172 (4, 20, 52). Activation of AMPK can also occur in response to oxidant stress (26, 47), as demonstrated by the observation that H2O2 administration triggers phosphorylation of AMPK and its downstream target, acyl coenzyme A carboxylase (ACC) (7, 28). However, the mechanism underlying this reactive oxygen species (ROS)-dependent activation of AMPK is not known.
During severe oxygen deprivation, limitations in mitochondrial respiration lead to increases in the AMP/ATP ratio, which then trigger AMPK activation. However, AMPK-mediated protection might be greater if the kinase was activated before the cell reached the point where the AMP/ATP ratio has increased. Some beneficial effects of AMPK signaling, including the activation of gene expression or mitochondrial biogenesis (39), are not instantaneous; therefore, activation of AMPK in anticipation of a lethal bioenergetic crisis could enhance protection. By analogy, the protective effects of hypoxia-inducible factor (HIF) against hypoxic stress require time for stabilization of the protein, dimerization with ARNT, and transcription of new genes (33). Low levels of ROS signals are generated during hypoxia; these oxidant signals activate protective responses, including HIF activation, in diverse cell types (6, 15, 31, 45, 48). Given that ROS signals during hypoxia can activate protective mechanisms and given that oxidant stress can activate AMPK in cultured cells, the present study sought to determine whether endogenous ROS signals generated during hypoxia could lead to the activation of AMPK in a manner independent from an increase in AMP levels. Furthermore, we sought to determine the mechanism by which oxidant signals mediated this increase in AMPK activation.
MATERIALS AND METHODS
Reagents and cell lines.
Human 143B osteosarcoma cells were obtained from the American Type Culture Collection and cultured according to the vendor's recommendations. Murine embryonic fibroblasts (MEFs) from mice genetically deficient for LKB1 (LKB1−/−) were obtained as a gift from Ronald DePinho (1) and cultured in Dulbecco modified Eagle medium (DMEM) with 10% fetal bovine serum, 100 IU/ml penicillin, and 100 μg/ml streptomycin. Adenovirus expressing the calcium-sensitive fluorescence resonance energy transfer (FRET) probe YC2.3 (13) was obtained as a gift from Michael Roe. An antibody for β-actin was obtained from Abcam, and antibodies for CaMKKβ were obtained from Santa Cruz Biotechnology and Sigma. All other antibodies were from Cell Signaling Technology. Short interfering RNAs (siRNAs) were obtained from Ambion. Other chemicals and reagents were obtained from Sigma.
Hypoxia.
Cells grown to 70 to 80% confluence on 25-mm glass coverslips were placed into a flowthrough chamber consisting of two coverslips separated by a stainless steel spacer ring. In the chamber, cells were superperfused with balanced salt solution (BSS) bubbled with O2-CO2-N2 gas mixtures at 37°C in a water-jacketed column. Cells were equilibrated at baseline with a BSS containing NaCl (117 mM), KCl (4 mM), NaHCO3 (18 mM), MgSO4 (0.76 mM), NaH2PO4 (1 mM), CaCl2 (1.21 mM), and glucose (5.6 mM) bubbled with 5% CO2, 21% O2, and the balance N2. For hypoxia, BSS was bubbled with 5% CO2, 1.5% O2, and the balance N2. Trace calcium BSS contained CaCl2 at 0.1 mM, while calcium-free BSS was made without CaCl2 and included EGTA (2.5 mM) with the final pH adjusted to 7.4.
Western blot analysis.
At the end of treatment with hypoxia, the tubing at each end of the flowthrough chamber was clamped and the sealed chamber was submerged in an ice-water slurry to chill cells quickly. The chamber was then opened, and the cells were dissociated with a lysis buffer consisting of Tris HCl pH 7.4 (50 mM), NaCl (150 mM), Triton X-100 (1%), EDTA (2 mM), β-glycerophosphate (40 mM), phenylmethylsulfonyl fluoride (PMSF) (1 mM), NaF (10 mM), sodium orthovanadate (250 μM), and a protease inhibitor cocktail (Roche). Cells in lysis buffer were scraped from the coverslips, flushed several times through a tuberculin syringe, and incubated on ice for 15 min. Whole-cell lysates were centrifuged at 16,000 × g for 10 min and supernatants collected. Lysates were separated on SDS-polyacrylamide gels and transferred to nitrocellulose membranes that were blotted with primary antibodies. Blots were further incubated with secondary horseradish peroxidase (HRP)-conjugated antibodies and stained with ECL reagent (Amersham). Chemiluminescence was detected on film and quantified using Image J.
Assessment of oxidant signaling using roGFP or DCFH and of calcium using the YC2.3 sensor.
A recombinant adenovirus expressing the redox-sensitive green fluorescent protein (roGFP) redox sensor (9, 16) was utilized to achieve high transduction efficiency in cultured cells. Other cells were transduced with recombinant adenovirus expressing YC2.3, a ratiometric calcium indicator (13). Infected cells were returned to the incubator for 24 to 36 h to allow for protein expression. For imaging experiments, cells were superperfused with BSS under controlled O2/CO2 conditions in a flowthrough system as described above. Images were collected using a 16-bit cool charge-coupled device (CCD) detector, using excitation wavelengths of 400 and 485 nm (roGFP) or 430 nm (YC2.3). Fluorescence was detected at 535 nm (roGFP) and at 470 and 535 nm (YC2.3). Ratios for roGFP (485/400) or YC2.3 (535/470) were assessed using Metafluor software (Universal Imaging).
Oxidant signaling was also assessed using 2,7-dichlorofluorescin diacetate (DCFH-DA). Cells were superfused with BSS containing DCFH-DA (5 μM), and fluorescence images were collected every minute at 535 nm using excitation at 484 nm. Cellular fluorescence data were collected from individual cell regions of interest and averaged to provide an overall assessment for each coverslip. Values obtained from replicate coverslips were then averaged.
Knockdown of gene expression with siRNA.
Cells grown on coverslips were transfected with siRNA (100 nM) using Lipofectamine RNAmax reagent (2.5 μl) in a final volume of 0.7 ml Optimem (Invitrogen). After incubation (5 h) with occasional rocking, 1.5 ml of complete medium was added. The medium was changed after an overnight incubation, and cells were analyzed at 48 h posttransfection. Control cells were transfected with a negative-control siRNA. The following siRNA oligonucleotides from Ambion were used in this study: negative-control 2 siRNA, STIM1 siRNA s13561, CaMKKβ siRNAs s101668 and s20926, and LKB1 siRNA s74499. Knockdown of gene expression was quantified by Western blotting.
Nifedipine treatment.
Nifedipine was diluted in dimethyl sulfoxide (DMSO) and used at a final concentration of 2 μM. Cells were superperfused with BSS containing nifedipine or DMSO under controlled O2/CO2 conditions in a flowthrough system as described above. Lysates were collected and analyzed by Western blotting.
Measurement of adenine nucleotide concentrations.
ATP, ADP, and AMP concentrations were determined by high-performance liquid chromatography (HPLC) (27). After incubation inside a glove box (Coy Laboratories) equilibrated to 1.5% O2, 5% CO2, and the balance N2 for 2 h, 3 × 10⁷ cells were immediately harvested in a minimal volume of ice-cold 66.7 mM perchloric acid and spun down in a refrigerated centrifuge for 10 min at maximum speed. After centrifugation, 10 μl of 2 M Tris (pH 8.0) was added to 300 μl of supernatant, and the extracts were neutralized with 10 μl of 1N KOH. Samples were analyzed by HPLC as previously described (3).
Immunofluorescence.
143B human osteosarcoma cells on coverslips were treated with a single bolus of tert-butyl hydroperoxide (tBH) (100 μM) or thapsigargin (TG) (2 μM) or with brief hypoxia (1.5% O2) and fixed with 3% formaldehyde in phosphate-buffered saline (PBS). Cells were permeabilized with ice-cold methanol and blocked using 1% normal goat serum (NGS) in PBS. Cells were hybridized with a primary antibody specific for STIM1 diluted in 1% NGS in PBS at 1:100 followed by an Alexa anti-rabbit secondary antibody diluted 1:1,000. Cells were imaged on a Zeiss LSM 510 META laser confocal system.
Fura2-AM hypoxia studies.
143B human osteosarcoma cells on coverslips were incubated with fura-2-acetoxymethyl ester (Fura2-AM) (5 μM) for 1 h under normal culture conditions and then incubated for 15 min longer in BSS without dye. For imaging experiments, cells were superperfused with BSS under controlled O2/CO2 conditions in a flowthrough system as described above. Images were collected using a 16-bit cool CCD detector, using excitation wavelengths of 340 and 380 nm. Fluorescence was detected at 535 nm, and ratios (340/380) were assessed using Metafluor software (Universal Imaging).
Immunohistochemistry.
Formalin-fixed, paraffin-embedded 4-μm sections of mouse lungs were placed on charged slides. Lung sections were deparaffinized, and target retrieval was carried out using a digital pressure cooker (Biocare Medical) heated to 125°C for 30 s and then cooled to 90°C before venting. Hydrogen peroxide (3%) was applied to the sections for 10 min to quench endogenous tissue peroxidase. The lung sections were incubated with primary antibodies specific for ACC or for ACC phosphorylated at Ser-79 (p-ACC) (Cell Signaling Technology), according to the manufacturer's recommendations, and with Dako anti-rabbit secondary antibodies. Immunohistochemical reactions were developed with diaminobenzidine and counterstained in Mayer's hematoxylin (Sigma). Stained lung sections were imaged on a Zeiss Axioskop system equipped with a CRi Nuance spectral camera. Images were color separated using Nuance software. Blue and brown layers were analyzed with Metamorph software to calculate the integrated pixel intensity for the stained areas in each field. The total integrated intensity for p-ACC or ACC staining in each image was normalized to hematoxylin stain.
Mouse hypoxia experiments.
Mice were housed in room air or 10% O2 in an environmentally controlled glove box for 28 days. Some mice housed under hypoxia were treated with the chemical antioxidant N-acetyl-l-cysteine (NAC) administered in their drinking water at a final concentration of 40 mM (12). NAC-supplemented drinking water was prepared and changed daily. Animal studies were approved by the Northwestern University IACUC.
Pulmonary microvessel myocyte isolation.
Rat pulmonary arterial smooth muscle cells (PASMC) were isolated as described previously (50) using a modification of the method of Marshall et al (35). Cells isolated by this method were confirmed to be PASMC as previously described (50).
Ca2+ imaging studies.
143B cells were grown on poly-d-lysine-coated glass-bottom dishes (MatTekcorp) and loaded with 2.5 μM Fura2-AM (Invitrogen) for 35 min at room temperature. Cells were treated with thapsigargin (1 μM; Sigma) in 0 mM Ca2+ Ringer solution (150 mM NaCl, 4.5 mM KCl, 10 mM d-glucose, 5 mM HEPES, 1 mM EGTA, and 3 mM MgCl2) to deplete endoplasmic reticulum (ER) Ca2+ stores, and 2 mM Ca2+ Ringer solution (150 mM NaCl, 4.5 mM KCl, 10 mM d-glucose, 5 mM HEPES, 1 mM EGTA, 1 mM MgCl2, and 2 mM CaCl2) was then added to isolate store-operated Ca2+ influx. The same protocol was used to study intracellular Ca2+ responses to tBH. Fura images were acquired by alternately exciting Fura2-loaded cells at 340 nm and 380 nm and collecting the emission at 510 nm. Image pairs were acquired every 6 s on an IX71inverted microscope (Olympus, Center Valley, PA) equipped with a 40× oil-immersion objective, a xenon arc lamp (Sutter, Novatao, CA), and excitation and emission filter wheels (Sutter). Images were captured on a cooled CCD camera (Hamamatsu). Image acquisition and analysis were performed with IPLab software (Scanalytics, Rockville, MD). Background-subtracted images were thresholded, and regions of interest were drawn around single cells. The 340/380 intensity ratio was plotted as a function of time.
RESULTS
ROS are sufficient to activate AMPK phosphorylation.
To test whether treatment with exogenous oxidants is sufficient to increase AMPK activity, 143B osteosarcoma cells were treated with the exogenous oxidant tBH. A significant phosphorylation of AMPK was observed after 1 and 2 h of treatment, as indicated by immunoblotting of cell lysates with an AMPK-α Thr-172 phosphospecific antibody (Fig. 1). To determine whether that phosphorylation was associated with an increase in AMPK activity, we measured phosphorylation of its downstream substrate, ACC. Treatment with tBH increased ACC phosphorylation, as assessed by immunoblotting of cell lysates with an antibody specific for phosphoserine 79. Phosphorylation of ACC has been reported to stimulate fatty acid oxidation through an inhibition of ACC activity (37). The tBH-induced activation of AMPK was decreased in a dose-dependent manner by administration of compound C, a chemical inhibitor of AMPK. These findings confirm that mild oxidant stress is sufficient to activate AMPK phosphorylation and to produce a corresponding increase in its activity.
Fig. 1.
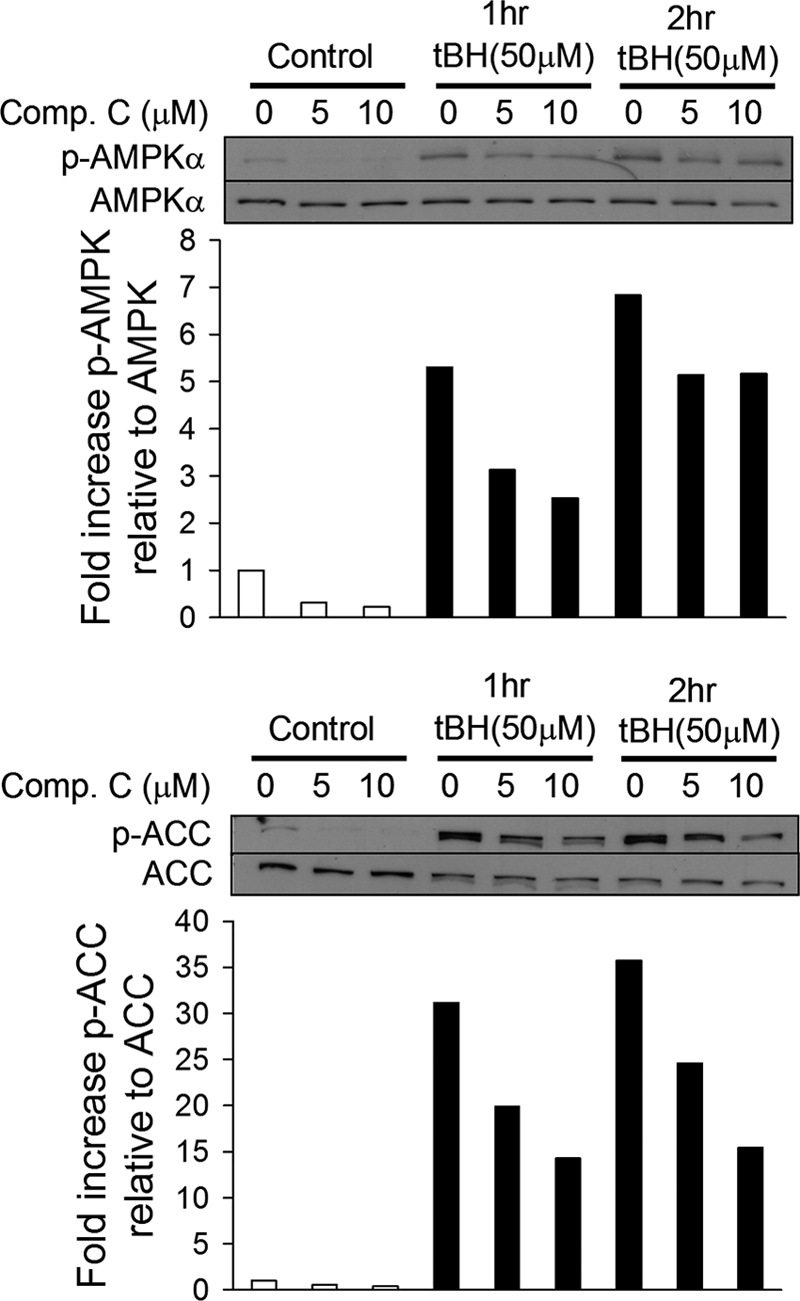
Exogenous oxidants activate AMPK and its activity. 143B cells were untreated (white bars) or treated with tert-butyl hydroperoxide (tBH) (black bars) for 1 or 2 h. Cells were also treated with the AMPK inhibitor compound C (Comp.C). Levels of AMPK phosphorylated at Thr-172 (p-AMPKα) and of ACC phosphorylated at Ser-79 (p-ACC) as well as total AMPKα and ACC were determined by Western blotting. Graphs depict the fold change in the p-AMPK/AMPK or p-ACC/ACC ratio. Representative Western blots are shown.
Hypoxia stimulates ROS production and oxidant signaling in cells.
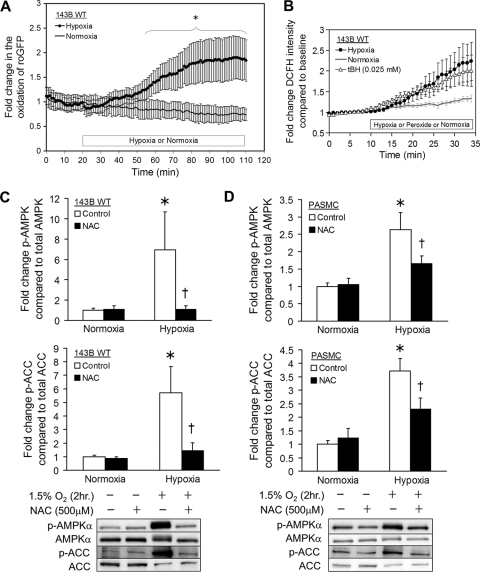
To determine whether endogenous oxidant signals increase during physiological hypoxia (1.5% O2), 143B osteosarcoma cells on coverslips were transduced with an adenovirus expressing roGFP, a protein thiol redox-sensitive sensor. In response to the oxidation/reduction of its cysteine thiols, this protein undergoes reversible changes in fluorescence emission when excited at two wavelengths, thereby providing a ratiometric assessment of oxidant stress (9, 16). Cells expressing roGFP were superperfused with BSS at 37°C in a flowthrough chamber under controlled O2/CO2 conditions while being imaged on an epifluorescence microscopy workstation. During hypoxia, detection of roGFP oxidation began within 15 min and reached statistical significance by 36 min, compared to normoxic controls (Fig. 2A). Similarly, in 143B cells exposed to hypoxia, oxidation of 2′,7′-dichlorofluorescin (DCFH) dye began after 7 min and was comparable to that in cells treated with tBH (Fig. 2B), consistent with increased cellular oxidant production during hypoxia.
Fig. 2.
Activation of AMPK in hypoxia by oxidant signaling. (A) 143B cells expressing the ratiometric redox sensor roGFP were exposed to hypoxia (1.5% O2) (n = 8) or normoxia (21% O2) (n = 5). The graph depicts the fold change in oxidation during hypoxia compared to normoxia over time. Values are expressed as means ± standard errors of the means (SEM). *, P < 0.05. (B) 143B cells were exposed to hypoxia (1.5% O2) (n = 7), normoxia (21% O2) (n = 5), or tBH (25 μM) (n = 3) in the presence of 2′,7′-dichlorofluorescin (DCFH). The graph depicts the fold change in oxidation of DCFH in hypoxia or normoxia with tBH compared to normoxia with respect to time. Values are expressed as means ± SEM. (C) 143B cells were exposed to hypoxia (1.5% O2) (n = 3) or normoxia (21% O2) (n = 4) alone (white bars) or in the presence of the chemical antioxidant N-acetyl-l-cysteine (NAC) (black bars). Levels of AMPK phosphorylated at Thr-172 (p-AMPKα) and of ACC phosphorylated at Ser-79 (p-ACC) as well as total AMPKα and ACC were measured by Western blotting. Graphs depict the fold change in the p-AMPK/AMPK or p-ACC/ACC ratio. Representative Western blots are shown. Values are expressed as means ± SEM. *, P < 0.05 compared to normoxia; †, P < 0.05 compared to hypoxia control. (D) Rat pulmonary arterial smooth muscle cells (PASMC) were exposed to hypoxia (1.5% O2) (n = 7) or normoxia (21% O2) (n = 8) alone (white bars) or in the presence of NAC (black bars). Levels of AMPK phosphorylated at Thr-172 (p-AMPKα) of and ACC phosphorylated at Ser-79 (p-ACC) as well as total AMPKα and ACC were measured by Western blotting. Graphs depict the fold change in the p-AMPK/AMPK or p-ACC/ACC ratio. Representative Western blots are shown. Values are expressed as means ± SEM. *, P < 0.05 compared to normoxia; †, P < 0.05 compared to hypoxia control. WT, wild type.
Hypoxia-induced ROS signals are sufficient to activate AMPK.
To determine whether the ROS produced during hypoxia are necessary to activate AMPK, 143B cells on coverslips were superperfused with BSS in the flowthrough chamber under controlled O2 and CO2 conditions at 37°C. After hypoxia treatment (1.5% O2) for 2 h, cells were rapidly chilled while still hypoxic, and total cell lysates were collected for Western blot analysis of AMPK and ACC phosphorylation. Hypoxia induced significant increases in phosphorylation of AMPK-α and its downstream target, ACC, relative to total AMPK and ACC, respectively (Fig. 2C). Cells subjected to the same period of hypoxia in the presence of the chemical antioxidant NAC showed a virtually complete loss of AMPK-α Thr-172 phosphorylation and a corresponding reduction in AMPK activity as assessed by ACC phosphorylation. To determine whether this response is unique to tumor cells, we repeated these experiments using primary rat pulmonary smooth muscle cells (PASMC) (Fig. 2D). As in 143B cells, addition of chemical antioxidants during hypoxia largely abrogated phosphorylation of AMPK and its activity in PASMC. In other experiments, we harvested both 143B cells and PASMC under hypoxic conditions after 5, 15, 30, and 45 min and analyzed the resulting lysates by Western blotting. No significant increase in phosphorylation of either AMPK or ACC was observed in either cell line during this period. It therefore appears that this response requires hypoxic incubation in excess of 45 min. Thus, endogenous oxidant signals are necessary and sufficient to trigger AMPK-α phosphorylation and activity during hypoxia.
Chemical antioxidants attenuate AMPK activity during hypoxia in intact tissues in vivo.
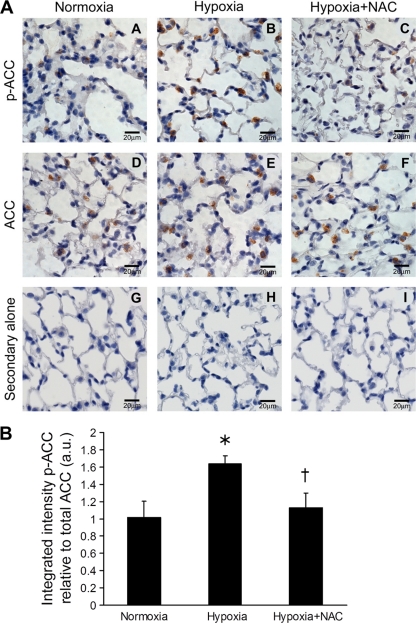
The results show that oxidants produced during hypoxia are necessary for AMPK activation in cellular models. To determine the relevance of this pathway in intact tissue in vivo, AMPK activity in the lungs of mice housed in room air or 10% O2 for 28 days was assessed. Immunohistochemical staining of lung slices was performed using antibodies specific for phosphorylated ACC (Fig. 3A, panels A to C) and ACC (Fig. 3A, panels D to F). Treatment of lung slices with secondary antibody alone confirmed that staining was not due to endogenous peroxidase activity (Fig. 3A, panels G to I). Quantification of staining for phosphorylated ACC relative to total ACC and normalized to hematoxylin stain reveals that lungs from hypoxic mice exhibited more phosphorylated ACC than those from hypoxic mice treated with the chemical antioxidant NAC or those from normoxic mice (Fig. 3B). Thus, a ROS-dependent AMPK activation pathway also occurs in vivo.
Fig. 3.
ROS-dependent activation of AMPK activity in intact lung. (A) Mice were housed for 28 days in normoxia (21% O2), hypoxia (10% O2), or hypoxia with NAC in their drinking water. Images of representative lung sections stained for ACC phosphorylated at Ser-79 (p-ACC) (panels A to C), total ACC (panels D to F), and secondary antibody alone (panels G to I) are shown. (B) Total integrated pixel intensities for lung section areas stained for ACC phosphorylated at Ser-79 (p-ACC) and total ACC compared to hematoxylin were quantified. The graph depicts the p-ACC/ACC ratios. Values are expressed as means ± SEM (n = 3). *, P < 0.05 compared to normoxia; †, P < 0.05 compared to hypoxia. a.u., arbitrary units.
ATP levels do not decline and AMP levels do not increase during hypoxia.
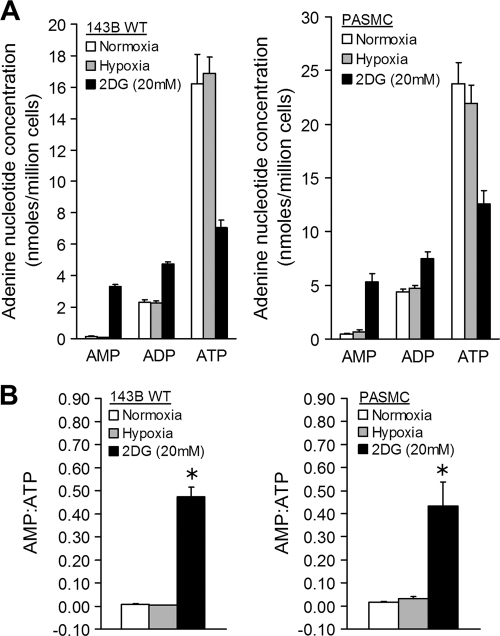
To assess adenine nucleotide levels during hypoxia, 143B cells and PASMC were incubated at 1.5% O2 and 5% CO2 at 37°C for 2 h, at which point the cell lysates were collected for measurement of ATP, ADP, and AMP. Control cells and cells treated with 2-deoxy-d-glucose (2DG) were maintained in a standard cell culture incubator and studied in parallel. Compared with those in normoxic cells, adenine nucleotide levels were unchanged in the hypoxic cells, while cells treated with 2DG had a marked decrease in ATP levels and increased AMP and ADP levels (Fig. 4A). Similarly, the AMP/ATP ratio in hypoxic cells was not different from that in control cells, while 2DG-treated cells had dramatically increased AMP/ATP ratios (Fig. 4B). These results are not surprising, because 2DG inhibits glycolysis whereas hypoxia does not begin to limit mitochondrial respiration until the O2 level is less than 1% (5).
Fig. 4.
AMPK activation in hypoxia: role of AMP. (A) 143B cells and PASMC were exposed to hypoxia (1.5% O2) (n = 5), normoxia (21% O2) (n = 6), or normoxia with 2-deoxy-d-glucose (2DG) (n = 3) for 2 h. Cell lysates were analyzed by HPLC to measure adenine nucleotide concentrations. Graphs depict AMP, ADP, and ATP concentrations under each condition. Values are expressed as means ± SEM. (B) Graphs depict AMP/ATP ratios in 143B cells and PASMC under each experimental condition. Values are expressed as means ± SEM. *, P < 0.05 compared to normoxia or hypoxia.
LKB1 is not required for the oxidant-mediated activation of AMPK by hypoxia.
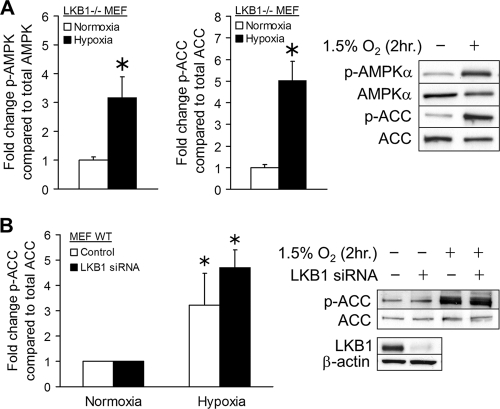
The mammalian serine/threonine kinase LKB1 enhances AMPK activation by AMP (20, 44). To clarify its role in the hypoxia-mediated activation of AMPK, murine embryonic fibroblasts genetically depleted of LKB1 (1) were studied in a flowthrough chamber as described above. After exposure to hypoxia (2 h), total cell lysates were collected and immunoblotted as before. Increases in AMPK and ACC phosphorylation were observed in LKB1−/− cells (Fig. 5A). Studies were also carried out with primary mouse embryonic fibroblasts (MEFs) in which LKB1 expression was suppressed by siRNA. After hypoxia, increases in ACC phosphorylation, a measure of AMPK activity, were observed in LKB1 knockdown cells to a level equivalent to that observed in control cells treated with scrambled siRNA (Fig. 5B). Thus, hypoxia-mediated AMPK activation does not require LKB1.
Fig. 5.
AMPK activation in hypoxia: role of LKB1. Embryonic fibroblasts from mice genetically deficient for LKB1−/− (LKB1−/− MEF) were exposed to hypoxia (1.5% O2) (black bars) or normoxia (21% O2) (white bars). Levels of AMPK phosphorylated at Thr-172 (p-AMPKα) and of ACC phosphorylated at Ser-79 (p-ACC) as well as total AMPKα and ACC were measured by Western blotting. Graphs depict the fold change in the p-AMPK/AMPK or p-ACC/ACC ratio. Representative Western blots are shown. Values are expressed as means ± SEM (n = 9). *, P < 0.05 compared to normoxia. (B) Wild-type mouse embryonic fibroblasts (MEF WT) were transfected with negative-control siRNA (white bars) or siRNA for LKB1 (black bars) and exposed to hypoxia (1.5% O2) or normoxia (21% O2) for 2 h. Levels of ACC phosphorylated at Ser-79 (p-ACC) as well as total ACC were measured by Western blotting. Graphs depict the fold change in p-ACC/ACC ratios. Representative Western blots are shown. Values are expressed as means ± SEM (n = 3). *, P < 0.05 compared to normoxia control.
ROS signals trigger increases in cytosolic Ca2+ that activate AMPK in a CaMKKβ-dependent manner.
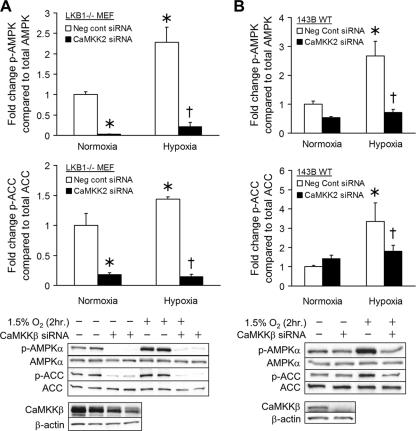
Given that oxidant-mediated activation of AMPK does not require LKB1, we explored the role of CaMKKβ. This kinase responds to increased [Ca2+]i and activates AMPK in an AMP-independent manner (2, 22, 25, 52). First, CaMKKβ expression was suppressed by siRNA in LKB1−/− MEFs. That treatment significantly decreased the expression of CaMKKβ (Fig. 6A). In cell lysates collected after 2 h of hypoxic or normoxic treatment, the basal normoxic level of AMPK phosphorylation and phosphorylation of ACC were decreased in cells with CaMKKβ knockdown compared with cells treated with negative-control siRNA. CaMKKβ knockdown also abolished the increases in AMPK and ACC phosphorylation during hypoxia (Fig. 6A). In parallel experiments using 143B cells with intact LKB1, CaMKKβ knockdown did not affect basal normoxic levels of AMPK or ACC phosphorylation. In hypoxic 143B cells, however, increased AMPK and ACC phosphorylation was abolished by knockdown of CaMKKβ, compared to negative controls (Fig. 6B). These results using two different siRNAs for CaMKKβ in different cell lines provide strong evidence that hypoxic activation of AMPK occurs as a result of CaMKKβ signaling. Importantly, LKB1 kinase activity does not appear to compensate for CaMKKβ during hypoxia.
Fig. 6.
AMPK activation in hypoxia: role of CaMKKβ. (A) LKB1−/− MEFs were transfected with negative-control siRNA (white bars) or siRNA for CaMKKβ (black bars) and exposed to hypoxia (1.5% O2) or normoxia (21% O2) for 2 h. Levels of AMPK phosphorylated at Thr-172 (p-AMPKα) and ACC phosphorylated at Ser-79 (p-ACC) as well as total AMPKα and ACC were measured by Western blotting. Graphs depict the fold change in the p-AMPK/AMPK or p-ACC/ACC ratio. Representative Western blots are shown. Values are expressed as means ± SEM (n = 5). *, P < 0.05 compared to normoxia control; †, P < 0.05 compared to hypoxia control. (B) The same protocol as for panel A was used to study the role of CaMKKβ in AMPK activation during hypoxia. Graphs depict the fold change in the p-AMPK/AMPK or p-ACC/ACC ratio. Representative Western blots are shown. Values are expressed as means ± SEM (n = 5). *, P < 0.05 compared to normoxia control; †, P < 0.05 compared to hypoxia control.
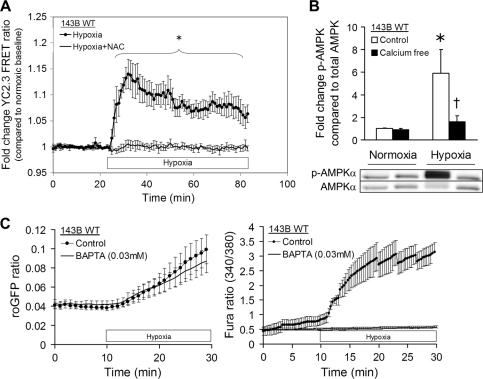
To determine whether the cytosolic [Ca2+]i increases during hypoxia, 143B osteosarcoma cells on coverslips were transduced with an adenovirus expressing the FRET sensor YC2.3 to assess [Ca2+]i. FRET transfer between the cyan fluorescent protein (CFP) and yellow fluorescent protein (YFP) increases in response to calcium binding at the calmodulin-M13 hinge region, so changes in [Ca2+]i lead to changes in the CFP/YFP fluorescence ratio. Cells expressing YC2.3 were studied under controlled O2/CO2 conditions on an epifluorescence microscope. During hypoxia, increases in the CFP/YFP intensity ratio began almost immediately; treatment with the antioxidant NAC abrogated this effect. The hypoxia-induced increase in ratio compared to that for hypoxic cells treated with NAC was statistically evident within 10 min (Fig. 7A). However, 143B cells transduced with the roGFP sensor exhibited increased oxidation during hypoxia even when cells were loaded with the calcium chelator BAPTA-AM to blunt calcium signaling (Fig. 7C). Thus, calcium signaling in hypoxia increases in an ROS-dependent manner, whereas increased calcium is not required for the ROS response.
Fig. 7.
Role of calcium in hypoxia-induced AMPK activation. (A) 143B cells expressing the ratiometric FRET calcium sensor YC2.3 were exposed to hypoxia (1.5% O2) (n = 5) or hypoxia in the presence of NAC (n = 3). The graph depicts the fold change in FRET ratio during hypoxia compared to normoxia with respect to time. Values are expressed as means ± SEM. *, P < 0.05. (B) 143B cells in control (white bars) or calcium-free (black bars) BSS were exposed to hypoxia (1.5% O2) or normoxia (21% O2) for 2 h. Levels of AMPK phosphorylated at Thr-172 (p-AMPKα) as well as total AMPKα were measured by Western blotting. Graphs depict the fold change in p-AMPK/AMPK ratios. Representative Western blots are shown. Values are expressed as means ± SEM (n = 5). *, P < 0.05 compared to normoxia control; †, P < 0.05 compared to hypoxia control. (C) 143B cells expressing roGFP or loaded with Fura2-AM were exposed to hypoxia (1.5% O2) or hypoxia and the calcium chelator BAPTA. The first graph depicts the change in oxidation of roGFP over time. The second graph depicts the change in the 340/380 intensity ratio over time. Values are expressed as means ± SEM (n = 4).
To determine whether entry of extracellular calcium was required for AMPK activation, 143B cells were subjected to hypoxia while superperfused with BSS or calcium-free solutions; cell lysates were then collected and analyzed for AMPK phosphorylation. In the absence of extracellular calcium, AMPK phosphorylation during hypoxia was virtually abolished (Fig. 7B), consistent with a signaling pathway that requires calcium influx for AMPK activation. Collectively, these results indicate that ROS-dependent calcium signaling during hypoxia contributes to the activation of AMPK through a CaMKKβ-dependent mechanism.
143B cells exhibit SOCE and oxidant-induced calcium responses.
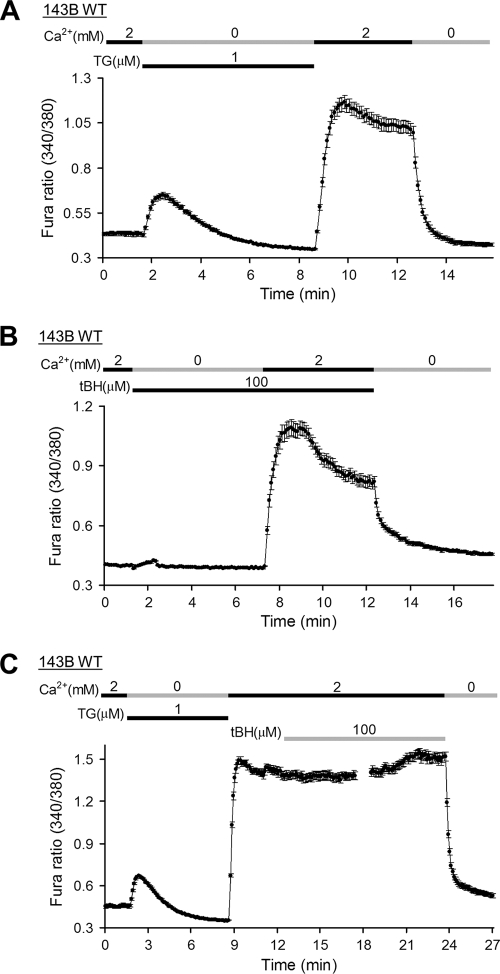
Store-operated calcium entry (SOCE) is the major route of calcium influx in nonexcitable cells. Since SOCE typically occurs through the opening of CRAC channels in the plasma membrane, we sought to determine whether the increased oxidant-mediated calcium signaling in hypoxia required CRAC channels. 143B cells loaded with Fura2-AM were treated with thapsigargin (TG) in calcium-free Ringer solution to inhibit the sarco/ER Ca2+-ATPase (SERCA) in the ER, thereby activating CRAC channels (46). When calcium was restored to the buffer, a rapid increase in [Ca2+]i was observed, consistent with SOCE (Fig. 8A). A similar increase in [Ca2+]i was observed when calcium was restored to cells pretreated with tBH in calcium-free Ringer solution (Fig. 8B). Thus, exogenous oxidants induce calcium responses that resemble SOCE in 143B cells. Furthermore, when tBH was added after calcium was restored to cells in which calcium stores had been depleted by pretreatment with TG and calcium-free Ringer solution, no further increase in [Ca2+]i beyond that caused by reintroduction of calcium into the buffer was observed (Fig. 8C). This indicates that SOCE shares a common mechanism with oxidant-induced calcium responses.
Fig. 8.
SOCE and oxidant-induced Ca2+ responses in 143B cells. (A) 143B cells were loaded with Fura2-AM and treated with thapsigargin (TG) in calcium-free Ringer solution to deplete ER stores, and then 2 mM Ca2+ Ringer solution was added to trigger store-operated Ca2+ influx. The graph depicts the change in the 340/380 intensity ratio over time. Values are expressed as means ± SEM (n = 34). (B) The same protocol as for panel A was used to study intracellular Ca2+ responses to tBH. The graph depicts the change in the 340/380 intensity ratio over time. Values are expressed as means ± SEM (n = 37). (C) 143B cells were loaded with Fura2-AM and treated with thapsigargin (TG) in calcium-free Ringer solution to deplete ER stores, and then 2 mM Ca2+ Ringer solution was added to trigger store-operated Ca2+ influx, after which tBH was added to study oxidant-mediated intracellular Ca2+ responses after SOCE. The graph depicts the change in the 340/380 intensity ratio over time. Values are expressed as means ± SEM (n = 36).
SOCE and oxidant-induced calcium responses in 143B cells show the pharmacological properties of CRAC channels.
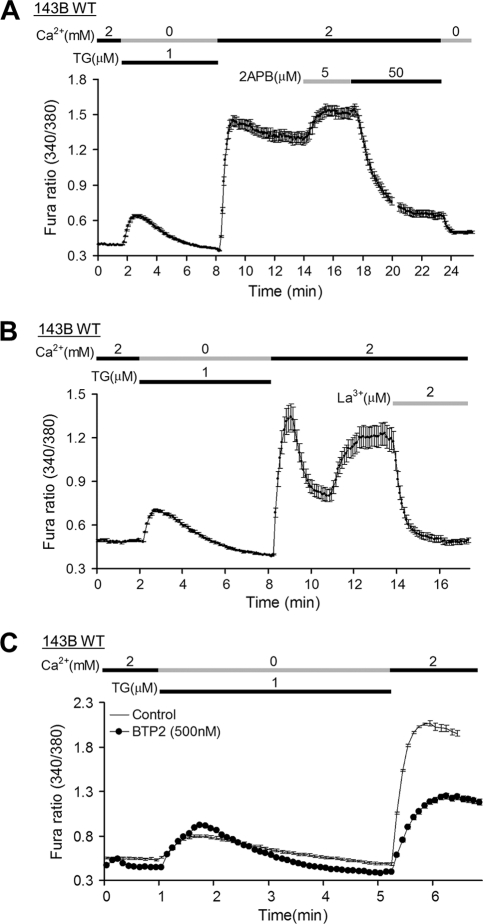
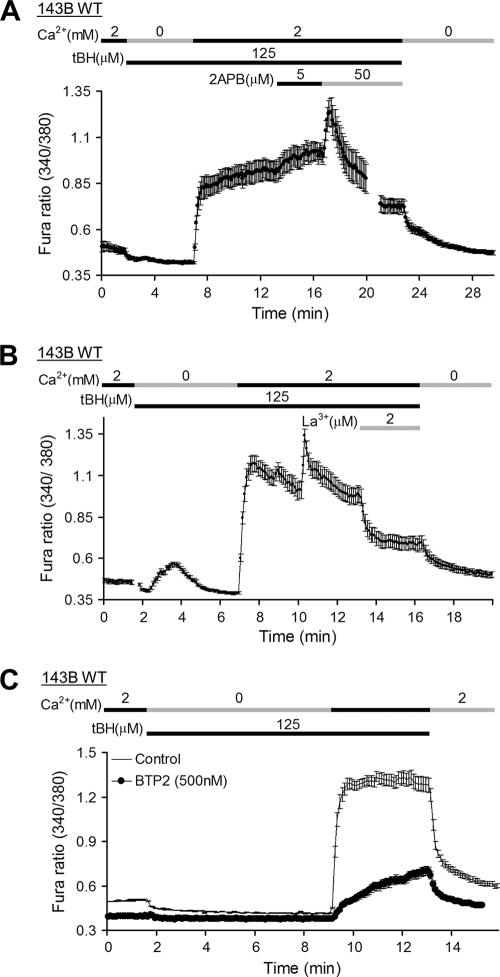
To determine whether SOCE in 143B cells was due to CRAC channel activation, known pharmacological activators and inhibitors of that channel were assessed. Cells were first incubated briefly in calcium-free Ringer solution with TG to deplete calcium stores. When the buffer was changed to Ringer solution with calcium, a sharp increase in [Ca2+]i was detected. Cells subsequently treated with 2-aminoethoxydiphenyl borate (2-APB) (5 μM) exhibited a further increase in [Ca2+]i while treatment with 2-APB (50 μM) sharply decreased [Ca2+]i (Fig. 9A). As lower concentrations of 2-APB cause a potentiation of ICRAC while higher doses cause brief transient potentiation followed by strong inhibition (38), these data are consistent with SOCE via CRAC channels. Lanthanum (La3+), another inhibitor of CRAC channel function (41), also sharply decreased [Ca2+]i in cells during SOCE (Fig. 9B) while cells treated with the pyrazole derivative N-{4-[3,5-bis(trifluorom-ethyl)-1H-pyrazol-1-yl]phenyl}-4-methyl-1,2,3-thiadiazole- 5-carboxamide (BTP-2), a more specific CRAC channel inhibitor (54), showed markedly decreased SOCE following store depletion by TG (Fig. 9C). Interestingly, in cells with tBH-induced SOCE, the responses to these pharmacological agents were almost identical to those of the TG treated cells (Fig. 10A to C). Together these data offer strong pharmacological evidence of ROS-mediated CRAC channel activation in 143B cells.
Fig. 9.
Pharmacological properties of SOCE in 143B cells. (A) 143B cells were loaded with Fura2-AM and treated with thapsigargin (TG) in calcium-free Ringer solution to deplete ER stores, and then 2 mM Ca2+ Ringer solution was added to trigger store-operated Ca2+ influx, after which 2-APB was added to characterize ICRAC in these cells. The graph represents the change in the 340/380 intensity ratio over time. Values are expressed as means ± SEM (n = 31). (B) The same protocol as for panel A was used to characterize ICRAC with lanthanum (La3+) in 143B cells. The graph depicts the change in the 340/380 intensity ratio over time. Values are expressed as means ± SEM (n = 16). (C) 143B cells (n = 42) and 143B cells treated with the CRAC channel inhibitor BTP-2 (n = 41) were loaded with Fura2-AM and treated with thapsigargin (TG) in calcium-free Ringer solution to deplete ER store, and then, 2 mM Ca2+ Ringer solution was added to trigger store-operated Ca2+ influx. The graph depicts the change in the 340/380 intensity ratio over time. Values are expressed as means ± SEM.
Fig. 10.
Pharmacological properties of oxidant-induced Ca2+ responses in 143B cells. (A) 143B cells were loaded with Fura2-AM and transferred to calcium-free Ringer solution, and then 2 mM Ca2+ Ringer solution was added in the presence of tBH to trigger oxidant-mediated intracellular Ca2+ entry, after which 2APB was added to characterize ICRAC in these cells. The graph depicts the change in the 340/380 intensity ratio over time. Values are expressed as means ± SEM (n = 49). (B) The same protocol as in for panel A was used to inhibit ICRAC with lanthanum (La3+) in 143B cells. The graph represents the change in the 340/380 intensity ratio over time. Values are expressed as means ± SEM (n = 16). (C) 143B cells (n = 42) and 143B cells treated with the CRAC channel inhibitor BTP-2 (n = 41) were loaded with Fura2-AM and treated with tBH in calcium-free Ringer solution, and then, 2 mM Ca2+ Ringer solution was added to examine oxidant-mediated intracellular Ca2+ responses. The graph depicts the change in the 340/380 intensity ratio over time. Values are expressed as means ± SEM.
STIM1 knockdown attenuates oxidant-induced calcium responses in hypoxia.
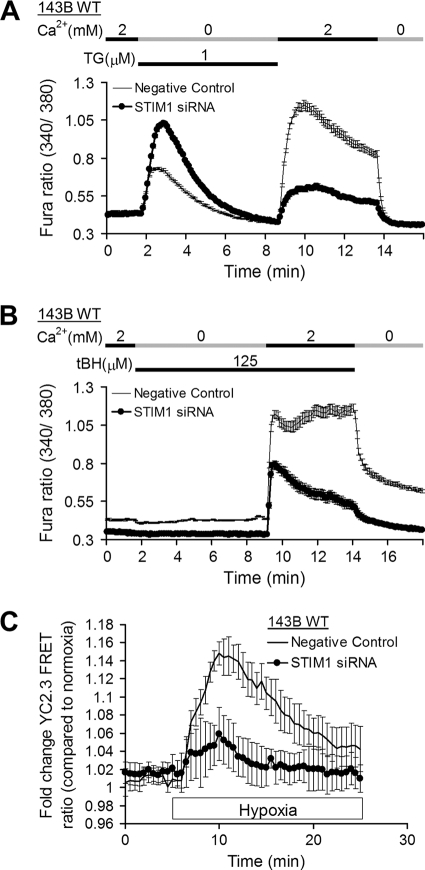
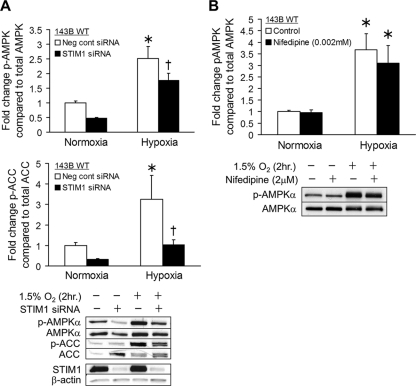
STIM1 acts as a sensor of calcium stores in the ER. When ER calcium decreases, STIM1 redistributes to the peripheral ER regions adjacent to the plasma membrane and activates CRAC channels via direct physical interactions with the Orai subunits (24). To further demonstrate that oxidant-induced calcium responses result from calcium influx through CRAC channels, 143B cells transfected either with siRNA for STIM1 to diminish CRAC channel function or with a negative-control siRNA were loaded with Fura2-AM and ratiometric images were collected. Suppression of STIM1 expression by siRNA attenuated calcium uptake in cells depleted of calcium stores by TG or treated with tBH, as previously described (Fig. 11A and B). To determine whether increased [Ca2+]i in hypoxia results from calcium influx through CRAC channels, 143B cells were transfected with siRNA for STIM1 or negative-control siRNA and transduced with an adenovirus expressing the calcium sensor YC2.3. The increase in cytosolic calcium during hypoxia was attenuated in cells deficient for STIM1 (Fig. 11C). Western blotting confirmed that treatment with STIM1 siRNA dramatically decreased (>90%) STIM1 protein expression (Fig. 12A).
Fig. 11.
Role of STIM1 in oxidant-induced Ca2+ responses. (A) 143B cells transfected with negative-control siRNA (n = 42) or with siRNA for STIM1 (n = 34) were loaded with Fura2-AM and treated with thapsigargin (TG) in calcium-free Ringer solution to deplete ER stores, and then 2 mM Ca2+ Ringer solution was added to enable store-operated Ca2+ influx. The graph depicts the change in the 340/380 intensity ratio over time. Values are expressed as means ± SEM. (B) 143B cells transfected with negative-control siRNA (n = 45) or with siRNA for STIM1 (n = 28) were loaded with Fura2-AM and treated with tBH in calcium-free Ringer solution, and then, 2 mM Ca2+ Ringer solution was added to examine oxidant-mediated intracellular Ca2+ responses. The graph depicts the change in the 340/380 intensity ratio over time. Values are expressed as means ± SEM. (C) The same protocol as for panel B was used to study the role of STIM1 in intracellular Ca2+ responses to hypoxia (1.5% O2). The graph depicts the change in the 340/380 intensity ratio over time. Values are expressed as means ± SEM (n = 5).
Fig. 12.
Role of STIM1 in hypoxia-induced AMPK activation. (A) 143B cells were transfected with negative-control siRNA (white bars) or siRNA for STIM1 (black bars) and exposed to hypoxia (1.5% O2) or normoxia (21% O2) for 2 h. Levels of AMPK phosphorylated at Thr-172 (p-AMPKα) and of ACC phosphorylated at Ser-79 (p-ACC) as well as total AMPKα and ACC were measured by Western blotting. Graphs depict the fold change in the p-AMPK/AMPK or p-ACC/ACC ratio. Representative Western blots are shown. Values are expressed as means ± SEM (n = 6). *, P < 0.05 compared to normoxia control; †, P < 0.05 compared to hypoxia control. (B) Control 143B cells (white bars) and 143B treated with nifedipine (black bars) were analyzed for AMPK activation during hypoxia as for panel A. Graphs depict the fold change in p-AMPK/AMPK ratios. Representative Western blots are shown. Values are expressed as means ± SEM (n = 4). *, P < 0.05 compared to normoxia control.
To determine whether STIM1 knockdown affected phosphorylation of AMPK and ACC, cell lysates from normoxic and hypoxic conditions (2 h) were analyzed by Western blotting. In cells treated with siRNA against STIM1, AMPK and ACC phosphorylation responses to hypoxia were significantly attenuated (Fig. 12A). To determine the specificity of this response for SOCE, the studies were repeated in the presence of the L-type calcium channel inhibitor nifedipine (2 μM). Nifedipine did not prevent the increase in AMPK phosphorylation in normal cells (Fig. 12B), indicating that voltage-dependent calcium channels do not contribute to the hypoxic AMPK response. These data indicate that calcium entry through CRAC channels is necessary for increased oxidant-dependent activation of AMPK in hypoxia.
Oxidant stress or intracellular calcium release or hypoxia triggers STIM1 relocation to the plasma membrane.
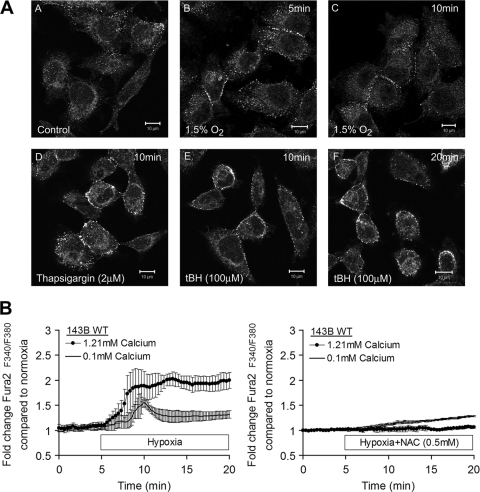
Activation of CRAC channels involves tethering of Orai proteins by STIM1 at ER junctional domains adjacent to the plasma membrane. To determine whether oxidant stress causes STIM1 redistribution to the plasma membrane, 143B cells were immunostained for STIM1 and analyzed by confocal microscopy. Under control conditions, STIM1 immunostaining was distributed diffusely throughout the cytosol (Fig. 13A, panel A). Cells treated with thapsigargin (2 μM) to induce intracellular calcium release demonstrated punctuate staining at the plasma membrane (Fig. 13A, panel D). Cells treated with the oxidant tBH demonstrated a similar pattern of membrane punctuate immunostaining at 10 and 20 min after treatment (Fig. 13A, panels E and F). Finally, brief periods of hypoxia (1.5% O2 for 5 or 10 min) induced STIM1 relocation to near the plasma membrane (Fig. 13A, panels B and C). Thus, oxidant stress or acute hypoxia is sufficient to induce STIM1 redistribution to the plasma membrane, consistent with the organization of CRAC channels.
Fig. 13.
Oxidant stress involvement in STIM1 redistribution and store-activated calcium signaling. (A) 143B cells were fixed and immunostained for STIM1 after normoxia (21% O2) (panel A), hypoxia (1.5% O2) (panels B and C), treatment with thapsigargin (panel D), and treatment with tBH (panels E and F). (B) 143B cells were loaded with Fura2-AM and imaged during hypoxia (1.5 O2) or normoxia (21% O2) in normal-Ca2+ BSS or low-calcium BSS. Graphs depict the change in the 340/380 intensity ratio over time. Values are expressed as means ± SEM (n = 3).
Hypoxia triggers intracellular calcium release in an ROS-dependent manner.
To assess the involvement of intracellular calcium release during hypoxia, 143B cells were loaded with Fura2-AM, and ratiometric images were collected during normoxic and hypoxic superperfusion with a normal (1.21 mM) or low (100 μM) level of extracellular calcium (Fig. 13B). Hypoxia triggered a rapid and sustained increase in cytosolic calcium that was abolished by NAC treatment. With low extracellular calcium concentrations, the increase in cytosolic calcium during hypoxia was transient and was attenuated by NAC treatment. Thus, hypoxia induces an ROS-dependent release of intracellular calcium, which then activates CRAC channel formation, which amplifies the calcium signal and mediates the activation of CaMKKβ, leading to AMPK phosphorylation in the absence of increases in the AMP/ATP ratio (Fig. 14).
Fig. 14.
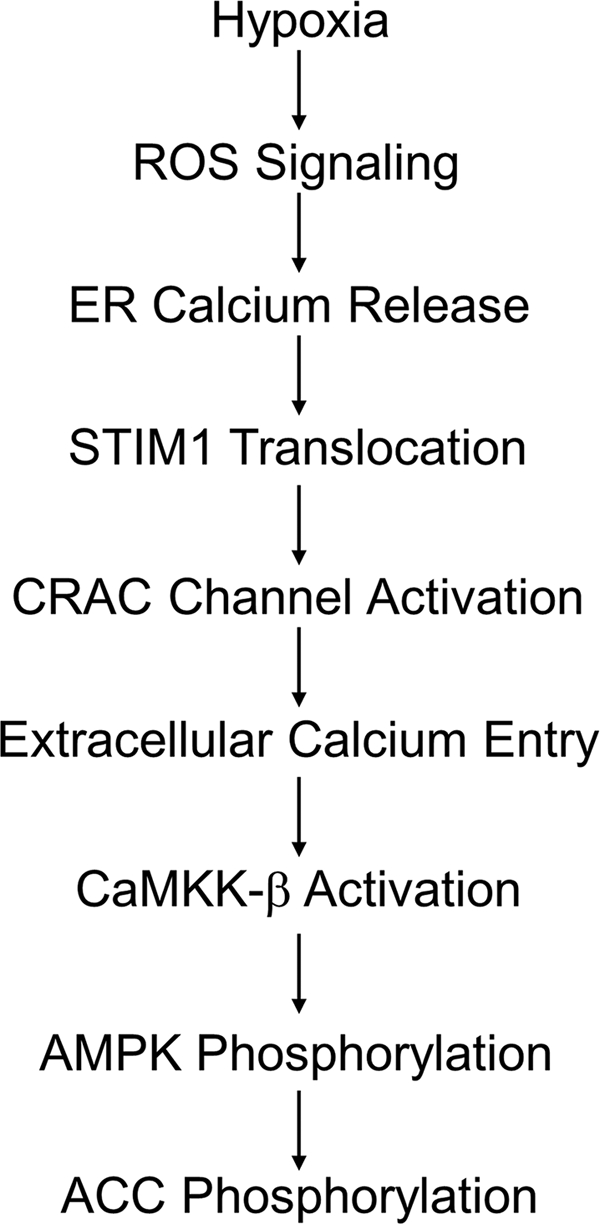
A model for ROS- and STIM1-dependent activation of AMPK in hypoxia. Oxidant signaling in hypoxia causes ER calcium release and translocation of STIM1 to ER domains near the plasma membrane. Orai proteins tethered by STIM1 form CRAC channels facilitating Ca2+ influx. Increased cytosolic Ca2+ activates CaMKKβ, which phosphorylates AMPK.
DISCUSSION
Role of AMPK as a cellular energy sensor.
Cell survival during severe hypoxia hinges on the ability to sustain ATP levels in the face of limitations in mitochondrial oxidative metabolism and availability of bioenergetic substrates. AMPK is a highly conserved signaling system that activates catabolic processes by stimulating the uptake of glucose and enhancing fatty acid oxidation, while inhibiting biosynthetic pathways (18, 19). AMPK is activated when the AMP/ATP ratio increases, so severe hypoxia would represent an important condition where increased AMPK activity is expected (30). AMPK activity can quickly inhibit protein synthesis in order to reserve energy stores during hypoxia through regulation of mTOR in a manner independent of HIF (32). Its activation increases glucose uptake via translocation of GLUT4 to the sarcolemma (43), and it stimulates glycolysis (36), thereby conferring protection against hypoxia (43).
Activation of AMPK during moderate hypoxia in anticipation of lethal hypoxia.
Activation of AMPK under moderate hypoxia that does not yet limit mitochondrial respiration could enhance its ability to protect against a more severe insult, by initiating responses that prevent the rise in the AMP/ATP ratio. Indeed, a response that protects against the consequences of energy supply deprivation would likely be more effective if it prevented the development of that condition in the first place. But how can hypoxia activate AMPK if there is no increase in the AMP/ATP ratio?
Our studies reveal that moderate hypoxia triggers low levels of ROS production in cells. These oxidant signals appear to trigger intracellular calcium release from the ER, which initiates CRAC channel organization at the plasma membrane. Extracellular calcium entry through these channels produces a rise in cytosolic calcium, activating CaMKKβ. AMPK, a downstream target of CaMKKβ, is then phosphorylated and activated without the need for an increase in the AMP/ATP ratio. This pathway could initiate protective mechanisms that require time to develop or that suppress cellular metabolic activity and the need for oxygen. Although ROS are sufficient to activate this pathway and antioxidant treatments inhibit it, we cannot exclude the possibility that non-ROS-mediated redox reactions are also involved in the signaling sequence. Further studies are needed to address this question and to determine how hypoxia might activate such events.
Our novel findings are consistent with previous studies showing that oxidizing agents trigger AMPK activation. For example, vanadate, which catalyzes ROS generation, increases AMPK phosphorylation and stabilizes HIF-1α in prostate cancer cells (26). Similarly, high concentrations of H2O2 (300 μM) trigger increases in AMPK phosphorylation (7). Administration of H2O2 also increases AMPK phosphorylation without changing [AMP] in epitrochlaeris muscle (47). Further, mitochondrial ROS have been shown to activate AMPK in an AMP-independent manner (11). Thus, oxidative stress activates AMPK, although involvement of the CRAC channels has not been reported previously.
Cellular ROS generation in response to hypoxia.
Physiological hypoxia can trigger increases in mitochondrial ROS production at complex III (10, 14, 34, 40, 49, 51), which was detected in the present study using a redox-sensitive sensor. ROS signals also trigger the stabilization of HIF-1α, which mediates the cellular transcriptional response to hypoxia (6, 15). This study extends those findings by showing that hypoxia-induced oxidants also trigger AMPK phosphorylation, which can complement the protective effects of HIF (33).
AMP/ATP ratios during severe and moderate hypoxia.
During severe hypoxia, increases in AMPK activity are triggered by changes in the AMP/ATP ratio through phosphorylation-independent and -dependent mechanisms. Interaction of AMP with the AMPK-γ subunit leads to activation through an allosteric mechanism (29). In mammalian cells AMPK is also activated by phosphorylation by the upstream kinase LKB1 (20, 53) or CaMKKβ (22, 52). Some evidence suggests that AMP binding to AMPK promotes its phosphorylation by LKB1, while other studies indicate that AMP binding inhibits dephosphorylation of the α subunit regulatory Thr-172 without affecting phosphorylation by either LKB1 or CaMKKβ (2).
Our analysis detected no decrease in ATP or increase in the AMP/ATP ratio during hypoxia. This does not dispute the importance of AMP in regulating AMPK activity. However, it does indicate that hypoxia-induced activation of AMPK can occur at O2 levels where cellular respiration is not yet limited, through a ROS signaling pathway previously shown to originate in mitochondria (15). While we cannot exclude the possibility that undetectable increases in AMP may have occurred, three separate observations support the accuracy of the model we propose (Fig. 6). First, antioxidants prevented the increase in cytosolic calcium during hypoxia and attenuated AMPK activation. Second, removal of extracellular calcium significantly decreased the AMPK response to hypoxia. Third, the knockdown of CaMKKβ virtually abolished the AMPK phosphorylation in hypoxia. In contrast, knockout or knockdown of LKB1, an important upstream kinase involved in the response to increased AMP (19), did not abolish the response. These observations support the conclusion that hypoxia-induced AMPK activation can occur through a calcium-mediated pathway without the need for increases in the AMP/ATP ratio.
Role of calcium in the ROS-dependent activation of AMPK.
Calcium is an important signaling molecule, and its transport is tightly regulated. We detected hypoxia-induced increases in [Ca2+]i using a FRET sensor (13) and with Fura2. This increase in calcium involved entry of extracellular calcium, it was important for the AMPK activation during hypoxia, and it was abrogated by antioxidant treatment. In contrast, the ROS response to hypoxia does not require calcium signaling, as calcium chelation with BAPTA did not affect the roGFP oxidation response. In nonexcitable cells, SOCE through CRAC channels is a major source of calcium influx (24). Using calcium indicators and pharmacological agents, the present study shows that 143B cells exhibit SOCE, that treatment of these cells with exogenous oxidants is sufficient to induce calcium responses similar to SOCE, and that oxidant-induced calcium responses have the pharmacological characteristics of CRAC channel activation and are attenuated in cells deficient for the ER Ca2+ sensor STIM1. In hypoxia, the oxidant-dependent increase in [Ca2+]i was attenuated in STIM1-deficient cells. In accordance with that finding, knockdown of STIM1 expression significantly decreased phosphorylation of AMPK and its downstream target, ACC, in hypoxia. Oxidant stress or acute hypoxia also triggered the accumulation of STIM1 protein near the plasma membrane, in a pattern that mirrored the response observed after depletion of ER calcium stores. However, blockade of L-type calcium channels had no effect on AMPK activity, indicating that the response was not mediated by plasma membrane depolarization. These studies suggest that CRAC channel activation is largely responsible for ROS-dependent increases in [Ca2+]i during hypoxia.
CaMKKβ represents an AMP-independent mechanism to explain the ROS-mediated activation of AMPK in hypoxia (2). Knockdown of CaMKKβ lowered both the basal levels of AMPK phosphorylation and the hypoxia-induced activation in cells lacking LKB1, while knockdown of CaMKKβ alone decreased AMPK phosphorylation in hypoxia to basal normoxic levels, underscoring the importance of that system for the hypoxic response.
Kinetics of ROS and calcium responses.
Increases in cytosolic calcium developed quickly upon transition to hypoxia, whereas the oxidation of roGFP and DCFH developed over 30 min, raising questions about whether calcium could be driving the ROS signaling. Yet the data clearly indicate that while oxidant signals are required for the hypoxia-induced calcium increase, the hypoxia-induced calcium increase is not required for roGFP oxidation. The faster calcium response compared with the roGFP response may be explained by considering that the roGFP redox status at any instant reflects a balance between the rate of thiol oxidation and the rate at which the protein is rereduced by glutaredoxin. At the start of hypoxia, a step increase in the rate of ROS production would shift this balance, but changes in the redox status of the protein might become evident only after a few minutes and continue to accumulate over time. In accordance with that explanation, cells loaded with DCFH demonstrated a progressive oxidation in response to a step increase in the concentration of peroxide in the buffer. It is conceivable that ROS released from mitochondria could locally trigger ER calcium release at nearby mitochondrion-ER junctions, facilitating release of intracellular calcium stores well before the entire pool of cytosolic roGFP reaches a new steady state. By that mechanism, early localized ROS signaling could trigger CRAC-mediated calcium entry, before the large pool of roGFP has been affected.
Relevance to intact tissues in vivo.
Our results also provide evidence of ROS-mediated activation of AMPK in lung cells of moderately hypoxic mice, in support of the idea that this mechanism functions in vivo as an activator or a protective pathway.
ACKNOWLEDGMENTS
These studies were supported by grants HL079650, HL35440, and RR025325.
Footnotes
Published ahead of print on 13 June 2011.
REFERENCES
- 1. Bardeesy N., et al. 2002. Loss of the Lkb1 tumour suppressor provokes intestinal polyposis but resistance to transformation. Nature 419:162–167 [DOI] [PubMed] [Google Scholar]
- 2. Birnbaum M. J. 2005. Activating AMP-activated protein kinase without AMP. Mol. Cell 19:289–290 [DOI] [PubMed] [Google Scholar]
- 3. Budinger G. R., et al. 1996. Cellular energy utilization and supply during hypoxia in embryonic cardiac myocytes. Am. J. Physiol. Lung Cell. Mol. Physiol. 270:L44–L53 [DOI] [PubMed] [Google Scholar]
- 4. Carling D., Sanders M. J., Woods A. 2008. The regulation of AMP-activated protein kinase by upstream kinases. Int. J. Obes. 32(Suppl. 4):S55–S59 [DOI] [PubMed] [Google Scholar]
- 5. Chandel N. S., Budinger G. R. S., Choe S. H., Schumacker P. T. 1997. Cellular respiration during hypoxia. J. Biol. Chem. 272:18808–18816 [DOI] [PubMed] [Google Scholar]
- 6. Chandel N. S., et al. 1998. Mitochondrial reactive oxygen species trigger hypoxia-induced transcription. Proc. Natl. Acad. Sci. U. S. A. 95:11715–11720 [DOI] [PMC free article] [PubMed] [Google Scholar]
- 7. Choi S.-L., et al. 2001. The regulation of AMP-activated protein kinase by H2O2. Biochem. Biophys. Res. Commun. 287:92–97 [DOI] [PubMed] [Google Scholar]
- 8. Davies S. P., Helps N. R., Cohen P. T. W., Hardie D. G. 1995. 5′-AMP inhibits dephosphorylation, as well as promoting phosphorylation, of the AMP-activated protein kinase. Studies using bacterially expressed human protein phosphatase-2C[alpha] and native bovine protein phosphatase-2Ac. FEBS Lett. 377:421–425 [DOI] [PubMed] [Google Scholar]
- 9. Dooley C. T., et al. 2004. Imaging dynamic redox changes in mammalian cells with green fluorescent protein indicators. J. Biol. Chem. 279:22284–22293 [DOI] [PubMed] [Google Scholar]
- 10. Duranteau J., Chandel N. S., Kulisz A., Shao Z., Schumacker P. T. 1998. Intracellular signaling by reactive oxygen species during hypoxia in cardiomyocytes. J. Biol. Chem. 273:11619–11624 [DOI] [PubMed] [Google Scholar]
- 11. Emerling B. M., et al. 2009. Hypoxic activation of AMPK is dependent on mitochondrial ROS but independent of an increase in AMP/ATP ratio. Free Radic. Biol. Med. 46:1386–1391 [DOI] [PMC free article] [PubMed] [Google Scholar]
- 12. Gao P., et al. 2007. HIF-dependent antitumorigenic effect of antioxidants in vivo. Cancer Cell 12:230–238 [DOI] [PMC free article] [PubMed] [Google Scholar]
- 13. Griesbeck O., Baird G. S., Campbell R. E., Zacharias D. A., Tsien R. Y. 2001. Reducing the environmental sensitivity of yellow fluorescent protein. J. Biol. Chem. 276:29188–29194 [DOI] [PubMed] [Google Scholar]
- 14. Guzy R. D., Mack M. M., Schumacker P. T. 2007. Mitochondrial complex III is required for hypoxia-induced ROS production and gene transcription in yeast. Antiox. Redox Signal. 9:1317–1328 [DOI] [PubMed] [Google Scholar]
- 15. Guzy R. D., Schumacker P. T. 2006. Oxygen sensing by mitochondria at complex III: the paradox of increased reactive oxygen species during hypoxia. Exp. Physiol. 91:807–819 [DOI] [PubMed] [Google Scholar]
- 16. Hanson G. T., et al. 2004. Investigating mitochondrial redox potential with redox-sensitive green fluorescent protein indicators. J. Biol. Chem. 279:13044–13053 [DOI] [PubMed] [Google Scholar]
- 17. Hardie D. G., Carling D. 1997. The AMP-activated protein kinase. Eur. J. Biochem. 246:259–273 [DOI] [PubMed] [Google Scholar]
- 18. Hardie D. G., Hawley S. A., Scott J. W. 2006. AMP-activated protein kinase—development of the energy sensor concept. J. Physiol. 574:7–15 [DOI] [PMC free article] [PubMed] [Google Scholar]
- 19. Hardie D. G., Sakamoto K. 2006. AMPK: a key sensor of fuel and energy status in skeletal muscle. Physiology 21:48–60 [DOI] [PubMed] [Google Scholar]
- 20. Hawley S., et al. 2003. Complexes between the LKB1 tumor suppressor, STRADalpha/beta and MO25alpha/beta are upstream kinases in the AMP-activated protein kinase cascade. J. Biol. 2:28. [DOI] [PMC free article] [PubMed] [Google Scholar]
- 21. Hawley S. A., et al. 1996. Characterization of the AMP-activated protein kinase kinase from rat liver and identification of threonine 172 as the major site at which it phosphorylates AMP-activated protein kinase. J. Biol. Chem. 271:27879–27887 [DOI] [PubMed] [Google Scholar]
- 22. Hawley S. A., et al. 2005. Calmodulin-dependent protein kinase kinase-[beta] is an alternative upstream kinase for AMP-activated protein kinase. Cell Metab. 2:9–19 [DOI] [PubMed] [Google Scholar]
- 23. Hawley S. A., et al. 1995. 5′-AMP activates the AMP-activated protein kinase cascade, and Ca/calmodulin activates the calmodulin-dependent protein kinase I cascade, via three independent mechanisms. J. Biol. Chem. 270:27186–27191 [DOI] [PubMed] [Google Scholar]
- 24. Hewavitharana T., Deng X., Soboloff J., Gill D. L. 2007. Role of STIM and Orai proteins in the store-operated calcium signaling pathway. Cell Calcium 42:173–182 [DOI] [PubMed] [Google Scholar]
- 25. Hurley R. L., et al. 2005. The Ca2+/calmodulin-dependent protein kinase kinases are AMP-activated protein kinase kinases. J. Biol. Chem. 280:29060–29066 [DOI] [PubMed] [Google Scholar]
- 26. Hwang J.-T., et al. 2004. AMP-activated protein kinase activity is required for vanadate-induced hypoxia-inducible factor 1alpha expression in DU145 cells. Carcinogenesis 25:2497–2507 [DOI] [PubMed] [Google Scholar]
- 27. Juengling E., Kammermeier H. 1980. Rapid assay of adenine nucleotides or creatine compounds in extracts of cardiac tissue by paired-ion reverse-phase high-performance liquid chromatography. Anal. Biochem. 102:358–361 [DOI] [PubMed] [Google Scholar]
- 28. Jung S.-N., et al. 2008. Reactive oxygen species stabilize hypoxia-inducible factor-1 alpha protein and stimulate transcriptional activity via AMP-activated protein kinase in DU145 human prostate cancer cells. Carcinogenesis 29:713–721 [DOI] [PubMed] [Google Scholar]
- 29. Kahn B. B., Alquier T., Carling D., Hardie D. G. 2005. AMP-activated protein kinase: ancient energy gauge provides clues to modern understanding of metabolism. Cell Metab. 1:15–25 [DOI] [PubMed] [Google Scholar]
- 30. Kudo N., Barr A. J., Barr R. L., Desai S., Lopaschuk G. D. 1995. High rates of fatty acid oxidation during reperfusion of ischemic hearts are associated with a decrease in malonyl-CoA levels due to an increase in 5′-AMP-activated protein kinase inhibition of acetyl-CoA carboxylase. J. Biol. Chem. 270:17513–17520 [DOI] [PubMed] [Google Scholar]
- 31. Laderoute K. R., et al. 2006. 5′-AMP-activated protein kinase (AMPK) is induced by low-oxygen and glucose deprivation conditions found in solid-tumor microenvironments. Mol. Cell. Biol. 26:5336–5347 [DOI] [PMC free article] [PubMed] [Google Scholar]
- 32. Liu L., et al. 2006. Hypoxia-induced energy stress regulates mRNA translation and cell growth. Mol. Cell 21:521–531 [DOI] [PMC free article] [PubMed] [Google Scholar]
- 33. Loor G., Schumacker P. T. 2008. Role of hypoxia-inducible factor in cell survival during myocardial ischemia-reperfusion. Cell Death Differ. 15:686–690 [DOI] [PubMed] [Google Scholar]
- 34. Mansfield K. D., et al. 2005. Mitochondrial dysfunction resulting from loss of cytochrome c impairs cellular oxygen sensing and hypoxic HIF-[alpha] activation. Cell Metab. 1:393–399 [DOI] [PMC free article] [PubMed] [Google Scholar]
- 35. Marshall C., Mamary A., Verhoeven A., Marshall B. 1996. Pulmonary artery NADPH-oxidase is activated in hypoxic pulmonary vasoconstriction. Am. J. Respir. Cell Mol. Biol. 15:633–644 [DOI] [PubMed] [Google Scholar]
- 36. Marsin A. S., et al. 2000. Phosphorylation and activation of heart PFK-2 by AMPK has a role in the stimulation of glycolysis during ischaemia. Curr. Biol. 10:1247–1255 [DOI] [PubMed] [Google Scholar]
- 37. Merrill G. F., Kurth E. J., Hardie D. G., Winder W. W. 1997. AICA riboside increases AMP-activated protein kinase, fatty acid oxidation, and glucose uptake in rat muscle. Am. J. Physiol. Endocrinol. Metab. 273:E1107–E1112 [DOI] [PubMed] [Google Scholar]
- 38. Prakriya M., Lewis R. S. 2001. Potentiation and inhibition of Ca2+ release-activated Ca2+ channels by 2-aminoethyldiphenyl borate (2-APB) occurs independently of IP3 receptors. J. Physiol. 536:3–19 [DOI] [PMC free article] [PubMed] [Google Scholar]
- 39. Reznick R. M., Shulman G. I. 2006. The role of AMP-activated protein kinase in mitochondrial biogenesis. J. Physiol. 574:33–39 [DOI] [PMC free article] [PubMed] [Google Scholar]
- 40. Robin E., et al. 2007. Oxidant stress during simulated ischemia primes cardiomyocytes for cell death during reperfusion. J. Biol. Chem. 282:19133–19143 [DOI] [PubMed] [Google Scholar]
- 41. Ross P. E., Cahalan M. D. 1995. Ca2+ influx pathways mediated by swelling or stores depletion in mouse thymocytes. J. Gen. Physiol. 106:415–444 [DOI] [PMC free article] [PubMed] [Google Scholar]
- 42. Russell R. R., III, Bergeron R., Shulman G. I., Young L. H. 1999. Translocation of myocardial GLUT-4 and increased glucose uptake through activation of AMPK by AICAR. Am. J. Physiol. Heart Circ. Physiol. 277:H643–H649 [DOI] [PubMed] [Google Scholar]
- 43. Russell R. R., et al. 2004. AMP-activated protein kinase mediates ischemic glucose uptake and prevents postischemic cardiac dysfunction, apoptosis, and injury. J. Clin. Invest. 114:495–503 [DOI] [PMC free article] [PubMed] [Google Scholar]
- 44. Shaw R. J., et al. 2004. The tumor suppressor LKB1 kinase directly activates AMP-activated kinase and regulates apoptosis in response to energy stress. Proc. Natl. Acad. Sci. U. S. A. 101:3329–3335 [DOI] [PMC free article] [PubMed] [Google Scholar]
- 45. Sun J. Z., et al. 1996. Evidence for an essential role of reactive oxygen species in the genesis of late preconditioning against myocardial stunning in conscious pigs. J. Clin. Invest. 97:562–576 [DOI] [PMC free article] [PubMed] [Google Scholar]
- 46. Thastrup O., et al. 1994. Thapsigargin, a novel molecular probe for studying intracellular calcium release and storage. Inflamm. Res. 43:187–193 [DOI] [PubMed] [Google Scholar]
- 47. Toyoda T., et al. 2004. Possible involvement of the alpha1 isoform of 5′AMP-activated protein kinase in oxidative stress-stimulated glucose transport in skeletal muscle. Am. J. Physiol. Endocrinol. Metab. 287:E166–E173 [DOI] [PubMed] [Google Scholar]
- 48. Vanden Hoek T., Becker L. B., Shao Z. H., Li C. Q., Schumacker P. T. 2000. Preconditioning in cardiomyocytes protects by attenuating oxidant stress at reperfusion. Circ. Res. 86:541–548 [DOI] [PubMed] [Google Scholar]
- 49. Vanden Hoek T. L., Li C., Shao Z., Schumacker P. T., Becker L. B. 1997. Significant levels of oxidants are generated by isolated cardiomyocytes during ischemia prior to reperfusion. J. Mol. Cell Cardiol. 29:2571–2583 [DOI] [PubMed] [Google Scholar]
- 50. Waypa G. B., Chandel N. S., Schumacker P. T. 2001. Model for hypoxic pulmonary vasoconstriction involving mitochondrial oxygen sensing. Circ. Res. 88:1259–1266 [DOI] [PubMed] [Google Scholar]
- 51. Waypa G. B., et al. 2006. Increases in mitochondrial reactive oxygen species trigger hypoxia-induced calcium responses in pulmonary artery smooth muscle cells. Circ. Res. 99:970–978 [DOI] [PubMed] [Google Scholar]
- 52. Woods A., et al. 2005. Ca2+/calmodulin-dependent protein kinase kinase-[beta] acts upstream of AMP-activated protein kinase in mammalian cells. Cell Metab. 2:21–33 [DOI] [PubMed] [Google Scholar]
- 53. Woods A., et al. 2003. LKB1 is the upstream kinase in the AMP-activated protein kinase cascade. Curr. Biol. 13:2004–2008 [DOI] [PubMed] [Google Scholar]
- 54. Zitt C., et al. 2004. Potent inhibition of Ca2+ release-activated Ca2+ channels and T-lymphocyte activation by the pyrazole derivative BTP2. J. Biol. Chem. 279:12427–12437 [DOI] [PubMed] [Google Scholar]


