Abstract
We have identified novel nuclear transcripts in the human β-globin locus using nuclear run-on analysis in erythroid cell lines and in situ hybridization analysis of erythroid tissue. These transcripts extend across the LCR and intergenic regions but are undetectable in nonerythroid cells. Surprisingly, transient transfection of a β-globin gene (ε, γ, or β) induces transcription of the LCR and intergenic regions from the chromosomal β-globin locus in nonerythroid cell lines. The β-globin genes themselves, however, remain transcriptionally silent. Induction is dependent on transcription of the globin gene in the transfected plasmid but does not require protein expression. Using in situ hybridization analysis, we show that the plasmid colocalizes with the endogenous β-globin locus providing insight into the mechanism of transinduction.
Keywords: Human β-globin locus, transcription, transinduction, locus control region
The extent of transcription by RNA polymerase II (PolII) throughout an entire gene locus in higher eukaryotes has rarely been studied. As mature transcripts are generally mapped by cDNA cloning, the extent of most primary transcription units is unknown. Nuclear run-on (NRO) analysis, which measures polymerase density, has generally been applied only to single genes and their immediate flanking regions (Hagenbuchle et al. 1984; Ashfield et al. 1991; Enriquez-Harris et al. 1991). Therefore, transcription of complete intergenic regions in gene loci has not been investigated.
In contrast, transcription of rRNA genes by Pol I has been widely investigated. In higher eukaryotes, the rRNA genes are arranged in tandem arrays. Transcription of the rRNA genes terminates at a specific region downstream of the mature end of the 28S rRNA. Additional promoters, however, are located downstream of this termination site in the spacer between the rDNA gene repeats. Transcription initiates at spacer promoters, reads through the spacer DNA, and terminates upstream of the next Pol I promoter. The role of these unstable spacer transcripts is unknown (for review, see Reeder 1992).
Expression of a number of genes is regulated by a locus control region (LCR), an element that exerts a dominant transcriptional activation function over a chromatin domain (Wolffe 1995). Some LCRs are directly transcribed by Pol II because of their location in gene introns, and these include HS-40, the LCR-like element in the α-globin cluster (Vyas et al. 1992), the human growth hormone LCR (Bennani-Baiti et al. 1995), and the human adenosine deaminase LCR (Aronow et al. 1989).
The human β-globin locus extends over 70 kb of DNA and contains an LCR and five erythroid-specific genes, ε-Gγ-Aγ-δ-β, arranged in the order of their developmental expression (for review, see Orkin 1995). The β-globin LCR contains five erythroid-specific, developmentally stable hypersensitive sites, HS1–HS5, situated upstream of the ε-globin gene (Grosveld et al. 1987; Zafarana et al. 1996). Transcription has been detected both in a microlocus fragment containing HS1–HS4 linked together and in HS2 as part of a chimeric construct, raising the possibility that the β-globin LCR is transcribed (Collis et al. 1990; Tuan et al. 1992). In addition, the existence of large transcripts from the avian and murine β-globin clusters, up to seven times longer than the globin mRNAs, was described over two decades ago (Imaizumi et al. 1973; Bastos and Aviv 1977). Although the human β-globin cluster represents one of the best characterized gene loci in eukaryotes, the extent of transcription throughout the locus has not been directly investigated. The sites of transcription termination of these globin genes have not been mapped.
In this study we describe the analysis of nascent transcription across the human β-globin gene cluster. Both NRO analysis in erythroid cell lines and primary transcript in situ hybridization of transgenic mouse fetal liver cells identify transcription of the LCR and the intergenic regions in the β-globin locus. Analysis of transcription of the β-globin genes by transfection into nonerythroid cell lines reveals the surprising observation that intergenic transcription is induced from the chromosomal β-globin locus in these cells. Insight into the mechanism of transinduction comes from in situ hybridization analysis of tranfected HeLa cells, which reveals that an inducing plasmid colocalizes with the chromosomal β-globin locus.
Results
NRO analysis of the ε-globin gene
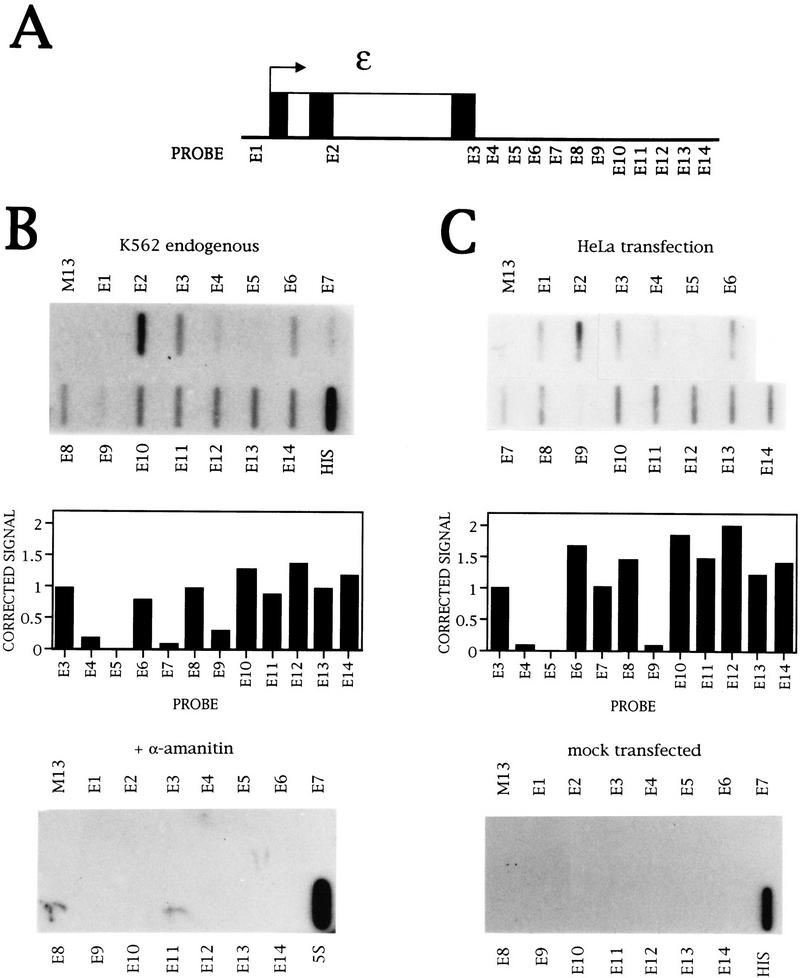
To analyze transcription of the ε-globin gene, single-stranded DNA (ssDNA) M13 probes with inserts of ∼250bp were made and the position of these probes relative to the ε gene is shown in Figure 1A. E1 is situated before the promoter; E2 and E3 are within the gene. Probe E3 corresponds to the region of the ε-globin poly(A) site, and probes E3–E14 are contiguous in the 3′-flanking region.
Figure 1.
Transcription of the ε-globin gene. (A) Diagram of the ε-globin gene, with the exons (▪), introns (□), and position of the NRO probes marked. (B) NRO analysis of ε-globin transcription in K562 cells in the presence and absence of α-amanitin. The probes used are indicated above and below the filters, and M13 ssDNA serves as a background hybridization control. The probe HIS contains histone DNA and is a positive control for Pol II transcription, whereas the 5S probe contains 5S rDNA and measures Pol III transcription. The signals obtained from the NRO performed in the absence of α-amanitin were corrected for background hybridization and the number of U residues (see Materials and Methods), and plotted on the graph. (C) NRO analysis of ε-globin transcription in HeLa cells following transient transfection of the plasmid εSV−. The corrected signals of the flanking region probes are shown graphically. The control filter shows the NRO result from mock transfected cells.
Endogenous transcription of the ε gene was investigated in the human erythroleukemic cell line K562 (Lozzio and Lozzio 1975), and the NRO data obtained are shown in Figure 1B. There is no signal before the transcription start site (probe E1), but signals are detected within the gene and in the 3′ flanking region. Pretreatment of the nuclei with a low concentration of α-amanitin abolishes all signals except for the control 5S probe that detects Pol III transcription of 5S rRNA genes. Thus, the ε probe signals are caused by Pol II transcription. The signals in the 3′-flanking region have been corrected for the background level of hybridization and number of U residues in the transcripts; these values are shown graphically in Figure 1B. There is a drop to the background level from probes E3 to E5, which may be attributable to transcription termination downstream of the poly(A) site. However, this is followed by an uneven pattern of transcription over probes E6–E9 and substantial transcription over E10–E14.
Two possibilities exist to explain this NRO profile. The first is that transcription terminates between E3 and E5 and there is another transcription unit downstream from E10–E14. The pattern of transcription from E6 to E9 could reflect pause sites involved in transcription termination or initiation events that are nonprocessive. Alternatively, this transcription pattern could relate solely to ε-globin transcription, but different speeds of Pol II through the flanking region could influence the polymerase density and, therefore, the NRO signal.
As manipulation of the ε sequence could discriminate between these possibilities, the ε-globin gene was transiently transfected into the nonerythroid epithelial HeLa cell line that does not transcribe ε-globin endogenously. The NRO result from mock-transfected cells confirms that there is no cross hybridization of endogenous HeLa cell transcripts to the ε NRO probes, whereas the histone signal is a positive control for cellular transcription (Fig. 1C). The ε gene was transfected on a plasmid containing the SV40 enhancer that is required for transcription from the globin promoter in HeLa cells (Treisman et al. 1983). The overall transcription pattern of ε in HeLa cells (Fig. 1C) is similar to that in K562 cells, with the greatest difference over probe E7. Also, a signal is seen here over probe E1 upstream of the ε promoter, and this may be the result of the transcription observed over E14 reading round the plasmid into the promoter region.
Thus, in both K562 cells and transiently transfected HeLa cells, there is a decrease in polymerase density after the ε poly(A) site, followed by a higher polymerase density downstream in the 3′-flanking region. As similar ε transcription patterns are observed in HeLa and K562 cells, transient transfection of manipulated ε sequences can be performed to allow dissection of the NRO profile.
NRO analysis across the LCR
The observation that there is no signal over probe E1, upstream of the ε promoter, in K562 cells is interesting because there are reports of multiple upstream transcription start sites for ε in this cell line (Allan et al. 1983). Also, it is possible that the LCR is transcribed as microlocus and HS2 transcription have been detected in constructs integrated into erythroid cells (Collis et al. 1990; Tuan et al. 1992). We have therefore investigated transcription upstream of the ε gene using NRO probes with ∼500-bp inserts from the LCR, as shown in Figure 2A. Probes L1, L3, L5, and L7 contain the core regions of HS4, HS3, HS2, and HS1, respectively (Philipsen et al. 1990; Caterina et al. 1991; Lowrey et al. 1992). Probes L2, L4, and L6 lie between the hypersensitive sites, and probes L8–L12 lie between HS1 and ε.
Figure 2.
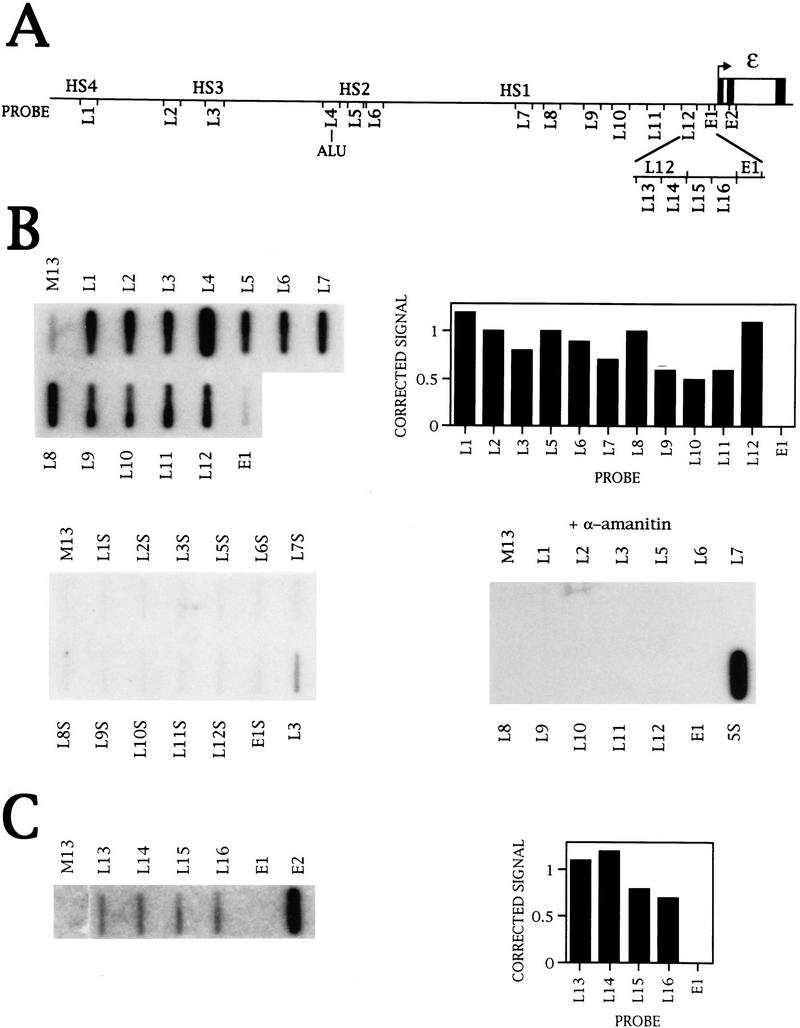
Transcription of the LCR in K562 cells. (A) Diagram of the NRO probes used to detect transcription upstream of the ε-globin gene. The probes shown detect transcription in the direction of the ε-globin gene whereas the equivalent sense probes, denoted by the suffix S, detect antisense transcription in the opposite direction. (B) NRO analysis of LCR transcription in K562 cells in the absence and presence of α-amanitin. The corrected signals from the NRO performed in the absence of α-amanitin are shown graphically, with the exception of probe L4 that contains an Alu repeat. Analysis of transcription by use of sense probes is also shown. (C) NRO analysis of transcription in the 5′-flanking region of the ε-globin gene. The NRO data obtained from K562 cells by use of the shorter LCR probes, L13–L16, are shown with a graph of the corrected signals. The filter has been spliced to remove irrelevant probes.
The NRO data obtained from K562 cells (Fig. 2B) reveal that every probe has a signal above the M13 background. The signal for probe L4 is high relative to the signals for the other LCR probes as the DNA in probe L4 contains an Alu repeat that hybridizes Pol III transcripts from Alu repeats transcribed elsewhere in the genome. The graph of the corrected signals for the remaining probes shows that transcription is relatively even across the LCR and there is a decrease in polymerase density to a background level upstream of the ε promoter. Pretreatment with a low concentration of α-amanitin abolishes the signals, indicating that the LCR is transcribed by Pol II. Transcription was also analyzed on the other DNA strand away from the ε-globin gene with sense NRO probes (denoted by the suffix S) (Fig. 2B). No signals were detected with these probes, indicating that LCR transcription is predominantly in the same direction as ε-globin transcription. In addition, no signals were obtained from NRO analysis of LCR transcription in HeLa cells (Fig. 7A, below; data not shown), suggesting that transcription of the LCR is erythroid specific.
Figure 7.
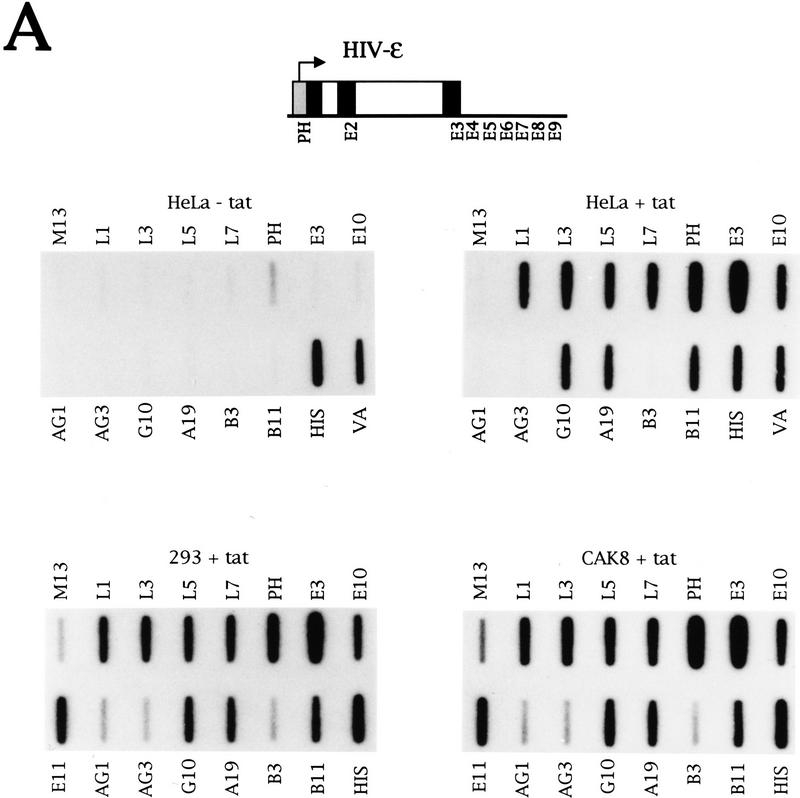
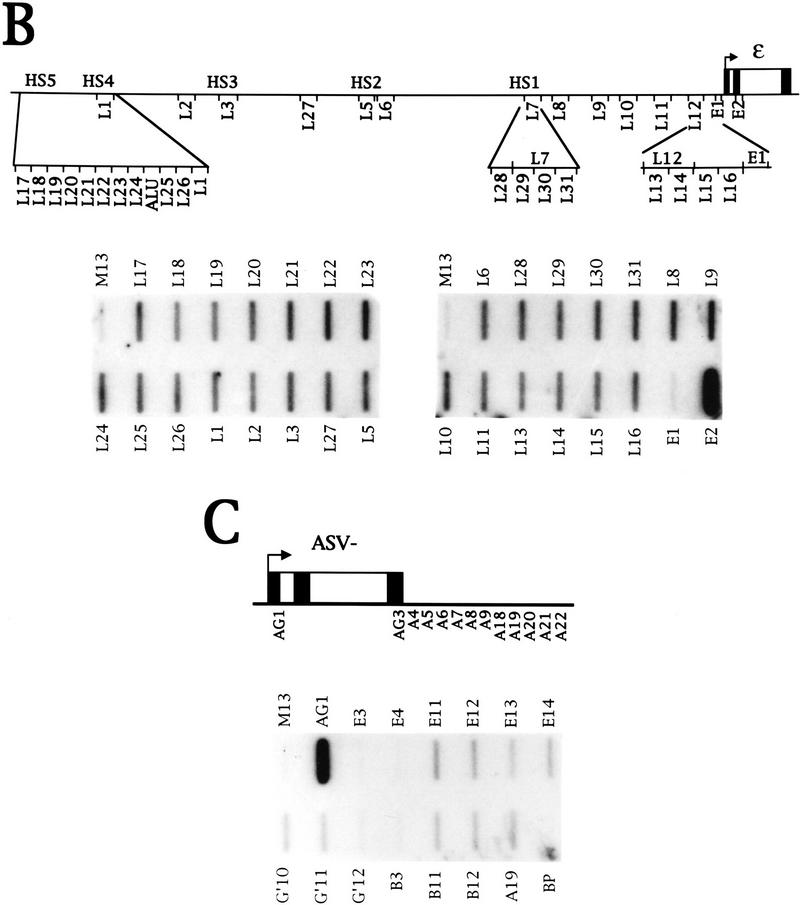
Transient transfection of a β-globin gene induces all intergenic transcripts. (A) NRO analysis of transcription from the β-globin locus in the nonerythroid cell lines HeLa, 293, and CAK8. These cell lines were transiently transfected with a plasmid containing the ε-globin gene fused to the HIV promoter. A diagram of this construct is shown with the HIV promoter drawn as a shaded box. The HIV-ε plasmid was transfected alone (− tat) or with a Tat-producing plasmid (+ tat). The positions of the probes used relative to the ε, γ, and β genes are shown in previous figures. (B) NRO analysis of LCR transcription in HeLa cells transiently with HIV-ε and a Tat-producing plasmid. The positions of the probes are shown on a diagram of the DNA upstream of ε globin and the NRO data for these probes are shown below. (C) NRO analysis of chromosomal β-globin locus transcription in HeLa cells transiently transfected with ASV−.
To investigate the reduction in signal over the ε promoter region in more detail, the region between L12 and E1 was divided into shorter NRO probes, as indicated in Figure 2A. NRO analysis with these probes (Fig. 2C) reveals that the four contiguous probes 5′ of E1 have a signal that decreases to the background level over probe E1. Probe E1 can hybridize RNA as shown by the NRO data from transient transfection of the ε gene into HeLa cells (Fig. 1C). Thus, it appears that there is a decrease in polymerase density in a region within 400 bp of the ε transcription start site. Furthermore, the relative levels of LCR and ε-globin transcription can be deduced from this NRO data. Correction of the ε and LCR signals suggests that transcription of ε is ∼10-fold higher than that of the LCR.
NRO analysis of the γ-globin genes
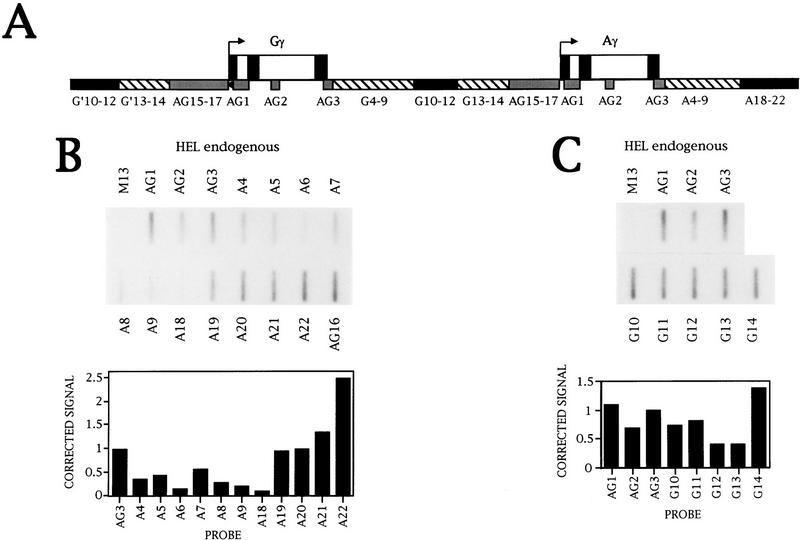
The ε and LCR NRO analysis results reveal that there is extensive transcription both 5′ and 3′ of the ε-globin gene. To investigate whether the DNA surrounding the γ genes is also transcribed, the NRO probes shown in Figure 3A were made. Transcription of the γ genes was analyzed in the human erythroleukemic cell line HEL (Martin and Papayannopoulou 1982). However, this analysis is complicated by the extensive γ gene sequence homology caused by gene duplication of this region of the β-globin cluster (Shen et al. 1981). Probes AG15–AG17 and AG1–AG3 hybridize transcripts from both γ genes. Probes A4–A9 and G4–G9 contain equivalent fragments of Aγ and Gγ DNA, respectively, and weakly cross-hybridize transcripts from the other γ gene (data not shown). Transcription can be studied most clearly in the areas covered by probes G10–G12 and A18–A22, which are specific to the flanking regions of Gγ and Aγ, respectively. Finally, probes G13 and G14 are duplicated upstream of Gγ.
Figure 3.
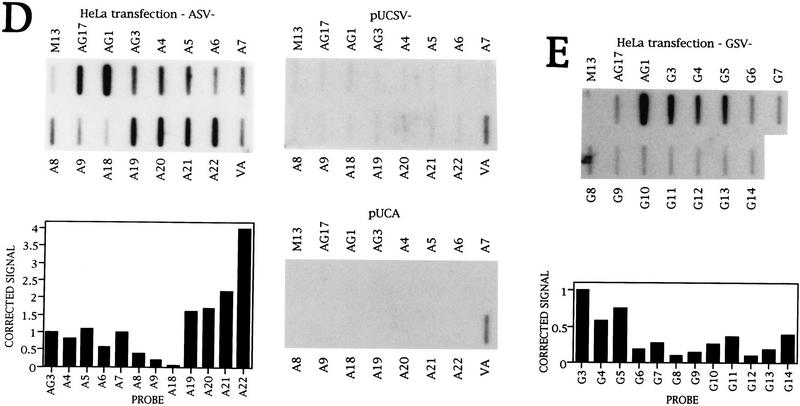
Transcription of the γ-globin gene. (A) Diagram of the NRO probes used to detect γ-globin transcription. Probes with the prefix AG (shaded boxes) contain DNA that hybridizes transcripts from both γ genes to the same extent. Probes shown as solid boxes hybridize transcripts from one γ gene only. The probes indicated by hatched boxes contain equivalent fragments of DNA from each γ gene and there is some cross hybridization to these probes. (B) NRO analysis of transcription of the Aγ gene in HEL cells with the corrected signals shown graphically. (C) NRO analysis of Gγ 3′-flanking region transcription in HEL cells with a graph of the corrected signals. (D) NRO analysis of Aγ transcription following transient transfection of ASV− into HeLa cells. A graph of the corrected signals is shown for the flanking region probes. The NRO results from HeLa cells transiently transfected with pUCA (the test plasmid without the SV40 enhancer) and pUCSV− (the test plasmid without the γ gene) are also shown. In these three transfections, a plasmid containing the adenovirus VAI gene was cotransfected and transcription of this plasmid is detected by the VA probe. (E) NRO analysis of Gγ transcription in HeLa cells transiently transfected with the plasmid GSV− with a graph of the corrected signals.
Analysis of Aγ transcription in HEL calls reveals that transcription decreases in the Aγ-flanking region and then increases again over probes A19–A22, which are specific for Aγ transcription (Fig. 3B). All signals are sensitive to a low concentration of α-amanitin (data not shown). As the signal over AG3 has an approximately equal contribution from Gγ transcripts, transcription of the region equivalent to NRO probes A19–A22 appears higher than the level of Aγ genic transcription. There is also substantial transcription before the γ promoters as detected by the probe AG16.
Transcription in the Gγ-flanking region, corresponding to the area of the Aγ-flanking region that is highly transcribed, was also analyzed in HEL cells (Fig. 3C). Probes G10–G14 have signals in the same range as those for AG1–AG3. Thus, as observed for Aγ, there is substantial transcription in the Gγ 3′-flanking region. Sensitivity to α-amanitin shows that all of these signals are attributable to Pol II transcription (data not shown).
Thus, the pattern of transcription of the γ genes is similar to that of the ε gene in that there is a drop in signal after the poly(A) site, followed by higher levels of transcription downstream. As the pattern of ε transcription is reproduced following transient transfection of the ε-globin gene into HeLa cells, this same approach was taken with the γ genes to set up a system amenable to sequence manipulation. This also has the advantage that transcription of these two highly homologous γ genes can be studied independently of each other.
NRO analysis of Aγ transiently transfected into HeLa cells on a plasmid containing the SV40 enhancer (ASV−) reveals a pattern very similar to that observed with HEL cells (Fig. 3D). In HeLa cells, the signal for probe AG1 is sixfold higher than that of probe AG3, although the reason for this is unknown. Also, there is an approximately twofold drop in signal from AG3–A4 in HEL cells, but not in HeLa cells, and this is because AG3 hybridizes both Gγ and Aγ transcripts in HEL cells. No signals above background were obtained for the γ probes on transfection of the test plasmid without either the SV40 enhancer (pUCA) or the Aγ gene (pUCSV−). This indicates that there is no cross hybridization of HeLa endogenous transcripts to the NRO probes used to detect Aγ transcription. In these experiments, the VA probe, which detects transcription of a cotransfected plasmid containing the adenoviral VAI gene, serves as a positive control for the transfection procedure.
Analysis of Gγ transcription in HeLa cells (Fig. 3E) shows a similar pattern of transcription over probes G10–G14 to that seen in HEL cells. Here, probes G4–G9 are used to investigate the complete transcription pattern in the Gγ-flanking region. NRO analysis of HeLa cells transfected with pUCSV−, the test plasmid without the Gγ gene, fails to detect any signals above background (data not shown), consistent with the NRO probes being specific for the γ genes.
In summary, transcription of the LCR, ε-, and γ-globin genes has been investigated in erythroid cell lines by NRO analysis. The LCR is transcribed, and this transcription appears to terminate within 400 bp of the ε-globin start site. In addition, there are high levels of transcription in the ε, Gγ, and Aγ 3′-flanking regions. Furthermore, the transcription patterns of these genes has been reproduced following their transient transfection into HeLa cells.
Detection of LCR and intergenic transcription in erythroid tissue
As the identification of LCR and intergenic transcripts described relied on NRO analysis of erythroid cell lines, we used a different technique and tested whether these transcripts are present in erythroid tissue. To this end, transcription was investigated in 13.5 day fetal liver cells from a transgenic mouse heterozygous for a single copy of the entire human β-globin locus (Strouboulis et al. 1992). At this stage in development, ∼20% of loci transcribe the human γ genes and the remaining 80% transcribe the β gene (Wijgerde et al. 1996).
Double-label primary transcript in situ hybridization was performed with gene-specific intron probes (Wijgerde et al. 1995) and a probe specific to either the human LCR or Gγ-globin 3′-flanking region (equivalent to NRO probes G10–G14). In addition, the δ-β-intergenic region and β 3′-flanking region (equivalent to NRO probes B11 and B12; see below) were investigated for transcriptional activity (Fig. 4a,d–f). Erythroid cells contain single transcription foci for the human globin gene as expected for heterozygous transgenics with a single human β-globin locus. The intergenic probe signals colocalize with the genic signals, showing that the intergenic probes specifically detect transcription in the human β-globin locus. We have also detected transcription of the mouse LCR in conjunction with an intronic mouse β-major probe (Fig. 4b). Here, two separate loci are detected in erythroid cells with a pair of colocalizing signals corresponding to transcription of the murine β-major globin gene and the LCR in each chromosome. The fate of the transcripts can also be analyzed by use of in situ hybridization. Figure 4c shows the result obtained in erythroid cells with a 16-kb mouse LCR probe and both exonic and intronic mouse β-major probes. Here, in addition to the colocalizing signals in the nucleus, mouse β-major mRNA is detected in the cytoplasm, which appears as a ring around the nucleus, whereas the mouse LCR transcript is absent. Thus, the mouse LCR transcript is nuclear and the absence of the other intergenic transcripts in the cytoplasm suggests that they are nuclear also.
Figure 4.
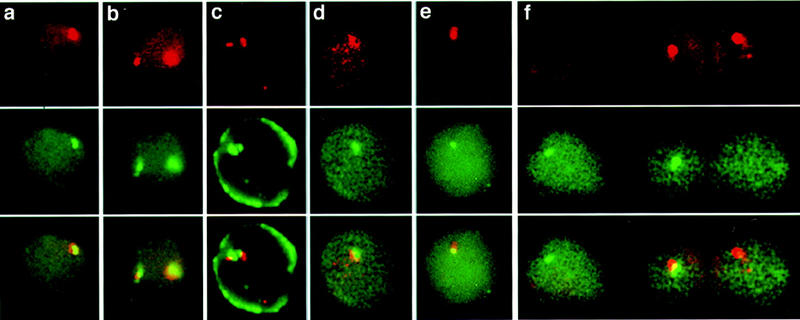
Erythroid tissue primary transcript in situ hybridization. Transgenic mouse fetal liver cells (13.5 day) containing a single copy of the human β-globin locus were hybridized with gene-specific intron oligonucleotides and intergenic transcript probes as follows: (a) human β intron (red), human LCR (green), (b) mouse LCR (red), mouse β-major intron (green), (c) mouse LCR (red), mouse β-major intron and exon (green), (d) human γ 3′ (red), human γ intron (green), (e) human β intron (red), human δ 3′ (green), (f) human β 3′ (red), human β intron (green). Separate red and green images are shown as well as an overlay of the two in the bottom panel.
Only a proportion of erythroid cells, 20%–30%, transcribe the LCR and intergenic regions. Quantitation of cells with genic and/or intergenic foci in fetal liver preparations probed with β-globin intronic probes and an intergenic probe shows that most cells (73%) have only genic transcripts, similar to the left hand cell shown in Figure 4f, which is transcribing only the β gene with no intergenic transcript present. A minority of cells (3%), such as that in Figure 4f (right), have a β 3′-flanking region signal only and no β gene transcription signal. As mentioned previously, 20% of the human globin loci in transgenic erythroid fetal liver cells at this stage of development are transcribing the γ genes only (Wijgerde et al. 1996). These results, therefore, confirm that the LCR and intergenic regions are transcribed in erythroid tissue in both the human and mouse β-globin loci. Furthermore, as the genic and intergenic transcripts can be detected independently, the intergenic transcripts appear to be distinct from the globin gene primary transcripts.
Transinduction of intergenic transcription from the HeLa cell chromosome
As transient transfection of the ε- or γ-globin genes into HeLa cells generates similar transcription patterns to those observed in erythroid cells, deletion analysis was used to further investigate the intergenic transcripts. In the course of these experiments, one type of deletion was found to give a surprising result.
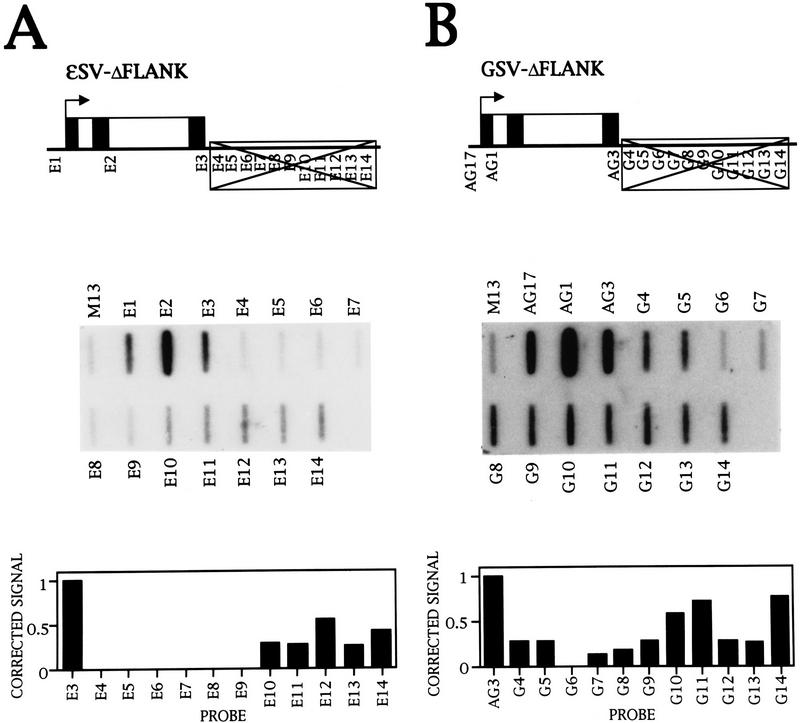
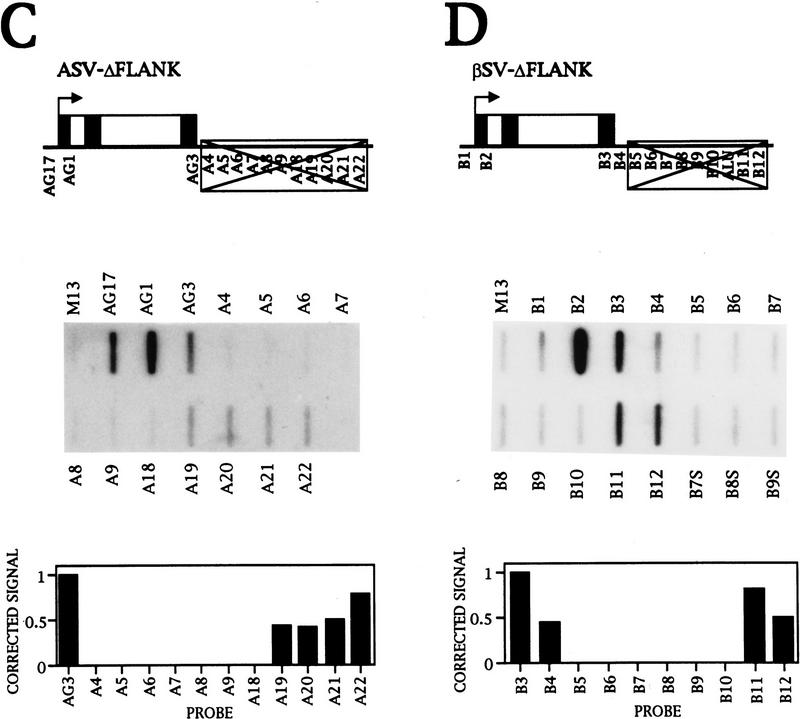
ε, Gγ, and Aγ constructs with the 3′-flanking region downstream of the poly(A) site deleted were transiently transfected into HeLa cells, and the NRO data are shown in Figures 5A–C. Surprisingly, transcription of the parts of the flanking regions found to be highly transcribed in erythroid cell lines is still detected, even though the flanking region DNA is absent from the transfected constructs.
Figure 5.
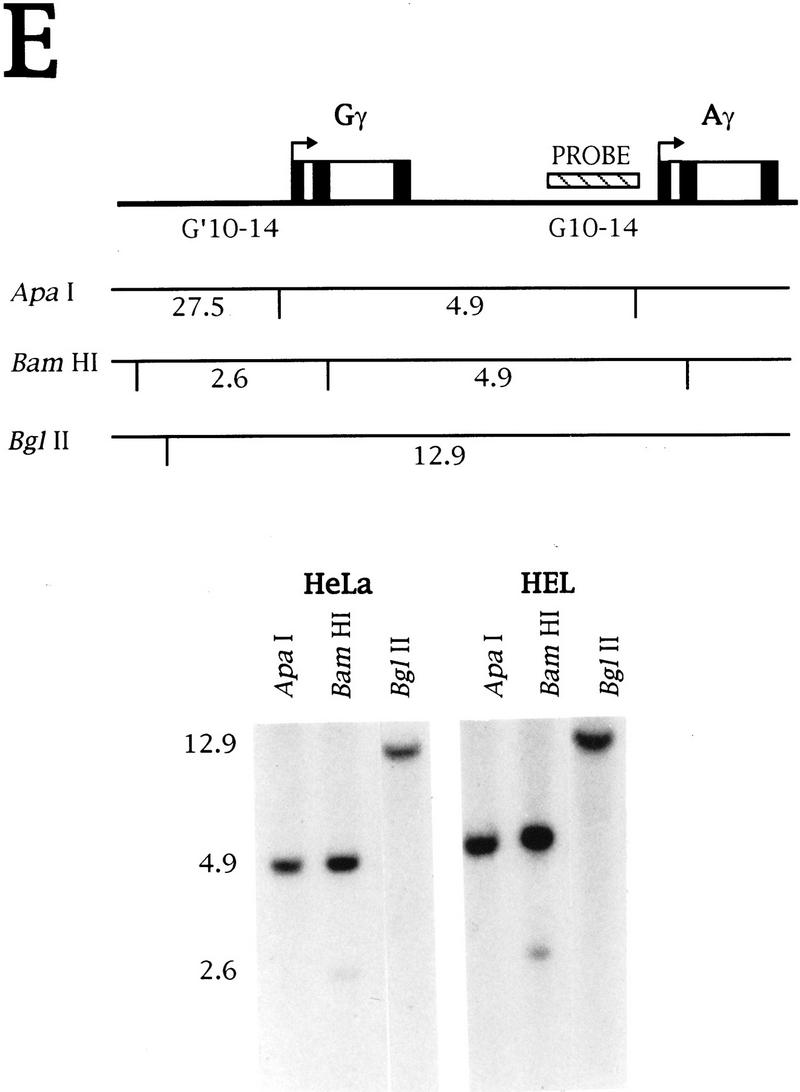
Transinduction of transcription from the HeLa cell chromosome. (A) NRO analysis of HeLa cells transiently transfected with εSV-ΔFLANK, a plasmid that has the ε 3′-flanking region deleted, as indicated by the crossed-out box. The corrected signals are shown graphically. (B–D) As in A, but the NRO data are from transient transfection of the plasmids GSV–ΔFLANK, ASV–ΔFLANK, and βSV–ΔFLANK, respectively. (D) The position of an Alu repeat in the flanking region of the β gene is marked, and the DNA containing the Alu repeat is not used as a probe. (E) Southern blot analysis of HeLa and HEL DNA. The DNA probe used is equivalent to the NRO probes G10–G14 from the Gγ-flanking region and the position of the probe relative to the two γ genes is indicated on the diagram. This probe has weak homology to the sequences upstream of Gγ because of the γ gene duplication. The fragments predicted by digestion with ApaI, BamHI, and BglII are shown below the diagram. The Southern blot of HeLa and HEL DNA digested with these enzymes is shown with the sizes of the fragments.
As NRO signals are not detected from these flanking regions in mock-transfected HeLa cells or cells transfected with derivatives of the test plasmids (Figs. 1C and 3D), it follows that the flanking region signals observed (Fig. 5) cannot be caused by cross hybridization of unrelated transcripts. This has been confirmed for the Gγ-flanking region by Southern blot analysis of HeLa and HEL DNA with a probe corresponding to the region of DNA from G10–G14 (Fig. 5E). As a result of the γ gene duplication, this region has weak homology to the DNA upstream of Gγ, and this is seen as a weaker band in the Southern (2.6-kb BamHI fragment). However, all of the bands are predicted from the γ sequences indicating that the NRO probes contain sequences unique to the β-globin locus.
Thus, the signals in the ε- and γ-flanking regions must be the result of transcription of the β-globin locus in the HeLa cell chromosome. Furthermore, transient transfection of a plasmid containing a globin gene is necessary to induce transcription from the HeLa cell chromosome. We refer to this phenomenon as transinduction.
The level of intergenic transcription detected when a construct with the flanking region deleted is transfected is generally lower than that seen with a full-length construct, although the levels of transcription from the flanking regions are variable (data not shown). This is consistent with flanking region transcription from both the plasmid and chromosomal sequences following transfection of the full length constructs, but only from the chromosome when the deleted constructs are transfected.
NRO analysis of transcription of the β-globin gene transiently transfected into HeLa cells results in a similar transcription trend to ε and γ transcription. There is a decrease in signal after the poly(A) site followed by higher signals in the downstream 3′-flanking region (data not shown) where a separate transcription unit was detected by in situ hybridization (Fig. 4f). Therefore, the β gene with its 3′-flanking region deleted was transfected into HeLa cells to analyze whether transcription is also induced downstream of the β gene from the chromosomal β-globin locus. The result in Figure 5D shows that there is transinduction of the β-gene 3′-flanking region. Again, these signals are caused by Pol II transcription as they are sensitive to a low concentration of α-amanitin (data not shown). In addition, no antisense transcription in a direction toward the Aγ gene is detected with sense probes (Fig. 5D; data not shown).
Transinduction does not require protein expression
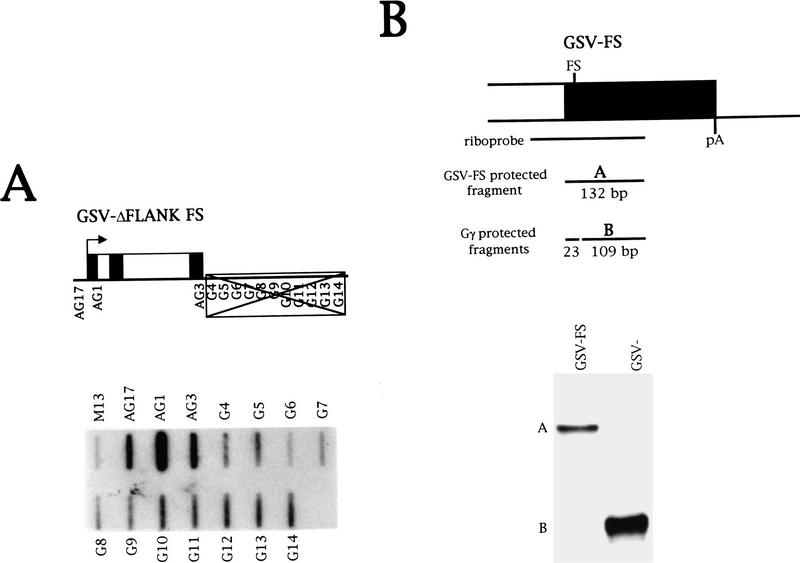
To investigate the requirements for transinduction, the protein product of the transfected globin gene was mutated. Specifically, a frameshift mutation was made in the third exon of the Gγ-globin gene by filling in a restriction site. This mutant clone is still able to induce transcription, as shown in Figure 6A. In addition, a different frameshift mutation in the second exon and mutation of the AUG does not affect induction of chromosomal intergenic transcripts (data not shown), indicating that the effect is not mediated at the protein level.
Figure 6.
Further investigation of transinduction. (A) This figure shows the NRO data from HeLa cells transiently transfected with the plasmid GSV–ΔFLANK FS that contains a frameshift mutation in the third exon of the Gγ gene. (B) RNase protection analysis of Gγ transcription in HeLa cells. The riboprobe incorporates the frameshift mutation tested in A and the position of the riboprobe relative to the Gγ gene is indicated. The sizes of the probe fragments protected by the wild-type and mutant Gγ mRNAs are indicated below the diagram. The data show an RNase protection analysis of cytoplasmic RNA isolated from HeLa cells transiently transfected with GSV–FS and GSV−. Specific fragments detected with the riboprobe are labeled A (frameshift) and B (wild-type).
γ-Globin gene transcription is not induced from the HeLa chromosome
Transcription in the Gγ-flanking region from the HeLa chromosome is observed directly downstream of the poly(A) site (Fig. 5B), in contrast to the other flanking regions in which there is ∼2 kb of DNA between the poly(A) site and sites of downstream transcription. This raises the possibility that transcription of the chromosomal Gγ gene is induced in HeLa cells. To test this, the Gγ gene bearing the frameshift mutation was transfected into HeLa cells. This generates the same pattern of flanking region transcription from the chromosome but allows transcription from the transfected and chromosomal copies of the Gγ gene to be distinguished at the steady-state level. RNase protection analysis was used to differentiate between transcription of the transfected, mutant Gγ gene and the chromosomal Gγ gene with a riboprobe that incorporates the frameshift mutation (Fig. 6B). As a control, wild-type Gγ was transfected to show that there is 100% cleavage at the mismatch. On transfection of the mutant Gγ gene, however, only a protected fragment corresponding to the transfected gene is detected, showing that transcription of Gγ is not induced at detectable levels in HeLa cells.
Thus, γ intergenic, but not genic, transcripts are induced from the chromosomal β-globin locus, indicating that the γ intergenic transcripts are distinct from the γ gene primary transcripts. Induction of transcription ∼2 kb into the 3′-flanking regions of the ε, Aγ, and β genes (Fig. 5), but not immediately downstream of the poly(A) site, is also consistent with the intergenic transcripts being separate transcription units. This conclusion is supported by the erythroid tissue in situ data (Fig. 4) in which the genic and intergenic transcripts are detected independently of each other in a proportion of the cells. Furthermore, this suggests that the drop in polymerase density after the poly(A) site of each gene reflects termination of globin gene transcription.
The LCR and intergenic transcripts are all induced in HeLa cells following transfection of a β-globin gene
The results described above show that transient transfection of a globin gene into HeLa cells induces transcription from the corresponding flanking region in the chromosomal β-globin locus. To investigate whether there is transinduction of all the intergenic transcripts by each globin gene, ε-globin was transiently transfected into HeLa cells under the control of the inducible human immunodeficiency virus (HIV) promoter, which requires the viral transactivator protein Tat (for review, see Cullen 1993). Transfection of HIV-ε into HeLa cells in the presence of Tat induces transcription from the β-globin locus (Fig. 7A), showing that there is no absolute requirement for a globin promoter. The four LCR hypersensitive sites are transcribed (L1, L3, L5, L7), as are the flanking regions of the ε (E10), Gγ (G10), Aγ (A19), and β (B11) genes. No transcription of the γ (AG1, AG3) or β (B3) genes is detected, however, consistent with a lack of induction of transcription of the globin genes themselves. Strong signals are observed over probes PH and E3, as the DNA in these probes is present in the HIV-ε construct. Transcription of the cotransfected VAI gene and an endogenous histone gene is also detected.
The plasmid HIV-ε was also transfected without the Tat-producing plasmid (Fig. 7A). Short transcripts are made from the HIV promoter in the absence of Tat (Cullen 1993), and such weak transcription is detected by probe PH. The increased initiation at the HIV promoter in the presence of Tat (as observed by a higher PH signal relative to the VA control) has been described previously (Laspia et al. 1989). Intergenic, but not genic, transcripts are induced extremely weakly in the absence of Tat (data not shown). It appears that the level of transinduction correlates with the strength of the promoter in the plasmid.
Induction of intergenic, but not genic, transcripts by transient transfection of HIV-ε with a Tat-producing plasmid is also observed in the nonerythroid cell lines 293 and CAK8 (Fig. 7A). Although the transfection efficiencies of the different cell lines varies as measured by plasmid transcription (E3) relative to cellular histone transcription, the level of induced transcripts relative to plasmid transcription is the same. Induced transcription is fivefold lower than plasmid transcription.
To investigate the extent of LCR transcription upstream of HS4, ssDNA probes were made from a 3.3-kb fragment that contained HS5. Transcription of HS5 was analyzed following transient transfection of HIV-ε (Fig. 7B). HS5 is transcribed, suggesting that at least one site of transcription initiation lies further 5′.
Transfection of the Aγ gene shows that this gene can also induce the LCR (data not shown) and intergenic transcripts (E11–E14, B11, B12, A19) (Fig. 7C). Transcription over probes G′10 and G′11, which lie upstream of Gγ (see Fig. 3A for probe diagram) is detected, whereas G′12, which is immediately downstream, lacks a signal. This transcription pattern over G′10 to G′12 is also observed in HEL cells (data not shown) and may reflect another transcription termination event. Transcription of Aγ does not induce transcription of the ε (E3, E4) or β (B3) genes. In general, transcription of AG1 is 5- to 10-fold higher than that of the γ poly(A) site, as discussed previously (Fig. 3D). Quantitation of the level of induction relative to transcription of the Aγ poly(A) site (in the same way as induction was measured relative to the ε poly(A) site in Fig. 7A) reveals that induced transcription is fourfold lower (data not shown). This is in agreement with the fivefold lower induction observed upon transfection of HIV-ε and Tat (Fig. 7A).
Similarly, transfection of the β gene induces intergenic but not ε- or γ-genic transcripts (data not shown). Thus, all the intergenic transcripts are induced on transient transfection of any one of the β-globin genes. It is possible that transcription is nonspecifically induced from many flanking regions on transfection of a β-globin gene. This is not the case for the α-globin 3′-flanking region, however, in which transcription is not induced (data not shown).
Analysis of the specificity of transinduction
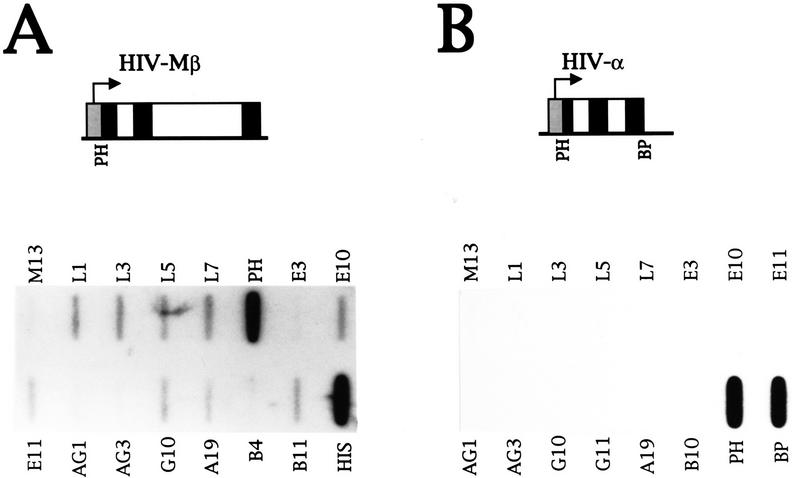
To analyze how strict the requirement is for a human β-globin gene, the mouse β-major gene was tested for its ability to induce transcripts from the human β-globin locus in HeLa cells. The mouse β-major DNA inserted in the plasmid has 60% homology to the human β-globin gene. Transfection of the mouse β-major gene into HeLa cells under the control of the HIV promoter induces intergenic, but not genic, transcripts (Fig. 8A). However, the level of transinduction relative to plasmid transcription (PH) is fivefold lower than that observed with a plasmid containing the HIV promoter and human ε or β genes (Fig. 7A and data not shown).
Figure 8.
Analysis of the specificity of transinduction. (A) NRO analysis of β-globin transcription in HeLa cells transiently transfected with the plasmid HIV–Mβ and a Tat plasmid. HIV–Mβ contains the mouse β-major gene fused to the HIV promoter as shown. The probes tested have been described. (B) The NRO data obtained from HeLa cells transiently transfected with the plasmid HIV-α and a Tat-producing plasmid are shown.
Next, the α-globin gene, which resides in the separate α-globin locus and is unrelated to the sequence of the β-globin genes, was tested for its ability to transinduce transcripts from HeLa cell β-globin locus. A plasmid containing the HIV promoter fused to the α-globin gene was transiently transfected into HeLa cells and plasmid transcription was detected by use of probes PH and BP (Fig. 8B). Transcription is not induced from the β-globin locus, however, showing that β-globin gene sequences on the plasmid are required in addition to an active promoter.
Analysis of transcription in transfected HeLa cells by in situ hybridization
Plasmid and chromosomal transcription in HeLa cells transiently transfected with the plasmid ASV− were analyzed by double-label primary transcript in situ hybridization. Plasmid transcription was detected with a γ gene-specific intronic probe and two transcription foci are present in transfected cells (Fig. 9a,b). The γ gene probe specifically detects plasmid transcription, as no γ transcription is detectable from the chromosomal β-globin locus by use of the sensitive RNase protection assay (Fig. 6B). Transcription is detected from the β-globin locus on each chromosome with LCR (Fig. 9a) or ε 3′ (Fig. 9b) probes and these transcription foci colocalize with those observed for the transfected plasmid. Three or four colocalizing plasmid and chromosomal transcription foci were observed in a minority of cells (see below). No foci were detected in mock transfected cells or cells treated with RNase (data not shown). This finding suggests that there is an association between the plasmid and β-globin locus, and this was further investigated by visualizing distribution of the plasmid at the DNA level.
Figure 9.
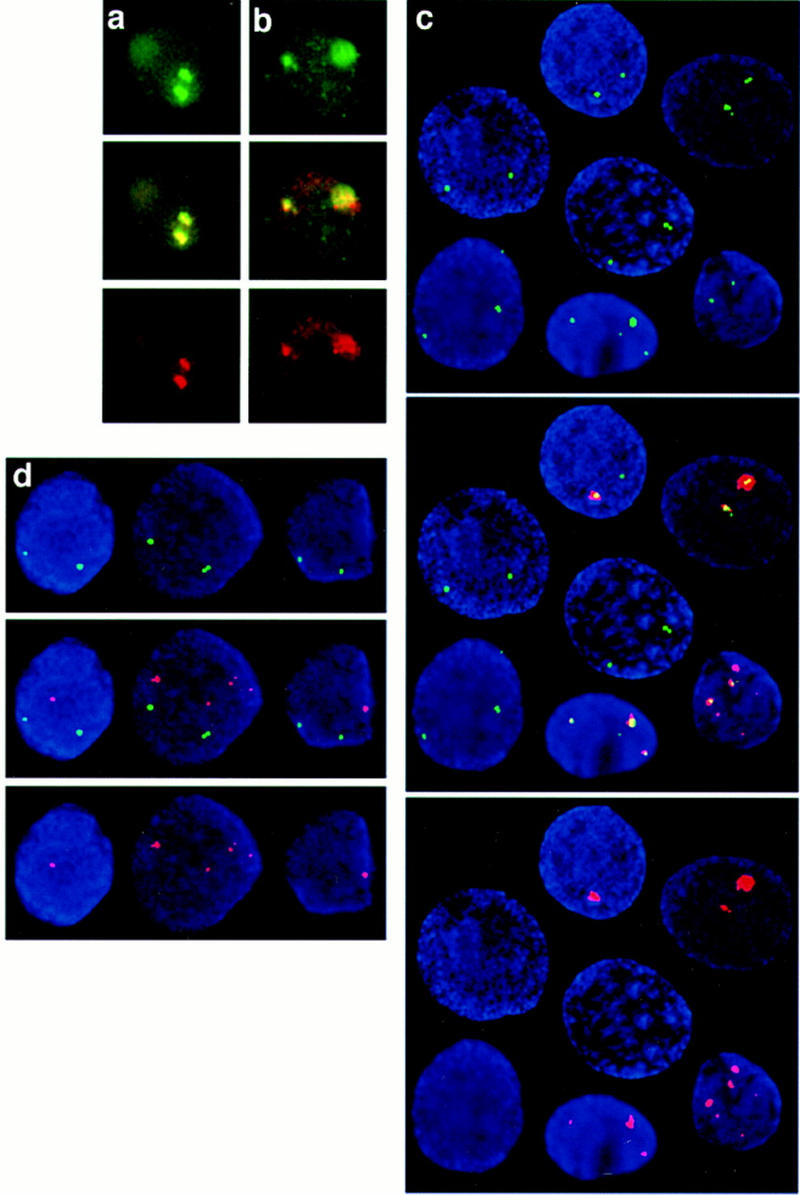
Plasmid distribution visualized by in situ hybridization. Plasmid and chromosomal transcripts in HeLa cells transiently transfected with the plasmid ASV− were detected with γ gene-specific intron oligonucleotides (green) and either (a) an LCR probe (red) or (b) an ε 3′ probe (red). (c) Detection of plasmid DNA (red) and the human β-globin locus (green) in DAPI-stained nuclei (blue) of HeLa cells transiently transfected with the plasmid ASV−. (d) Detection of plasmid DNA (red) in conjunction with a probe specific to chromosome 22 (green). (a–d) Separate red and green images are shown with the overlay in the middle.
Plasmid and β-globin locus DNA in HeLa cells transfected with ASV− were detected by in situ hybridization with a probe specific to the plasmid backbone in conjunction with a human β-globin locus probe. The plasmid is not distributed throughout the nucleus, but is instead localized to a discrete number of sites, some of which colocalize with the endogenous locus (Fig. 9c). Such colocalization of the plasmid and β-globin locus was observed in 95% of transfected cells. Cells with three chromosome signals were also detected (Fig. 9c) consistent with the aneuploid nature of HeLa cells. As a control, a probe specific to part of human chromosome 22 (M69; Mulder et al. 1995) was also used and the signals obtained from this probe do not colocalize with plasmid DNA (Fig. 9d). Together, these results suggest that there is a specific interaction between the plasmid and β-globin locus on chromosome 11 providing insight into the mechanism of transinduction.
Discussion
These studies show that there is extensive Pol II transcription throughout the β-globin locus in erythroid cells. Furthermore, we have shown that it is possible to induce intergenic transcription from the β-globin locus in nonerythroid cell lines by transient transfection of a plasmid containing an actively transcribed ε, γ, or β gene. Genic transcripts are not induced. The reason for this is unknown but may be due, at least in part, to the absence of erythroid transcription factors.
Transcription in gene clusters
The pattern of transcription in the β-globin cluster appears analogous to that of rDNA by Pol I in that gene transcription terminates and intergenic transcription initiates downstream. In the β-globin locus, the LCR is transcribed and this transcription appears to terminate within 400 bp of the ε-globin transcription start site. The overall pattern of transcription of the ε and γ genes is similar in that there is a decrease in polymerase density after the poly(A) site, followed by a higher density of polymerases downstream in the intergenic regions. Transcription has been identified downstream of the ε gene and upstream of Gγ, raising the possibility that the transcription that initiates in the ε 3′-flanking region continues through to the Gγ gene. Similarly, transcription extends through the entire Gγ-Aγ intergenic region. Transcripts have also been identified in the δ and β 3′-flanking region. It is entirely possible that intergenic transcription is a general feature of Pol II gene clusters, although to date this has not been investigated.
Transcription of the LCR and intergenic regions
As all of the probes tested upstream of the ε gene have a NRO signal and these signals are all strand specific, it is possible that a single transcription unit exists over the LCR. The LCR may be located within a gene, as is the case for HS-40 (Vyas et al. 1992), the growth hormone LCR (Bennani-Baiti et al. 1995), and the adenosine deaminase LCR (Aronow et al. 1989). In the same way, the intergenic transcripts could also be genic. RNAs from the LCR and intergenic regions, however, were detected in the nucleus, but not the cytoplasm, by in situ hybridization and, consistent with this, a search of the EST database derived from cytoplasmic RNAs failed to match human β-globin LCR or intergenic sequences. Thus, it appears that the LCR and intergenic transcripts are nuclear specific.
Alternatively, there may be multiple promoters in the LCR and intergenic regions. Support for this comes from the observations that the LCR microlocus (a fragment containing the four LCR HSs linked together) and HS2 are transcribed (Collis et al. 1990; Tuan et al. 1992). The reason why only a proportion of erythroid cells transcribe the intergenic regions as shown in Figure 4 is unknown, although this could reflect a stage dependence of transcription.
Is LCR transcription relevant to its function?
As HS2 and the microlocus, which can substitute for the entire LCR, are transcribed (Collis et al. 1990; Tuan et al. 1992), it is possible that LCR transcription is important for its function. Indeed, transcription has been correlated to LCR activity for the keratin 18 gene. Inactivation of transcription from an Alu repeat in the keratin 18 LCR results in loss of copy-number-dependent expression in the kidney (Thorey et al. 1993).
One way in which transcription may relate to LCR activity, is if the function of transcription is to establish and maintain an open chromatin conformation in the locus that is permissive for gene transcription. Transcription of the intergenic regions could have a similar role. It is also possible, however, that the widespread transcription of the β-globin locus is merely a consequence of its open chromatin conformation. In general, it is still not clear whether transcription opens chromatin or is a consequence of an open chromatin conformation (McKnight 1996). The apparent strand specificity of transcription and specificity of the sites at which transcription initiates in the intergenic regions argues against transcription merely being a consequence of open chromatin.
It is also possible that the role of the LCR and intergenic transcripts is to deliver proteins and/or Pol II to the globin gene promoters, and such a tracking mechanism has been proposed previously (Tuan et al. 1992).
Transinduction of the β-globin locus in nonerythroid cells
The second feature of this study is that transcription is induced from the chromosomal β-globin locus in nonerythroid cells following transient transfection of a plasmid containing an ε, γ, or β-globin gene with an active promoter. The LCR and intergenic regions are transcribed from the locus, whereas the globin genes themselves are not. We have shown that there is specificity to transinduction as transcription is not induced by the α-globin gene nor are α-globin-flanking region transcripts induced by the β-globin gene. However, it is difficult to directly compare the level of intergenic transcription in erythroid cells with that transinduced in nonerythroid cells. The in situ data revealed that ∼50% of HeLa cells were transfected with plasmid and that ∼25% of erythroid cells transcribe the intergenic transcripts. Assuming that the level of histone transcription is constant in HeLa and K562 cells, then the relative levels of intergenic transcription in these cells can be ascertained. Quantitation relative to histone (by use of the NRO data in Figs. 1A and 7A) and correction for the number of transcribing cells reveals that intergenic transcription is approximately fourfold higher in HeLa cells than in K562 cells.
How are transcripts induced from the HeLa cell chromosome?
Analysis of the requirements for transinduction reveals that protein expression is not required. Furthermore, a γ gene lacking poly(A) signals and, hence, producing no detectable steady state γ mRNA still induces intergenic transcription (H.L. Ashe and N.J. Proudfoot, unpubl.), implying that the effect is mediated at the DNA level.
It is possible that transient transfection of a β-globin gene allows titration of a repressor acting on the chromosomal β-globin locus in nonerythroid cells. The requirement for transcription of the transfected plasmid, however, seems inconsistent with this hypothesis. Plasmid DNA would titrate out such a DNA-binding repressor protein from the endogenous locus whether or not the plasmid is transcribed.
An alternative mechanism of transinduction involves an association between the globin gene in the plasmid with the corresponding globin gene in the chromosome by sequence homology and our data provide direct evidence for this. A plasmid containing the Aγ gene colocalizes with the human β-globin locus at the DNA level and transcripts induced from the globin locus colocalize with plasmid transcripts. Association of the plasmid with the chromosome could induce transcription in two ways. It is possible that a transcribed plasmid, for example, one with the Aγ gene and SV40 enhancer, is located in a transcriptionally active area of the nucleus and relocates the endogenous locus into this active region. The locus would, therefore, be accessible to Pol II allowing LCR and intergenic transcription. Plasmids that are introduced into HeLa cells, but are not transcribed, such as those containing the γ genes without the SV40 enhancer, would be localized in a region of the nucleus inactive for transcription and unable to transinduce. Alternatively, a transcribed plasmid could bring Pol II and/or transcription factors to the chromosomal locus with which it is associated, thereby activating LCR and intergenic transcription. Further experiments are required to discriminate between these two possibilities.
Both possibilities predict that there will be a correlation between the strength of the promoter in the plasmid and the level of transinduction. This is supported by the greatly reduced level of induction obtained by transfection of HIV-ε in the absence of Tat. The association model can also explain the lower level of transinduction observed when the mouse β-major gene is present in the plasmid. The mouse β-major and human β-globin genes are highly homologous (79%) in the 500 bp containing the first two exons and first intron. Similarly, there is 69% homology between the third exons, although the big, second intron is not conserved. We propose that this weaker homology weakens the association between the plasmid and chromosome resulting in fivefold lower transinduction.
Transcriptional effects in other systems
In this paper we propose that pairing of a plasmid with a homologous region of the chromosome can activate chromosomal transcription. Chromosome pairing in Drosophila has been shown to influence gene expression in both positive and negative ways (for review, see Henikoff 1997). For example, the brown gene is trans-inactivated by insertion of heterochromatin into the brown gene on the other chromosome (Dreesen et al. 1991). The two brown alleles are paired and the heterochromatin insertion in one causes both alleles to associate with the heterochromatic centromere, suppressing brown expression (Csink and Henikoff 1996; Dernburg et al. 1996). Transient pairing of mammalian chromosomes has also been described (LaSalle and Lalande 1996), although it remains to be determined whether such pairing between chromosomal loci is used to regulate transcription.
Other reports exist whereby introduction of DNA or RNA into cells influences endogenous gene transcription. In transgenic plants, host genes can be silenced by the introduction of another copy of the gene, and this silencing can be mediated at the transcriptional level (Meyer and Saedler 1996). Inhibition of gene expression by introduction of sense RNA into Caenorhabditis elegans has also been described (Guo and Kemphues 1995). Finally, cellular genes, including the human ε-globin gene, are activated in embryonic fibroblasts following retroviral infection (Groudine and Weintraub 1975, 1980). These transcription effects highlight our lack of understanding of the control of transcription in the nucleus.
If our model for transinduction of transcription from HeLa cells is correct, then this phenomenon could be a general, but hitherto undetected, feature of transient transfection studies. The challenge now is to induce genic transcripts, and ways in which this can be achieved are currently being investigated.
Materials and methods
Plasmid construction
All constructs were made using restriction enzymes or PCR to isolate DNA fragments followed by their ligation into appropriate plasmid vectors. All PCR-derived clones were checked by DNA sequence analysis. Sequence coordinates refer to the GenBank sequence (accession no. U01317). A partial EcoRI–EcoRV fragment (19215–25409) of the ε-globin gene was inserted into pUC18, which had been digested with EcoRI and HincII, creating pε. The SV40 enhancer was then cloned into the AatII site of pε to create εSV-. εSV-ΔFLANK was constructed by deletion of an EcoRI fragment (21235–25409) from εSV-. HIV-ε contains an AvaI–HinfI blunt-ended fragment of the HIV promoter and PvuII–XbaI fragment (19506–22709) of the ε-globin gene inserted into the pUC18 polylinker between the Asp718 (blunt ended) and XbaI sites.
A fragment from coordinates 39267–43759 containing the Aγ gene was blunt-end ligated into the BamHI site of pUC18 to create pUCA. ASV− was created by insertion of the SV40 enhancer into the blunt-ended Asp718 site of pUCA. ASV−ΔFLANK was created by deletion of a fragment from the flanking region of ASV− corresponding to the sequences from the DraI site (41022) to the AatII site in pUC18. The SV40 enhancer was blunt-end ligated into the Asp718 site of pUC18 to make pUCSV−.
GSV- was constructed by replacing Aγ sequences in ASV− (BstEII 40787–43759) with Gγ sequences (BstEII 35871–39208). GSV–ΔFLANK was created by deletion of Gγ sequences from GSV- (DraI 36106–39208). GSV–ΔFLANK FS contains a frameshift mutation created by filling in the BstEII site in the third exon (35871) of GSV–ΔFLANK. GSV–FS has the same mutation. A SstI Gγ fragment (35805–35985) excised from GSV–FS (therefore bearing a frameshift mutation at 35871) was inserted into the XbaI (blunt-ended) polylinker of pGEM4 creating the plasmid pGEMγFS.
βSV–ΔFLANK was constructed by deletion of a fragment from pβE (Proudfoot et al. 1992) corresponding to the sequences from StyI 63839 to the HindIII site in the plasmid.
The Tat plasmid has been described previously (Adams et al. 1988).
The NRO ssDNA probes were made by insertion of the fragments listed in Table 1 into M13 polylinker sequence. The number of A residues complementary to the labeled U residues in the NRO transcripts are shown after the coordinates of each probe.
Table 1.
NRO probes
| Probe
|
Coordinates
|
U content
|
Probe
|
Coordinates
|
U content
|
|---|---|---|---|---|---|
| L1 | 955–1338 | 100 | G4 | 36106–36475 | 94 |
| L2 | 3377–3838 | 118 | G5 | 36475–36870 | 104 |
| L3 | 4505–5124 | 154 | G6 | 36862–37108 | 75 |
| L4 | 7774–8222 | 127 | G7 | 37108–37339 | 54 |
| L5 | 8486–8860 | 96 | G8 | 37339–37676 | 132 |
| L6 | 8982–9469 | 111 | G9 | 37676–37982 | 121 |
| L7 | 13473–14086 | 167 | G10 | 37982–38185 | 63 |
| L8 | 14319–14788 | 145 | G11 | 38185–38378 | 44 |
| L9 | 15569–15952 | 144 | G12 | 38378–38683 | 95 |
| L10 | 16378–16777 | 138 | G13 | 38683–39020 | 95 |
| L11 | 17291–17848 | 167 | G14 | 39020–39212 | 34 |
| L12 | 18399–18883 | 129 | AG15 | 39212–39264 | 14 |
| L13 | 18399–18638 | 61 | AG16 | 39219–39355 | 31 |
| L14 | 18638–18856 | 59 | AG17 | 39305–39410 | 19 |
| L15 | 18857–19024 | 65 | AG1 | 39465–39697 | 50 |
| L16 | 19024–19215 | 75 | AG2 | 40071–40212 | 49 |
| L25 | 532–747 | 77 | AG3 | 40787–41022 | 75 |
| L26 | 747–955 | 56 | A4 | 41022–41373 | 105 |
| L27 | 6555–7000 | 141 | A5 | 41373–41644 | 74 |
| L28 | 13294–13470 | 46 | A6 | 41644–41881 | 79 |
| L29 | 13473–13670 | 43 | A7 | 41881–42117 | 61 |
| L30 | 13670–13842 | 50 | A8 | 42117–42454 | 129 |
| L31 | 13842–14086 | 76 | A9 | 42454–42758 | 121 |
| E1 | 19215–19420 | 46 | A18 | 42578–42974 | 99 |
| E2 | 19851–20064 | 64 | A19 | 42974–43158 | 79 |
| E3 | 20940–21233 | 92 | A20 | 43158–43395 | 88 |
| E4 | 21233–21440 | 51 | A21 | 43379–43577 | 58 |
| E5 | 21440–21623 | 67 | A22 | 43577–43759 | 39 |
| E6 | 21623–21883 | 65 | B1 | 61667–61857 | 92 |
| E7 | 21883–22127 | 64 | B2 | 62203–62404 | 53 |
| E8 | 22127–22419 | 89 | B3 | 63424–63708 | 85 |
| E9 | 22419–22708 | 100 | B4 | 63708–63952 | 91 |
| E10 | 22708–23001 | 97 | B5 | 63952–64080 | 56 |
| E11 | 23001–23325 | 129 | B6 | 64080–64293 | 65 |
| E12 | 23325–23524 | 85 | B7 | 64301–64560 | 81 |
| E13 | 23524–23770 | 123 | B8 | 64560–64868 | 45 |
| E14 | 23770–24013 | 108 | B9 | 64868–65134 | 131 |
| G′10 | 33062–33215 | 48 | B10 | 65134–65363 | 108 |
| G′11 | 33215–33448 | 47 | B11 | 65865–66087 | 77 |
| G′12 | 33448–33765 | 88 | B12 | 66087–66303 | 107 |
The HS5 M13 probes (L17–L24) contain eight fragments from a 3.3-kb HS5-containing fragment. The HIS, 5S, PH, BP, and VA probes contain mouse histone H4 DNA (Ashfield et al. 1991), Xenopus laevis 5S rDNA, a PvuII–HinfI fragment of the HIV promoter, α-globin DNA (Enriquez-Harris et al. 1991), and the adenovirus VAI gene, respectively.
Tissue culture
K562 and HEL cells were induced with 40 μm hemin for 24 and 12 hr, respectively. Subconfluent HeLa, 293, and CAK8 cells (Pear et al. 1993) were transiently transfected by CaPO4 precipitation with 2–25 μg of the test plasmid, 1.5 μg of the Tat plasmid, and 1 μg of the VAI plasmid. Chloroquine (25μm) was added to the media at the same time as the precipitate during the CAK8 cell transfection. NRO and in situ hybridization analyses were performed 24 hr after transfection. Cytoplasmic RNA was isolated 48 hr after transfection as described previously (Eggermont and Proudfoot 1993).
NRO analysis
Cells were harvested by centrifugation, washed with PBS, and resuspended in HLB (10 mm Tris at pH 7.5, 10 mm NaCl, 2.5 mm MgCl2) + 0.5% NP-40. After incubation on ice (5 min), nuclei were pelleted through a cushion of HLB + 0.5% NP-40 + 10% sucrose. Nuclei were resuspended in an equal volume of transcription buffer (40 mm Tris at pH 7.9, 1.6 m NaCl, 10 mm MgCl2, 40% glycerol, 2 mm DTT) and where applicable, nuclei were treated with 3 μg/ml α-amanitin for 5 min at 30°C. RNA was labeled by the addition of ATP, GTP, and CTP (250 μm each) plus 60 μCi[α-32P]-UTP (800 Ci/mmole, Amersham). Transcription reactions were carried out at 30°C for 15 min and terminated by centrifugation for 30 sec. Nuclei were resuspended in HSB (10 mm Tris at pH 7.5, 0.5 m NaCl, 10 mm MgCl2) containing 10 units of RNase-free DNase and incubated at 30°C for 5 min. The reactions were deproteinized by addition of 200 μg/ml of proteinase K, 0.2% SDS, at 37°C for 30 min. RNA was extracted with phenol/chloroform, ethanol precipitated, and incubated in DNase buffer (10 mm Tris at pH 7.5, 10 mm MgCl2) containing 10 units of DNase for 30 min at 37°C. RNA was again extracted, ethanol precipitated, and resuspended in water. After partial RNA hydrolysis by 0.2 m NaOH on ice for 5 min, the RNA was neutralized with 0.1 m Tris/0.1 m HCl. Hybridization of the labeled RNA to a prehybridized filter was performed overnight at 42°C in 50% formamide, 6× SSPE, 5× Denhardt’s solution, 0.1% SDS, and 100μg/ml of tRNA. Filters were made with a slot blot (Bio-Rad) with 5 μg of ssDNA applied to each slot. Filters were washed in 1× SSPE/0.1% SDS at room temperature for 20 min and in 0.1× SSPE/0.1% SDS at 65°C for 20 min. Signal were quantitated with a Molecular Dynamics PhosphorImager.
RNase protection
The riboprobe was made from linearized pGEMγFS with T7 RNA polymerase according to the manufacturer’s instructions (Promega). Full-length riboprobe was purified from a denaturing polyacrylamide gel by excising a gel slice and eluting the RNA in buffer (0.5 m ammonium acetate, 0.1% SDS, 1 mm EDTA) for 1 hr at 30°C. Eluted RNA was ethanol precipitated, resuspended in water, and 500 cps of probe was hybridized with 20 μg of RNA. RNase protection analysis was performed as described previously (Ashe et al. 1995).
RNA in situ hybridization
This analysis was performed as described previously (Wijgerde et al. 1995). Fetal livers (13.5 day) were disrupted in PBS, and the cells were fixed onto poly-l-lysine-coated slides with 4% formaldehyde/5% acetic acid in normal saline for 20 min at room temperature. The slides were washed three times for 10 min in PBS and stored in 70% ethanol at −20°C. Slides were pretreated for hybridization by a 0.01% pepsin digestion (5 min at 37°C) in 0.01 m HCl, followed by a short wash in water and a 5-min fixation in 3.7% formaldehyde at room temperature. The slides were washed in PBS, dehydrated in 70%, 90%, and 100% ethanol steps and air-dried. The hybridization mixture was applied and incubated at 37°C in a moist chamber overnight. Hybridization mix consisted of 50% formamide, 2× SSC, 200 ng/μl of salmon sperm DNA, 5× Denhardt’s solution, 1 mm EDTA, 50 mm sodium phosphate at pH 7.0, and 1–5 ng/μl of each probe. For intergenic transcript detection, 25–50 ng of intergenic probe was added to the hybridization mix described above, denatured at 80°C for 5 min in 40 μl of hybridization mix with a 10- to 20-fold excess of mouse and human Cot-1 DNA, and allowed to anneal at 37°C for 10 to 15 min before applying to the dried slides. Probes were labeled with dinitrophenol, digoxygenin, or biotin. The oligonucleotide intron probes were as described by Wijgerde et al. (1995). After hybridization, the coverslips were removed by dipping in 2× SSC, and the slides were washed three times in 2× SSC at 37°C, followed by a 5-min wash in 0.1 m Tris, 0.15 m NaCl, 0.05% Tween 20. Antibody detection of the labels was essentially as described by Dirks et al. (1993), with three or four amplification steps. Mounting was in DAPI/DABCO: Vectashield (1:1) in glycerol (90%), and slides were stored at 4°C in the dark. Fluorescence was detected by epifluorescence and recorded with a CCD camera. RNase pretreatment was in 0.1 m Tris, 0.15 m NaCl, and 10 μg/ml of RNase A for 5 min at room temperature prior to hybridization.
DNA fluorescence in situ hybridization
HeLa cells were washed in PBS, resuspended in hypotonic buffer (10 mm HEPES at pH 7.3, 30 mm glycerol, 1 mm CaCl2, 0.8 mm MgCl2) for 10 min at room temperature and cytospun at 800 rpm for 4 min. Cells were then fixed in methanol/acetic acid (3:1) for 30 min at room temperature, dehydrated in 70%, 90%, and 100% ethanol steps, air-dried, and stored at 4°C. Slides were rehydrated in 70% ethanol for 5 min at room temperature and washed in 0.1 m Tris at pH 7.5; normal saline for 5 min, prior to treatment in 0.01% pepsin in 0.01 m HCl at 37°C for 5 min. The slides were then treated with 100 μg/ml of RNase A at 37°C for 5 min, rinsed briefly in water, and fixed for 5 min in 3.7% formaldehyde at room temperature. The slides were washed in PBS, dehydrated in 70%, 90%, and 100% ethanol steps, and air-dried. Slides were denatured in 70% formamide, 2× SSC for 2 min at 70°C and then immersed immediately in 70% ethanol on ice for 3 min and dehydrated through 70%, 90%, and 100% ethanol steps (3 min each) on ice and air-dried. Probes were labeled with digoxygenin or biotin and dissolved in hybridization mix described above. Probe (25–50 ng) was denatured at 80°C for 5 min in 40 μl of hybridization mix and allowed to anneal at 37°C for 10–15 min before applying to the dried and denatured slides. Hybridization was performed overnight as described above. The slides were washed three times in 50% formamide, 2× SSC at 37°C for 10 min and once in 0.1× SSC at 60°C for 10 min. Probe detection was carried out as described previously (Dirks et al. 1993).
Acknowledgments
We thank Mark Ashe, Charlie Birse, Peter Cook, Mick Dye, Jan Eggermont, Doug Higgs, Alan Wolffe, and Bill Wood for helpful discussions. Thanks go to An Langeveld, Emma Jones, and Pete Lewis for their help, and to Bill Wood for providing plasmids and cell lines. These studies were supported by a Medical Research Council studentship to H.L.A. and a Wellcome Trust Programme grant (no. 032773/Z/95) to N.J.P. The procedure for transinduction is subject to a patent application by H.L.A. and N.J.P. (no. 9622084.3).
The publication costs of this article were defrayed in part by payment of page charges. This article must therefore be hereby marked “advertisement” in accordance with 18 USC section 1734 solely to indicate this fact.
Footnotes
E-MAIL nicholas.proudfoot@path.ox.ac.uk; FAX 01865-275556.
References
- Adams SE, Johnson ID, Braddock M, Kingman AJ, Kingman SM, Edwards RM. Synthesis of a gene for the HIV transactivator protein TAT by a novel single stranded approach using gap repair. Nucleic Acids Res. 1988;15:4287–4297. doi: 10.1093/nar/16.10.4287. [DOI] [PMC free article] [PubMed] [Google Scholar]
- Allan M, Lanyon WG, Paul J. Multiple origins of transcription in the 4.5 kb upstream of the ε-globin gene. Cell. 1983;35:187–197. doi: 10.1016/0092-8674(83)90221-0. [DOI] [PubMed] [Google Scholar]
- Aronow BD, Lattier D, Silbiger R, Dusing M, Hutton J, Jones G, Stock J, McNeish J, Potter S, Witte D, Wiginiton D. Evidence for a complex regulatory array in the first intron of the human adenosine deaminase gene. Genes & Dev. 1989;3:1384–1400. doi: 10.1101/gad.3.9.1384. [DOI] [PubMed] [Google Scholar]
- Ashe MP, Griffin P, James W, Proudfoot NJ. Poly(A) site selection in the HIV-1 provirus: Inhibition of promoter proximal polyadenylation by the downstream major splice donor site. Genes & Dev. 1995;9:3008–3025. doi: 10.1101/gad.9.23.3008. [DOI] [PubMed] [Google Scholar]
- Ashfield R, Enriquez-Harris P, Proudfoot NJ. Transcription termination between the closely linked human complement genes C2 and Factor B: Common termination factor for C2 and c-myc? EMBO J. 1991;10:4197–4207. doi: 10.1002/j.1460-2075.1991.tb04998.x. [DOI] [PMC free article] [PubMed] [Google Scholar]
- Bastos RN, Aviv H. Globin RNA precursor molecules: Biosynthesis and processing in erythroid cells. Cell. 1977;11:641–650. doi: 10.1016/0092-8674(77)90081-2. [DOI] [PubMed] [Google Scholar]
- Bennani-Baiti IM, Jones BK, Liebhaber SA, Cooke NE. Physical linkage of the human growth hormone gene cluster and the skeletal muscle sodium channel α-subunit gene (SCN4A) on chromosome 17. Genomics. 1995;29:647–652. doi: 10.1006/geno.1995.9954. [DOI] [PubMed] [Google Scholar]
- Caterina JJ, Ryan TM, Pawlik KM, Palmiter RD, Brinster RL, Behringer RR, Townes TM. Human β-globin locus control region: Analysis of the 5′ DNase I hypersensitive site HS 2 in transgenic mice. Proc Natl Acad Sci. 1991;88:1626–1630. doi: 10.1073/pnas.88.5.1626. [DOI] [PMC free article] [PubMed] [Google Scholar]
- Collis P, Antoniou M, Grosveld F. Definition of the minimal requirements within the human β-globin gene and the dominant control region for high level expression. EMBO J. 1990;9:233–240. doi: 10.1002/j.1460-2075.1990.tb08100.x. [DOI] [PMC free article] [PubMed] [Google Scholar]
- Csink AK, Henikoff S. Genetic modification of heterochromatic association and nuclear organization in Drosophila. Nature. 1996;381:529–531. doi: 10.1038/381529a0. [DOI] [PubMed] [Google Scholar]
- Cullen BR. Does HIV-1 Tat induce a change in viral initiation rights? Cell. 1993;73:417–420. doi: 10.1016/0092-8674(93)90126-b. [DOI] [PubMed] [Google Scholar]
- Dernburg AF, Broman KW, Fung JC, Marshall WF, Philips J, Agard DA, Sedat JW. Perturbation of nuclear architecture by long-distance chromosome interactions. Cell. 1996;85:745–759. doi: 10.1016/s0092-8674(00)81240-4. [DOI] [PubMed] [Google Scholar]
- Dirks RW, van de Rijke FM, Fujishita S, van der Ploeg M, Raap AK. Methodologies for specific intron and exon RNA localization in cultured cells by haptenized and fluorochromized probes. J Cell Sci. 1993;104:1187–1197. doi: 10.1242/jcs.104.4.1187. [DOI] [PubMed] [Google Scholar]
- Dreesen TD, Henikoff S, Loughney K. A pairing-sensitive element that mediates trans-inactivation is associated with the Drosophila brown gene. Genes & Dev. 1991;5:331–340. doi: 10.1101/gad.5.3.331. [DOI] [PubMed] [Google Scholar]
- Eggermont J, Proudfoot NJ. Poly(A) signals and transcriptional pause sites combine to prevent interference between RNA polymerase II promoters. EMBO J. 1993;12:2539–2548. doi: 10.1002/j.1460-2075.1993.tb05909.x. [DOI] [PMC free article] [PubMed] [Google Scholar]
- Enriquez-Harris P, Levitt N, Briggs D, Proudfoot NJ. A pause site for RNA polymerase II is associated with termination of transcription. EMBO J. 1991;10:1833–1842. doi: 10.1002/j.1460-2075.1991.tb07709.x. [DOI] [PMC free article] [PubMed] [Google Scholar]
- Grosveld F, Blom van Assendelft G, Greaves DR, Kollias G. Position-independent, high-level expression of the human β-globin gene in transgenic mice. Cell. 1987;51:975–985. doi: 10.1016/0092-8674(87)90584-8. [DOI] [PubMed] [Google Scholar]
- Groudine M, Weintraub H. Rous sarcoma virus activates embryonic globin genes in chicken fibroblasts. Proc Natl Acad Sci. 1975;72:4464–4468. doi: 10.1073/pnas.72.11.4464. [DOI] [PMC free article] [PubMed] [Google Scholar]
- ————— Activation of cellular genes by avian RNA tumor viruses. Proc Natl Acad Sci. 1980;77:5351–5354. doi: 10.1073/pnas.77.9.5351. [DOI] [PMC free article] [PubMed] [Google Scholar]
- Guo S, Kemphues KJ. par-1, a gene required for establishing polarity in C. elegans embryos, encodes a putative ser/thr kinase that is asymmetrically distributed. Cell. 1995;81:611–620. doi: 10.1016/0092-8674(95)90082-9. [DOI] [PubMed] [Google Scholar]
- Hagenbuchle O, Wellauer PK, Cribbs DL, Schibler U. Termination of transcription in the mouse α-amylase gene amy-2a occurs at multiple sites downstream of the polyadenylation site. Cell. 1984;38:737–744. doi: 10.1016/0092-8674(84)90269-1. [DOI] [PubMed] [Google Scholar]
- Henikoff S. Nuclear organization and gene expression: Homologous pairing and long-range interactions. Curr Opin Cell Biol. 1997;9:388–395. doi: 10.1016/s0955-0674(97)80012-9. [DOI] [PubMed] [Google Scholar]
- Imaizumi T, Diggelmann H, Scherrer K. Demonstration of globin messenger sequences in giant nuclear precursors of messenger RNA of avian erythroblasts. Proc Natl Acad Sci. 1973;70:1122–1126. doi: 10.1073/pnas.70.4.1122. [DOI] [PMC free article] [PubMed] [Google Scholar]
- LaSalle JM, Lalande M. Homologous association of oppositely imprinted chromosomal domains. Science. 1996;272:725–728. doi: 10.1126/science.272.5262.725. [DOI] [PubMed] [Google Scholar]
- Laspia MF, Rice AP, Mathews MB. HIV-1 tat protein increases transcriptional initiation and stabilises elongation. Cell. 1989;59:283–292. doi: 10.1016/0092-8674(89)90290-0. [DOI] [PubMed] [Google Scholar]
- Lowrey CH, Bodine DM, Nienhuis AW. Mechanism of DNase I hypersensitive site formation within the human globin locus control region. Proc Natl Acad Sci. 1992;89:1143–1147. doi: 10.1073/pnas.89.3.1143. [DOI] [PMC free article] [PubMed] [Google Scholar]
- Lozzio CB, Lozzio BB. Human chronic myelogenous leukemia cell-line with positive Philadelphia chromosome. Blood. 1975;45:321–334. [PubMed] [Google Scholar]
- Martin P, Papayannopoulou T. HEL cells: A new human erythroleukemia cell line with spontaneous and induced globin expression. Science. 1982;216:1233–1235. doi: 10.1126/science.6177045. [DOI] [PubMed] [Google Scholar]
- McKnight SL. Transcription revisited: A commentary on the 1995 Cold Spring Harbor Laboratory meeting, Mechanisms of eukaryotic transcription. Genes & Dev. 1996;10:367–381. doi: 10.1101/gad.10.4.367. [DOI] [PubMed] [Google Scholar]
- Meyer P, Saedler H. Homology-dependent gene silencing in plants. Annu Rev Plant Physiol Plant Mol Biol. 1996;47:23–48. doi: 10.1146/annurev.arplant.47.1.23. [DOI] [PubMed] [Google Scholar]
- Mulder MP, Wilke M, Langeveld A, Wilming LG, Hagemeijer A, van Drunen E, Zwarthoff EC, Reifman PHJ, Deelen WH, van den Ouweland AMW, Halley DJJ, Meijers C. Positional mapping of loci in the DiGeorge critical region at chromosome 22q11 using a new marker (D22S183) Hum Genet. 1995;96:133–141. doi: 10.1007/BF00207368. [DOI] [PubMed] [Google Scholar]
- Orkin SH. Regulation of globin gene expression in erythroid cells. Eur J Biochem. 1995;231:271–281. doi: 10.1111/j.1432-1033.1995.tb20697.x. [DOI] [PubMed] [Google Scholar]
- Pear WS, Nolan GP, Scott ML, Baltimore D. Production of high-titer helper-free retroviruses by transient transfection. Proc Natl Acad Sci. 1993;90:8392–8396. doi: 10.1073/pnas.90.18.8392. [DOI] [PMC free article] [PubMed] [Google Scholar]
- Philipsen S, Talbot D, Fraser P, Grosveld F. The β-globin dominant control region: Hypersensitive site 2. EMBO J. 1990;9:2159–2167. doi: 10.1002/j.1460-2075.1990.tb07385.x. [DOI] [PMC free article] [PubMed] [Google Scholar]
- Proudfoot NJ, Lee BA, Monks J. Multiple SP1 binding sites confer enhancer-independent replication-activated transcription of HIV-1 and globin gene promoters. New Biol. 1992;4:369–381. [PubMed] [Google Scholar]
- Reeder R. Regulation of transcription by RNA polymerase I. In: McKnight S, Yamamoto KR, editors. Transcriptional regulation. Cold Spring Harbor, NY: Cold Spring Harbor Laboratory Press; 1992. pp. 315–347. [Google Scholar]
- Shen SH, Slightom JL, Smithies O. A history of the human fetal globin gene duplication. Cell. 1981;26:191–203. doi: 10.1016/0092-8674(81)90302-0. [DOI] [PubMed] [Google Scholar]
- Strouboulis J, Dillon N, Grosveld F. Developmental regulation of a complete 70-kb human β-globin locus in transgenic mice. Genes & Dev. 1992;6:1857–1864. doi: 10.1101/gad.6.10.1857. [DOI] [PubMed] [Google Scholar]
- Thorey IS, Cecena G, Reynolds W, Oshima RG. Alu sequence involvement in transcriptional insulation of the keratin 18 gene in transgenic mice. Mol Cell Biol. 1993;13:6742–6751. doi: 10.1128/mcb.13.11.6742. [DOI] [PMC free article] [PubMed] [Google Scholar]
- Treisman R, Green MR, Maniatis T. cis and trans activation of globin gene transcription in transient assays. Proc Natl Acad Sci. 1983;80:7428–7432. doi: 10.1073/pnas.80.24.7428. [DOI] [PMC free article] [PubMed] [Google Scholar]
- Tuan D, Kong S, Hu K. Transcription of the hypersensitive site HS2 enhancer in erythroid cells. Proc Natl Acad Sci. 1992;89:11219–11223. doi: 10.1073/pnas.89.23.11219. [DOI] [PMC free article] [PubMed] [Google Scholar]
- Vyas P, Vickers MA, Simmons DL, Ayyub H, Craddock CF, Higgs DR. Cis-acting sequences regulation expression of the human α-globin cluster lie within constitutively open chromatin. Cell. 1992;69:781–793. doi: 10.1016/0092-8674(92)90290-s. [DOI] [PubMed] [Google Scholar]
- Wijgerde M, Grosveld F, Fraser P. Transcription complex stability and chromatin dynamics in vivo. Nature. 1995;377:209–213. doi: 10.1038/377209a0. [DOI] [PubMed] [Google Scholar]
- Wijgerde M, Gribnau J, Trimborn T, Nuez B, Philipsen S, Grosveld F, Fraser P. The role of EKLF in human β-globin gene competition. Genes & Dev. 1996;10:2894–2902. doi: 10.1101/gad.10.22.2894. [DOI] [PubMed] [Google Scholar]
- Wolffe A. Chromatin structure and function. London, UK: Academic Press; 1995. Chromatin structure; pp. 84–94. [Google Scholar]
- Zafarana G, Raguz S, Pruzina S, Grosveld F, Meijer D. The regulation of human β-globin expression: The analysis of hypersensitive site 5 (HS5) in the LCR. In: Stamatoyanopoulous G, editor. Molecular biology of hemoglobin switching. Andover, UK: Intercept; 1994. pp. 39–44. [Google Scholar]


