Abstract
We present in this paper a novel, semiautomated image-analysis software to streamline the quantitative analysis of root growth and architecture of complex root systems. The software combines a vectorial representation of root objects with a powerful tracing algorithm that accommodates a wide range of image sources and quality. The root system is treated as a collection of roots (possibly connected) that are individually represented as parsimonious sets of connected segments. Pixel coordinates and gray level are therefore turned into intuitive biological attributes such as segment diameter and orientation as well as distance to any other segment or topological position. As a consequence, user interaction and data analysis directly operate on biological entities (roots) and are not hampered by the spatially discrete, pixel-based nature of the original image. The software supports a sampling-based analysis of root system images, in which detailed information is collected on a limited number of roots selected by the user according to specific research requirements. The use of the software is illustrated with a time-lapse analysis of cluster root formation in lupin (Lupinus albus) and an architectural analysis of the maize (Zea mays) root system. The software, SmartRoot, is an operating system-independent freeware based on ImageJ and relies on cross-platform standards for communication with data-analysis software.
It is now widely accepted that root system architecture (RSA) is a fundamental component of agricultural and natural ecosystems productivity (Lynch, 1995; Hammer et al., 2009; Hodge et al., 2009). Concurrently, recent progress in our understanding of the molecular bases of root growth and development in model systems (De Smet et al., 2006; Péret et al., 2009) and novel insights on the role of RSA in field resource capture (Draye et al., 2010) yield new prospects of manipulating RSA in crop species (de Dorlodot et al., 2007). This situation reinforces the need for robust, evolutive, and high-throughput root phenotyping hardware and software solutions.
While new imaging technologies such as magnetic resonance imaging (Jahnke et al., 2009) and x-ray computed tomography are being developed to extract RSA information from soil cores, classical imaging using flat-bed scanners or cameras remains most widely used. Digital imaging is indeed affordable, features a wide range of image resolution, can be adapted to an array of experimental systems (e.g. hydroponics, aeroponics, rhizotrons, gel plates, gellan gum), and has been extended to time-lapse and three-dimensional applications (French et al., 2009; Hund et al., 2009; Yazdanbakhsh and Fisahn, 2009; Iyer-Pascuzzi et al., 2010; Clark et al., 2011).
In the same time, the interest in RSA phenotyping has gradually evolved from static and global traits (e.g. root mass or length density) to dynamic and local traits (e.g. growth rates, tropisms, insertion angles; Ge et al., 2000; de Dorlodot et al., 2007). Accordingly, a panel of software have been implemented targeting specific traits and experimental constraints (for review, see French et al., 2009; Le Bot et al., 2010). These software can be assigned to manual, semiautomated, and fully automated methods according to the amount of user interaction.
In manual methods, users typically draw the skeleton of the root system using freehand graphical tools, as in DART (Le Bot et al., 2010) or Win RHIZO Tron (Regent Instruments, 2011). These methods exclude software-generated errors and should provide accurate estimation of most local and global traits, but they are highly time consuming. They are often the only solution for complex root systems and for rhizotron images.
Semiautomated methods usually combine automated thresholding and skeletonization algorithms with some extent of user intervention, mainly to retouch and annotate software-generated root structures, as in EZ-Rhizo (Armengaud et al., 2009) and RootReader3D (Clark et al., 2011). The number of errors is usually negligible with seedling images but increases with the amount of root overlap. In principle, many traits can be estimated accurately if the software is used with the type of images and RSA for which it was designed.
Finally, automated methods rely on predefined procedures to perform image analysis without any user interaction. Such methods use specialized algorithms and tend to be application specific, unlike manual or semiautomated methods that generate explicit root structure information. The number of errors is kept to a minimum as long as the type of root system and images fit the requirements of the software. Examples of automated methods include WinRhizo (length and topology; Arsenault et al., 1995), RootTrace (growth, gravitropism, and branching; French et al., 2009; Naeem et al., 2011), and a recent system developed at Duke University (various morphological descriptors; Iyer-Pascuzzi et al., 2010).
In line with the distinction between methods, it is often the case that some areas of root images lend themselves to automated analysis better than other areas where the image quality is lower or where the amount of root overlap is higher, for which semiautomated or manual methods would perform better. Sometimes, a spatial segmentation of images even arises from the experimental design, as with areas (or periods) where root growth is obviously altered by local (or transient) conditions. As long as the research focus is on local or dynamic traits (e.g. growth rate, growing and branching angles, diameter or interbranch distance), a sampling-based processing strategy would be applicable to the areas of interest. In terms of efficiency, working on subsets of root systems would indeed allow more attention to the subset or the handling of more (or more complex) systems at constant cost.
In this study, we introduce a novel, multipurpose, and semiautomated image-analysis toolbox (SmartRoot) that speeds up the quantification of root growth and architecture of complex root systems from a wide variety of applications. The software combines a highly intuitive user interface with a new tracing algorithm and supports sampling-based image processing. SmartRoot is a platform-independent software (Windows, MacOS, Linux) implemented as a plugin for the popular ImageJ software (Rasband, 2011) and relies on established cross-platform standards (Java, SQL, and XML). Some of its features are illustrated with a time-lapse analysis of cluster root formation in lupin (Lupinus albus) and with an architectural analysis of the maize (Zea mays) root system.
RESULTS AND DISCUSSION
Multidimensional Representations of Roots
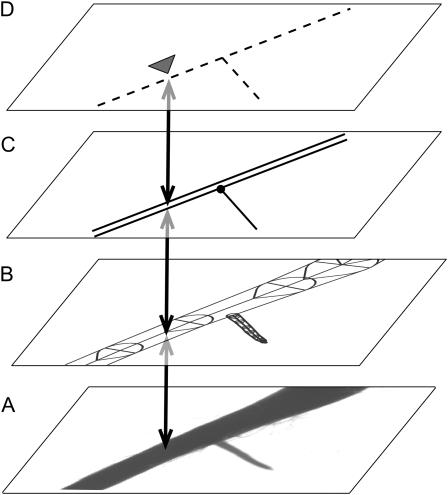
SmartRoot shares some features with Geographic Information Systems, in particular the ability to capture, store, present, and process data that are linked to location. As with Geographic Information Systems, information is stored in separate data layers. The first layer comprises the source image (viz. the two-dimensional array of raw pixel values). The second layer contains all root morphological information in a vector format, with individual roots approximated by segmented lines (Fig. 1). The third data layer contains the topological relationships between roots, while the fourth data layer contains user- or software-generated annotations or beacons inserted along roots.
Figure 1.
SmartRoot stores information in four separate data layers. A, Source image (raster). B, Morphology (vectorial). C, Topology (double lines = parent root; single lines = branch root; black circle = connection). D, Annotations (illustrated here with a beacon; see text). The double arrows indicate matching positions in different coordinate systems.
A consequence of the vector representation of roots is that any position along a root has two corresponding sets of coordinates: the classical [x, y] absolute coordinates and very intuitive [r, d] relative coordinates specifying the root identifier [r] and the (geodesic) distance to the root base [d]. Using the second coordinate system, it is easy to calculate interbranch distances, to combine physical dimensions with topological information, and to match corresponding positions on successive images in a time-lapse analysis (see below).
The information stored in data layers is displayed on the graphical user interface (GUI) as a separate set of six Photoshop-like layers containing the source image, the skeleton (segmented line) of individual roots, the nodes of the segmented lines, the border of individual roots, their area, a geodesic ruler along each root, and a visual representation of the annotations and beacons (Supplemental Fig. S1).
Although invisible to the user, the separation between data layers and GUI layers disconnects the design of the GUI from any constraints relating to data structure (and vice versa) and has proven to be instrumental in the evolution of SmartRoot since its first implementation.
Root-Tracing Principles
SmartRoot features an automated individual root-tracing algorithm triggered by a mouse click anywhere along the root in the image source GUI layer. It determines the center (midline) of the root near the picked position and proceeds with the stepwise construction of a segmented line approximating the root midline, progressing forward and backward to the tip and base of the root. The algorithm estimates the root diameter at each node of the segmented line and uses this information to set the orientation of the segmented line (from the root base of the root tip). Afterward, a name is given to the root (the [r] coordinate [see above]). This interactive procedure is at the core of the sampling-based processing mentioned in the introduction.
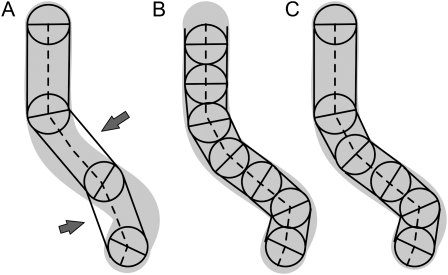
SmartRoot uses adaptive distances between nodes, increasing the node density for tiny roots and in curved regions of roots in order to maintain the accuracy of the segmented representation of the roots while minimizing the number of nodes (Fig. 2). Indeed, large roots tend to show smaller curvature than small ones and therefore can be represented with fewer nodes. The implementation of adaptive distances is detailed below (see step 1). As it is used hereafter, the term “node” denotes the intersection of successive segments of the segmented line. It is thus different from topological nodes referring to the branching points along the roots.
Figure 2.
Effect of the distance between nodes (circles) on the accuracy of the segmented line (dashed) approaching a curvilinear root object (gray area). A, Large and fixed distances between nodes. Arrows point to poorly represented regions of the root. B, Small and fixed distances between nodes. C, Adaptive internode distances lead to parsimonious segmented lines.
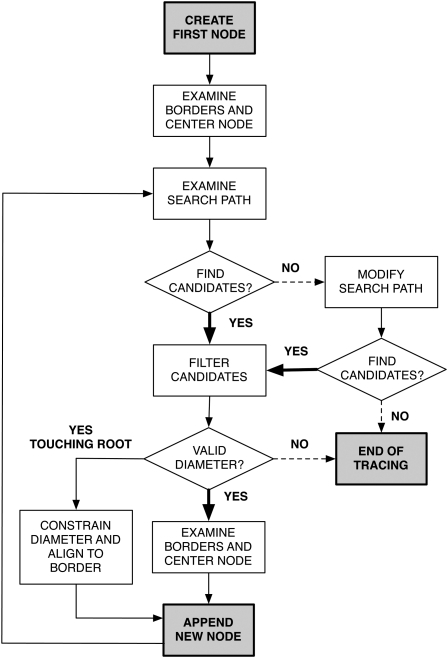
The optimal placement of nodes occurs during the segmented line construction and proceeds as follows (Fig. 3).
Figure 3.
Diagram of the SmartRoot tracing algorithm.
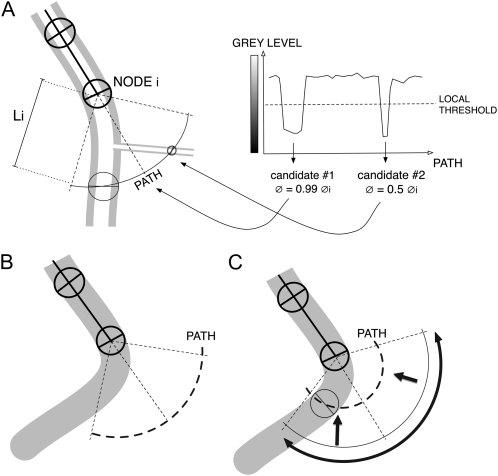
Step 1. Before adding a new node to the segmented line, the algorithm investigates the pixel values along a search path, consisting of an arc of circle centered on the current node and oriented opposite the previous node (Fig. 4A). The initial amplitude of the arc is set to 90° to increase the likelihood of finding the prolongation of the root while avoiding branches or neighboring roots. The initial radius of this arc is set at two times the diameter of the current node.
Figure 4.
Illustration of the stepwise construction of the segmented line. A, Pixel values are evaluated along a 90° arc centered in front of the last node (NODE i). The resulting profile is compared against a local threshold (see text). The candidate positions are filtered based on their diameter similarity with NODE i diameter (here, candidate 2 is excluded). Li, Initial radius. B, This algorithm fails when the root curvature is too strong. C, Increasing the amplitude and decreasing the radius of the arc allow the search algorithm to find the successor node.
Step 2. Pixel values along the search path are compared against a threshold value adjusted to local grayscale gradients (for details, see Supplemental PDF S1). If more than one candidate position is detected, the best one is selected based on diameter similarity with the current node (Fig. 4A).
Step 3. If the algorithm does not find a candidate position for the next node (Fig. 4B), it changes the search path amplitude to 120° and decreases the arc radius (Fig. 4C). If this fails, the algorithm considers that the end of the root has been reached and the tracing in that direction stops.
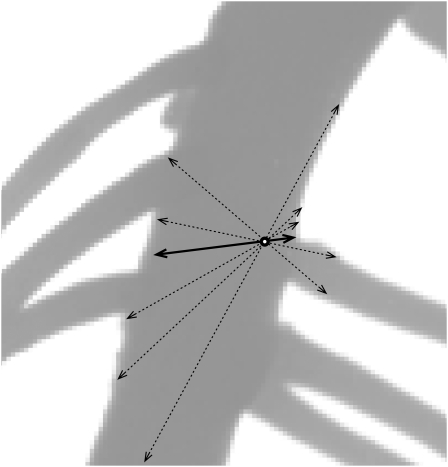
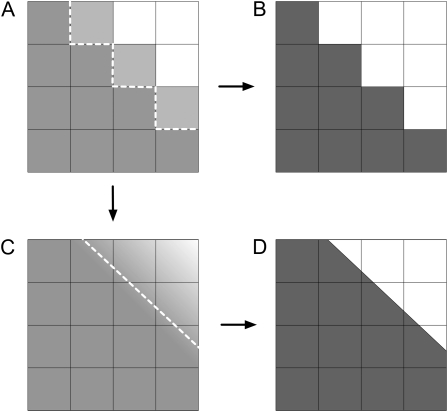
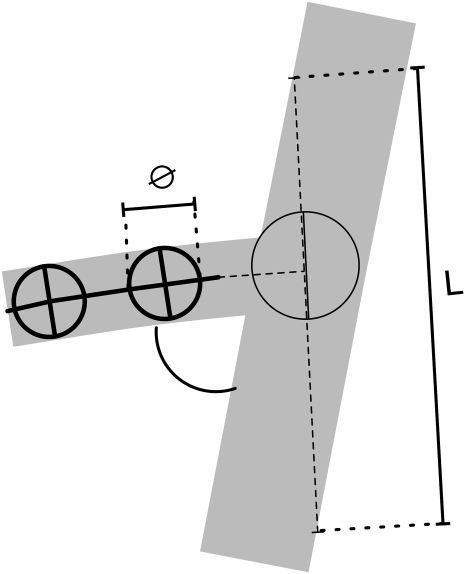
Step 4. The algorithm then seeks for multiple points (Fig. 5) along root borders near the candidate position to localize root borders with a subpixel resolution (comparing interpolated pixel values with the local threshold determined previously; Fig. 6). This procedure increases the accuracy of diameter estimation of tiny roots or in highly branched regions (for discussion of diameter estimation accuracy, see Supplemental PDF S2). The distance between borders at the candidate position is then tested against three conditions. If that distance is smaller than 0.8 times the diameter of the previous node, the tracing stops. This condition aims at finding the very end of thick roots, which have a long and cone-shaped apex. If that distance is larger than 1.5 times the diameter of the previous one, it is considered that a neighbor root has come into contact with the root being traced, thereby creating an apparent diameter increase. A new node with a diameter equal to that of the current node and aligned to the closest root border is then created (Supplemental Fig. S2). If that distance is larger than 4.0 times the diameter of the previous node (Fig. 7), the tracing stops. This condition occurs when the basipetal tracing of a lateral root reaches the junction with the parent root. The test may lead to different types of errors that are discussed in Supplemental PDF S3 but that can be easily corrected manually. Otherwise, a new node with a diameter equal to the interborder distance is created equidistant to the two borders.
Figure 5.
Illustration of the multipoint border search and centering algorithm. The white circle represents the initial position of the node. The dashed arrows represent the different trajectories used to find the root border. The solid arrow represents the shortest segment containing the node and joining root borders. This segment is used to estimate the local root diameter and to recenter the node on the root axis.
Figure 6.
Consequences of subpixel resolution on the variability of diameter estimation. A, Closeup of the original image, near the border of a root. The dashed line marks the position of the threshold limit between root and background pixels. B, Segmented image after discrete thresholding. C, Interpolation of gray levels in A generates a smooth transition between root and background pixels. The position of the threshold limit can be approximated locally with a line. D, Segmented image after thresholding of the interpolated image.
Figure 7.
Detection of root junctions. A sudden increase of the orthogonal distance between the end of the segment and the closest borders marks the termination of the segmented line construction (see text).
Newly created nodes are appended to the segmented line, and the construction proceeds until the algorithm stops. The parameters of the algorithm have been determined empirically using a wide range of RSA and image qualities. They can be taken as fairly generic, although they could still be optimized for specific images.
The user can edit the newly created root by simple drag-and-drop actions on the different nodes (e.g. adding, moving, deleting, or adjusting diameters). As the editing takes place in the nodes layer, it does not modify the source image and makes this operation very intuitive. Several roots can picked and traced at once by stretching a line-drawing tool across them.
Topology
Topological relationships can be set by attaching lateral roots to their parent. This information is used typically to calculate branching or insertion angles, positions of insertion, and interlateral distances. It is also very useful for monitoring the sequence of lateral root formation by individual parent roots in a series of time-lapse images. The topological information is also part of the specification of root types (primary, first order, etc.) and provides the shortest path connecting a root to the root-shoot junction.
Due to the large number of laterals along a parent root, SmartRoot features an algorithm to detect, trace, and attach most laterals of an already traced parent root (for discussion of tracing time of laterals, see Supplemental PDF S4).
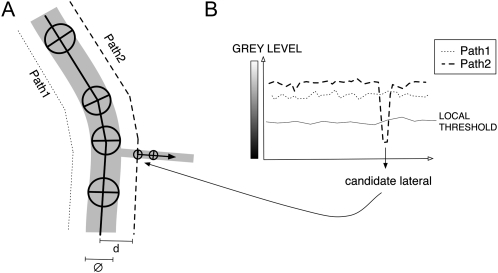
This algorithm creates a search path parallel to the root border at a distance arbitrarily set to the root diameter. Similar to the root-tracing algorithm, pixel values along this search path are compared against their local threshold value, and a new lateral root is created whenever a satisfying position is found (Fig. 8). For every new lateral built, a number of optional exclusion criteria (such as diameter, insertion angle, and length of the newly build root) are evaluated. This filtering reduces the number of false positives but may eventually lead to a small number of false negatives (missed laterals). Adjusting the settings of the filtering reduces significantly the number of errors.
Figure 8.
Lateral root detection algorithm. A, The algorithm creates search paths parallel to each root border at a distance arbitrarily set to the local root diameter (d = ∅). B, As for the root-tracing algorithm, pixel values along this search path are compared against their local threshold value, and a new lateral root is created whenever a satisfying position is found.
Root Annotations
The [r, d] coordinate system mentioned above enables the referencing of virtually any type of information with specific longitudinal positions along roots. This referencing is implemented in SmartRoot through annotation tools designed for various purposes. The study of cluster root formation given below illustrates this capability.
Annotations can be used to point to the most distant lateral along a root, whose distance to the tip can be used as a proxy to the root growth rate (Lecompte et al., 2001; Pagès et al., 2010). This annotation is automatically added/updated when a new most-distal lateral is added to a root. Annotations can be used in pairs to delineate regions along the root, as needed in experiments involving heterogenous nutrient supply, where a separate morphological analysis of regions submitted to different conditions is desirable. Annotations can also be used as simple beacons to request subsequent exportation of local information (direction, diameter, distance to the tip, path to the root system origin; see below). Finally, annotations can also be used as a generic, free text-commenting tool.
Time Series Analysis
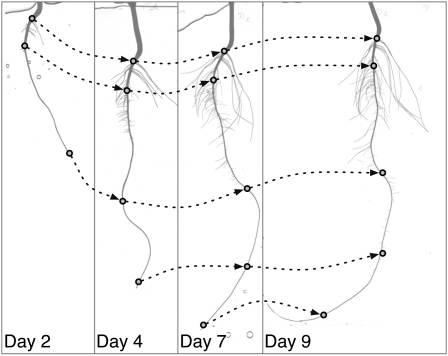
A major feature of SmartRoot is the ability to handle sequences of time-lapse images, thereby supporting root growth and development analyses. The general principle of time-lapse handling is that information stored across different images (e.g. annotation, branches, or length) and corresponding to different time points can be cross-linked, displayed on a single image (generally the last of the time series), and exported in a single database query (see below).
The merging of information across different images is performed in the [r, d] coordinates system and is therefore independent from Cartesian coordinates (Fig. 9). Therefore, SmartRoot has the ability to handle time-stamped images of root systems grown in liquid or air, where successive images are generally not superposable. This requires that the roots of interest be traced on every image of the image sequence and be coherently identified. As this can be tedious with complex images, the graphical user interface offers several intuitive viewing tools to navigate simultaneously along a root across different images.
Figure 9.
Analysis of time-lapse image sequences of plants grown in liquid or air medium (when root systems at different time points cannot be superposed). Corresponding positions are established based on the [r, d] coordinates (see text).
When plants are grown on solid medium (e.g. Arabidopsis [Arabidopsis thaliana] on agar plates), the root system structure is generally well conserved and is only augmented from one image to the next. In such cases, the tracings stored in a source image can be imported in a target image, either in a forward way, the imported tracings being augmented in the target image, or in a backward way, the imported tracings being cut or deleted to match the target image. If the source and seed images are not perfectly aligned, the root system structure of the source image can be registered on the target image through a linear transformation (translation and rotation) carried out using three user-specified landmarks (Thévenaz et al., 1998).
Data Handling
Information generated using SmartRoot can be exported as built-in tables to any SQL-compliant external database system for further analysis. This capability has been successfully used with Microsoft Access and MySQL database systems. At present, built-in tables include a table of node coordinates and diameter, a table of root global data (length and topological information), a table of annotations, and a table of root length densities (as shown in Table I). This basic set of information is generic enough to allow the computation of most variables used in root morphological analysis: growth, gravitropic behavior (tip angle as a function of time), wavy patterns (distance between positions having the same direction), radial growth (diameter as a function of longitudinal position and time), morphological response to localized or transient environments, lateral root density, etc. From a technical point of view, many of those variables can be accessed transparently using SQL views defined once in the external database system.
Table I. Built-in tables available for export in SmartRoot.
The root length density table is designed for rhizotron images acquired as described by Cheng et al. (1991) and Busch et al. (2006). ID, Identifier.
| Export Options | Export Data |
| Global root data (one record per root) | Image filename/root ID/length/surface/volume/branching order/topological position/number of children/branching density/[d] coordinates of first and last child on the root axis/insertion angle/[d] coordinate of the insertion point |
| All marks (one record per mark) | Image filename/[r,d] coordinates of the mark/annotation type/annotation value |
| Nodes data (one record per node) | Image filename/[r, d] coordinates/[x, y] coordinates/node diameter |
| Root length density | Image filename/[x, y] coordinates of the considered area/root length density in this area |
Image Requirements (Type and Quality)
Many aspects of image quality (including resolution, contrast, and background noise) are known to affect image processing output. Not surprisingly, the best results are obtained with high-resolution images as captured using a flat-bed (transparency) scanner. This technology potentially provides images of high quality (Smit et al., 2000) but is time consuming and may not be suitable for high-throughput image acquisition. Images of lower quality (e.g. camera photographs) can be analyzed with SmartRoot as long as roots are at least two to four pixels wide (for a discussion of accuracy, see Supplemental PDF S2). Due to the adaptive thresholding used by the tracing algorithm, background noise and contrast are usually not an issue. The software has been positively evaluated using images from different experimental setups, such as aeroponics, petri plates, or rhizotrons.
SmartRoot reads the most popular image file types (jpg, gif, tif, and bmp). Image processing is carried out in the grayscale space, with roots appearing darker than background. Color images are automatically transformed to grayscale, and gray level inversion can be performed if required.
Example 1: Architectural Analysis of Maize
We first illustrate the capabilities of SmartRoot with an architectural analysis as part of a modeling study of carbohydrate competition between the various root types of maize appearing during the first 2 weeks after germination.
SmartRoot was used to estimate growth and branching parameters (growth rates, lateral root density, interlateral distances, and branching angles) of the various maize root types (primary, seminal, crown, and first-order lateral roots; named after Hochholdinger et al. [2004]) in aeroponics.
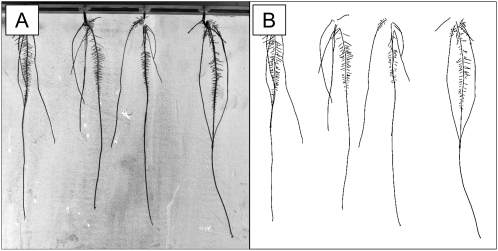
Twelve maize plants were grown in aeroponics, and their root system was photographed at daily intervals during 15 d. The resolution and quality of the images were low, with an uneven and noisy background (Fig. 10A). The primary, seminal, and crown roots were traced on each photograph of the time-lapse sequences using the line selection tools, and the laterals were traced only on the last photograph of the sequence using automated lateral root tracing (Fig. 10B). Two data sets were established: one containing time series of root length (primary and seminal), and a second containing a nearly complete architectural description of the root system at the end of the experiment.
Figure 10.
Analysis of 15-d-old maize root systems grown in aeroponics. A, Low-resolution source image from a CCD camera. B, Representation of root midlines after tracing.
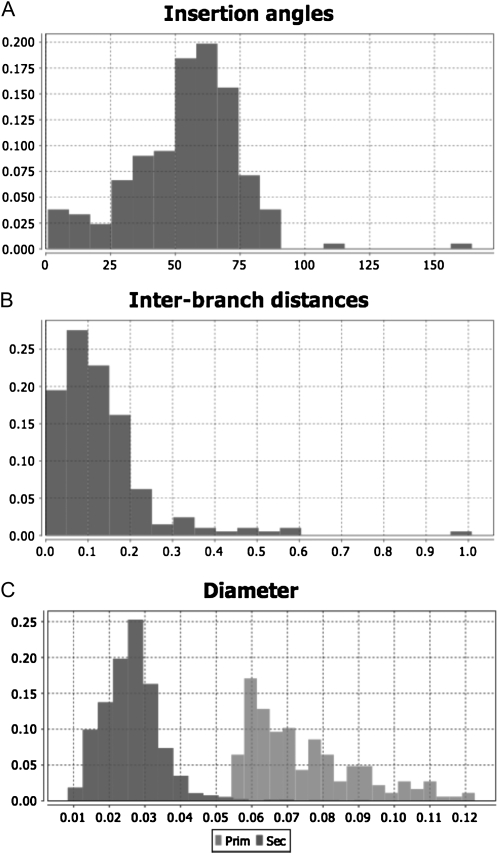
Using the first data set, the growth rates of the primary, seminal, and crown roots were calculated. Insertion angles (Fig. 11A), interbranch distances (Fig. 11B), root diameters (Fig. 11C), and the length of the apical unbranched zone were retrieved from the second data set. The growth rates of lateral roots were estimated with the SAS software (SAS Institute) based on their length, their position on the parent axis, and the growth rate of the parent axis (Hackett and Rose, 1972; Lecompte et al., 2001), assuming that lateral root initiation in maize is almost acropetal (Lloret and Casero, 2002). A summary of the architectural parameters is given in Table II.
Figure 11.
Histograms generated with the graph-builder tool box of SmartRoot (maize example). A, Insertion angles. B, Interbranch distances. C, Diameter (dark gray, first-order laterals; light gray, primary roots).
Table II. Summary of the architectural data of 15-d-old maize plants grown in aeroponics.
Values shown are means ± se. Crown roots were about 2 cm long at the end of the experiment and were not analyzed. LAUZ, Length of apical unbranched zone; LR, lateral root. Roots are named according to Hochholdinger et al. (2004). The growth rate of lateral roots is estimated in their linear growth phase. The validity of the insertion angle is questionable, since images are two-dimensional projections of three-dimensional root systems.
| Root Data | Value |
| Primary | |
| Growth rate (mm d−1) | 37.0 ± 0.2 |
| Diameter (mm) | 1.4 ± 0.3 |
| Branching density (LR cm−1) | 5.9 ± 2.3 |
| LAUZ (mm) | 146.8 ± 54.8 |
| Seminals | |
| Growth rate (mm d−1) | 31.0 ± 0.6 |
| Diameter (mm) | 0.9 ± 0.4 |
| Laterals | |
| Growth rate (mm d−1) | 0.6 ± 0.17 |
| Diameter (mm) | 0.48 ± 0.16 |
| Insertion angle (°) | 65.6 ± 14.3 |
These parameters (mean values and sd) were used to execute a root architecture model (RootTyp; Pagès et al., 2004) to simulate virtual and dynamic root systems useful for the carbohydrate competition analysis (data not shown).
This example made extensive use of SmartRoot tools supporting time-series and topological analyses. It illustrates the possibility of extracting an information-rich data set from very simple experiments, even with low-quality images.
Example 2: Time-Lapse Analysis of Cluster Root Formation in Lupin
This second example illustrates a sampling-based processing and the possibilities offered by the annotation tool. In several species, compact clusters of short roots, first described by Purnell (1960), are produced in discrete regions along first-order laterals, called proteoid roots. Cluster roots increase phosphorus acquisition and enhance the survival of these species on their native low-phosphorus soils (for review, see Shane and Lambers, 2005). Little is known about the acquisition of proteoid root identity or about the mechanisms that trigger the initiation of clusters along proteoid roots. It is currently thought that a systemic signal is involved, leading to discrete events of synchronous cluster root formation (Watt and Evans, 1999; Skene, 2000). In order to explore the temporal dynamics of cluster root formation and to identify growth and morphological features that are singular to proteoid roots, the root systems of 12 lupin plants grown in aeroponics were scanned at daily intervals during 16 d. The resulting time-lapse sequences have been analyzed with SmartRoot.
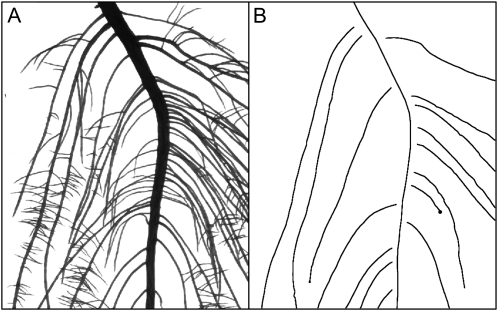
Despite the high quality of the images, carrying out this type of analysis using standard skeleton-based algorithms would be hampered by the high degree of root overlapping, unless a prohibitively long manual separation of roots was made prior to scanning. This, fortunately, is a typical situation where sampling parts of the root system would be a practical way to escape root separation while providing the data required (Fig. 12).
Figure 12.
Analysis of a 16-d-old lupin root system grown in aeroponics. A, High-resolution (600 dpi) source image from a flat-bed scanner. B, Representation of the midline of selected roots after tracing.
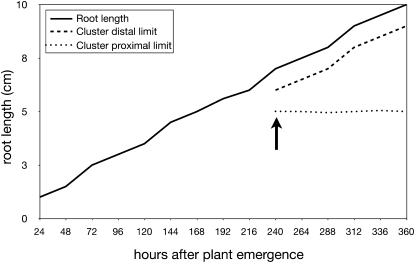
Thirty first-order lateral roots randomly selected on each plant were retraced in all images from their emergence until the end of the experiment. When a lateral turned out to be a proteoid root, the positions of its clusters were recorded over time using interval annotation tools (Fig. 13). The final data set comprised a set of information for individual lateral roots: length over time and diameter and position of the clusters (if any). This data set was exported to a Microsoft Access database and analyzed with the SAS software (SAS Institute).
Figure 13.
Evolution of a single proteoid root containing a single, long-lived root cluster (lupin example): length of the proteoid root (solid line), emergence of the root cluster (arrow), and evolution of the cluster boundaries (dashed lines).
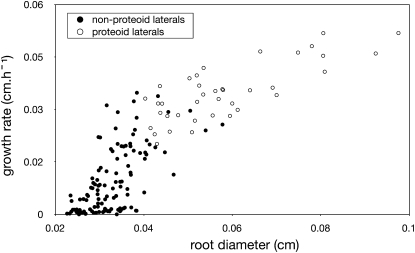
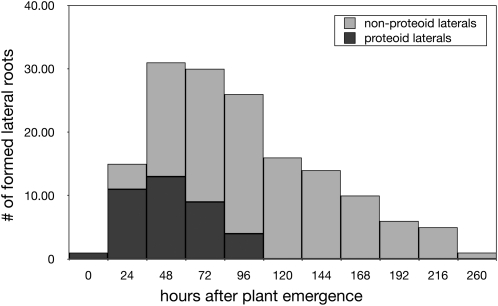
Significant differences were found between proteoid and nonproteoid roots for growth rates (0.76 and 0.27 cm d−1, respectively; P < 0.001, t test) and diameters (0.059 and 0.039 cm, respectively; P < 0.001, t test; Fig. 14). Besides, proteoid roots tended to form only during the first 4 d after germination, while nonproteiod root formation continued over time (Fig. 15). These morphological differences suggest that proteoid root identity is already established when the lateral root emerges from the primary root (or that roots with low growth potential lose the ability to form clusters).
Figure 14.
Relationship between growth rates and diameter of lateral roots (lupin example). A clear discrimination is seen between nonproteoid roots (white circles) and proteoid roots (black circles).
Figure 15.
Histogram of the timing of lateral root formation (lupin example). Proteoid roots are in dark gray and nonproteoid roots are in light gray.
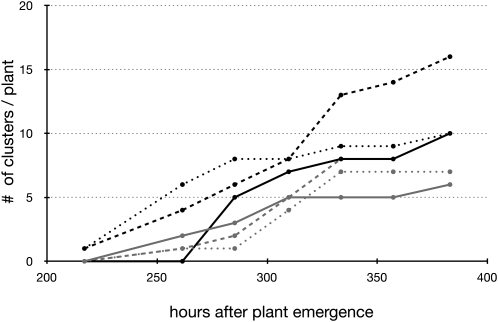
From the same data set, the number of clusters for individual plants was counted over time, with a temporal resolution of 1 d (Fig. 16). This analysis revealed a continuous pattern of cluster root formation at the plant level, which does not fully support the systemic signaling hypothesis, which states that cluster formation should occur in flushes. However, the temporal resolution of our analysis does not allow us to exclude the possibility of the synchronous formation of clusters with a daily (or subdaily) frequency.
Figure 16.
Sequence of cluster root formation (cumulative; lupin example). The graph shows the emergence of new clusters on proteoid roots of six different plants.
Several features of SmartRoot have been instrumental in this experiment: the annotation tools to export cluster boundaries; the sampling-based processing to enable the analysis of images overcrowded in roots; and the viewing tools for the reliable identification of the selected laterals throughout the image sequence.
CONCLUSION
We have presented a novel software supporting in-depth characterization of root morphology, geometry, and topology from images or time-lapse image sequences. The software uses several algorithms designed for root tracing and has been validated on a wide range of image spatial resolution, noise, and contrast. The strengths and weaknesses of SmartRoot are listed in Table III and discussed below.
Table III.
Summary of the strengths and weaknesses of SmartRoot
| Weaknesses | Strengths |
| Lack of global parameters | Sampling-based analysis |
| Time of user interaction (depending on depth of analysis) | Low requirements (on image quality, plant type, or age) |
| Batch analysis not supported | Time-series handling |
| Color management not supported | Annotation |
| Vector-based representation of roots | |
| Database connection | |
| Platform independent | |
| Highly interactive |
Currently available imaging tools developed for the analysis of RSA share the same type of work flow: automated analysis followed (sometimes) by manual editing. This strategy lends itself to medium- to high-throughput handling of root images but tends to be restrictive on the complexity of the root systems that can be analyzed. With branched root systems presenting a large degree of overlap, the user has to manipulate individual roots in the scanner tray prior to scanning or perform an intensive editing of the root skeleton. This reduces the throughput of the analysis and ultimately leads to restricting root studies to the young seedling stage.
The design of SmartRoot was largely influenced by Yoav Waisel’s perspective that root systems consist of populations of roots of different types, ages, and topological and spatial locations (Waisel and Eshel, 2002). The focus, therefore, was placed on individual root behavior rather than on cumulated variables that are more difficult to interpret. Here, we introduce an innovative type of work flow, based on root system sampling at the time of image analysis. With this approach, manipulating roots prior to imaging is no longer required, since parts of the root system where image quality or root overlapping would preclude accurate analysis or imply intensive editing can simply be discarded. The analysis can also be focused on specific root types, which may not be easily recognized by an algorithm or can be performed stepwise, starting with an evaluation of inexpensive variables and proceeding with deeper analysis only where needed. Therefore, the throughput of image processing using SmartRoot will depend on the type of root system, the quality of the image, and the desired information (for an evaluation of processing time, see Supplemental PDF S4). A direct consequence of this sampling strategy is an inability to estimate variables such as total root length, at which most root analysis software are usually very good.
A further innovation of SmartRoot, compared with many root-imaging software, is the vectorial representation of roots. This representation enables the most useful capabilities/features of the software that support the sampling strategy: intuitive editing and annotation; navigation in a time-lapse sequence of nonsuperposable images; and an object-oriented data structure allowing an explicit topological description of root systems.
A classical issue in the analysis of root system images is the discrimination between root branching and root overlapping. Initially, this issue attracted attention because overlaps create biases in the estimation of the total root length (Arsenault et al., 1995). The problem becomes more complicated if the scope of the analysis extends to the recognition of individual roots, in which case the crossing root segments must also be correctly connected. All software that we know, including SmartRoot, attempt to recognize a finite list of situations, which they handle in an approximate way. There remains here an important area for the development of more generic algorithms integrating, for instance, advances in neurone imaging.
There are increasing reports of using color images to ease the separation of roots from extraneous objects on the image (substrate particles) or to analyze root health. SmartRoot currently lacks color management; however, the multilayer approach will make it easy to implement the stacking of additional raster layers, providing data in other ranges of the electromagnetic spectrum (mainly visible and fluorescence).
To some extent, further developments may come from biomedical imaging, where neuron-tracing and cell-tracking algorithms have become popular (Meijering et al., 2004). Indeed, neurons and root systems share a similar tree-like structure, and the displacement of cells shows parallel behaviors with growing root meristems. Preliminary testing indicates that those methods are not directly applicable on root images, which are very different from those obtained in the biomedical sciences. However, tracing and tracking tools used for neurons and cells rely on different image-analysis concepts, and those are worth being investigated in the root domain.
SmartRoot is a platform-independent freeware available at www.uclouvain.be/en-smartroot.
MATERIALS AND METHODS
Experience 1
Maize plants (Zea mays, genotype B73) were grown an aeroponic system (de Dorlodot et al., 2005) with a modified Hoagland solution (doubled iron content). The images, seven megapixels in size, were taken with a regular CCD camera (Canon EOS 450D) every 2 d in a small black chamber built inside the greenhouse.
Experience 2
Lupin plants (Lupinus albus) were grown in an aeroponic system (de Dorlodot et al., 2005) with the same nutrient solution used by Johnson et al. (1994). Daily images were taken during 16 d with a flat-bed scanner (Microtek 9600XL) at a resolution of 300 dpi.
Supplemental Data
The following materials are available in the online version of this article.
Supplemental Figure S1. Display option in SmartRoot.
Supplemental Figure S2. How does the SmartRoot tracing algorithm deal with touching roots?
Supplemental PDF S1. Adaptive thresholding algorithm.
Supplemental PDF S2. SmartRoot accuracy estimation.
Supplemental PDF S3. Handling root crossing.
Supplemental PDF S4. SmartRoot tracing time estimation.
Acknowledgments
We thank Hélène Cordonnier, Tristan Lavigne, Aurélie Babé, and Geoffrey Berguet for their extensive use of SmartRoot during its development. We also thank Lionel Dupuy, Tony Pridmore, and anonymous referees for their constructive comments on previous versions of the manuscript.
References
- Armengaud P, Zambaux K, Hills A, Sulpice R, Pattison RJ, Blatt MR, Amtmann A. (2009) EZ-Rhizo: integrated software for the fast and accurate measurement of root system architecture. Plant J 57: 945–956 [DOI] [PubMed] [Google Scholar]
- Arsenault J-L, Poulcur S, Messier C, Guay R. (1995) WinRHlZO, a root-measuring system with a unique overlap correction method. HortScience 30: 906 [Google Scholar]
- Busch J, Mendelssohn IA, Lorenzen B, Brix H, Miao S. (2006) A rhizotron to study root growth under flooded conditions tested with two wetland Cyperaceae. Flora 201: 429–439 [Google Scholar]
- Cheng W, Coleman DC, Box JE. (1991) Measuring root turnover using the minirhizotron technique. Agric Ecosyst Environ 34: 261–267 [Google Scholar]
- Clark R, MacCurdy R, Jung J, Shaff J, McCouch SR, Aneshansley D, Kochian L. (2011) Three-dimensional root phenotyping with a novel imaging and software platform. Plant Physiol 156: 455–465 [DOI] [PMC free article] [PubMed] [Google Scholar]
- de Dorlodot S, Bertin P, Baret P, Draye X. (2005) Scaling up quantitative phenotyping of root system architecture using a combination of aeroponics and image analysis. Asp Appl Biol 73: 41–54 [Google Scholar]
- de Dorlodot S, Forster B, Pagès L, Price A, Tuberosa R, Draye X. (2007) Root system architecture: opportunities and constraints for genetic improvement of crops. Trends Plant Sci 12: 474–481 [DOI] [PubMed] [Google Scholar]
- De Smet I, Zhang H, Inzé D, Beeckman T. (2006) A novel role for abscisic acid emerges from underground. Trends Plant Sci 11: 434–439 [DOI] [PubMed] [Google Scholar]
- Draye X, Kim Y, Lobet G, Javaux M. (2010) Model-assisted integration of physiological and environmental constraints affecting the dynamic and spatial patterns of root water uptake from soils. J Exp Bot 61: 2145–2155 [DOI] [PubMed] [Google Scholar]
- French A, Ubeda-Tomás S, Holman TJ, Bennett MJ, Pridmore T. (2009) High-throughput quantification of root growth using a novel image-analysis tool. Plant Physiol 150: 1784–1795 [DOI] [PMC free article] [PubMed] [Google Scholar]
- Ge Z, Rubio G, Lynch JP. (2000) The importance of root gravitropism for inter-root competition and phosphorus acquisition efficiency: results from a geometric simulation model. Plant Soil 218: 159–171 [DOI] [PubMed] [Google Scholar]
- Hackett C, Rose D. (1972) A model of the extension and branching of a seminal root of barley, and its use in studying relations between root dimensions. I. The model. Aust J Biol Sci 25: 681–690 [Google Scholar]
- Hammer G, Dong Z, Mclean G, Doherty A, Messina C, Schussler J, Zinselmeier C, Paszkiewicz S, Cooper M. (2009) Can changes in canopy and/or root system architecture explain historical maize yield trends in the U.S. Corn Belt? Crop Sci 49: 299–312 [Google Scholar]
- Hochholdinger F, Park WJ, Sauer M, Woll K. (2004) From weeds to crops: genetic analysis of root development in cereals. Trends Plant Sci 9: 42–48 [DOI] [PubMed] [Google Scholar]
- Hodge A, Berta G, Doussan C, Merchan F, Crespi M. (2009) Plant root growth, architecture and function. Plant Soil 321: 153–187 [Google Scholar]
- Hund A, Trachsel S, Stamp P. (2009) Growth of axile and lateral roots of maize. I. Development of a phenotying platform. Plant Soil 325: 335–349 [Google Scholar]
- Iyer-Pascuzzi AS, Symonova O, Mileyko Y, Hao Y, Belcher H, Harer J, Weitz JS, Benfey PN. (2010) Imaging and analysis platform for automatic phenotyping and trait ranking of plant root systems. Plant Physiol 152: 1148–1157 [DOI] [PMC free article] [PubMed] [Google Scholar]
- Jahnke S, Menzel MI, van Dusschoten D, Roeb GW, Bühler J, Minwuyelet S, Blümler P, Temperton VM, Hombach T, Streun M, et al. (2009) Combined MRI-PET dissects dynamic changes in plant structures and functions. Plant J 59: 634–644 [DOI] [PubMed] [Google Scholar]
- Johnson JF, Allan DL, Vance CP. (1994) Phosphorus stress-induced proteoid roots show altered metabolism in Lupinus albus. Plant Physiol 104: 657–665 [DOI] [PMC free article] [PubMed] [Google Scholar]
- Le Bot J, Serra V, Fabre J, Draye X, Adamowicz S, Pagès L. (2010) DART: a software to analyse root system architecture and development from captured images. Plant Soil 326: 261–273 [Google Scholar]
- Lecompte F, Ozier-Lafontaine H, Pagès L. (2001) The relationships between static and dynamic variables in the description of root growth: consequences for field interpretation of rooting variability. Plant Soil 236: 19–31 [Google Scholar]
- Lloret PG, Casero PJ. (2002) Lateral root initiation. Waisel Y, Eshel A, Kafkafi U, , Plant Roots: The Hidden Half, Ed 3. Marcel Dekker, New York, pp 127–155 [Google Scholar]
- Lynch J. (1995) Root architecture and plant productivity. Plant Physiol 109: 7–13 [DOI] [PMC free article] [PubMed] [Google Scholar]
- Meijering E, Jacob M, Sarria JCF, Steiner P, Hirling H, Unser M. (2004) Design and validation of a tool for neurite tracing and analysis in fluorescence microscopy images. Cytometry A 58: 167–176 [DOI] [PubMed] [Google Scholar]
- Naeem A, French AP, Wells DM, Pridmore TP. (2011) High-throughput feature counting and measurement of roots. Bioinformatics 27: 1337–1338 [DOI] [PubMed] [Google Scholar]
- Pagès L, Serra V, Draye X, Doussan C, Pierret A. (2010) Estimating root elongation rates from morphological measurements of the root tip. Plant Soil 328: 35–44 [Google Scholar]
- Pagès L, Vercambre G, Drouet J-L, Lecompte F, Collet C, LeBot J. (2004) RootTyp: a generic model to depict and analyse the root system architecture. Plant Soil 258: 103–119 [Google Scholar]
- Péret B, De Rybel B, Casimiro I, Benková E, Swarup R, Laplaze L, Beeckman T, Bennett MJ. (2009) Arabidopsis lateral root development: an emerging story. Trends Plant Sci 14: 399–408 [DOI] [PubMed] [Google Scholar]
- Purnell HM. (1960) Studies of the family Proteaceae. I. Anatomy and morphology of the roots of some Victorian species. Aust J Bot 8: 38–50 [Google Scholar]
- Rasband WS. (2011) ImageJ. U.S. National Institutes of Health, Bethesda, MD: http://imagej.nih.gov/ij/ (July 29, 2011) [Google Scholar]
- Regent Instruments (2011) Win Rhizo Tron. http://www.regentinstruments.com/products/rhizo/RHIZOTron.html (July 29, 2011)
- Shane MW, Lambers H. (2005) Cluster roots: a curiosity in context. Plant Soil 274: 101–125 [Google Scholar]
- Skene KR. (2000) Pattern formation in cluster roots: some developmental and evolutionary considerations. Ann Bot (Lond) 85: 901–908 [Google Scholar]
- Smit AL, Bengough AG, Engels C, Noordwijk MV, Pellerin S, van de Geijn SC. (2000) Root Methods: A Handbook. Springer-Verlag, Berlin [Google Scholar]
- Thévenaz P, Ruttimann UE, Unser M. (1998) A pyramid approach to subpixel registration based on intensity. IEEE Trans Image Process 7: 27–41 [DOI] [PubMed] [Google Scholar]
- Waisel Y, Eshel A. (2002) Functional diversity of various constituents of a single root system. Waisel Y, Eshel A, Kafkafi U, , Plant Roots: The Hidden Half, Ed 3. Marcel Dekker, New York, pp 157–175 [Google Scholar]
- Watt M, Evans JR. (1999) Proteoid roots: physiology and development. Plant Physiol 121: 317–324 [DOI] [PMC free article] [PubMed] [Google Scholar]
- Yazdanbakhsh N, Fisahn J. (2009) High throughput phenotyping of root growth dynamics, lateral root formation, root architecture and root hair development enabled by PlaRoM. Funct Plant Biol 36: 938–946 [DOI] [PubMed] [Google Scholar]


