

Abstract
RNase E is a key regulatory enzyme that controls the principal pathway for mRNA degradation in Escherichia coli. The cellular concentration of this endonuclease is governed by a feedback mechanism in which RNase E tightly regulates its own synthesis. Autoregulation is mediated in cis by the 361-nucleotide 5′ untranslated region (UTR) of rne (RNase E) mRNA. Here we report the determination of the secondary structure of the rne 5′ UTR by phylogenetic comparison and chemical alkylation, together with dissection studies to identify the 5′ UTR element that mediates autoregulation. Our findings reveal that the structure and function of the rne 5′ UTRs are evolutionarily well conserved despite extensive sequence divergence. Within the rne 5′ UTRs are multiple RNA secondary structure elements, two of which function in cis to mediate feedback regulation of rne gene expression. The more potent of these two elements is a stem–loop structure containing an internal loop whose sequence is the most highly conserved of any region of the rne 5′ UTR. Our data show that this stem–loop functions as a sensor of cellular RNase E activity that directs autoregulation by modulating the degradation rate of rne mRNA in response to changes in RNase E activity.
Keywords: RNase E, mRNA degradation, autoregulation, RNA secondary structure, phylogenetic comparison, E. coli
Messenger RNA degradation is an important mechanism for controlling gene expression in all organisms. The lifetimes of mRNAs can differ significantly within a single cell, and these longevity differences have a direct effect on message concentrations. In Escherichia coli, for example, distinct mRNAs may differ in stability by as much as two orders of magnitude, with half-lives ranging from a fraction of a minute to as long as an hour (Belasco 1993). In addition, the longevity of individual transcripts can vary significantly in response to environmental cues.
The degradation of most mRNAs in E. coli is thought to begin with cleavage at internal sites by RNase E (Apirion 1978; Ono and Kuwano 1979; Mudd et al. 1990; Babitzke and Kushner 1991; Melefors and von Gabain 1991; Taraseviciene et al. 1991). This endonuclease shows a preference for cleaving AU-rich sequences within single-stranded regions of RNA (Lin-Chao et al. 1994; McDowall et al. 1994), and most mRNAs (both short- and long-lived) appear to contain multiple sites where RNase E cleavage can occur. RNase E exists in E. coli as a component of the RNA degradosome, a multienzyme RNA-degradation complex that also contains a 3′ exoribonuclease (polynucleotide phosphorylase), an RNA helicase (RhlB), a glycolytic enzyme (enolase), and possibly other components (Carpousis et al. 1994; Miczak et al. 1996; Py et al. 1996).
RNase E is essential for cell viability, and either its underproduction or its overproduction can impair cell growth (Apirion 1978; Claverie-Martin et al. 1991; C. Jain and J. Belasco, unpubl.). To maintain RNase E near its optimal cellular concentration, E. coli cells have evolved an autoregulatory mechanism for controlling the synthesis of this important ribonuclease (Mudd and Higgins 1993; Jain and Belasco 1995). This mechanism involves changes in the longevity of the RNase E (rne) gene transcript, whose half-life (normally ∼1 min) varies in response to the level of RNase E activity (Jain and Belasco 1995). Thus, a 21-fold increase in rne gene dosage results in only a 2.8-fold increase in the cellular concentration of RNase E due to accelerated degradation of rne mRNA. Conversely, insufficient RNase E activity can increase the lifetime of the rne transcript by as much as an order of magnitude. Compared with other E. coli genes, rne expression appears to be unusually sensitive to the level of RNase E activity within the cell (Jain and Belasco 1995).
Feedback regulation of rne gene expression is mediated in cis by the rne 5′ untranslated region (UTR), which can confer this property onto heterologous transcripts to which it is fused (Jain and Belasco 1995). For example, whereas production of β-galactosidase from the E. coli lacZ gene is relatively insensitive to cellular RNase E activity, its production from an rne–lacZ gene fusion bearing the 361-nucleotide rne 5′ UTR and the first 28 codons of the rne protein-coding region is strongly influenced by the level of RNase E activity in E. coli. This pronounced effect of RNase E on rne–lacZ expression requires an intact rne 5′ UTR. As expected, RNase E exerts a corresponding influence on the longevity of the rne–lacZ transcript, whose half-life parallels that of rne mRNA in cells containing various levels of RNase E activity (Jain and Belasco 1995).
To begin to elucidate the mechanism by which RNase E regulates its own synthesis, we set out to identify the unique features of the rne 5′ UTR that mediate this effect. Here we report an investigation of the secondary structure of the rne 5′ UTR by phylogenetic analysis and chemical alkylation. In addition, we describe the mapping of regulatory elements within the rne 5′ UTR by genetic dissection. These data reveal that an evolutionarily conserved RNA stem–loop within this UTR is the element principally responsible for directing feedback regulation of rne gene expression and that it acts by varying the rate of rne mRNA degradation in response to changes in cellular RNase E activity.
Results
Phylogenetic analysis of the secondary structure of the rne 5′ UTR
To investigate the secondary structure of the E. coli rne 5′ UTR, we elected to use phylogenetic analysis, a powerful and reliable method based on sequence comparison that has proven to be the most useful procedure for determining the higher-order structure of large RNAs (Noller and Woese 1981; Schnare et al. 1996). The principle underlying this analytical method is that RNA base pairing with an important biological function is maintained during evolution despite sequence divergence. The hallmark of an important region of secondary structure is the occurrence of covariation, in which compensatory changes in each strand of an RNA duplex preserve the potential for base pairing among homologous RNAs in diverse organisms. In contrast, if related RNAs in different species do not share the potential to form a particular base-paired structure, then this structural element either does not form in vivo or is functionally unimportant.
We first examined rne transcriptional units whose sequence had already been determined. Complete genomic sequences are available for the γ-purple bacteria E. coli and Haemophilus influenzae. The amino-terminal half (residues 1–506) of the Haemophilus RNase E protein shares a high degree of sequence homology with its E. coli counterpart (83% amino acid identity). However, the 5′ UTRs of the E. coli and Haemophilus rne genes have diverged too far to allow meaningful sequence alignment. It was therefore necessary to determine the sequence of the rne 5′ UTR from several bacterial species more closely related to E. coli, yet not so closely related as to preclude an informative degree of sequence covariation. To isolate these DNAs, we devised a strategy based on PCR, relying on the knowledge that the protein-coding regions of the rne gene and the upstream yceC gene in E. coli and H. influenzae have diverged much more slowly during evolution than the intergenic sequence containing the rne 5′ UTR. This made it possible to design PCR primers complementary to conserved sequences within the rne and yceC coding regions of E. coli and Haemophilus, with the expectation that these primers would allow the amplification of the diverged rne–yceC intergenic region from related bacterial species.
By use of this PCR strategy, the 5′ noncoding region of the rne gene was amplified from genomic DNA extracted from E. coli, Serratia marcescens, Yersinia pseudotuberculosis, Erwinia carotovora, and Providencia alcalifaciens. The high degree of sequence conservation in the rne promoter and protein-coding region allowed the 5′ and 3′ boundaries of each rne 5′ UTR to be defined by comparison with the known boundaries of the E. coli rne 5′ UTR (Fig. 1). In addition, primer extension mapping with reverse transcriptase confirmed the location of the 5′ terminus of the Providencia rne transcript (data not shown), whose sequence is the most evolutionarily diverged among these mRNAs. Compared with that of E. coli, considerable sequence divergence was evident for the rne 5′ UTR of Serratia (29%), Yersinia (32%), Erwinia (33%), and Providencia (52%). (Entirely unrelated sequences would be expected to diverge by ∼75%.)
Figure 1.

Alignment of rne gene sequences. The sequence of the promoter region, the beginning and end of the 5′ UTR, and the first 21 nucleotides of the coding region are shown for the rne genes from six different bacterial species. The conserved −35 and −10 promoter elements are enclosed in boxes, as are abbreviated representations of the rne 5′ UTR sequences, which are each 0.3–0.4 kb in length. The amino acid residues specified by the first seven codons of all six rne genes are indicated (single-letter code). The 5′ end of the E. coli rne transcript has been mapped previously by primer extension analysis (Jain and Belasco 1995).
Potential base-paired conformations of these 5′ UTRs were examined to identify a secondary structure common to all five of them. As shown in Figure 2, all of these RNA segments can fold in a remarkably similar fashion despite their substantial sequence divergence. This phylogenetic analysis indicates that the rne 5′ UTR contains three imperfect stem–loop structures (hp1, hp2, and hp3). One of the stem–loops (hp3) has a complex multipartite structure that comprises four stems emanating from a single internal loop. Each of the stem–loops is followed by a single-stranded spacer (ss1, ss2, and ss3), the last of which (ss3) contains the signals for translation initiation (the Shine-Dalgarno element and initiation codon). In addition, the exceptionally long 5′ UTR of the Providencia transcript (425 nucleotides) has the potential to form a fourth base-paired structure between hp1 and hp2. Sequence alignment has identified multiple covarying base pairs in each of the three conserved stem–loop structures, including all four subdomains of hp3, evidence that strongly supports the formation of these stem–loops. With one limited exception (see below), other possible secondary structures suggested by computer-aided free-energy calculations are not phylogenetically conserved and are therefore not likely to form in vivo.
Figure 2.
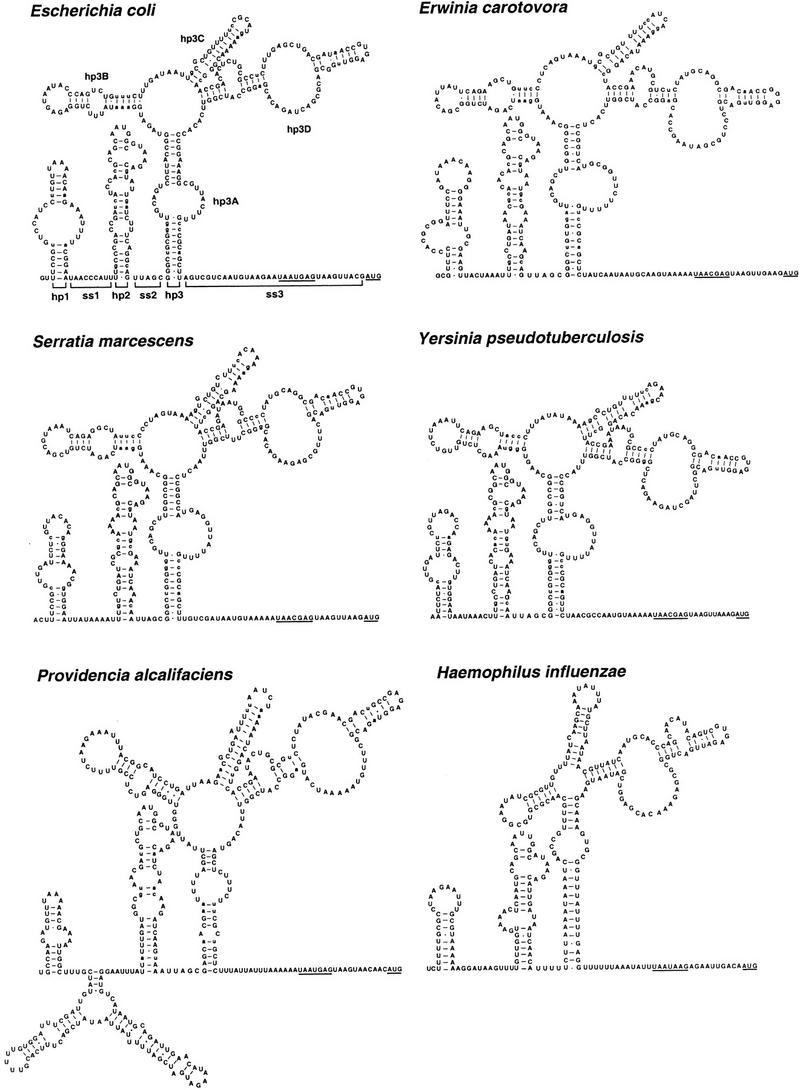
Secondary structure of the rne 5′ UTR. Phylogenetically conserved secondary structures are shown for the 5′ UTR of the rne transcripts of E. coli, S. marcescens, Y. pseudotuberculosis, E. carotovora, and P. alcalifaciens. Also shown is a closely related structure deduced for the rne 5′ UTR from H. influenzae. Brackets delineate the boundaries of the various structural domains (hp1, ss1, hp2, ss2, hp3, ss3) within the E. coli rne 5′ UTR. For each message, the Shine-Dalgarno element and initiation codon are underlined. Base pairs observed to covary are shown in lowercase letters. The high degree of sequence divergence for certain regions of the rne 5′ UTR from some bacterial species (hp1 of E. carotovora, hp1 and hp3B of P. alcalifaciens, and the entire 5′ UTR of H. influenzae) precluded reliable sequence alignment and an assessment of covariation. Therefore, covarying base pairs are not indicated for the nonalignable 5′ UTR regions from these species. Because the additional base-paired structure in the rne 5′ UTR of P. alcalifaciens is absent from the other species, its conformation is uncertain.
To test this structural model, we re-examined the 299-nucleotide 5′ UTR of the rne transcript of H. influenzae. The sequence of this RNA segment has diverged so far from that of E. coli that a meaningful sequence alignment had been previously impossible. Nonetheless, it too has the potential to adopt an overall secondary structure that is strikingly similar to that of the other rne transcripts (Fig. 2). The predictive power of the secondary structure deduced by phylogenetic comparison lends strong support to this structural model.
Chemical probing of the secondary structure of the rne 5′ UTR
To corroborate the structural model determined by phylogenetic comparison, each nucleotide of the E. coli rne 5′ UTR was probed by chemical modification with alkylating agents whose reactivity is sensitive to base pairing. Dimethylsulfate (DMS) methylates unpaired adenosine residues at N1 and unpaired cytidine residues at N3 (Moazed et al. 1986). Because DMS can penetrate cell membranes and enter the cytoplasm, it can be used to probe the secondary structure of mRNAs in their natural milieu. In contrast, 1-cyclohexyl-3-(2-morpholinoethyl)carbodiimide metho-p-toluenesulfonate (CMCT), which cannot enter cells, alkylates unpaired uridine residues at N3 and, to a lesser extent, unpaired guanosine residues at N1 (Moazed et al. 1986). Nucleotides engaged in Watson–Crick base pairing are protected from alkylation by these reagents due to the involvement of the specified nitrogen atoms in hydrogen bonds. Sites of alkylation can be readily mapped, as these base modifications block primer extension with reverse transcriptase by preventing nucleotide incorporation opposite the modified base.
Chemical modification was performed on a hybrid transcript (ez1) comprising the 5′ UTR and first 181 codons of rne fused in-frame to lacZ. The greater abundance of the plasmid-encoded ez1 transcript made it a useful surrogate for structural analysis. Owing to the presence of the E. coli rne 5′ UTR, this hybrid transcript is indistinguishable from rne mRNA in its sensitivity to feedback regulation by RNase E (Jain and Belasco 1995). To boost the ez1 mRNA concentration further, the experiments were performed using RNA from E. coli host cells (CH1828) that produce a mutant form of RNase E defective in feedback regulation. E. coli CH1828 cells containing the ez1 gene on a multicopy plasmid (pEZ101) were grown to mid-log phase at 37°C, and total cellular RNA was harvested either without pretreatment or after treating the cells with DMS. RNA from the untreated cells was alkylated in vitro with DMS or CMCT. Primer-extension mapping of the sites of alkylation within the long rne 5′ UTR (361 nucleotides) required the use of five different end-labeled primers. As a control, an additional primer extension reaction was performed in each case with an unalkylated RNA sample to identify natural sites of pausing or premature termination by reverse transcriptase.
A representative primer extension gel is shown in Figure 3A. The similarity of the methylation patterns observed for RNA samples treated with DMS in vivo and in vitro (apart from expected differences in band intensities) indicates that the rne 5′ UTR retains its native conformation upon extraction from cells, thereby validating the CMCT data, which could be obtained only by in vitro alkylation of extracted RNA. Natural sites of pausing by reverse transcriptase were particularly prevalent at guanosine residues, which also were inefficiently alkylated by CMCT, thereby preventing an independent assessment of the base-pairing status of these residues.
Figure 3.


Alkylation analysis of the E. coli rne 5′ UTR. (A) Representative analysis of a segment of the E. coli rne 5′ UTR by chemical alkylation. Total cellular RNA was isolated from an exponential culture of E. coli strain CH1828 containing plasmid pEZ101 after treating an aliquot of the culture with DMS. In addition, samples of RNA extracted from an untreated culture were alkylated in vitro with DMS or CMCT. Sites of alkylation within the ez1 5′ UTR were mapped by primer extension using AMV reverse transcriptase and various 5′ end-labeled DNA primers. The resulting extension products were then analyzed by gel electrophoresis beside sequencing ladders that were generated by extension of the same 5′ end-labeled primer on an ez1 DNA template. The sequencinglanes (lanes G,A,U,C) are labeled to indicatethe sequence of the RNA, not the complementary DNA. Blockage of primer extension by an alkylated RNA base results in the production of a complementary DNA fragment one nucleotide shorter than that arising from incorporation of a dideoxynucleotide opposite the same base. Calibration is in nucleotides from the ez1 5′ end. Unalkylated RNA (lane −) served as a negative control to identify primer extension products unrelated to alkylation. The degree of chemical modification can be difficult to assess at sites where it is no greater than the basal level of termination by reverse transcriptase on an unalkylated RNA template. CMCT did not react well with guanosine nucleotides, precluding a direct assessment of base pairing by those residues. (B) Summary of the alkylation data obtained for the entire rne 5′ UTR. (●) Heavy alkylation; (▴) moderate alkylation. At the few positions where there was a discrepancy between the in vivo and in vitro DMS alkylation data, the score reflects the reactivity of the nucleotides in vivo. The boundaries of structural domains are delineated by brackets, and the Shine-Dalgarno element and initiation codon are underlined. A caret marks the site of insertion of a cytidylate residue to create the BsrGI site (TGTACA) of pEZ1000. Arrows indicate the boundaries of 5′ UTR deletions made subsequently (see Fig. 4).
Superposition of the alkylation data on the phylogenetically determined structure of the E. coli rne 5′ UTR (Fig. 3B) indicates a high degree of correlation between nucleotides that are alkylated and those thought from phylogenetic evidence to be unpaired. Moreover, little alkylation was observed for nucleotides in double-stranded regions. As expected, a number of unpaired residues appeared resistant to alkylation. This common phenomenon probably reflects chemical inaccessibility resulting from higher order structure (e.g., non-Watson–Crick base pairing) or difficulty in scoring sites of natural pausing by reverse transcriptase. Although the most reactive bases mapped almost exclusively to single-stranded regions, some nucleotides thought to be base paired were moderately reactive, particularly A-U and G-U pairs adjacent to single-stranded regions. Such reactivity is often observed for nucleotide pairs located at the ends of double helices (Chen et al. 1991), where breathing (transient separation) of terminal base pairs may occur. Overall, the alkylation data are consistent with the secondary structure determined phylogenetically for the 5′ UTR of the E. coli rne transcript.
Substitution and deletion analysis of the rne 5′ UTR
Previous studies have indicated that the rne 5′ UTR acts in cis to mediate RNase E autoregulation (Jain and Belasco 1995). To determine whether not only the structure but also the regulatory function of the rne 5′ UTR is evolutionarily conserved, we examined the effect of cellular RNase E activity on the expression of an rne–lacZ fusion in which the E. coli rne 5′ UTR had been replaced with that of Y. pseudotuberculosis. First, as substitution endpoints, two unique restriction sites were introduced into the E. coli rne–lacZ reporter ez1. One was an NheI site created by a 4-bp substitution between the promoter and transcription start site of the ez1 gene. The other was a BsrGI site created between the 5′ boundary of the ez1 ss3 segment and the ribosome-binding site by inserting a single cytidylate residue between nucleotides 341 and 342 of the 5′ UTR. As expected, these point mutations did not affect feedback regulation of the resulting ez1000 chimera. This was assessed by measuring β-galactosidase synthesis following plasmid transformation into an RNaseE-deficient lacZ strain (CH1828, which carries a chromosomal rne missense mutation, ams-1, which reduces cellular RNase E activity) and an isogenic RNase E-overproducing strain (CH1827+pRNE101, which contains a multicopy plasmid clone of the wild-type rne gene). The observed repression ratio (R, the ratio of β-galactosidase activity in the CH1828 host vs. the CH1827+pRNE101 host) is a direct measure of the degree to which expression of a particular rne–lacZ fusion can be inhibited by cellular RNase E activity. This ratio was approximately the same for ez1000 (R = 34 ± 5) and the original ez1 transcript (R = 36 ± 6).
We then replaced the 0.34-kb NheI–BsrGI segment of ez1000, which encodes all of the rne 5′ UTR upstream of the ribosome-binding site, with the corresponding segment of the Y. pseudotuberculosis rne 5′ UTR, which is similar in secondary structure but markedly different in sequence (Fig. 2). Despite resulting in 104 nucleotide substitutions, 6 deletions, and 7 insertions, this 5′ UTR replacement had almost no effect on feedback regulation in E. coli (R = 32 ± 3 for Yez1000). In contrast, feedback regulation was virtually abolished by removing the entire 5′ UTR segment upstream of the ez1000 ribosome-binding site (ezΔ1–337); this 337-nucleotide NheI–BsrGI deletion reduced the repression ratio to just 2.0 ± 0.4, confirming the key role of the rne 5′ UTR in RNase E autoregulation. Together, these findings indicate that autoregulation of rne gene expression is mediated in cis by one or more evolutionarily conserved features of the sequence and/or structure of the rne 5′ UTR.
To begin to map which of the conserved features of the rne 5′ UTR is responsible for feedback regulation, two complementary deletions were created within the ez1000 5′ UTR, such that the 3′ endpoint of the promoter-proximal deletion coincided with the 5′ endpoint of the promoter-distal deletion. The repression ratio of each deletion mutant was then determined (Fig. 4). Deletion of the entire 5′ UTR segment preceding hp3 (ezΔ1–113) impaired, but did not abolish, regulation (R = 6 ± 1, versus 33 for ez1000 and 2 for the baseline deletion mutant ezΔ1–337). A complementary deletion that removed hp3 and the ss3 segment upstream of the ribosome-binding site (ezΔ114–337) had a more modest effect on feedback regulation (R = 12 ± 3). These findings indicate that the first third of the rne 5′ UTR (nucleotides 1–113, comprising hp1, ss1, hp2, and ss2) and the next two-thirds of the rne 5′ UTR (nucleotides 114–337, comprising hp3 and the first nine nucleotides of ss3) can each function independently to mediate feedback regulation by RNase E, and that together these two RNA segments produce the full autoregulatory effect of the complete rne 5′ UTR.
Figure 4.

Repression ratios of rne–lacZ chimeras bearing 5′ UTR deletions. Plasmid pEZ1000 and derivatives thereof that lacked various segments of the ez1000 5′ UTR were introduced into an isogenic pair of lacZ− E. coli strains, CH1827 (rne+) containing the multicopy rne+ plasmid pRNE101, and CH1828 (ams-1). β-Galactosidase activity was measured in extracts prepared from log-phase bacterial cultures, and repression ratios were calculated by dividing the β-galactosidase activity in CH1828 cells by the β-galactosidase activity in CH1827 cells containing pRNE101. The reported values are each the average of six or more measurements. Errors indicate the standard deviation of these measurements. For each rne–lacZ hybrid tested, the secondary structure of the rne-derived 5′ UTR is represented diagrammatically (for a detailed structure of the wild-type rne 5′ UTR, see Fig. 2). (Lines) Retained 5′ UTR segments; (absent lines and gaps) deleted 5′ UTR segments; (filled rectangles) Shine-Dalgarno elements.
Proceeding further with the analysis, we constructed four additional variants of rne–lacZ deletion mutant ezΔ114–337 in which the remaining 5′ UTR structural domains upstream of the ribosome-binding site—hp1, ss1, hp2, and ss2—were each deleted individually or pairwise (Fig. 4). Whereas deletion of ss2 alone (ezΔ109–337) had almost no effect on feedback regulation (R = 9 ± 1, versus 12 for ezΔ114–337), the simultaneous deletion of hp2 and ss2 (ezΔ52–337) virtually abolished regulation (R = 2 ± 1, the same as that observed for the baseline deletion mutant ezΔ1–337 in which almost the entire rne 5′ UTR is deleted). Individual deletion of hp1 (ezΔ1–42/114–337) or ss1 (ezΔ43–51/114–337) caused only a modest reduction in feedback regulation (R = 8–10, vs. 12 for ezΔ114–337). These findings indicate that hp2 is necessary for efficient RNase E autoregulation. To test whether this stem–loop can direct feedback regulation in the absence of all other 5′ UTR elements preceding the signals for translation initiation, we substituted a single copy of hp2 for the entire rne-derived segment of ez1000 mRNA upstream of the ribosome-binding site. Expression of the resulting reporter transcript (ezΔ1–51/109–337) was found to be sensitive to cellular RNase E activity (R = 8 ± 1, vs. 2 for the corresponding deletion mutant lacking hp2), indicating a key role for hp2 in feedback regulation.
Despite the absence of hp2, the 5′ UTR of rne–lacZ deletion mutant ezΔ1–113 retains some autoregulatory activity (R = 6 ± 1). To better define the autoregulatory element remaining in the 5′ UTR of ezΔ1–113, we constructed two variants of this deletion mutant by additionally removing either hp3 or the first nine nucleotides of ss3, which together comprise the remainder of the 5′ UTR upstream of the ribosome-binding site (Fig. 4). Deleting this portion of ss3 (ezΔ1–113/329–337) caused a modest further reduction in feedback regulation (R = 4 ± 1, vs. 6 ± 1 for ezΔ1–113), whereas removing hp3 (ezΔ1–328) virtually abolished feedback regulation (R = 2, the same as that observed for the baseline deletion mutant ezΔ1–337). We conclude that hp2 and, to a lesser extent, hp3 are the core 5′ UTR elements that mediate autoregulation of rne gene expression and that each can function in the absence of all other RNA elements upstream of the ribosome-binding site.
Conformation of rne hp2
Although the base-paired structure of rne hp2 shown in Figures 2 and 3 fits the phylogenetic and alkylation data very well, an alternative structure for the top portion of this hairpin was also plausible on the basis of these data (cf. conformations A and B in Fig. 5). To distinguish between these possibilities, two sets of mutations were introduced into hp2 in the context of ezΔ114–337. Each set of mutations would preserve base pairing in one hp2 conformation, via compensatory base-pair substitutions, but disrupt base pairing in the other (noncompensatory substitutions) (Fig. 5). When these two variants of ezΔ114–337 were tested (Fig. 5), only the one (ezΔ114–337var1) that preserved base pairing in the original hp2 conformation (conformation A) was sensitive to feedback regulation by RNase E (R = 8 ± 1); the other (ezΔ114–337var2), which would disrupt conformation A but preserve conformation B, was no more responsive than the baseline rne–lacZ mutant lacking the entire 5′ UTR segment upstream of the ribosome binding site (R = 2 ± 1, the same as for ezΔ1–337). These findings validate the original structure proposed for rne hp2 (conformation A) and show that it is the presence of base pairs at key positions in the upper part of this stem–loop, rather than the sequence of these base pairs, that is essential for hp2 function.
Figure 5.

Alternative models for the secondary structure of rne hp2. Two possible conformations of rne hp2 that are consistent with the phylogenetic and alkylation data are shown as follows: conformation A (top) and conformation B (bottom). Also presented in the context of each structural model are the two sets of six nucleotide substitutions (sequence variants #1 and #2) that were introduced into this stem–loop. As a consequence of compensatory base-pair substitutions, sequence variant #1 is expected to preserve the secondary structure of hp2 if this stem–loop normally adopts conformation A, but to disrupt the structure of the stem–loop if it adopts conformation B. Conversely, variant #2 should preserve the secondary structure of conformation B, but disrupt that of conformation A. Beneath the structures are the β-galactosidase activities (units) and repression ratios measured on the same day for ezΔ114–337 bearing the wild-type stem–loop or either of the two hp2 sequence variants. The reported values are each the average of >20 measurements.
mRNA destabilization by rne hp2
Our previous studies have shown that the decay of both rne and ez1 mRNA accelerates as cellular RNase E activity increases. To demonstrate that rne hp2 plays a key role in mediating this accelerated degradation, we compared the longevity of rne–lacZ reporter mRNAs containing a wild-type copy of hp2 (ezΔ114–337) or a mutationally inactivated copy (ezΔ114–337var2) in E. coli cells with high or low RNase E activity.
For this purpose, we first introduced a base-pair substitution into the promoters of ezΔ114–337 and ezΔ114–337var2 to facilitate mRNA detection by increasing the rate of transcription more than 10-fold. Plasmids bearing the resulting reporter genes (ezΔ114–337T or ezΔ114–337var2T) were introduced into E. coli strain CH1827 containing plasmid pRNE101 (multicopy rne+; high RNase E activity) or into the isogenic strain CH1828 (ams-1; low RNase E activity). Before measuring mRNA decay rates, we checked the repression ratios of the two new reporter genes. Measurements of β-galactosidase activity yielded repression ratios of 5.1 ± 1.0 for ezΔ114–337T (β-galactosidase activity = 662 ± 86 units in CH1827+pRNE101 vs. 3405 ± 459 units in CH1828) and 2.0 ± 0.5 for ezΔ114–337var2T (β-galactosidase activity = 1400 ± 102 units vs. 2807 ± 669 units). These values resembled the repression ratios measured for the progenitor reporter genes ezΔ114–337 and ezΔ114–337var2 (see above), except that the degree of repression was somewhat reduced for ezΔ114–337T compared with ezΔ114–337. The effect of the promoter up mutation on the magnitude of feedback regulation by RNase E may be a consequence of overproducing the rne–lacZ fusion protein, which bears a large amino-terminal fragment of RNase E that might be capable of influencing autoregulation when present at a high cellular concentration.
To measure the physical half-lives of the two reporter transcripts in the same host strains, rifampicin was added to log-phase cultures to halt further initiation of transcription, and total cellular RNA was extracted from culture samples withdrawn at time intervals thereafter. Equal amounts of each RNA extract were assayed by primer extension to determine the relative amount of rne–lacZ mRNA remaining. From these data, we calculated the half-lives of the rne–lacZ reporter mRNAs in cells with high or low RNase E activity (Fig. 6).
Figure 6.

Effect of rne hp2 on the physical lifetime of rne–lacZ reporter transcripts. Plasmids pEZΔ114–337T and pEZΔ114–337var2T were each introduced into an isogenic pair of lacZ− E. coli host strains, CH1827 (rne+) containing the multicopy rne+ plasmid pRNE101, and CH1828 (ams-1). Cultures of each resulting strain were grown exponentially for several generations in LB medium at 37°C. At time intervals after transcription inhibition with rifampicin (200 μg/ml), total cellular RNA was isolated. Equal amounts of each RNA extract (4 or 8 μg) were then analyzed by primer extension using reverse transcriptase and a 5′ end-labeled DNA primer (5′-CCCAGTCACGACGTTGTAAAACG-3′) complementary to the lacZ coding region. The extension products were resolved by electrophoresis on a 4% polyacrylamide-urea gel beside a set of molecular size standards 900, 800, 700, and 600 nucleotides in length (M). The band corresponding to the rne–lacZ reporter transcripts is indicated. An additional band (✻) corresponding to a reporter RNA 48 nucleotides shorter at the 5′ end represents an apparent mRNA decay intermediate cleaved at a nonessential site within ss1 (Jain and Belasco 1995). The calculated size of the full-length primer extension products was 0.74 kb. The numbers above the autoradiogram lanes indicate minutes after transcription inhibition. Beneath each autoradiogram is a semilogarithmic plot of mRNA concentration as a function of time after rifampicin addition.
The half-life of the reporter transcript bearing a wild-type copy of hp2 (ezΔ114–337T) was 5.2 times longer in E. coli cells with low RNase E activity (half-life of 4.7 ± 0.8 min in the ams-1 strain) than in cells that overproduce RNase E (half-life of 0.9 ± 0.1 min in the multicopy rne+ strain). This difference in longevity closely resembles the 5.1-fold difference in β-galactosidase activity measured for ezΔ114–337T in the same two strains. In comparison, the lifetime of the rne–lacZ transcript bearing a mutant copy of hp2 (ezΔ114–337var2T) was only 2.2 times longer in the ams-1 strain (half-life of 4.4 ± 0.8 min) than in the multicopy rne+ strain (half-life of 2.0 ± 0.3 min), a ratio congruent with the 2.0-fold difference in β-galactosidase activity measured for ezΔ114–337var2T in these two strains. In cells with low RNase E activity, ezΔ114–337T mRNA longevity and gene expression were both independent of rne hp2. In contrast, an intact copy of hp2 was necessary for an increase in RNase E activity to markedly reduce the lifetime of ezΔ114–337T mRNA and thereby to repress expression of this reporter gene by more than the basal twofold effect typical of unrelated genes. These findings indicate that hp2 directs feedback regulation of rne gene expression by significantly accelerating RNase E-mediated degradation of rne mRNA in response to increased cellular RNase E activity.
Discussion
The identification of the features of mRNAs that govern their differential susceptibility to ribonuclease digestion is of great importance for understanding how gene expression is controlled post-transcriptionally. This is particularly true for cleavage by RNase E, the endonuclease that appears to initiate degradation via the principal pathway for mRNA turnover in E. coli. Beside its central role in the degradation of various unrelated mRNAs, this important ribonuclease tightly regulates its own synthesis by controlling the longevity of the RNase E (rne) gene transcript (Jain and Belasco 1995). Compared with other E. coli genes, expression of the rne gene is unusually sensitive to the cellular level of RNase E activity (Jain and Belasco 1995). Our data show that feedback regulation of rne gene expression is mediated in cis by two evolutionarily conserved secondary structure elements within the rne 5′ UTR. By targeting the transcript that contains these regulatory elements for degradation at a rate dependent on cytoplasmic RNase E activity, bacterial cells are able to maintain RNase E near its optimal concentration.
We have determined the secondary structure of the 361-nucleotide rne 5′ UTR from E. coli by a combination of phylogenetic comparison, chemical alkylation, and mutational analysis. Our phylogenetic data indicate that, despite extensive sequence divergence, the secondary structure of the rne 5′ UTR is highly conserved among diverse members of the γ subgroup of purple bacteria, including E. coli, S. marcescens, Y. pseudotuberculosis, E. carotovora, P. alcalifaciens, and H. influenzae. This evolutionary conservation implies an important biological function for this long untranslated RNA segment, a conclusion consistent with its role in RNase E feedback regulation.
The rne 5′ UTR can be subdivided into six structural domains: three stem–loops (hp1, hp2, and hp3) and three single-stranded segments (ss1, ss2, and ss3). Among these, hp2 and hp3 are the core elements that mediate autoregulation. Of the two autoregulatory elements, hp2 is the more potent. This stem–loop functions as a sensor of cellular RNase E activity that directs feedback regulation of rne gene expression by mediating the degradation of rne mRNA by RNase E at a rate that is sensitive to the level of RNase E activity in bacterial cells. At the top of hp2 is a 14-nucleotide RNA segment (GCAAUGGCGUAAGA) whose sequence is the most highly conserved of any rne 5′ UTR segment more than a few nucleotides in length, showing strict conservation among E. coli, Serratia, Yersinia, Erwinia, and Providencia and deviating only slightly in Haemophilus. Together with two flanking nucleotides, this RNA segment folds to form a structural component, comprising a hairpin loop, a 2-bp stem, and an 8-nucleotide internal loop, whose integrity is critical for the ability of hp2 to modulate the rate of rne mRNA degradation in response to changes in cellular RNase E activity. A search of rne genes in bacteria for which incomplete genomic sequences are available reveals that an upstream element closely related to hp2 is also present in a number of other bacterial species, including Klebsiella pneumoniae, Vibrio cholera, and Actinobacillus actinomycetemcomitans.
The independent activity of hp2 and hp3 in mediating the inhibitory effect of RNase E on rne gene expression and the excellent correlation between the effect of hp2 on gene expression and mRNA longevity suggest that each of these stem–loops functions in some manner as a target for RNase E. For example, in view of the preference of RNase E for cleaving RNA at sites that are AU- rich and single stranded (Lin-Chao et al. 1994; McDowall et al. 1994), the presence of large AU-rich internal loops within hp3 raises the possibility that this branched stem–loop might contain an RNase E cleavage site (Fig. 7A). In contrast, the predominantly base-paired structure of hp2 makes it an unlikely target for RNase E cleavage, an inference supported by in vitro cleavage experiments with the purified catalytic domain of RNase E (data not shown). Nonetheless, binding of hp2 by RNase E, either alone or in conjunction with a hypothetical protein cofactor, could accelerate rne mRNA degradation by facilitating access of the bound ribonuclease to one or more endonucleolytic cleavage sites elsewhere in the rne transcript (Fig. 7B). In this manner, hp2 might help RNase E to overcome potential impediments to cleavage imposed by other features of the rne 5′ UTR, such as bound ribosomes (Baumeister et al. 1991; Yarchuk et al. 1992; Jain and Kleckner 1993; Arnold et al. 1998), a 5′-proximal stem–loop (hp1) (Bouvet and Belasco 1992), and a 5′-terminal triphosphate (Mackie 1998), all of which have been implicated in protecting other RNAs from cleavage by this enzyme. Such a role for hp2 would be consistent with a number of lines of evidence suggesting that it is often not the mere presence of RNase E cleavage sites but rather their accessibility that is most important in determining mRNA lifetimes.
Figure 7.

Two possible mechanisms by which an RNA destabilizing element could accelerate ribonuclease cleavage. (A) The catalytic active site of the ribonuclease (scissors) binds directly to the RNA destabilizing element (stem–loop) and cleaves it. (B) An RNA-binding domain of the ribonuclease or an associated protein binds to the RNA destabilizing element, thereby facilitating access of the ribonuclease active site to a cleavage site elsewhere in the RNA.
What of the other rne 5′ UTR domains upstream of the ribosome binding site (hp1, ss1, and ss2)? In contrast to the marked autoregulatory effect observed for hp2 and the moderate effect of hp3, none of these other domains appears to play a significant role in feedback regulation, although they may slightly amplify the degree of RNase E feedback regulation mediated by hp2 and hp3. It is worth noting that the ss1 segment is dispensable for RNase E feedback regulation even though it contains an apparent RNase E cleavage site (Jain and Belasco 1995). Either cleavage at this particular site is irrelevant to the mechanism of feedback regulation, or this site is functionally redundant with other RNase E cleavage sites within the rne transcript.
Phylogenetic analysis of the rne 5′ UTR was greatly facilitated by the strategy used to isolate this gene segment from a number of different bacterial species. This strategy involved PCR amplification of genomic DNA using primers complementary to flanking coding region segments that were expected to be relatively well conserved at the sequence level. By carefully designing the primers and gradually stepping down the PCR annealing temperature (see Materials and Methods), it was possible to obtain a single major PCR product in good yield from a variety of bacterial genomes despite a lack of advance knowledge as to the exact degree of complementarity between the primers and their targets. This approach should be of value for rapidly determining the sequence and secondary structure of many other untranslated regions that control bacterial gene expression, as noncoding regions are generally expected to diverge in sequence more rapidly than protein-coding regions during the course of evolution.
Materials and methods
Strains and plasmids
The isogenic E. coli strains CH1827 (MC1061, zce-726::Tn10) and CH1828 (MC1061, zce-726::Tn10 ams-1) are derivatives of MC1061 [ara D39 Δ(ara, leu) 7697 ΔleuX74 galU− galK− hsr− hsm+ strA] (Mudd and Higgins 1993). Y. pseudotuberculosis, S. marcescens, and E. carotovora were provided by Dr. A. Chatterjee (University of Missouri, Columbia). P. alcalifaciens (ATCC 51902) was obtained from the American Type Culture Collection.
Plasmid pRNE101 is a pACYC177 derivative containing the wild-type E. coli rne gene (Jain and Belasco 1995). Plasmids pEZ101 (pBR322 derivative) and pEZ201 (pSC101 derivative) each contain an rne–lacZ reporter gene (ez1) comprising the rne promoter, 5′ UTR, and the first 181 codons of the rne coding region fused to the tenth codon of lacZ (Jain and Belasco 1995). Plasmid pEZ1000 is a derivative of pEZ201 that contains three modifications of the rne–lacZ reporter. First, a single nucleotide change in the −10 region of the rne promoter (AATAAT → AATAAA) reduces the strength of the promoter. In addition, NheI and BsrGI restriction sites were introduced to facilitate dissection of essential cis-acting elements in the rne 5′ UTR. The NheI site (GCTAGC) was created at the 5′ boundary of the 5′ UTR by replacing 4 nucleotides between the −10 re gion of the promoter and the transcription initiation site (GAGGCC → GCTAGC). The BsrGI site (TGTACA) was created 7 nucleotides upstream of the Shine-Dalgarno element by inserting one nucleotide (C) at position 340 relative to the transcription initiation site. Plasmids pEZΔ1–113, pEZΔ1–328, pEZΔ1–337, pEZΔ52–337, pEZΔ109–337, pEZΔ114–337, pEZΔ1–42/114–337, pEZΔ43–51/114–337, and pEZΔ1–113/329–337 each encode an rne–lacZ transcript with a deletion of the indicated 5′ UTR nucleotides. Two variants of pEZΔ114–337 encode multiple nucleotide substitutions between 5′ UTR nucleotides 69 and 91 that either preserve (pEZΔ114–337var1, ACGCAGCAAUGGCGUAAGACGU → AGGCACGAAUGCGGUAAGACCU) or disrupt (pEZΔ114–337var2, ACGCAGCAAUGGCGUAAGACGU → GGCCAGCAAUGGGCCAAGACGU) the secondary structure at the top of rne hp2. Plasmids pEZΔ114–337T and pEZΔ114–337var2T are identical to pEZΔ114–337 and pEZΔ114–337var2, respectively, except for a base-pair substitution in the −10 region of the rne–lacZ promoter (AATAAA → AATAAT). In plasmid pEZΔ1–51/109–337, the 0.34-kb NheI–BsrGI fragment of pEZ1000 was replaced with a single copy of rne hp2 (GCTAGCATTGCCCGACCGATCATCCACGCAGCAATGGCGTAAGACGTATTGATCTTTCAGGCAGTCTAGA). In plasmid pYEZ1000, the 0.34-kb NheI–BsrGI fragment of pEZ1000 was replaced with a PCR-amplified NheI–BsrGI fragment encoding the corresponding segment of the Y. pseudotuberculosis rne 5′ UTR (nucleotides 1–338 flanked upstream by GCTAGC and downstream by TGTACA). All plasmid constructions were confirmed by DNA sequencing.
Amplification and sequence analysis of the rne 5′ UTR
Genomic DNA from E. coli, Y. pseudotuberculosis, S. marcescens, E. carotovora, and P. alcalifaciens was prepared by resuspending an overnight bacterial culture (4 ml) in Luria broth (LB, 1 ml), extracting with phenol (pH 8), ethanol-precipitating the genomic DNA, and resuspending it in TE buffer (0.5 ml) (Mak and Ho 1992).
Intergenic DNA upstream of the rne coding region of Yersinia, Serratia, Erwinia, and Providencia was amplified by PCR, using degenerate oligonucleotide primers designed to be complementary to the protein-coding region of the rne and yceC genes of both E. coli and H. influenzae (Fleischmann et al. 1995; Blattner et al. 1997). These primers included the oligonucleotides Drne1 (5′-ACAAGGGCAACGCGCARYTCTTC-3′, complementary to rne codons 19–12), DyceC1 (5′-TAAACCACTGCCGCCATGTACNGC-3′, complementary to yceC codons 119–112), and DyceC3 (5′-AAGTTATCGATKCGTTGMCCKGCTTCGTC -3′, complementary to yceC codons 25–16), where N = A/G/T/C, R = A/G, Y = C/T, K = G/T, and M = A/C. PCR amplification was performed using genomic DNA (typically 10–30 ng), an appropriate primer pair (10 pmole each), 50 mm KCl, 10 mm Tris-HCl (pH 9.0), 1.5 mm MgCl2, 1% Triton X-100, 180 μm each dNTP, and 1 unit of Taq DNA polymerase (Promega) in a total reaction volume of 50 μl. After denaturing the chromosomal DNA for 5 min at 94°C, step-down PCR was performed on a thermocycler (MJ Research XT-100) using a denaturing temperature of 94°C (30 sec), an initial annealing temperature of 65°C (30 sec), and a DNA synthesis temperature of 72°C (1 min). After three cycles under these conditions, the annealing temperature was reduced by 3°C for the next three cycles, reduced again by 3°C, and so on until the annealing temperature had fallen to 44°C. After 20 additional cycles at an annealing temperature of 50°C, the PCR products were purified using a High Pure PCR purification kit (Boehringer Mannheim) and sequenced by Jackson Laboratories (Bar Harbor, ME). Preliminary sequence data for the rne genes of K. pneumoniae, V. cholera, and A. actinomycetemcomitans were obtained from The Institute for Genomic Research website (http://www.tigr.org).
Phylogenetic and biochemical analysis of rne 5′ UTR secondary structure
Phylogenetic analysis of RNA secondary structure was performed by first aligning the sequences of the rne 5′ UTRs of E. coli, Y. pseudotuberculosis, S. marcescens, E. carotovora, and P. alcalifaciens and then examining them visually for potential base-paired conformations common to all five. Covarying base-paired nucleotides served as hallmarks of phylogenetically conserved elements of secondary structure. The phylogenetically conserved secondary structure that we identified by visual sequence inspection was subsequently corroborated by computer analysis of sequence covariation (R.R. Gutell, University of Texas at Austin, pers. comm.). Other potential secondary structures were not phylogenetically conserved.
Chemical probing of RNA secondary structure was performed in vivo and in vitro as described previously (Moazed et al. 1986; Chen et al. 1991). Total cellular RNA was isolated from an exponential culture of E. coli strain CH1828 containing pEZ101 after treating an aliquot of the culture with DMS (5 μl per ml of culture). In addition, samples of RNA extracted from an untreated culture were alkylated in vitro with DMS or CMCT. Sites of alkylation within the ez1 5′ UTR were mapped by primer extension using AMV reverse transcriptase and various complementary 5′ end-labeled DNA primers.
Assays of β-galactosidase activity
Overnight cultures of CH1827+pRNE101 or CH1828 containing each reporter plasmid were diluted 1:100 into fresh LB medium (2 ml) and grown at 37°C to OD600 ∼0.5. β-Galactosidase activity was measured for each culture as described previously (Jain and Belasco 1995). All reported values are the average of at least six measurements.
Assays of rne–lacZ mRNA half-life
Overnight cultures of CH1827+pRNE101 or CH1828 containing plasmid pEZΔ114–337T or pEZΔ114–337var2T were grown exponentially in LB medium at 37°C to OD600 = 0.5. Rifampicin (0.2 mg/ml) was added to inhibit further transcription initiation, and total cellular RNA was isolated at time intervals thereafter, as described previously (Emory and Belasco 1990). Primer extension analysis was performed by first combining equal amounts of each RNA extract (4 or 8 μg) with a 5′ end-labeled DNA primer (5′-CCCAGTCACGACGTTGTAAAACG-3′; 25 fmole) in reverse transcription buffer (50 mm Tris-HCl at pH 8.3, 75 mm KCl, 3 mm MgCl2; 6.25 μl). The RNA–DNA mixtures were denatured at 65°C and then allowed to anneal by cooling slowly for 1 hr to ∼30°C. Reverse transcription buffer (1.25 μl) containing all four dNTPs (3 mm each), dithiothreitol (60 mm), and Superscript reverse transcriptase (75 units; Life Technologies) was added, and primer extension was allowed to proceed at 45°C for 16 hr. The reactions were quenched by adding loading buffer (5 μl) that contained 95% formamide, 20 mm EDTA (pH 8.0), 0.05% bromophenol blue, and 0.05% xylene cyanol. Following denaturation at 90°C for 2 min, the primer extension products were separated by electrophoresis on a 4% polyacrylamide–urea gel. Radioactive gel bands were visualized and quantitated with a Molecular Dynamics Storm 820 PhosphorImager. The physical half-life of each reporter mRNA in each host strain was calculated from the slope of a semilogarithmic plot of mRNA concentration versus time, as determined by linear regression analysis. For each plot, a half-life error was estimated from the standard deviation of the slope. All half-life measurements were performed at least twice using two different RNA preparations.
Acknowledgments
We thank Robin Gutell for helping to corroborate our phylogenetically determined secondary structure by independently analyzing our sequence data for covariation. We also thank Ann Hochschild for generously sharing her laboratory facilities and Diana Bratu and Jixiang Xu for their experimental contributions. This research was funded by a grant (to J.G.B.) from the National Institutes of Health (GM35769) and by a Faculty Research Award (to J.G.B.) from the American Cancer Society (FRA-419).
The publication costs of this article were defrayed in part by payment of page charges. This article must therefore be hereby marked “advertisement” in accordance with 18 USC section 1734 solely to indicate this fact.
Note added in proof
The sequences of the rne 5′ UTR from Yersinia pseudotuberculosis (accession number AF259267), Providencia alcalifaciens (AF259268), Serratia marcescens (AF259269), and Erwinia carotovora (AF259270) have been deposited at GenBank.
Footnotes
E-MAIL belasco@saturn.med.nyu.edu; FAX (212) 263-8951.
References
- Apirion D. Isolation, genetic mapping, and some characterization of a mutation in Escherichia coli that affects the processing of ribonucleic acids. Genetics. 1978;90:659–671. doi: 10.1093/genetics/90.4.659. [DOI] [PMC free article] [PubMed] [Google Scholar]
- Arnold TE, Yu J, Belasco JG. mRNA stabilization by the ompA 5′ untranslated region: Two protective elements hinder distinct pathways for mRNA degradation. RNA. 1998;4:319–330. [PMC free article] [PubMed] [Google Scholar]
- Babitzke P, Kushner SR. The Ams (altered mRNA stability) protein and ribonuclease E are encoded by the same structural gene of Escherichia coli. Proc Natl Acad Sci. 1991;88:1–5. doi: 10.1073/pnas.88.1.1. [DOI] [PMC free article] [PubMed] [Google Scholar]
- Baumeister R, Flache P, Melefors Ö, von Gabain A, Hillen W. Lack of a 5′ non-coding region in Tn1721 encoded tetR mRNA is associated with a low efficiency of translation and a short half-life in Escherichia coli. Nucleic Acids Res. 1991;19:4595–4600. doi: 10.1093/nar/19.17.4595. [DOI] [PMC free article] [PubMed] [Google Scholar]
- Belasco JG. Control of messenger RNA stability. San Diego, CA: Academic Press; 1993. mRNA degradation in prokaryotic cells: An overview; pp. 3–12. [Google Scholar]
- Blattner FR, Plunkett G, Bloch CA, Perna NT, Burland V, Riley M, Collado-Vides J, Glasner JD, Rode CK, Mayhew GF, et al. The complete genome sequence of Escherichia coli K-12. Science. 1997;277:1453–1474. doi: 10.1126/science.277.5331.1453. [DOI] [PubMed] [Google Scholar]
- Bouvet P, Belasco JG. Control of RNase E-mediated RNA degradation by 5′-terminal base pairing in E. coli. Nature. 1992;360:488–491. doi: 10.1038/360488a0. [DOI] [PubMed] [Google Scholar]
- Carpousis AJ, Van Houwe G, Ehretsmann C, Krisch HM. Co-purification of E. coli RNase E and PNPase: Evidence for a specific association between two enzymes important in RNA processing and degradation. Cell. 1994;76:889–900. doi: 10.1016/0092-8674(94)90363-8. [DOI] [PubMed] [Google Scholar]
- Chen L-H, Emory SA, Bricker AL, Bouvet P, Belasco JG. Structure and function of a bacterial mRNA stabilizer: Analysis of the 5′ untranslated region of ompA mRNA. J Bacteriol. 1991;173:4578–4586. doi: 10.1128/jb.173.15.4578-4586.1991. [DOI] [PMC free article] [PubMed] [Google Scholar]
- Claverie-Martin F, Diaz-Torres MR, Yancey SD, Kushner SR. Analysis of the altered mRNA stability (ams) gene from Escherichia coli. J Biol Chem. 1991;266:2843–2851. [PubMed] [Google Scholar]
- Emory SA, Belasco JG. The ompA 5′ untranslated RNA segment functions in Escherichia coli as a growth-rate-regulated mRNA stabilizer whose activity is unrelated to translational efficiency. J Bacteriol. 1990;172:4472–4481. doi: 10.1128/jb.172.8.4472-4481.1990. [DOI] [PMC free article] [PubMed] [Google Scholar]
- Fleischmann RD, Adams MD, White O, Clayton RA, Kirkness EF, Kerlavage AR, Bult CJ, Tomb JF, Dougherty BA, Merrick JM. Whole-genome random sequencing and assembly of Haemophilus influenzae Rd. Science. 1995;269:496–512. doi: 10.1126/science.7542800. [DOI] [PubMed] [Google Scholar]
- Jain C, Belasco JG. RNase E autoregulates its synthesis by controlling the degradation rate of its own mRNA in Escherichia coli: Unusual sensitivity of the rne transcript to RNase E activity. Genes & Dev. 1995;9:84–96. doi: 10.1101/gad.9.1.84. [DOI] [PubMed] [Google Scholar]
- Jain C, Kleckner N. IS10 mRNA stability and steady state levels in Escherichia coli: Indirect effects of translation and role of rne function. Mol Microbiol. 1993;9:233–247. doi: 10.1111/j.1365-2958.1993.tb01686.x. [DOI] [PubMed] [Google Scholar]
- Lin-Chao S, Wong T-T, McDowall KJ, Cohen SN. Effects of nucleotide sequence on the specificity of rne-dependent and RNase E-mediated cleavages of RNA I encoded by the pBR322 plasmid. J Biol Chem. 1994;269:10797–10803. [PubMed] [Google Scholar]
- Mackie GA. Ribonuclease E is a 5′-end-dependent endonuclease. Nature. 1998;395:720–723. doi: 10.1038/27246. [DOI] [PubMed] [Google Scholar]
- Mak YM, Ho KK. An improved method for the isolation of chromosomal DNA from various bacteria and cyanobacteria. Nucleic Acids Res. 1992;20:4101–4102. doi: 10.1093/nar/20.15.4101. [DOI] [PMC free article] [PubMed] [Google Scholar]
- McDowall KJ, Lin-Chao S, Cohen SN. A+U content rather than a particular nucleotide order determines the specificity of RNase E cleavage. J Biol Chem. 1994;269:10790–10796. [PubMed] [Google Scholar]
- Melefors Ö, von Gabain A. Genetic studies of cleavage-initiated mRNA decay and processing of ribosomal 9S RNA show that the Escherichia coli ams and rne loci are the same. Mol Microbiol. 1991;5:857–864. doi: 10.1111/j.1365-2958.1991.tb00759.x. [DOI] [PubMed] [Google Scholar]
- Miczak A, Kaberdin VR, Wei CL, Lin-Chao S. Proteins associated with RNase E in a multicomponent ribonucleolytic complex. Proc Natl Acad Sci. 1996;93:3865–3869. doi: 10.1073/pnas.93.9.3865. [DOI] [PMC free article] [PubMed] [Google Scholar]
- Moazed D, Stern S, Noller HF. Rapid chemical probing of conformation in 16S ribosomal RNA and 30S ribosomal subunits using primer extension. J Mol Biol. 1986;187:399–416. doi: 10.1016/0022-2836(86)90441-9. [DOI] [PubMed] [Google Scholar]
- Mudd EA, Higgins CF. Escherichia coli endoribonuclease RNase E: Autoregulation of expression and site-specific cleavage of mRNA. Mol Microbiol. 1993;9:557–568. doi: 10.1111/j.1365-2958.1993.tb01716.x. [DOI] [PubMed] [Google Scholar]
- Mudd EA, Krisch HM, Higgins CF. RNase E, an endoribonuclease, has a general role in the chemical decay of E. coli mRNA: Evidence that rne and ams are the same genetic locus. Mol Microbiol. 1990;4:2127–2135. doi: 10.1111/j.1365-2958.1990.tb00574.x. [DOI] [PubMed] [Google Scholar]
- Noller HF, Woese CR. Secondary structure of 16S ribosomal RNA. Science. 1981;212:403–411. doi: 10.1126/science.6163215. [DOI] [PubMed] [Google Scholar]
- Ono M, Kuwano M. A conditional lethal mutation in an Escherichia coli strain with a longer chemical lifetime of mRNA. J Mol Biol. 1979;129:343–357. doi: 10.1016/0022-2836(79)90500-x. [DOI] [PubMed] [Google Scholar]
- Py B, Higgins CF, Krisch HM, Carpousis AJ. A DEAD-box RNA helicase in the Escherichia coli RNA degradosome. Nature. 1996;381:169–172. doi: 10.1038/381169a0. [DOI] [PubMed] [Google Scholar]
- Schnare MN, Damberger SH, Gray MW, Gutell RR. Comprehensive comparison of structural characteristics in eukaryotic cytoplasmic large subunit (23 S-like) ribosomal RNA. J Mol Biol. 1996;256:701–719. doi: 10.1006/jmbi.1996.0119. [DOI] [PubMed] [Google Scholar]
- Taraseviciene L, Miczak A, Apirion D. The gene specifying RNase E (rne) and a gene affecting mRNA stability (ams) are the same gene. Mol Microbiol. 1991;5:851–855. doi: 10.1111/j.1365-2958.1991.tb00758.x. [DOI] [PubMed] [Google Scholar]
- Yarchuk O, Jacques N, Guillerez J, Dreyfus M. Interdependence of translation, transcription and mRNA degradation in the lacZ gene. J Mol Biol. 1992;226:581–596. doi: 10.1016/0022-2836(92)90617-s. [DOI] [PubMed] [Google Scholar]