

Abstract
Although experimental studies have suggested that insulin-like growth factor I (IGF-I) and its binding protein IGFBP-3 might have a role in the aetiology of coronary artery disease (CAD), the relevance of circulating IGFs and their binding proteins in the development of CAD in human populations is unclear. We conducted a nested case-control study, with a mean follow-up of six years, within the EPIC-Norfolk cohort to assess the association between circulating levels of IGF-I and IGFBP-3 and risk of CAD in up to 1,013 cases and 2,055 controls matched for age, sex and study enrolment date. After adjustment for cardiovascular risk factors, we found no association between circulating levels of IGF-I or IGFBP-3 and risk of CAD (odds ratio: 0.98 (95% Cl 0.90-1.06) per 1 SD increase in circulating IGF-I; odds ratio: 1.02 (95% Cl 0.94-1.12) for IGFBP-3). We examined associations between tagging single nucleotide polymorphisms (tSNPs) at the IGF1 and IGFBP3 loci and circulating IGF-I and IGFBP-3 levels in up to 1,133 cases and 2,223 controls and identified three tSNPs (rs1520220, rs3730204, rs2132571) that showed independent association with either circulating IGF-I or IGFBP-3 levels. In an assessment of 31 SNPs spanning the IGF1 or IGFBP3 loci, none were associated with risk of CAD in a meta-analysis that included EPIC-Norfolk and eight additional studies comprising up to 9,319 cases and 19,964 controls. Our results indicate that IGF-I and IGFBP-3 are unlikely to be importantly involved in the aetiology of CAD in human populations.
Keywords: Epidemiology, Genetics of cardiovascular disease, Risk factors, IGF1, IGFBP3
Introduction
Insulin-like growth factor I (IGF-I) is a peptide hormone that shares sequence homology with insulin and has a fundamental role in somatic growth and cellular differentiation, metabolism and survival [1]. The majority of IGFs in the circulation are bound to IGF binding proteins, of which IGF binding protein 3 (IGFBP-3) is the most predominant, carrying > 80% of circulating IGF-I. But, although IGFBP-3 is an important regulator of the bioactivity of IGF-I, there is evidence to suggest that IGFBP-3 possesses functions independent of its role as an IGF-I carrier protein [2]. It has been suggested that circulating IGF-I is involved in the pathophysiological processes underlying coronary artery disease (CAD). Experimental data in animals have shown that overexpression or administration of IGF-I after myocardial infarction (MI) prevents cardiomyocyte death and improves cardiac function [3,4,5]. Evidence for improvement of cardiac function and increased ventricular mass has been shown in individuals with growth hormone deficiency after short-term IGF-I therapy [6]. Improved cardiac performance has also been demonstrated following administration of recombinant IGF-I to individuals with chronic heart failure [7].
Cross sectional observational studies have reported that circulating IGF-I concentrations are lower in individuals with CAD and MI [8,9,10], but the opposite has been reported as well [11]. Furthermore, increments in IGF-I levels are associated with reduced prevalence of atherosclerotic plaques, as measured by arterial ultrasound [12]. The prospective association between circulating levels of IGF-I and IGFBP-3 and subsequent risk of future CAD, however, remains uncertain [13,14,15,16,17,18,19,20]. Several studies have identified reproducible associations among genetic variants at the loci encoding IGF-I and IGFBP-3 and circulating levels of IGFs. To assess a possible link between circulating IGF-I and IGFBP-3 levels and CAD, there is a need for a comprehensive analysis of the relationship between circulating IGF-I and IGFBP-3 levels, genetic variation at the loci encoding these proteins, and risk of CAD. Therefore we sought to reproduce previously reported associations between tagging single nucleotide polymorphisms (tSNPs) spanning the IGF1 and IGFBP3 genes and circulating concentrations of IGF-I and IGFBP-3, and to use these SNPs as genetic tools to assess the possible relation between IGF-I and IGFBP-3 and risk of CAD in a prospective population-based study.
Materials and methods
Study design
We conducted a nested CAD case-control study among participants of the European Prospective Investigation into Cancer and Nutrition (EPIC)-Norfolk cohort, a prospective population-based study of 25,663 men and women resident in Norfolk, United Kingdom, aged between 45 and 79 years [21]. Participants were recruited from age-sex registers of general practices. At the baseline survey between 1993 and 1997, participants completed a detailed health and lifestyle questionnaire, and additional data were collected by trained nurses at a clinic visit as previously described [21]. Participants were identified as incident CAD cases if they had a hospital admission and/or died with CAD as the underlying cause during follow-up. CAD was defined as ICD9 codes 410 to 414 or ICD10 codes 120-125 (including acute and old myocardial infarction, angina, aneurysm and dissection of the heart, and other ischaemic heart disease). We report results with follow-up to January 2003, an average of about 6 years. The study was approved by the Norwich District Health Authority Ethics Committee, and all participants gave written informed consent.
Participants
We selected study participants who did not report a history of heart attack or stroke at the baseline clinic visit. During follow-up, 1,138 apparently healthy individuals developed fatal or non-fatal CAD and were classified as cases. Controls were study participants who remained free of any cardiovascular disease during follow-up. Two controls were matched to each case by age (within 5 years), sex and date of inclusion visit (within a range of 3 months). Due to an insufficient number of available controls, because of this stringent matching, only 2,237 controls were identified, i.e. 39 cases were matched to one control and 1,099 cases were matched to two controls. For analyses of the associations among IGF1 and IGFBP3 tSNPs and risk of CAD, complete data were available for 1,133 cases and 2,223 controls. For analyses that also involved circulating IGF-I and IGFBP-3 levels, complete data were available for 1,013 cases and 2,055 controls.
Additional CAD case-control studies
We also combined data from the EPIC-Norfolk study with summary data from eight studies from existing collaborations [22] where genotypes were available in silico for 31 SNPs spanning the IGF1 and IGFBP3 genes (Table 1). These comprised 9,319 cases and 19,964 controls in a meta-analysis of IGF1/IGFBP3 SNPs and risk of CAD. In addition to EPIC-Norfolk, the studies included were the Ottawa Heart Studies-I and II [23,24], WTCCC CAD study [25,26], PENN CATH and MEDSTAR studies [27,28], and nested case-control studies derived from the CoLaus [29,30], GEMS [30,31,32] and Rotterdam [33,34] studies. Details of these studies and their genotyping and analytical approaches have been published previously and are summarised briefly in Table 1.
Table 1.
Study characteristics and details of analysis metrics and methods for individual studies in CAD risk meta-analysis
| STUDY | Ottawa Heart Study-I | Ottawa Heart Study-II | WTCCC CAD study | PENN CATH | MEDSTAR | CoLaus | GEMS | Rotterdam |
|---|---|---|---|---|---|---|---|---|
| SAMPLES | ||||||||
| Description | CAD case-control study of participants recruited from the Champlain region including Ottawa | CAD case-control study of participants recruited from Ottawa and the Cleveland Clinic | CAD case-control study of participants recruited nationally from the UK | CAD case-control study nested within cohort of participants attending University of Pennsylvania Medical Center, PA, USA, for angiography | CAD case-control study nested within cross sectional cohort of participants attending Washington Hospital Center, Washington DC, USA, for angiography | CAD case-cohort set nested within CoLaus study | CAD case-cohort set nested within GEMS study | CAD case-cohort set nested within Rotterdam study |
| N cases/N controls | 1,542/1,455 | 1,912/933 | 1,926/2,938 | 933/468 | 874/447 | 192/5,127 | 262/1,580 | 612/4,892 |
| Case/control definition | Cases: individuals exhibited symptomatic CAD before the age of 55 years in men and 65 in women. CAD defined as greater than 50% stenosis of a coronary artery was confirmed by coronary angiography. Cases with a history of diabetes were excluded. Controls: asymptomatic elderly individuals were selected as controls (aged ≥ 65 for men, aged ≥ 70 for women). | Cases: individuals exhibited symptomatic CAD before the age of 55 years in men and 65 in women. CAD defined as greater than 50% stenosis of a coronary artery was confirmed by coronary angiography. Cases with a history of diabetes were excluded. Controls: asymptomatic elderly individuals were selected as controls (aged ≥ 65 for men, aged ≥ 70 for women). | Cases: individuals with premature CAD (a validated history of either MI or coronary revascularisation before age 66 years) and one or more first degree relatives with CAD. Controls: unrelated individuals from 1958 British birth cohort and UK Blood Services. | Cases: individuals who had one or more coronary vessels with ≥ 50% stenosis equally selected among stable CAD cases without history of MI and CAD cases with a history of MI. Controls: men aged > 40 and women aged > 45 showing no evidence of CAD. | Cases: individuals who had one or more coronary vessels with ≥ 50% stenosis equally selected among stable CAD cases without history of MI and CAD cases with a history of MI. Controls: women aged > 55 years and men aged > 60 years with angiographhically documented coronaries of ≤ 20% stenosis. If there is 0% coronary narrowing, then men and women aged ≥ 45 years are included. | Cases: individuals who reported previous acute MI, cardiac catheterisation, coronary artery bypass or angina. Controls: individuals without any of above case definitions. | Cases: individuals who reported previous CAD. Controls: individuals who reported no current or previous CAD. | Cases: fatal or nonfatal MI, fatal CHD or sudden death. Controls: individuals without previous or current CAD or MI at follow-up. |
| Sex (%men / %women) | ||||||||
| Cases: | 76/24 | 76/24 | 79 / 21 | 76 / 24 | 72 / 28 | 72 / 28 | 74 / 26 | 51 / 49 |
| Controls: | 52/48 | 50/50 | 49 / 51 | 48 / 52 | 51 / 49 | 46 / 54 | 57 / 43 | 36 / 63 |
| Age (mean (sd), years) | ||||||||
| Cases: | 48.7 (7.3) | 48.9 (7.3) | 45.7 (9.7) | 56.8 (9.2) | 54.6 (7.3) | 62.6 (8.4) | 55.0 (7.5) | 72.5 (9.5) |
| Controls: | 75.0 (5.0) | 74.3 (5.8) | 49.8 (7.7) | 61.7 (9.6) | 60.0 (8.9) | 62.5 (8.4) | 52.0 (9.7) | 68.7 (9.0) |
| GENOTYPING | ||||||||
| Genotyping platform & SNP panel | Affymetrix 500K & 6.0 Array set | Affymetrix 6.0 Array set | Affymetrix 500K Array Set | Affymetrix Array 6.0 | Affymetrix Array 6.0 | Affymetrix 500K Array Set | Affymetrix 500K Array Set | Illumina Infinium-II HumanHap550 SNP array (v3) |
| Genotyping centre | Canadian Cardiovascular Genetic Centre | Canadian Cardiovascular Genetic Centre | Affymetrix | Broad Institute | Broad Institute | Affymetrix Expression Analysis | Affymetrix | Rotterdam |
| Genotyping calling algorithm | BRLMM & BIRDSEED | BIRDSEED | CHIAMO | BIRDSEED | BIRDSEED | BRLMM | BRLMM | Beadstudio |
| SAMPLE QC | ||||||||
| Call rate | > 98% | > 98% | ≥97% | ≥ 90% | ≥ 90% | ≥ 90% | ≥ 90% | ≥97.5 |
| Heterozygosity | NA | NA | <23% or >30% | NA | NA | NA | NA | FDR ≥ 1% |
| Other exclusions | Ethnic outliers | Ethnic outliers | 1) Ethnic outliers 2) External discordance with genotype or phenotype data 3) Related individuals (>86% concordance with another DNA) 4) Duplicate (>99% concordance with another DNA) | 1) Sex inconsistency with genetic data from X-linked SNPs 2) Inconsistent genotypes when compared with duplicate samples | 1) Sex inconsistency with genetic data from X-linked SNPs 2) Inconsistent genotypes when compared with duplicate samples | 1) Sex inconsistency with genetic data from X-linked SNPs 2) Inconsistent genotypes when compared with duplicate samples | 1) Sex inconsistency with genetic data from X-linked SNPs 2) Inconsistent genotypes when compared with duplicate samples | 1) Ethnic outliers 2) Related individuals 3) Duplicate (>95% concordance with another DNA) |
| SNPQC filters (prior to imputation) | ||||||||
| MAF | ≥5% | ≥1% | ≥1% | ≥1% | ≥1% | ≥1% | ≥1% | ≥1% |
| HWE | p >10-3 controls | p >10-4 controls | p > 10-4 | p > 10-4 | p > 10-4 | p > 10-7 | p > 10-7 | p >10-6 |
| Call rate | ≥ 95% | ≥ 95% | ≥ 98% | ≥ 90% | ≥ 90% | ≥ 90% | ≥ 90% | ≥ 98% |
| Other | ||||||||
| IMPUTATION STATS | ||||||||
| Imputation software | IMPUTE | IMPUTE | IMPUTE | MACH | MACH | IMPUTE | IMPUTE | MACH |
| Imputation quality metrics | properjnfo ≥ 0.40 | properjnfo ≥ 0.40 | properjnfo ≥ 0.40 | r2hat≥0.3 | r2hat≥0.3 | properjnfo ≥ 0.40 | properjnfo ≥ 0.40 | r2hat≥0.3 |
| Other SNPQC filters applied? | MAF ≥1% call rate ≥ 80% | MAF ≥1% call rate ≥ 80% | MAF ≥1% Call rate > 90% | MAF ≥ 1% | MAF ≥ 1% | MAF ≥ 1% | MAF ≥ 1% | MAF ≥ 1% |
| DATA ANALYSIS | ||||||||
| Adjustments | sex | sex | age, sex | age, sex | age, sex | age, sex | age, sex | age, sex |
| Analysis method | additive test | additive test | additive test | logistic regression | logistic regression | logistic regression | logistic regression | Cox regression |
| Software for analysis | SNPTEST | SNPTEST | PLINK | PLINK | PLINK | PLINK | PLINK | ProbABEL |
| REFERENCES | ||||||||
| Reference study | 22 | 22, 23 | 24 | 26 | 27 | 28 | 30, 31 | 32 |
| Reference genotyping | 22 | 22 | 25 | 27 | 27 | 29 | 29 | 33 |
Biochemical analyses
IGF-I and IGFBP-3 were measured in EPIC-Norfolk using non-fasting serum samples collected at baseline and stored frozen at -80°C for approximately 11 years before measurement. Serum levels of IGF-I were measured by radioim-munoassay using a monoclonal antibody (Blood Products, Elstree, Hertfordshire, UK) and recombinant peptide (Gropep, Adelaide, Australia) for standard and tracer (following iodination using the chloramine-T method). Samples were analysed following acid-acetone extraction to deplete IGF binding proteins (IGFBPs) with an excess of IGF-II added to the resulting extract in order to saturate any residual IGFBPs. Intra-assay coefficient of variation (CV) was 8% and inter-assay CV was 11.1%. Serum levels of IGFBP-3 were measured by radioimmunoassay using an in-house polyclonal antibody raised against recombinant IGFBP-3. The assay was calibrated against recombinant glycosylated IGFBP-3 (Dr C Maack, Celltrix, Santa Clara, CA, USA). Samples were analysed following a 1:100 dilution with antibody used at a final dilution of 1:20,000. Intra-assay coefficient of variation (CV) was 4% and inter-assay CV was 10.1%.
Tagging SNPs for IGF1 and IGFBP3 genes
We generated a set of tSNPs for the IGF1 and IGFBP3 genes using resequencing data from the University of Washington SeattleSNPs Programs for Genomic Applications (http://pga.gs.washington.edu/) and NIEHS resequencing program (http://egp.gs.washington.edu), respectively. From these databases, genotypes were available for SNPs spanning 2 kb upstream and downstream of each gene. The aim of our approach was to identify a set of tSNPs that capture all known common SNPs at these loci with a minor allele frequency (MAF) ≥ 0.05 in individuals of European ancestry. We identified 39 SNPs at the IGF1 locus and 26 SNPs at the IGFBP3 locus with a MAF ≥ 0.05 in Coriell individuals with European ethnicity (Figure 1A and B). We used the Tagger program embedded in Haploview [35,36] to generate a set of 13 tSNPs for the IGF1 gene, forcing in three SNPs (rs1520220, rs2946834, rs6220) that had previously been found to correlate with circulating IGF-I levels. [37] For IGFBP3, we generated a set of 15 tSNPs, forcing in three SNPs (rs2132571, rs2132572, rs2854744) previously found to correlate with circulating IGFBP-3 levels. [37] We subsequently discarded six tSNPs for which we were unable to design an assay due to the repetitive nature of the surrounding sequence (Figure 1A and B). These SNPs were not correlated with any other SNP and so alternative tSNPs could not be selected. This left a set of 22 tSNPs that captured 59 of the 65 common variants at a mean r2 of 0.97 (r represents the pairwise correlation coefficient between SNPs). A list of the tSNPs and details of the SNPs captured is given in Table 2.
Figure 1.
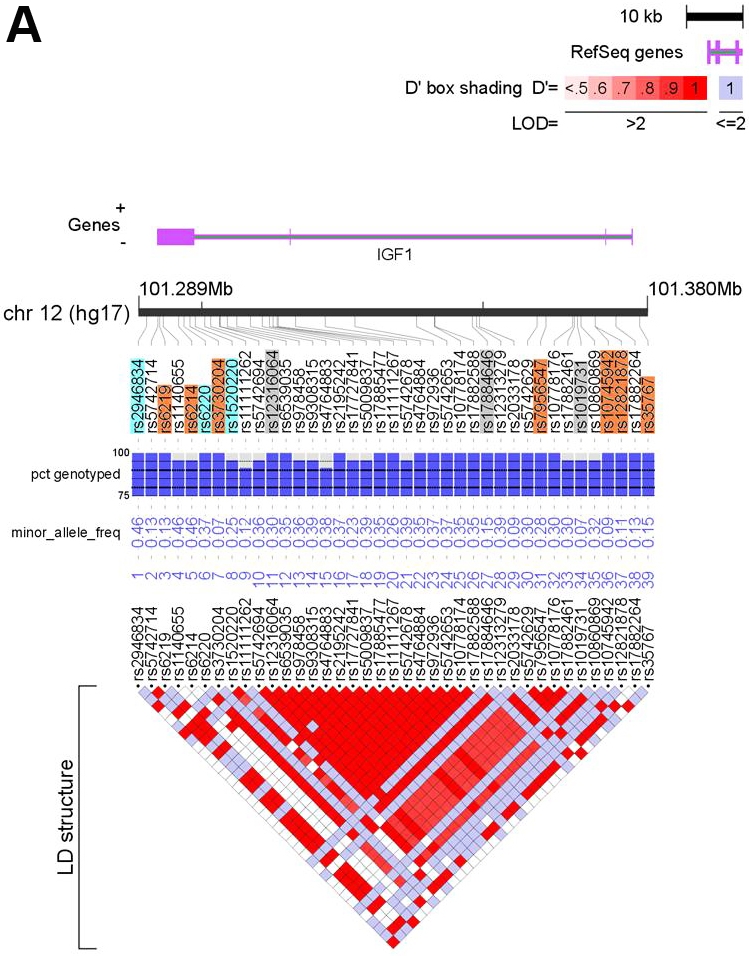
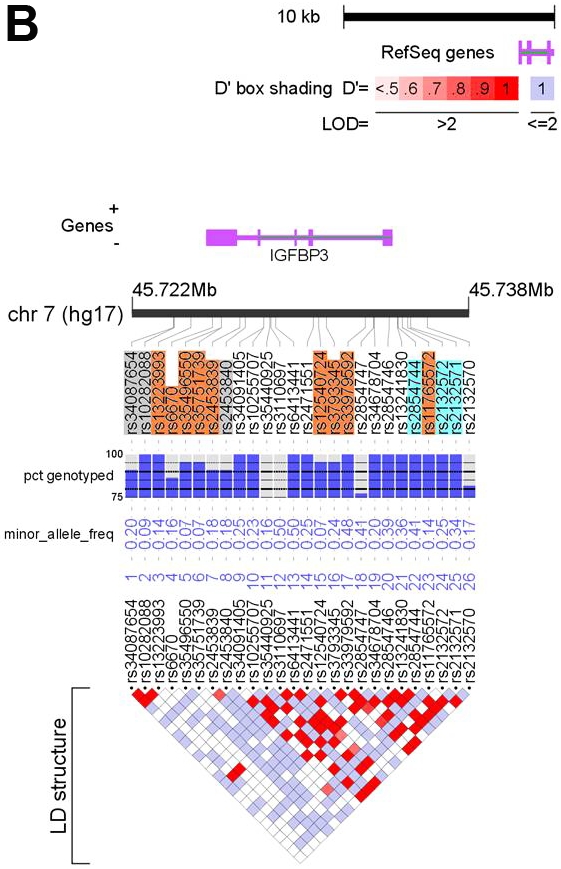
Feature maps of the IGF1 (A) and IGFBP3 (B) genes. Positions of the 39 SNPs at the IGF1 locus and the 26 SNPs at the IGFBP3 locus with MAF ≥0.05 in the resequenced CEPH samples are shown relative to the locus (purple) and chromosome (black bar). SNPs highlighted in orange depict tSNPs and those highlighted blue are tSNPs that were force included (see text for details). tSNPs highlighted in grey were discarded (see text). Underlying each SNP is QC information and MAF in the CEPH samples. The bottom of each figure depicts an LD plot for the locus with pair-wise LD values (D’) presented. See the key for details. The figures were generated using LocusView (T. Petryshen, A. Kirby, M. Ainscow, unpublished software, available from the Broad Institute, Cambridge, MA (http://www.broad.mit.edu/mpg/locusview/). (Refer to next page for Figure 1B).
Table 2.
IGF1 and IGFBP3 tSNPs genotyped in EPIC-Norfolk
| Gene | tSNP | SNPs captured |
|---|---|---|
| IGF1 | rs35767 | rs35767 |
| rs12821878 | rs12821878 | |
| rs10745942 | rs2033178, rs10745942 | |
| rs7956547 | rs17727841, rs11111267, rs5742629, rs7956547, rs10778176, rs17882461, rs10860869 | |
| rs1520220 | rs1520220 | |
| rs3730204 | rs3730204 | |
| rs6220 | rs6220, rs5742694, rs6539035, rs978458, rs9308315, rs4764883, rs2195242, rs5009837, rs17885477, rs5742678, rs4764884, rs972936, rs5742653, rs10778174, rs10778175, rs12313279 | |
| rs6214 | rs6214 | |
| rs6219 | rs5742714, rs6219, rs11111262, rs17882264 | |
| rs2946834 | rs2946834, rs1140655 | |
| IGFBP3 | rs2132571 | rs13241830, rs2132571 |
| rs2132572 | rs10255707, rs2132572, rs2132570 | |
| rs11765572 | rs11765572 | |
| rs2854744 | rs2854746, rs2854744 | |
| rs33979592 | rs6413441, rs33979592, rs2854747, rs3110697 | |
| rs3793345 | rs34091405, rs2471551, rs3793345, rs34678704, rs35440925 | |
| rs12540724 | rs12540724 | |
| rs2453839 | rs2453839 | |
| rs35751739 | rs35751739 | |
| rs35496550 | rs35496550 | |
| rs6670 | rs6670 | |
| rs13223993 | rs13223993 |
Genotyping
Genomic DNA for the EPIC-Norfolk case-control study was whole genome amplified (WGA) prior to genotyping using a GenomiPhi V2 DNA amplification kit (GE Healthcare, Amersham, UK) following the manufacturer's instructions. WGA DNA was normalised using a Quant-iT PicoGreen dsDNA kit (Invitrogen, Paisley, UK). We conducted concordance checks with genomic DNA using a panel of three SNPs in separate genomic locations and obtained > 95% concordance for these SNPs between WGA and genomic DNA. Nineteen tSNPs were genotyped by KBioscience (http://www.kbioscience.co.uk) using KASPar technology, and three (rs6220, rs35767, rs12821878) using a custom Taqman® assay (Applied Biosystems, Warrington, UK) at Strangeways Research Laboratory (University of Cambridge, Cambridge, UK) according to the manufacturer's instructions. Allele calling was done using the ABI PRISM® 7900HT Sequence Detection System (Applied Biosystems, Warrington, UK). Cases and controls were randomly allocated across DNA study plates with two duplicate samples and two water controls in each 96-well plate. Concordance between duplicate samples was > 97% for all SNPs using both methods.
Statistical analysis
Baseline characteristics were compared between cases and controls (Table 3). We natural log transformed triglycerides and C-reactive protein (CRP) before analysis because of their skewed distribution. IGF-I and IGFBP-3 levels were approximately normally distributed. To assess the association between circulating IGF-I and IGFBP-3 levels, cardiovascular risk factors and CAD risk in EPIC-Norfolk (Tables 4-7) we constructed quartiles of IGF-I and IGFBP-3 levels in control participants and applied these quartiles to cases. Selection of confounding risk factors was based on the proposed biological mechanisms linking IGFs to the development of CAD [38] and on previous reports examining the association between IGFs and risk of CAD [14,16,20] and their availability in EPIC-Norfolk. Because of the ambiguity of defining potential confounders and mediators for the association between IGFs and CAD risk, we added potential confounders (see footnote of Table 6) in sequential statistical models, as outlined below. We used linear regression to assess the association between IGF-I and IGFBP-3 quartiles and continuous cardiovascular risk factors in control participants only, with adjustment for age and sex. For categorical variables (sex, diabetes status and smoking status) we used logistic regression to test for association with IGF-I and IGFBP-3 quartiles, with adjustment for age and sex, where appropriate. To test for association between circulating levels of IGF-I and IGFBP-3 and risk of CAD, we used logistic regression to calculate odds ratios and 95% confidence intervals. We analysed these associations using IGF-I and IGFBP-3 levels defined as quartiles based on the distribution among controls and as continuous variables (for a 1 standard deviation (SD) increase). The lowest IGF-I and IGFBP-3 quartiles were used as reference categories and three models were used with increasing degrees of adjustment (Tables 6 and 7). For all three models, we adjusted for study enrolment date to account for differences in storage time of the blood samples. Log likelihood ratio tests were used to test for the presence of effect modification by sex between circulating IGF-I and IGFBP-3 levels and risk of CAD and for possible interaction between IGF-I and IGFBP-3 on risk of CAD.
Table 3.
Baseline characteristics of CAD cases and controls, EPIC-Norfolk, 1993-2003
| Cases | Controls | P-value* | |
|---|---|---|---|
| n = 1013 | n = 2055 | ||
| Age, years | 65 ±8 | 65 ±8 | Matched |
| Men (%) | 654 (65) | 1290 (63) | Matched |
| Smoking: Never (%) | 331 (33) | 834 (41) | < 0 0001 |
| Current/Previous (%) | 682 (67) | 1221 (59) | |
| Diabetes (%) | 63 (6) | 33(2) | < 0.0001 |
| Body mass index, kg/m2 | 27.3 ±3.9 | 26.3 ±3.5 | < 0.0001 |
| Waist circumference (cm) | 94.2 (11.8) | 91.1(11.4) | < 0.0001 |
| Systolic blood pressure, mmHg | 144 ± 19 | 139 ± 18 | < 0.0001 |
| Diastolic blood pressure, mmHg | 86 ±12 | 84 ±11 | < 0.0001 |
| Total cholesterol, mmol/l | 6.5 ± 1.2 | 6.3 ±1.1 | < 0.0001 |
| LDL cholesterol, mmol/l | 4.3 ± 1.1 | 4.1 ±1.0 | < 0.0001 |
| HDL cholesterol, mmol/l | 1.26 ±0.37 | 1.37 ± 0.40 | < 0.0001 |
| Triglycerides, mmol/l† | 1.8 (1.3-2.6) | 1.6(1.1-2.2) | < 0.0001 |
| C-reactive protein, mg/l† | 2.2(1.0-4.9) | 1.5(0.7-3.1) | < 0.0001 |
| IGF-I, ng/ml | 155.1 ± 52.3 | 153.5 ± 48.9 | 0.40 |
| IGFBP-3, mg/l | 4.37 ± 1.31 | 4.30 ± 1.28 | 0.14 |
Data are means and standard deviations, unless otherwise stated.
P-values based on linear regression for continuous variables and X2 tests for categorical variables.
Data are medians (interquartile range) and P-values based on linear regression using log transformation.
Table 4.
Association between IGF-I levels and cardiovascular risk factors in controls at baseline, EPIC-Norfolk, 1993-2003
| Quartiles of IGF-I | 1 | 2 | 3 | 4 | P-value* |
|---|---|---|---|---|---|
| n = 524 | n = 514 | n = 506 | n = 511 | ||
| IGF-I, ng/ml | < 120 | 120-149 | 150-184 | > 184 | |
| Age, year | 67 (66-67) | 66 (65-67) | 65 (64-66) | 63 (63-64) | < 0.0001 |
| Men (%) | 278 (53) | 307 (60) | 337 (67) | 374 (73) | < 0.0001 |
| Smoking: Never (%) | 208 (40) | 206 (40) | 206 (41) | 200 (39) | 0.92 |
| Current/Previous (%) | 316 (60) | 308 (60) | 300 (59) | 311 (61) | |
| Diabetes (%) | 12 (2) | 3 (1) | 5 (1) | 7 (1) | 0.32 |
| Body mass index, kg/m2 | 26.0 (25.7-26.3) | 26.3 (26.0-26.6) | 26.3 (26.0-26.6) | 26.4 (26.1-26.7) | 0.15 |
| Waist circumference (cm) | 90.5 (89.6-91.3) | 91.4 (90.6-92.3) | 91.0 (90.2-91.8) | 91.8 (90.9-92.6) | 0.07 |
| Systolic blood pressure, mmHg | 138 (136-139) | 139 (138-141) | 139 (137-140) | 140 (138-141) | 0.10 |
| Diastolic blood pressure, mmHg | 83 (82-84) | 84 (83-85) | 84 (83-85) | 84 (83-85) | 0.04 |
| Total cholesterol, mmol/l | 6.2 (6.1-6.3) | 6.3 (6.2-6.4) | 6.3 (6.2-6.4) | 6.3 (6.2-6.3) | 0.20 |
| LDL cholesterol, mmol/l | 4.0 (3.9-4.1) | 4.1 (4.0-4.2) | 4.1 (4.0-4.2) | 4.1 (4.0-4.1) | 0.54 |
| HDL cholesterol, mmol/l | 1.38 (1.34-1.41) | 1.36 (1.33-1.39) | 1.39 (1.36-1.42) | 1.36 (1.33-1.39) | 0.79 |
| Triglycerides, mmol/l† | 1.5 (1.5-1.6) | 1.6 (1.6-1.7) | 1.6 (1.5-1.6) | 1.7 (1.6-1.8) | 0.004 |
| C-reactive protein, mg/l† | 1.7 (1.5-1.9) | 1.6 (1.4-1.8) | 1.4 (1.3-1.5) | 1.6 (1.4-1.7) | 0.07 |
| IGFBP-3, mg/l | 3.61 (3.51-3.71) | 4.14 (4.04-4.24) | 4.51 (4.41-4.61) | 4.95 (4.85-5.06) | < 0.0001 |
Data for continuous traits are sex and age adjusted means and 95% confidence intervals. Data for categorical variables (sex, diabetes and smoking) are sex and age adjusted numbers and proportions.
P-values based on linear regression for continuous variables and logistic regression for categorical variables.
Sex and age adjusted geometric means and 95% confidence intervals. P-values are based on linear regression using log transformation.
Table 7.
Association between IGFBP-3 levels and risk of future CAD, EPIC-Norfolk, 1993—2003
| IGFBP-3 levels | Percentile | Cases (%) | Controls (%) | Model 1: adjusted odds ratio (95% CI)* | Model 2: adjusted odds ratio (95% CI)† | Model 3: adjusted odds ratio (95% CI)‡ |
|---|---|---|---|---|---|---|
| < 25th | 253 (25) | 520 (25) | 1.00 | 1.00 | 1.00 | |
| 25th–49th | 237 (23) | 511 (25) | 0.97 (0.78-1.21) | 0.96 (0.77-1.21) | 0.96 (0.76-1.21) | |
| 50th–75th | 256 (25) | 515 (25) | 1.05 (0.85-1.30) | 1.00 (0.80-1.26) | 1.00 (0.79-1.26) | |
| > 75th | 267 (26) | 509 (25) | 1.12 (0.90-1.40) | 1.01 (0.80-1.27) | 1.00 (0.78-1.28) | |
| P-trend (1 df) | 0.23 | 0.86 | 0.92 | |||
| Per 1 SD increase (1.28 mg/l) | 1.08 (1.00-1.16) | 1.03 (0.94-1.11) | 1.03 (0.94-1.12) |
CI, confidence interval.
Model 1: Adjusted for age (continuous), sex and enrolment date.
Model 2: Adjusted for age (continuous), sex and enrolment date, waist circumference (continuous), smoking (categorical—never smokers vs current/previous smokers), diabetes, HDL-c, LDL-c, triglycerides, CRP, systolic and diastolic blood pressure (continuous).
Model 3: Adjusted for age (continuous), sex and enrolment date, waist circumference (continuous), smoking (categorical—never smokers vs current/previous smokers), diabetes, HDL-c, LDL-c, triglycerides, CRP, systolic and diastolic blood pressure (continuous), IGF-I (continuous).
Table 6.
Association between IGF-I levels and risk of future CAD, EPIC-Norfolk, 1993–2003
| IGF-I levels | Percentile | Cases (%) | Controls (%) | Model 1: adjusted odds ratio (95% CI)* | Model 2: adjusted odds ratio (95% CI)† | Model 3: adjusted odds ratio (95% CI)‡ |
|---|---|---|---|---|---|---|
| < 25th | 252 (25) | 524 (26) | 1.00 | 1.00 | 1.00 | |
| 25th–49th | 262 (26) | 514 (25) | 1.05 (0.85-1.30) | 1.05 (0.84-1.31) | 1.03 (0.82-1.29) | |
| 50th–75th | 249 (25) | 506 (25) | 1.01 (0.82-1.26) | 1.06 (0.84-1.32) | 1.03 (0.82-1.30) | |
| > 75th | 250 (25) | 511 (25) | 1.00 (0.81-1.25) | 0.96 (0.76-1.21) | 0.93 (0.72-1.18) | |
| P-trend (1 df) | 0.92 | 0.76 | 0.56 | |||
| Per 1 SD increase (48.9 ng/ml) | 1.03 (0.95-1.11) | 1.01 (0.93-1.09) | 0.98 (0.90-1.06) |
CI, confidence interval.
Model 1: Adjusted for age (continuous), sex and enrolment date.
Model 2: Adjusted for age (continuous), sex and enrolment date, waist circumference (continuous), smoking (categorical—never smokers vs current/previous smokers), diabetes, HDL-c, LDL-c, triglycerides, CRP, systolic and diastolic blood pressure (continuous).
Model 3: Adjusted for age (continuous), sex and enrolment date, waist circumference (continuous), smoking (categorical—never smokers vs current/previous smokers), diabetes, HDL-c, LDL-c, triglycerides, CRP, systolic and diastolic blood pressure (continuous), IGFBP-3 (continuous).
Hardy-Weinberg equilibrium was assessed for each tSNP in control participants using the X2 statistic (1 df). In our primary tests for association, we used linear per allele regression to test for associations among tSNPs and circulating levels of IGF-I and IGFBP-3 in control participants, adjusted for age and sex. To test the linearity of associations between statistically associated tSNPs and circulating IGF-I or IGFBP-3 levels we used log likelihood ratio tests by comparing a general model with the linear per allele model. We also used log likelihood ratio tests to assess for the presence of sex interactions with statistically associated tSNPs and circulating IGF-I and IGFBP-3 levels, with the SNP defined as a linear variable.
To assess whether statistically associated tSNPs contributed independently to circulating IGF-I or IGFBP-3 levels we compared the log likelihood of a nested model (2 df) with that of the full model (3 df) by consecutively adding the other tSNPs (in a linear 1df form) to a model containing the strongest associated tSNP (general inheritance 2df form). We also conducted a reciprocal analysis, adding the strongest associated tSNP (1 df form) to a model with each of the other tSNPs (2 df form). We used pairwise correlation (r2) to assess the extent of linkage disequilibrium among tSNPs in control participants.
In a secondary analysis for all associated tSNPs, we combined summary estimates (regression coefficients and standard errors) from case and control participants from the above linear regression models using meta-analysis. We used a fixed effects model and inverse-variance weighted averages of regression coefficients to obtain a combined estimate of the overall association between tSNPs and circulating IGF-I and IGFBP-3 levels.
To test for associations among tSNPs and risk of CAD in EPIC-Norfolk we used logistic regression using general and linear models adjusted for age, sex and enrolment date. We combined summary estimates (log odds ratios and standard errors) for each of the eight additional CAD case-control studies using meta-analysis, as above, to obtain a combined estimate of the association between SNPs and risk of CAD for a linear model. Between-study heterogeneity was assessed using the X2 test.
To ascertain the presence of haplotype associations at the IGF1 and IGFBP3 genes with circulating IGF-I and IGFBP-3 levels and risk of CAD in EPIC-Norfolk, we constructed haplotypes for IGF1 and IGFBP3 tSNPs using the program TagSNPs, which uses an expectation-substitution approach to account for the uncertainty caused by unphased genotype data [39]. Individuals with > 50% missing genotype data were excluded. Haplotypes with a frequency of < 1% were considered rare, and were pooled for subsequent analyses. To test for global haplotype association with circulating levels and CAD risk, we used regression to compare a model with additive effects for each common haplotype (using the most common haplotype as referent) to a model with no haplotype effects. We used linear regression and logistic regression with no covariate adjustment to test the association between each haplotype and circulating IGF-I or IGFBP-3 levels and to calculate odds ratios and 95% confidence intervals for the association between each haplotype and risk of CAD, respectively, relative to the most common haplotype that was used as the reference.
All analyses were done using Stata 10.1 (Stata Corporation, College Station, TX, USA).
Results
Association analysis of circulating IGF-I and IGFBP-3 levels and risk of subsequent CAD
Table 3 shows the distribution of cardiovascular risk factors among cases and controls in the EPIC-Norfolk CAD nested case-control study. As expected and as previously reported [40], cases had more adverse cardiovascular risk profiles than control participants who remained free of disease during follow-up. There was no material difference between circulating IGF-I and IGFBP-3 levels among cases and controls (Table 3).
We assessed the association between quartiles of IGF-I and IGFBP-3 and baseline cardiovascular risk factors in control participants (Tables 4 and 5). Both IGF-I and IGFBP-3 levels were inversely associated with age, IGF-I levels were higher in men and IGFBP-3 levels higher in women, consistent with previous reports [14,16,17,19,20,41]. Circulating levels of IGF-I were positively associated with IGFBP-3 levels and both circulating IGF-I and IGFBP-3 levels showed positive associations with several cardiovascular risk factors (Tables 4 and 5). The latter findings are consistent with a previous report of a cross-sectional study demonstrating an association between higher levels of IGFBP-3 and the metabolic syndrome [42].
Table 5.
Association between IGFBP-3 levels and cardiovascular risk factors in controls at baseline, EPIC-Norfolk, 1993–2003
| Quartiles of IGFBP-3 | 1 | 2 | 3 | 4 | P-value |
|---|---|---|---|---|---|
| n = 520 | n = 511 | n = 515 | n = 509 | ||
| IGFBP-3, mg/l | < 3.43 | 3.44-4.18 | 4.19-5.11 | > 5.12 | |
| Age, year | 66 (66-67) | 65 (65-66) | 65 (64-66) | 64 (64-65) | < 0.0001 |
| Men (%) | 371 (71) | 331 (65) | 300 (58) | 293 (58) | < 0.0001 |
| Smoking: Never (%) | 227 (44) | 205 (40) | 205 (40) | 184 (36) | 0.02 |
| Current/Previous (%) | 293 (56) | 306 (60) | 310 (60) | 325 (64) | |
| Diabetes (%) | 12 (2) | 9 (2) | 3 (1) | 3 (1) | 0.002 |
| Body mass index, kg/m2 | 25.9 (25.6-26.2) | 26.0 (25.7-26.3) | 26.4 (26.1-26.7) | 26.7 (26.4-27.0) | < 0.0001 |
| Waist circumference (cm) | 90.2 (89.3-91.0) | 90.6 (89.7-91.4) | 91.4 (90.6-92.2) | 92.5 (91.7-93.4) | < 0.0001 |
| Systolic blood pressure, mmHg | 137 (135-138) | 139 (138-141) | 140 (138-141) | 140 (139-142) | 0.002 |
| Diastolic blood pressure, mmHg | 82 (82-83) | 84 (83-85) | 84 (83-85) | 84 (83-85) | 0.002 |
| Total cholesterol, mmol/l | 6.1 (6.0-6.2) | 6.2 (6.1-6.3) | 6.3 (6.2-6.4) | 6.4 (6.3-6.5) | < 0.0001 |
| LDL cholesterol, mmol/l | 4.0 (3.9-4.1) | 4.0 (3.9-4.1) | 4.1 (4.1-4.2) | 4.1 (4.0-4.2) | 0.05 |
| HDL cholesterol, mmol/l | 1.34 (1.31-1.37) | 1.40 (1.37-1.43) | 1.37 (1.34-1.41) | 1.37 (1.34-1.40) | 0.39 |
| Triglycerides, mmol/l* | 1.5 (1.4-1.5) | 1.5 (1.5-1.6) | 1.6 (1.6-1.7) | 1.8 (1.7-1.9) | < 0.0001 |
| C-reactive protein, mg/l* | 1.6 (1.4-1.7) | 1.5 (1.4-1.7) | 1.5 (1.4-1.7) | 1.6 (1.5-1.8) | 0.72 |
| IGF-I, ng/ml | 129.9 (126.1-133.8) | 147.7 (143.8-151.5) | 161.8 (157.9-165.6) | 175.5 (171.6-179.4) | < 0.0001 |
Data for continuous traits are sex and age adjusted means and 95% confidence intervals. Data for categorical variables (sex, diabetes and smoking) are sex and age adjusted numbers and proportions.
P-values based on linear regression for continuous variables and logistic regression for categorical variables.
†Sex and age adjusted geometric means and 95% confidence intervals. P-values are based on linear regression using log transformation.
We next examined the relationship between circulating IGF-I and IGFBP-3 levels and risk of CAD in EPIC-Norfolk. For IGF-I we found no evidence for association with CAD risk (Table 6). For IGFBP-3 we found some evidence for a weak unadjusted association between levels and risk of CAD but this attenuated after adjustment for confounding risk factors (Table 7). Previous studies demonstrating an association between circulating IGF-I and IGFBP-3 levels and risk of CAD have comprised a high proportion of cases with fatal CAD or myocardial infarction [14,15,16,20]. Therefore we conducted an additional subgroup analysis of fatal and non-fatal CAD cases and controls. We did not find any evidence for association for either IGF-I or IGFBP-3 with fatal CAD (data not shown). Furthermore there was no evidence for any interaction between sex and IGF-I or IGFBP-3 for risk of CAD or between IGF-I and IGFBP-3 for risk of CAD.
Association analysis of tagging SNPs and circulating IGF-I and IGFBP-3 levels
Of the 22 tSNPs genotyped in the EPIC-Norfolk CAD nested case-control study (Figure 1A and B and Table 2), three showed deviation from Hardy-Weinberg equilibrium (HWE) in control participants (footnote to Table 8) and so were discarded from further analysis. We assessed associations among the remaining 19 tSNPs and circulating levels of IGF-I and IGFBP-3 (Table 8). Three tSNPs exhibited a MAF < 0.05 in EPIC-Norfolk compared to that observed in resequenced Coriell individuals (Table 8 and Figure 1A and B). Eight tSNPs showed evidence for statistical association with either circulating IGF-I or IGFBP-3 levels at P ≥ 0.05 (Table 8). These include directionally consistent replication of associations between IGF1 tSNPs rs1520220 and rs6220 and circulating IGF-I levels, and between IGFBP3 tSNPs rs2132571 and rs2854744 and circulating IGFBP-3 levels, as shown in our previous report [37]. All eight tSNP associations remained statistically associated in a combined analysis of case and control participants (Table 8) and demonstrated linear associations with circulating IGF-I or IGFBP-3 levels (Table 8). By contrast to our previous report [37], there was no evidence for any interaction between sex and tSNPs with circulating IGF-I or IGFBP-3 levels.
Table 8.
Statistical associations between IGF1 and IGFBP3 tSNPs, circulating IGF-I and IGFBP-3 levels and risk of CAD in EPIC-Norfolk participants
| Genotype | |||||||
|---|---|---|---|---|---|---|---|
| Gene | SNP | Common homozygous | Heterozygous | Rare homozygous | P-trend* | P-trend pooled cases and controls† | |
| IGF1 | rs35767 | MAF: 0.15 | CC | CT | TT | ||
| cases/controls | 776/1559 | 266/539 | 21/50 | ||||
| OR (95% CI) | 1.00 | 0.99(0.83-1.17) | 0.84(0.50-1.42) | 0.67 | - | ||
| IGF-I | 153.3 (150.9-155.6) | 155.1 (151.1-159.1) | 159.3 (146.1-172.5) | 0.27 | 0.35 | ||
| IGF1 | rs12821878 | MAF: 0.23 | GG | GA | AA | ||
| cases/controls | 660/1262 | 359/773 | 60/101 | ||||
| OR (95% CI) | 1.00 | 0.89(0.76-1.04) | 1.14(0.81-1.58) | 0.56 | |||
| IGF-I | 155.7 (153.1-158.3) | 151.6 (148.2-154.9) | 150.9 (141.6-160.2) | 0.05 | 0.02 | ||
| IGF1 | rs7956547 | MAF: 0.24 | TT | TC | CC | ||
| cases/controls | 590/1198 | 392/761 | 72/124 | ||||
| OR (95% CI) | 1.00 | 1.05(0.90-1.23) | 1.18(0.87-1.60) | 0.29 | - | ||
| IGF-I | 152.0 (149.4-154.7) | 155.3 (152.0-158.7) | 159.0 (150.6-167.3) | 0.05 | 0.04 | ||
| IGF1 | rs1520220 | MAF: 0.17 | CC | CG | GG | ||
| cases/controls | 731/1478 | 288/554 | 36/70 | ||||
| OR (95% CI) | 1.00 | 1.05(0.89-1.24) | 1.04(0.69-1.57) | 0.59 | - | ||
| IGF-I | 151.7 (149.2-154.1) | 157.5 (153.5-161.5) | 162.9 (151.7-174.0) | 3.1 × 10⁻³ | 1.4 × 10⁻³ | ||
| IGF1 | rs3730204 | MAF: 0.02 | TT | TC | CC | ||
| cases/controls | 1046/2072 | 18/62 | 1/1 | ||||
| OR (95% CI) | 1.00 | 0.58(0.34-0.98) | 2.00(0.12-32.0) | 0.07 | |||
| IGF-I | 153.3 (151.2-155.3) | 167.1 (155.3-178.9) | 214.8 (121.8-307.9) | 0.01 | 0.03 | ||
| IGF1 | rs6220 | MAF: 0.27 | AA | AG | GG | ||
| cases/controls | 562/1157 | 419/817 | 83/157 | ||||
| OR (95% CI) | 1.00 | 1.05(0.90-1.23) | 1.09(0.82-1.45) | 0.42 | - | ||
| IGF-I | 151.6 (148.9-154.3) | 154.9 (151.7-158.2) | 163.6 (156.1-171.0) | 3.4 × 10⁻³ | 1.4 × 10⁻³ | ||
| IGF1 | rs6214 | MAF: 0.41 | GG | GA | AA | ||
| cases/controls | 358/722 | 509/1053 | 188/335 | ||||
| OR (95% CI) | 1.00 | 0.98(0.83-1.15) | 1.13(0.91-1.41) | 0.39 | - | ||
| IGF-I | 153.1 (149.6-156.6) | 153.7 (150.8-156.5) | 155.1 (150.0-160.2) | 0.55 | 0.94 | ||
| IGF1 | rs6219 | MAF: 0.09 | GG | GA | AA | ||
| cases/controls | 869/1746 | 170/319 | 9/23 | ||||
| OR (95% CI) | 1.00 | 1.07 (0.88-1.31) | 0.78(0.36-1.70) | 0.76 | |||
| IGF-I | 152.9 (150.6-155.1) | 156.4 (151.2-161.7) | 158.5 (139.0-177.9) | 0.19 | 0.04 | ||
| IGFBP3 | rs2132571 | MAF: 0.32 | GG | GA | AA | ||
| cases/controls | 486/980 | 441/884 | 119/223 | ||||
| OR (95% CI) | 1.00 | 1.01(0.86-1.18) | 1.08(0.84-1.38) | 0.63 | - | ||
| IGFBP-3 | 4.42 (4.34-4.50) | 4.27 (4.19-4.36) | 4.16 (3.99-4.33) | 1.3 × 10⁻³ | 9.8 × 10⁻³ | ||
| IGFBP3 | rs2132572 | MAF: 0.23 | GG | GA | AA | ||
| cases/controls | 655/1264 | 357/745 | 52/124 | ||||
| OR (95% CI) | 1.00 | 0.92(0.79-1.08) | 0.81(0.58-1.13) | 0.15 | - | ||
| IGFBP-3 | 4.32 (4.25-4.40) | 4.32 (4.22-4.41) | 4.45 (4.23-4.68) | 0.56 | 0.82 | ||
| IGFBP3 | rs11765572 | MAF: 0.13 | GG | GA | AA | ||
| cases/controls | 801/1594 | 234/457 | 15/44 | ||||
| OR (95% CI) | 1.00 | 1.02(0.85-1.22) | 0.68(0.37-1.22) | 0.63 | |||
| IGFBP-3 | 4.35 (4.28-4.41) | 4.29 (4.17-4.41) | 4.04 (3.66-4.43) | 0.15 | 0.80 | ||
| IGFBP3 | rs2854744 | MAF: 0.44 | CC | CA | AA | ||
| cases/controls | 308/663 | 507/977 | 215/425 | ||||
| OR (95% CI) | 1.00 | 1.12(0.94-1.33) | 1.09(0.88-1.35) | 0.36 | - | ||
| IGFBP-3 | 4.28 (4.18-4.38) | 4.30 (4.22-4.38) | 4.47 (4.34-4.59) | 0.03 | 0.04 | ||
| IGFBP3 | rs3793345 | MAF : 0.20 | TT | TC | CC | ||
| cases/controls | 662/1351 | 342/657 | 48/83 | ||||
| OR (95% CI) | 1.00 | 1.06 (0.91-1.25) | 1.18 (0.82-1.71) | 0.28 | - | ||
| IGFBP-3 | 4.38 (4.31-4.45) | 4.26 (4.16-4.36) | 4.07 (3.79-4.34) | 6.6 × 10⁻³ | 9.3 × 10⁻⁴ | ||
| IGFBP3 | rs12540724 | MAF : 0.03 | AA | AG | GG | ||
| cases/controls | 978/1996 | 78/117 | 1/2 | ||||
| OR (95% CI) | 1.00 | 1.36 (1.01-1.83) | 1.00 (0.09-11.1) | 0.05 | - | ||
| IGFBP-3 | 4.34 (4.28-4.39) | 4.16 (3.92-4.39) | 5.51 (3.71-7.31) | 0.27 | 0.07 | ||
| IGFBP3 | rs2453839 | MAF : 0.18 | TT | TC | CC | ||
| cases/controls | 687/1422 | 333/624 | 45/69 | ||||
| OR (95% CI) | 1.00 | 1.11 (0.94-1.30) | 1.34 (0.91-1.98) | 0.08 | - | ||
| IGFBP-3 | 4.34 (4.27-4.41) | 4.29 (4.19-4.39) | 4.46 (4.15-4.76) | 0.84 | 0.17 | ||
| IGFBP3 | rs35751739 | MAF : 0.03 | GG | GA | AA | ||
| cases/controls | 1009/1994 | 47/105 | 1/2 | ||||
| OR (95% CI) | 1.00 | 0.89 (0.62-1.26) | 1.01 (0.09-11.2) | 0.53 | - | ||
| IGFBP-3 | 4.32 (4.26-4.38) | 4.47 (4.22-4.72) | 3.87 (2.07-5.66) | 0.34 | 0.96 | ||
| IGFBP3 | rs35496550 | MAF : 0.12 | AA | A- | – | ||
| cases/controls | 824/1606 | 203/453 | 21/27 | ||||
| OR (95% CI) | 1.00 | 0.87 (0.73-1.05) | 1.52 (0.86-2.71) | 0.61 | - | ||
| IGFBP-3 | 4.31 (4.25-4.37) | 4.43 (4.31-4.55) | 3.99 (3.50-4.48) | 0.32 | 0.43 | ||
| IGFBP3 | rs6670 | MAF : 0.22 | AA | AT | TT | ||
| cases/controls | 610/1287 | 381/716 | 59/103 | ||||
| OR (95% CI) | 1.00 | 1.12 (0.96-1.31) | 1.21 (0.86-1.69) | 0.10 | - | ||
| IGFBP-3 | 4.31 (4.24-4.38) | 4.37 (4.28-4.47) | 4.41 (4.16-4.66) | 0.22 | 0.36 | ||
| IGFBP3 | rs13223993 | MAF : 0.21 | GG | GA | AA | ||
| cases/controls | 657/1318 | 344/679 | 54/111 | ||||
| OR (95% CI) | 1.00 | 1.02 (0.87-1.19) | 0.98 (0.70-1.37) | 0.96 | - | ||
| IGFBP-3 | 4.34 (4.27-4.41) | 4.34 (4.24-4.43) | 4.23 (3.99-4.47) | 0.57 | 0.12 |
All tSNPs above were in Hardy-Weinberg equilibrium (HWE) in control participants (P ≥ 0.05).
For IGF1, tSNPs rs10745942 and rs2946834 were not in HWE and for IGFBP3 tSNP rs33979592 was not in HWE. These variants were discarded from further analysis in EPIC-Norfolk.
Minor allele frequency (MAF) is based on the EPIC-Norfolk study control participants.
Data for circulating IGF-I and IGFBP-3 levels are sex and age adjusted means and 95% confidence intervals.
Primary tests for association between tSNPs and circulating IGF-I and IGFBP-3 levels were conducted using data from up to 2,223 control participants using linear regression analysis using an additive model adjusted for age and sex.
Secondary association analyses were conducted by combining summary estimates (beta coefficients and standard errors) from above linear regression analyses in up to 1,133 cases and 2,223 controls using combined analysis.
Tests for association between tSNPs and risk of CAD were conducted using data from up to 1,133 cases and 2,223 controls using logistic regression analysis and general and log additive models with adjustment for age, sex and enrolment date.
OR, odds ratio.
CI, confidence interval.
To contextualise the magnitudes of associations observed between tSNPs and circulating levels of IGF-I and IGFBP-3 for ease of interpretation, we present the proportion of a 1 SD change in circulating levels shown by each associated tSNP (Table 9). The five tSNPs showing association with IGF-I levels were associated with between 7-30% of a 1 SD change in circulating IGF -I concentrations per allele (Table 9). For IGFBP-3, the three statistically associated tSNPs (Table 8) were associated with between 7-11% of a 1 SD change in circulating IGFBP-3 concentrations per allele (Table 9). We assessed the independence of the individual tSNP associations with circulating IGF-I levels and found that tSNPs rs1520220 and rs3730204 at the IGF1 locus were sufficient to explain the associations for the other three tSNPs. Similarly at the IGFBP3 locus, tSNP rs2132571 was sufficient to explain the associations with circulating IGFBP-3 levels observed for the other two tSNPs.
Table 9.
Summary statistics for IGFl and IGFBP3 tSNPs showing statistical association with circulating IGF-I and IGFBP-3 levels in up to 2,223 EPIC-Norfolk control participants
| SNP | Gene | Position in gene | Minor allele | MAF* | β-coefficient (se)† | P-value | Percent of 1SD change in circulating levels‡ |
|---|---|---|---|---|---|---|---|
| IGF-I | |||||||
| rs12821878 | IGF1 | intron 2 | A | 0.23 | -3.406(1.761) | 0.05 | 7.0% |
| rs7956547 | IGF1 | intron 2 | C | 0.24 | 3.385(1.710) | 0.05 | 6.9% |
| rs1520220 | IGF1 | intron 3 | G | 0.17 | 5.735(1.936) | 3.1×10⁻³ | 11.7% |
| rs3730204 | IGF1 | 3’UTR | C | 0.02 | 14.867 (5.922) | 0.01 | 30.4% |
| rs6220 | IGF1 | 3’UTR | G | 0.27 | 4.784 (1.635) | 3.4 × 10⁻³ | 9.8% |
| IGFBP-3 | |||||||
| rs2132571 | IGFBP3 | 5’ | A | 0.32 | -0.136(0.042) | 1.3 × 10⁻³ | 10.7% |
| rs2854744 | IGFBP3 | 5’ | A | 0.44 | 0.086 (0.040) | 0.03 | 6.7% |
| rs3793345 | IGFBP3 | intron 1 | C | 0.20 | -0.136 (0.050) | 6.6 × 10⁻³ | 10.6% |
Based on the EPIC-Norfolk study control participants.
Beta-coefficients represent the change in circulating IGF-I or IGFBP-3 levels per additional minor allele, adjusted for age and sex.
Percentage of a 1 SD change in circulating IGF-I or IGFBP-3 levels per additional minor allele, adjusted for age and sex. A 1 SD change in circulating IGF-I was derived from control participants and is 48.9 ng/ml; for IGFBP-3 it is 1.28 mg/l (Table 3).
We conducted an analysis to assess for the presence of haplotype effects at the IGF1 and IGFBP3 loci that might reflect associations of untyped SNPs (Tables 10 and 11). There were no significant global haplotypic associations for IGF1 or IGFBP3 (P > 0.05). For IGF1, individual haplotypic associations were fully explained by the associations shown by individual SNPs (Table 9). However, for IGFBP3 a strong association with circulating IGFBP-3 levels was shown by a haplotype that contains the minor allele of both tSNPs rs2132571 and rs3793345 (Table 11). The magnitude of association of this haplotype with circulating levels is almost twice that shown for either SNP individually (18% of a 1SD change in IGFBP-3 levels compared with 11% for the two SNPs, Table 9), suggesting that tSNPs rs2132571 and rs3793345 might capture an untyped variant that has a strong effect on circulating IGFBP-3 levels.
Table 10.
IGF1 haplotype analysis results for association with circulating IGF-I levels and risk of CAD in EPIC-Norfolk
| IGF-I levels | CAD risk | ||||
|---|---|---|---|---|---|
| Haplotype | Frequency (%) * | β-coefficient (se)† | P-value | OR (95% CI)‡ | P-value |
| h00000010 | 0.21 | 0 | - | 1.00 | - |
| h01000000 | 0.20 | -3.873 (1.965) | 0.05 | 0.91 (0.79-1.04) | 0.18 |
| h00000000 | 0.18 | -0.728 (2.076) | 0.73 | 0.97 (0.84-1.12) | 0.68 |
| h00H0101 | 0.09 | 3.834 (2.595) | 0.14 | 1.04 (0.87-1.24) | 0.68 |
| h00100H0 | 0.07 | 0.158(2.908) | 0.96 | 1.08 (0.89-1.32) | 0.43 |
| h10010100 | 0.06 | 4.106(3.242) | 0.21 | 0.96(0.76-1.21) | 0.73 |
| h10000010 | 0.05 | -1.443 (3.714) | 0.70 | 0.97 (0.75-1.25) | 0.80 |
| h00100000 | 0.04 | -2.305 (3.916) | 0.56 | 1.15 (0.88-1.49) | 0.30 |
| h01000010 | 0.03 | 2.184(5.348) | 0.68 | 1.37 (0.98-1.92) | 0.06 |
| h00101110 | 0.01 | 14.573(6.179) | 0.02 | 0.61(0.37-1.02) | 0.06 |
| h10000000 | 0.01 | -12.969 (8.975) | 0.15 | 0.88 (0.46-1.66) | 0.69 |
| Rare | - | 8.070 (4.135) | 0.05 | 1.14(0.87-1.51) | 0.34 |
In the hapiotypes, 0 corresponds to the common allele for each SNP and 1 the minor allele (Table 8). SNP order in hapiotypes is 5’-3’ of the IGF1 gene, as given in Table 8 as follows: rs35767, rs12821878, rs7956547, rs1520220, rs3730204, rs6220, rs6214, rs6219.
Haplotype frequencies are based on the EPIC-Norfolk study control participants.
Tests for association between hapiotypes and circulating IGF-I levels were conducted in up to 2,223 control participants using linear regression with no covariate adjustment.
Tests for association between hapiotypes and CAD risk were conducted up to 1,133 cases and 2,223 controls using logistic regression analysis with no covariate adjustment. OR, odds ratio. CI, confidence interval.
Table 11.
IGFBP3 haplotype analysis results for association with circulating IGFBP-3 levels and risk of CAD in EPIC-Norfolk
| IGFBP-3 levels | CAD risk | ||||
|---|---|---|---|---|---|
| Haplotype | Frequency (%)* | β-coefficient (se)† | P-value | OR (95% CI)‡ | P-value |
| h01000000000 | 0.14 | 0 | - | 1.00 | - |
| h00010000000 | 0.13 | 0.109 (0.065) | 0.10 | 0.92 (0.78-1.10) | 0.36 |
| h10100010000 | 0.10 | -0.122(0.068) | 0.07 | 1.09 (0.92-1.29) | 0.32 |
| h10001000000 | 0.09 | -0.234 (0.075) | 1.8 × 10⁻³ | 0.95 (0.78-1.16) | 0.60 |
| h00010000010 | 0.09 | 0.094 (0.077) | 0.22 | 1.09 (0.90-1.32) | 0.38 |
| h10001000010 | 0.08 | -0.015 (0.078) | 0.85 | 1.18(0.97-1.43) | 0.10 |
| h00010000101 | 0.08 | 0.033 (0.078) | 0.67 | 0.92 (0.75-1.13) | 0.44 |
| h00010010000 | 0.04 | 0.141(0.106) | 0.18 | 1.23 (0.95-1.60) | 0.12 |
| h00010000001 | 0.04 | -0.155(0.113) | 0.17 | 1.13(0.85-1.48) | 0.40 |
| h01000000001 | 0.04 | 0.014 (0.111) | 0.90 | 0.90 (0.67-1.21) | 0.48 |
| h01000100001 | 0.02 | -0.088 (0.135) | 0.51 | 1.38 (1.00-1.89) | 0.05 |
| h00010000100 | 0.02 | 0.160 (0.176) | 0.36 | 1.27 (0.83-1.94) | 0.27 |
| h00010010010 | 0.02 | 0.101(0.194) | 0.60 | 1.18 (0.73-1.92) | 0.50 |
| h01000001000 | 0.01 | 0.040 (0.191) | 0.83 | 1.08 (0.67-1.73) | 0.75 |
| Rare | - | 0.034(0.077) | 0.65 | 0.87 (0.71-1.07) | 0.20 |
In the haplotypes, 0 corresponds to the common allele for each SNP and 1 the minor allele (Table 8). SNP order in haplotypes is 5’-3’ of the IGFBP3 gene, as given in Table 8 as follows: rs2132571, rs2132572, rs11765572, rs2854744, rs3793345, rs12540724, rs2453839, rs35751739, rs35496550, rs6670, rs13223993.
Haplotype frequencies are based on the EPIC-Norfolk study control participants.
Tests for association between haplotypes and circulating IGFBP-3 levels were conducted in up to 2,223 control participants using linear regression with no covariate adjustment.
Tests for association between haplotypes and CAD risk were conducted up to 1,133 cases and 2,223 controls using logistic regression analysis with no covariate adjustment. OR, odds ratio. CI, confidence interval.
Association analysis of tagging SNPs and risk of CAD
It is possible that variation at the IGF1 and IGFBP3 genes could influence risk of CAD via pleiotropic effects on mechanisms independent from circulating levels; for example reflecting tissue-specific variation in IGF-I or IGFBP-3 action. We therefore assessed the association between IGF1 and IGFBP3 tSNPs and risk of CAD in the EPIC-Norfolk CAD nested case-control study. Table 8 shows the association between these 19 SNPs and risk of CAD in up to 1,133 cases and 2,223 controls. We did not find any robust evidence for association with CAD for any of the tSNPs in EPIC-Norfolk. Similarly, global or individual haplotype analyses did not reveal any robust associations with CAD risk for either IGF1 or IGFBP3 (Tables 10 and 11, global haplotypic P-values > 0.05). To increase statistical power for this analysis, we tested 31 SNPs spanning the IGF1 and IGFBP3 genes in eight CAD studies that are part of an established collaborative consortium. SNP genotypes were available in silico from genome-wide SNP chips or imputation analyses (Table 1). We combined our data from EPIC-Norfolk with these eight studies, in total comprising up to 9,319 cases and 19,964 controls. The results of this additional analysis are shown in Table 12 and show no evidence for association between common variants at the IGF1 and IGFBP3 genes and risk of CAD.
Table 12.
Association between IGF1 and IGFBP3 SNPs and risk of CAD in a combined analysis of nine studies
| SNP | Gene | Position in gene | Minor allele | MAF* | No. cases/controls | OR (95% CI)† | P-value | P-value for heterogeneity |
|---|---|---|---|---|---|---|---|---|
| rs35767 | IGF1 | 5’ | T | 0.15 | 8,963/19,660 | 0.96 (0.90-1.02) | 0.19 | 0.95 |
| rs12821878 | IGF1 | intron 2 | A | 0.23 | 9,319/19,964 | 1.03 (0.98-1.08) | 0.21 | 0.96 |
| rs10745942 | IGF1 | intron 2 | A | 0.04 | 8,012/17,600 | 0.94 (0.86-1.03) | 0.18 | 0.72 |
| rs10860869 | IGF1 | intron 2 | T | 0.26 | 8,248/17,836 | 0.97 (0.93-1.02) | 0.32 | 0.41 |
| rs1O19731 | IGF1 | intron 2 | T | 0.17 | 8,120/17,722 | 1.03 (0.97-1.10) | 0.36 | 0.95 |
| rs1O778176 | IGF1 | intron 2 | T | 0.26 | 8,223/17,812 | 0.97 (0.93-1.02) | 0.31 | 0.42 |
| rs7956547 | IGF1 | intron 2 | C | 0.24 | 9,100/19,602 | 1.00 (0.95-1.05) | 0.97 | 0.37 |
| rs5742629 | IGF1 | intron 2 | G | 0.27 | 8,187/17,757 | 0.98 (0.93-1.03) | 0.37 | 0.40 |
| rs2033178 | IGF1 | intron 2 | T | 0.05 | 8,209/17,816 | 0.97 (0.89-1.06) | 0.55 | 0.65 |
| rs972936 | IGF1 | intron 2 | A | 0.23 | 8,245/17,839 | 0.96 (0.91-1.01) | 0.11 | 0.43 |
| rs5742678 | IGF1 | intron 2 | G | 0.23 | 8,251/17,839 | 0.96 (0.91-1.01) | 0.13 | 0.42 |
| rs5009837 | IGF1 | intron 3 | T | 0.25 | 8,249/17,833 | 0.97 (0.92-1.01) | 0.17 | 0.40 |
| rs17727841 | IGF1 | intron 3 | C | 0.16 | 8,227/17,828 | 0.98 (0.92-1.04) | 0.45 | 0.71 |
| rs9308315 | IGF1 | intron 3 | A | 0.23 | 8,181/17,797 | 0.96 (0.91-1.01) | 0.15 | 0.56 |
| rs978458 | IGF1 | intron 3 | A | 0.23 | 8,247/17,834 | 0.96 (0.91-1.01) | 0.13 | 0.53 |
| rs5742694 | IGF1 | intron 3 | G | 0.19 | 7,798/11,129 | 0.96 (0.91-1.02) | 0.16 | 0.28 |
| rs1520220 | IGF1 | intron 3 | G | 0.17 | 9,212/19,850 | 0.98 (0.93-1.04) | 0.53 | 0.10 |
| rs6214 | IGF1 | 3’UTR | A | 0.41 | 6,770/16,683 | 1.01 (0.96-1.06) | 0.66 | 0.78 |
| rs6219 | IGF1 | 3’UTR | A | 0.09 | 9,207/19,844 | 1.01 (0.94-1.08) | 0.81 | 0.36 |
| rs5742714 | IGF1 | 3’UTR | C | 0.08 | 8,160/17,758 | 1.01 (0.93-1.09) | 0.90 | 0.27 |
| rs2946834 | IGF1 | 3’ | T | 0.31 | 8,062/17,678 | 0.98 (0.93-1.03) | 0.43 | 0.08 |
| rs2132571 | IGFBP3 | 5’ | A | 0.32 | 8,748/13,126 | 1.01 (0.96-1.05) | 0.76 | 0.55 |
| rs2132572 | IGFBP3 | 5’ | A | 0.23 | 8,811/13,213 | 0.97 (0.92-1.02) | 0.18 | 0.17 |
| rs2471551 | IGFBP3 | intron 1 | C | 0.29 | 4,741/13,432 | 0.99 (0.91-1.07) | 0.71 | 0.26 |
| rs3110697 | IGFBP3 | intron 3 | A | 0.49 | 4,780/13,441 | 1.00 (0.93-1.06) | 0.88 | 0.54 |
| rs1O2557O7 | IGFBP3 | intron 3 | T | 0.17 | 7,988/17,605 | 0.99 (0.93-1.04) | 0.63 | 0.21 |
| rs2453840 | IGFBP3 | intron 4 | T | 0.22 | 5,848/14,603 | 1.01 (0.94-1.09) | 0.70 | 0.57 |
| rs2453839 | IGFBP3 | intron 4 | C | 0.18 | 9,289/19,943 | 1.01 (0.96-1.07) | 0.58 | 0.35 |
| rs667O | IGFBP3 | 3’UTR | T | 0.22 | 3,923/14,620 | 1.01(0.93-1.10) | 0.81 | 7.3 × 10⁻³ |
| rs13223993 | IGFBP3 | 3’ | A | 0.21 | 9,108/19,744 | 0.96 (0.91-1.00) | 0.07 | 0.03 |
| rs10282088 | IGFBP3 | 3’ | A | 0.11 | 8,198/17,821 | 0.98 (0.92-1.03) | 0.41 | 3.2 × 10⁻³ |
MAFs in italics are based on the EPIC-Norfolk study control participants and all others are based on HapMap CEU samples.
Odds ratios are based on the additive model. OR, odds ratio. CI, confidence interval.
Discussion
This is the first study to conduct a systematic assessment of the interrelationships among circulating levels of IGF-I and IGFBP-3, common genetic variants at these loci, and risk of CAD. By contrast with previous smaller studies that have assessed the relationship between circulating IGF-I and IGFBP-3 levels and risk of cardiovascular disease, our results-from the largest prospective study to date-suggest that circulating levels of IGF-I and IGFBP-3 and genetic variants at the IGF1 and IGFBP3 genes do not materially influence the risk of CAD.
Our findings suggesting a lack of association between circulating IGF-I and IGFBP-3 levels and risk of CAD differ from those in a population -based nested case-control study in Denmark that reported a positive association between circulating IGFBP-3 levels and ischemic heart disease risk [14] and in the Cardiovascular Health Study, where low circulating IGFBP-3 levels were associated with an increased risk of coronary events in elderly individuals [15]. The Danish study and other prospective studies have also reported inverse associations between circulating IGF-I levels and risk of ischemic heart disease [14,16,43] and heart failure [20], although a recent study has found a positive association between IGF-I levels and risk of heart failure, but no association with overall incidence of cardiovascular disease [13]. However, our results are consistent with three recent reports based on prospective cohort studies, two of which were conducted in women only [17,18,19]. The studies above are small and therefore subject to random variability, with no previous individual study exceeding 550 cases. Furthermore, previous studies have been conducted in relatively disparate populations (e.g. three were conducted in relatively elderly populations [13,16,20]). Such diversity highlights potential limitations in combining the findings of all available studies.
In addition to other known limitations of observational studies, such as incomplete control of confounders and bias, these apparently divergent findings may be due to several factors-heterogeneity in phenotype, age and sex of participants, heterogeneity among IGF-I and IGFBP-3 immunoassays, and pleiotropic effects of IGFs and their binding proteins that may have different actions in different contexts. We did not measure IGFBP-1 in EPIC-Norfolk, and it is possible that circulating levels of this binding protein may modify the relationships of other IGFs and clinical biomarkers on disease, which has been shown in the context of the metabolic syndrome [42,44]. Although we measured circulating IGFs in samples that were non-fasting and were measured only once at baseline, our study showed the expected associations between age and sex and circulating IGF-I and IGFBP-3 levels and consistent replication of several SNP associations with circulating levels, thus decreasing the likelihood of substantial random measurement error. Furthermore, intra-individual variation in levels of IGFs is low. Indeed, it has been reported in 249 participants with serial measurements (mean interval three years) that circulating levels of IGFs have high levels of within-person correlation (r > 0.8) over time [15].
We identified several SNPs at the IGF1 and IGFBP3 loci that are associated with circulating IGF-I and IGFBP-3 levels. At the IGF1 locus, five tSNPs were associated with circulating IGF-I levels. The associations for rs1520220, rs6220 and rs3730204 are consistent with previous reports [37,45,46,47,48,49]. In a multivariate analysis of the IGF1 tSNPs, we found that rs1520220 and rs3730204 were sufficient to account for the other three tSNP associations with circulating IGF-I levels. tSNP rs3730204 is located in the 3' untranslated region (UTR) of the IGF1 gene (Figure 1A, thus it is a good functional candidate as it could potentially influence post-transcriptional processing of IGF1 mRNA. However, this SNP is a low-frequency variant (MAF 0.02) and, with only two rare homozygotes in our dataset, it is likely that our observed association is inflated. As rs1520220 is located in intronic sequence it is more likely that this SNP is capturing an untyped functional variant elsewhere in the gene.
We found three tSNPs at the IGFBP3 gene that were associated with circulating IGFBP-3 levels. Again, associations for tSNPs rs2132571 and rs2854744 are consistent with previous reports [37,46,50,51,52,53]. In a multivariate analysis of the three associated IGFBP3 tSNPs we found that rs2132571 explained the other two tSNP associations with circulating IGFBP-3 levels at this locus in EPIC-Norfolk, although the results from our haplotype analysis suggest that rs2132571 and rs3793345 jointly capture an untyped functional variant with a substantial effect on circulating IGFBP-3 levels (Table 11). SNP rs2132571 lies 5' of the IGFBP3 locus and is moderately correlated with rs2854744 in EPIC-Norfolk (r2 0.61), thus it may be capturing some residual signal from this SNP that has been shown in cellular expression studies to directly influence promoter activity of the IGFBP3 gene [52].
Some of the disparities in the associations observed between specific SNPs and IGF-I and IGFBP-3 levels among studies are likely due to sampling variation and subtle differences in LD across these loci among populations. This reflects the fact that we are not directly assessing the causal variant(s) underlying these associations, perhaps with the exception of rs2854744 that shows very reproducible associations across multiple studies and ethnic groups and has evidence to support its functionality. Cellular expression studies will be required to assess the functionality of other associated tSNPs at both of these loci.
To our knowledge, our study is the first to assess the risk between common SNPs at the IGF1 and IGFBP3 loci with risk of CAD in a large prospective study. The strengths of our study are its size, and that we used a systematic tagging approach to capture all common SNPs (MAF ≥ 0.05) at the IGF1 and IGFBP3 loci. However, it is possible that there are rare variants at these loci that we have not captured in our current analysis and we may not have had sufficient statistical power to detect modest SNP associations with CAD risk. An assessment of the coverage between our SNPs and those in HapMap suggests that, at an r2 threshold of 0.8, we captured 45% and 66% of the variation above MAF 1% in IGF1 and IGFBP3 respectively spanning +/-10 kb of the loci, although this will be an underestimation because several of our tSNPs are not in HapMap. We may also have missed some additional associations between SNPs and circulating levels due to exclusion of three tSNPs that deviated from HWE in our samples and six SNPs which failed assay design. We did not genotype the microsatellite polymorphism in the promoter region of the IGF1 gene that has been reported to be associated with circulating IGF-I levels and risk of myocardial infarction, although these associations are inconsistent [53,54,55,56,57]. A recent paper by Dupuis et al has identified an association between SNP rs35767 and glycaemic traits, with the G allele associated with an adverse glycaemic profile [58]. Although the association between this SNP and circulating IGF-I levels was not statistically significant in our study, the corresponding allele (coded as C in our data) does show a trend with lower IGF-I levels (Table 8), consistent with these findings. Two recent reports by Palles et al and Schumacher et al have found a similar association between SNP rs35767 and IGF-I levels [59,60], so our lack of statistical association may have been simply due to insufficient sample size or variation among populations as discussed above. We did not find any evidence for association with SNP rs35767 and CAD risk in around 9,000 cases and 20,000 controls (Table 12), but given the small magnitude of the associations with glycaemic traits in Dupuis et al, it is possible that there might be a weak association with CAD that could be detected with a larger sample. Palles et al have also identified three SNPs that lie approximately 70 kb 5' to the IGF1 gene that are associated with circulating IGF-I levels [59]. These SNPs lie near to a putative transcription factor binding site that regulates IGF1 gene expression [59], thus there are likely to be additional variants both cis and trans that might affect the expression of IGFs that will need to be characterised by further resequencingand replication efforts. However, the comprehensive SNP tagging approach that we have used in our analysis is likely to have captured the majority of the common variation at the IGF1 and IGFBP3 loci that will be relevant to the general population.
In summary, our results suggest that circulating levels of insulin-like growth factor-I (IGF-I), its major binding protein IGF-binding protein 3 (IGFBP-3) and genetic variants at the loci encoding these proteins do not influence the risk of CAD.
Acknowledgments
We thank the participants, general practitioners and staff in the EPIC-Norfolk study. The EPIC-Norfolk study is supported by programme grants from the Medical Research Council UK and Cancer Research UK. This work was funded by British Heart Foundation project grant PG/05/047.
GEMS Investigators
Philip Barter, Y Antero Kesäniemi, Robert W Mahley, Scott M Grundy, Ruth McPherson, Gerard Waeber.
Conflicts of Interest
None
References
- 1.Clemmons DR. Role of insulin-like growth factor binding proteins in controlling IGF actions. Mol Cell Endocrinol. 1998;140:19–24. doi: 10.1016/s0303-7207(98)00024-0. [DOI] [PubMed] [Google Scholar]
- 2.Holly J, Perks C. The role of insulin-like growth factor binding proteins. Neuroendocrinology. 2006;83:154–160. doi: 10.1159/000095523. [DOI] [PubMed] [Google Scholar]
- 3.Duerr RL, Huang S, Miraliakbar HR, Clark R, Chien KR, Ross J., Jr Insulin-like growth factor-I enhances ventricular hypertrophy and function during the onset of experimental cardiac failure. J Clin Invest. 1995;95:619–627. doi: 10.1172/JCI117706. [DOI] [PMC free article] [PubMed] [Google Scholar]
- 4.Kotlyar AA, Vered Z, Goldberg I, Chouraqui P, Nas D, Fridman E, Chen-Levy Z, Fytlovich S, Sangiorgi G, Spagnoli LG, Orlandi A, Savion N, Eldar M, Scheinowitz M. Insulin-like growth factor I and II preserve myocardial structure in postinfarct swine. Heart. 2001;86:693–700. doi: 10.1136/heart.86.6.693. [DOI] [PMC free article] [PubMed] [Google Scholar]
- 5.Li Q, Li B, Wang X, Leri A, Jana KP, Liu Y, Kajstura J, Baserga R, Anversa P. Overex-pression of insulin-like growth factor-I in mice protects from myocyte death after infarction, attenuating ventricular dilation, wall stress, and cardiac hypertrophy. J Clin Invest. 1997;100:1991–1999. doi: 10.1172/JCI119730. [DOI] [PMC free article] [PubMed] [Google Scholar]
- 6.Ren J, Samson WK, Sowers JR. Insulin-like growth factor I as a cardiac hormone: physiological and pathophysiological implications in heart disease. J Mol Cell Cardiol. 1999;31:2049–2061. doi: 10.1006/jmcc.1999.1036. [DOI] [PubMed] [Google Scholar]
- 7.Donath MY, Sutsch G, Yan XW, Piva B, Brunner HP, Glatz Y, Zapf J, Follath F, Froesch ER, Kiowski W. Acute cardiovascular effects of insulin-like growth factor I in patients with chronic heart failure. J Clin Endocrinol Metab. 1998;83:3177–3183. doi: 10.1210/jcem.83.9.5122. [DOI] [PubMed] [Google Scholar]
- 8.Janssen JA, Stolk RP, Pols HA, Grobbee DE, Lamberts SW. Serum total IGF-I, free IGF-I, and IGFB-1 levels in an elderly population: relation to cardiovascular risk factors and disease. Arterioscler Thromb Vase Biol. 1998;18:277–282. doi: 10.1161/01.atv.18.2.277. [DOI] [PubMed] [Google Scholar]
- 9.Janssen JA, Lamberts SW. The role of IGF-I in the development of cardiovascular disease in type 2 diabetes mellitus: is prevention possible? Eur J Endocrinol. 2002;146:467–477. doi: 10.1530/eje.0.1460467. [DOI] [PubMed] [Google Scholar]
- 10.van den Beld AW, Bots ML, Janssen JA, Pols HA, Lamberts SW, Grobbee DE. Endogenous hormones and carotid atherosclerosis in elderly men. Am J Epidemiol. 2003;157:25–31. doi: 10.1093/aje/kwf160. [DOI] [PubMed] [Google Scholar]
- 11.Schneider HJ, Klotsche J, Sailer B, Bonier S, Sievers C, Pittrow D, Ruf G, Marz W, Erwa W, Zeiher AM, Silber S, Lehnert H, Wittchen HU, Stalla GK. Associations of age-dependent IGF-I SDS with cardiovascular diseases and risk conditions: cross-sectional study in 6773 primary care patients. Eur J Endocrinol. 2008;158:153–161. doi: 10.1530/EJE-07-0600. [DOI] [PubMed] [Google Scholar]
- 12.Martin RM, Gunnell D, Whitley E, Nicolaides A, Griffin M, Georgiou N, Davey SG, Ebrahim S, Holly JM. Associations of insulin-like growth factor (IGF)-I, IGF-II, IGF binding protein (IGFBP)-2 and IGFBP-3 with ultrasound measures of atherosclerosis and plaque stability in an older adult population. J Clin Endocrinol Metab. 2008;93:1331–1338. doi: 10.1210/jc.2007-2295. [DOI] [PubMed] [Google Scholar]
- 13.Andreassen M, Raymond I, Kistorp C, Hildebrandt P, Faber J, Kristensen LO. IGF1 as predictor of all cause mortality and cardiovascular disease in an elderly population. Eur J Endocrinol. 2009;160:25–31. doi: 10.1530/EJE-08-0452. [DOI] [PubMed] [Google Scholar]
- 14.Juul A, Scheike T, Davidsen M, Gyllenborg J, Jorgensen T. Low serum insulin-like growth factor I is associated with increased risk of ischemic heart disease: a population-based case-control study. Circulation. 2002;106:939–944. doi: 10.1161/01.cir.0000027563.44593.cc. [DOI] [PubMed] [Google Scholar]
- 15.Kaplan RC, McGinn AP, Pollak MN, Kuller LH, Strickler HD, Rohan TE, Cappola AR, Xue X, Psaty BM. Association of total insulin-like growth factor-I, insulin-like growth factor binding protein-1 (IGFBP-1), and IGFBP-3 levels with incident coronary events and ischemic stroke. J Clin Endocrinol Metab. 2007;92:1319–1325. doi: 10.1210/jc.2006-1631. [DOI] [PubMed] [Google Scholar]
- 16.Laughlin GA, Barrett-Connor E, Criqui MH, Kritz-Silverstein D. The prospective association of serum insulin-like growth factor I (IGF-I) and IGF-binding protein-1 levels with all cause and cardiovascular disease mortality in older adults: the Rancho Bernardo Study. J Clin Endocrinol Metab. 2004;89:114–120. doi: 10.1210/jc.2003-030967. [DOI] [PubMed] [Google Scholar]
- 17.Lawlor DA, Ebrahim S, Smith GD, Cherry L, Watt P, Sattar N. The association of insulin-like-growth factor 1 (IGF-1) with incident coronary heart disease in women: Findings from the prospective British Women's Heart and Health Study. Atherosclerosis. 2008;201:198–204. doi: 10.1016/j.atherosclerosis.2007.12.061. [DOI] [PubMed] [Google Scholar]
- 18.Page JH, Ma J, Pollak M, Manson JE, Hankinson SE. Plasma insulinlike growth factor 1 and binding-protein 3 and risk of myocardial infarction in women: a prospective study. Clin Chem. 2008;54:1682–1688. doi: 10.1373/clinchem.2008.105825. [DOI] [PMC free article] [PubMed] [Google Scholar]
- 19.Saydah S, Graubard B, Ballard-Barbash R, Berrigan D. Insulin-like growth factors and subsequent risk of mortality in the United States. Am J Epidemiol. 2007;166:518–526. doi: 10.1093/aje/kwm124. [DOI] [PubMed] [Google Scholar]
- 20.Vasan RS, Sullivan LM, D'Agostino RB, Roubenoff R, Harris T, Sawyer DB, Levy D, Wilson PW. Serum insulin-like growth factor I and risk for heart failure in elderly individuals without a previous myocardial infarction: the Framingham Heart Study. Ann Intern Med. 2003;139:642–648. doi: 10.7326/0003-4819-139-8-200310210-00007. [DOI] [PubMed] [Google Scholar]
- 21.Day N, Oakes S, Luben R, Khaw KT, Bingham S, Welch A, Wareham N. EPIC-Norfolk: study design and characteristics of the cohort. European Prospective Investigation of Cancer. Br J Cancer. 1999;80(Suppl 1):95–103. [PubMed] [Google Scholar]
- 22.Waterworth DM, Ricketts SL, Song K, Chen L, Zhao JH, Ripatti S, Aulchenko YS, Zhang W, Yuan X, Lim N, Luan J, Ashford S, Wheeler E, Young EH, Hadley D, Thompson JR, Braund PS, Johnson T, Struchalin M, Surakka I, Luben R, Khaw KT, Rodwell SA, Loos RJ, Boekholdt SM, Inouye M, Deloukas P, Elliott P, Schlessinger D, Sanna S, Scuteri A, Jackson A, Mohlke KL, Tuomilehto J, Roberts R, Stewart A, Kesaniemi YA, Mahley RW, Grundy SM, Wellcome Trust Case Control Consortium. McArdle W, Cardon L, Waeber G, Vollenweider P, Chambers JC, Boehnke M, Abecasis GR, Salomaa V, Jarvelin MR, Ruokonen A, Barroso I, Epstein SE, Hakonarson HH, Rader DJ, Reilly MP, Witteman JC, Hall AS, Samani NJ, Strachan DP, Barter P, van Duijn CM, Kooner JS, Peltonen L, Wareham NJ, McPherson R, Mooser V, Sandhu MS. Genetic variants influencing circulating lipid levels and risk of coronary artery disease. Arterioscler Thromb Vase Biol. 2010;30:2264–2276. doi: 10.1161/ATVBAHA.109.201020. [DOI] [PMC free article] [PubMed] [Google Scholar]
- 23.Stewart AF, Dandona S, Chen L, Assogba O, Belanger M, Ewart G, LaRose R, Doelle H, Williams K, Wells GA, McPherson R, Roberts R. Kinesin family member 6 variant Trp719Arg does not associate with angiographically defined coronary artery disease in the Ottawa Heart Genomics Study. J Am Coll Cardiol. 2009;53:1471–1472. doi: 10.1016/j.jacc.2008.12.051. [DOI] [PubMed] [Google Scholar]
- 24.Dandona S, Chen L, Fan M, Alam MA, Assogba O, Belanger M, Williams K, Wells GA, Tang WH, Ellis SG, Hazen SL, McPherson R, Roberts R, Stewart AF. The transcription factor GATA-2 does not associate with angiographic coronary artery disease in the Ottawa Heart Genomics and Cleveland Clinic GeneBank Studies. Hum Genet. 2010;127:101–105. doi: 10.1007/s00439-009-0761-3. [DOI] [PMC free article] [PubMed] [Google Scholar]
- 25.Samani NJ, Erdmann J, Hall AS, Hengstenberg C, Mangino M, Mayer B, Dixon RJ, Meitinger T, Braund P, Wichmann HE, Barrett JH, Konig IR, Stevens SE, Szymczak S, Tregouet DA, lies MM, Pahlke F, Pollard H, Lieb W, Cambien F, Fischer M, Ouwehand W, Blankenberg S, Balmforth AJ, Baessler A, Ball SG, Strom TM, Braenne I, Gieger C, Deloukas P, Tobin MD, Ziegler A, Thompson JR, Schunkert H. Genomewide association analysis of coronary artery disease. N Engl J Med. 2007;357:443–453. doi: 10.1056/NEJMoa072366. [DOI] [PMC free article] [PubMed] [Google Scholar]
- 26.Wellcome Trust Case Control Consortium. Genome-wide association study of 14,000 cases of seven common diseases and 3,000 shared controls. Nature. 2007;447:661–678. doi: 10.1038/nature05911. [DOI] [PMC free article] [PubMed] [Google Scholar]
- 27.Helgadottir A, Thorleifsson G, Manolescu A, Gretarsdottir S, Blondal T, Jonasdottir A, Jonasdottir A, Sigurdsson A, Baker A, Palsson A, Masson G, Gudbjartsson DF, Magnusson KP, Andersen K, Levey AI, Backman VM, Matthiasdottir S, Jonsdottir T, Palsson S, Einarsdottir H, Gunnarsdottir S, Gylfason A, Vaccarino V, Hooper WC, Reilly MP, Granger CB, Austin H, Rader DJ, Shah SH, Quyyumi AA, Gulcher JR, Thorgeirsson G, Thorsteinsdottir U, Kong A, Stefansson K. A common variant on chromosome 9p21 affects the risk of myocardial infarction. Science. 2007;316:1491–1493. doi: 10.1126/science.1142842. [DOI] [PubMed] [Google Scholar]
- 28.Kathiresan S, Voight BF, Purcell S, Musunuru K, Ardissino D, Mannucci PM, Anand S, Engert JC, Samani NJ, Schunkert H, Erdmann J, Reilly MP, Rader DJ, Morgan T, Spertus JA, Stoll M, Girelli D, McKeown PP, Patterson CC, Siscovick DS, O'Donnell CJ, Elosua R, Peltonen L, Salomaa V, Schwartz SM, Melander O, Altshuler D, Ardissino D, Merlini PA, Berzuini C, Bernardinelli L, Peyvandi F, Tubaro M, Celli P, Ferrario M, Fetiveau R, Marziliano N, Casari G, Galli M, Ribichini F, Rossi M, Bernardi F, Zonzin P, Piazza A, Mannucci PM, Schwartz SM, Siscovick DS, Yee J, Friedlander Y, Elosua R, Marrugat J, Lucas G, Subirana I, Sala J, Ramos R, Kathiresan S, Meigs JB, Williams G, Nathan DM, Mac-Rae CA, O'Donnell CJ, Salomaa V, Havulinna AS, Peltonen L, Melander O, Berglund G, Voight BF, Kathiresan S, Hirschhorn JN, Asselta R, Duga S, Spreafico M, Musunuru K, Daly MJ, Purcell S, Voight BF, Purcell S, Nemesh J, Korn JM, McCarroll SA, Schwartz SM, Yee J, Kathiresan S, Lucas G, Subirana I, Elosua R, Surti A, Guiducci C, Gianniny L, Mirel D, Parkin M, Burtt N, Gabriel SB, Samani NJ, Thompson JR, Braund PS, Wright BJ, Balmforth AJ, Ball SG, Hall AS, Schunkert H, Erdmann J, Linsel-Nitschke P, Lieb W, Ziegler A, Konig I, Hengstenberg C, Fischer M, Stark K, Grosshennig A, Preuss M, Wichmann HE, Schreiber S, Schunkert H, Samani NJ, Erdmann J, Ouwehand W, Hengstenberg C, Deloukas P, Scholz M, Cambien F, Reilly MP, Li M, Chen Z, Wilensky R, Matthai W, Qasim A, Hakonarson HH, Devaney J, Burnett MS, Pichard AD, Kent KM, Satler L, Lindsay JM, Waksman R, Epstein SE, Rader DJ, Scheffold T, Berger K, Stoll M, Huge A, Girelli D, Martinelli N, Olivieri O, Corrocher R, Morgan T, Spertus JA, McKeown P, Patterson CC, Schunkert H, Erdmann E, Linsel-Nitschke P, Lieb W, Ziegler A, Konigl R, Hengstenberg C, Fischer M, Stark K, Grosshennig A, Preuss M, Wichmann HE, Schreiber S, Holm H, Thorleifsson G, Thorsteinsdottir U, Stefansson K, Engert JC, Do R, Xie C, Anand S, Kathiresan S, Ardissino D, Mannucci PM, Siscovick D, O'Donnell CJ, Samani NJ, Melander O, Elosua R, Peltonen L, Salomaa V, Schwartz SM, Altshuler D. Genome-wide association of early-onset myocardial infarction with single nucleotide polymorphisms and copy number variants. Nat Genet. 2009;41:334–341. doi: 10.1038/ng.327. [DOI] [PMC free article] [PubMed] [Google Scholar]
- 29.Marques-Vidal P, Pecoud A, Hayoz D, Paccaud F, Mooser V, Waeber G, Vollenweider P. Prevalence and characteristics of vitamin or dietary supplement users in Lausanne, Switzerland: the CoLaus study. Eur J Clin Nutr. 2009;63:273–281. doi: 10.1038/sj.ejcn.1602932. [DOI] [PubMed] [Google Scholar]
- 30.Sandhu MS, Waterworth DM, Debenham SL, Wheeler E, Papadakis K, Zhao JH, Song K, Yuan X, Johnson T, Ashford S, Inouye M, Luben R, Sims M, Hadley D, McArdle W, Barter P, Kesaniemi YA, Mahley RW, McPherson R, Grundy SM, Bingham SA, Khaw KT, Loos RJ, Waeber G, Barroso I, Strachan DP, Deloukas P, Vollenweider P, Wareham NJ, Mooser V. LDL-cholesterol concentrations: a genome-wide association study. Lancet. 2008;371:483–491. doi: 10.1016/S0140-6736(08)60208-1. [DOI] [PMC free article] [PubMed] [Google Scholar]
- 31.Stirnadel H, Lin X, Ling H, Song K, Barter P, Kesaniemi YA, Mahley R, McPherson R, Waeber G, Bersot T, Cohen J, Grundy S, Mitchell B, Mooser V, Waterworth D. Genetic and phenotypic architecture of metabolic syndrome-associated components in dyslipidemic and normolipidemic subjects: the GEMS Study. Atherosclerosis. 2008;197:868–876. doi: 10.1016/j.atherosclerosis.2007.07.038. [DOI] [PubMed] [Google Scholar]
- 32.Wyszynski DF, Waterworth DM, Barter PJ, Cohen J, Kesaniemi YA, Mahley RW, McPherson R, Waeber G, Bersot TP, Sharma SS, Nolan V, Middleton LT, Sundseth SS, Farrer LA, Mooser V, Grundy SM. Relation between athero-genic dyslipidemia and the Adult Treatment Program-III definition of metabolic syndrome (Genetic Epidemiology of Metabolic Syndrome Project) Am J Cardiol. 2005;95:194–198. doi: 10.1016/j.amjcard.2004.08.091. [DOI] [PubMed] [Google Scholar]
- 33.Hofman A, Breteler MM, van Duijn CM, Krestin GP, Pols HA, Strieker BH, Tiemeier H, Uitterlinden AG, Vingerling JR, Witteman JC. The Rotterdam Study: objectives and design update. Eur J Epidemiol. 2007;22:819–829. doi: 10.1007/s10654-007-9199-x. [DOI] [PMC free article] [PubMed] [Google Scholar]
- 34.Aulchenko YS, Ripatti S, Lindqvist I, Boomsma D, Heid IM, Pramstaller PP, Penninx BW, Janssens AC, Wilson JF, Spector T, Martin NG, Pedersen NL, Kyvik KO, Kaprio J, Hofman A, Freimer NB, Jarvelin MR, Gyllensten U, Campbell H, Rudan I, Johansson A, Marroni F, Hayward C, Vitart V, Jonasson I, Pattaro C, Wright A, Hastie N, Pichler I, Hicks AA, Falchi M, Willemsen G, Hottenga JJ, de Geus EJ, Montgomery GW, Whitfield J, Magnusson P, Saharinen J, Perola M, Silander K, Isaacs A, Sijbrands EJ, Uitterlinden AG, Witteman JC, Oostra BA, Elliott P, Ruokonen A, Sabatti C, Gieger C, Meitinger T, Kronenberg F, Doring A, Wichmann HE, Smit JH, McCarthy Ml, van Duijn CM, Peltonen L. Loci influencing lipid levels and coronary heart disease risk in 16 European population cohorts. Nat Genet. 2009;41:47–55. doi: 10.1038/ng.269. [DOI] [PMC free article] [PubMed] [Google Scholar]
- 35.Barrett JC, Fry B, Mailer J, Daly MJ. Hap-loview: analysis and visualization of LD and haplotype maps. Bioinformatics. 2005;21:263–265. doi: 10.1093/bioinformatics/bth457. [DOI] [PubMed] [Google Scholar]
- 36.de Bakker PI, Yelensky R, Pe'er I, Gabriel SB, Daly MJ, Altshuler D. Efficiency and power in genetic association studies. Nat Genet. 2005;37:1217–1223. doi: 10.1038/ng1669. [DOI] [PubMed] [Google Scholar]
- 37.Al-Zahrani A, Sandhu MS, Luben RN, Thompson D, Baynes C, Pooley KA, Luccarini C, Munday H, Perkins B, Smith P, Pharoah PD, Wareham NJ, Easton DF, Ponder BA, Dunning AM. IGF1 and IGFBP3 tagging polymorphisms are associated with circulating levels of IGF1, IGFBP3 and risk of breast cancer. Hum Mol Genet. 2006;15:1–10. doi: 10.1093/hmg/ddi398. [DOI] [PubMed] [Google Scholar]
- 38.Rodriguez S, Gaunt TR, Day IN. Molecular genetics of human growth hormone, insulin-like growth factors and their pathways in common disease. Hum Genet. 2007;122:1–21. doi: 10.1007/s00439-007-0378-3. [DOI] [PubMed] [Google Scholar]
- 39.Stram DO, Haiman CA, Hirschhorn JN, Altshuler D, Kolonel LN, Henderson BE, Pike MC. Choosing haplotype-tagging SNPS based on unphased genotype data using a preliminary sample of unrelated subjects with an example from the Multiethnic Cohort Study. Hum Hered. 2003;55:27–36. doi: 10.1159/000071807. [DOI] [PubMed] [Google Scholar]
- 40.Boekholdt SM, Hack CE, Sandhu MS, Luben R, Bingham SA, Wareham NJ, Peters RJ, Jukema JW, Day NE, Kastelein JJ, Khaw KT. C-reactive protein levels and coronary artery disease incidence and mortality in apparently healthy men and women: the EPIC-Norfolk prospective population study 1993-2003. Atherosclerosis. 2006;187:415–422. doi: 10.1016/j.atherosclerosis.2005.09.023. [DOI] [PubMed] [Google Scholar]
- 41.Hernandez W, Grenade C, Santos ER, Bonilla C, Ahaghotu C, Kittles RA. IGF-1 and IGFBP-3 gene variants influence on serum levels and prostate cancer risk in African-Americans. Car-cinogenesis. 2007;28:2154–2159. doi: 10.1093/carcin/bgm190. [DOI] [PubMed] [Google Scholar]
- 42.Kaushal K, Heald AH, Siddals KW, Sandhu MS, Dunger DB, Gibson JM, Wareham NJ. The impact of abnormalities in IGF and inflammatory systems on the metabolic syndrome. Diabetes Care. 2004;27:2682–2688. doi: 10.2337/diacare.27.11.2682. [DOI] [PubMed] [Google Scholar]
- 43.Friedrich N, Haring R, Nauck M, Ludemann J, Rosskopf D, Spilcke-Liss E, Felix SB, Dorr M, Brabant G, Volzke H, Wallaschofski H. Mortality and serum insulin-like growth factor (IGF)-I and IGF binding protein 3 concentrations. J Clin Endocrinol Metab. 2009;94:1732–1739. doi: 10.1210/jc.2008-2138. [DOI] [PubMed] [Google Scholar]
- 44.Sandhu MS, Gibson JM, Heald AH, Dunger DB, Wareham NJ. Association between insulin-like growth factor-I: insulin-like growth factor-binding protein-1 ratio and metabolic and anthropometric factors in men and women. Cancer Epidemiol Biomarkers Prev. 2004;13:166–170. doi: 10.1158/1055-9965.epi-130-3. [DOI] [PubMed] [Google Scholar]
- 45.D'Aloisio AA, Schroeder JC, North KE, Poole C, West SL, Travlos GS, Baird DD. IGF-I and IGFBP-3 polymorphisms in relation to circulating levels among African American and Caucasian women. Cancer Epidemiol Biomarkers Prev. 2009;18:954–966. doi: 10.1158/1055-9965.EPI-08-0856. [DOI] [PMC free article] [PubMed] [Google Scholar]
- 46.Diorio C, Brisson J, Berube S, Pollak M. Genetic polymorphisms involved in insulin-like growth factor (IGF) pathway in relation to mam-mographic breast density and IGF levels. Cancer Epidemiol Biomarkers Prev. 2008;17:880–888. doi: 10.1158/1055-9965.EPI-07-2500. [DOI] [PubMed] [Google Scholar]
- 47.Johansson M, McKay JD, Wiklund F, Rinaldi S, Verheus M, van Gils CH, Hallmans G, Baiter K, Adami HO, Gronberg H, Stattin P, Kaaks R. Implications for prostate cancer of insulin-like growth factor-I (IGF-I) genetic variation and circulating IGF-I levels. J Clin Endocrinol Metab. 2007;92:4820–4826. doi: 10.1210/jc.2007-0887. [DOI] [PubMed] [Google Scholar]
- 48.Patel AV, Cheng I, Canzian F, Le ML, Thun MJ, Berg CD, Buring J, Calle EE, Chanock S, Clavel-Chapelon F, Cox DG, Dorronsoro M, Dossus L, Haiman CA, Hankinson SE, Henderson BE, Hoover R, Hunter DJ, Kaaks R, Kolonel LN, Kraft P, Linseisen J, Lund E, Manjer J, McCarty C, Peeters PH, Pike MC, Pollak M, Riboli E, Stram DO, Tjonneland A, Travis RC, Trichopoulos D, Tumino R, Yeager M, Ziegler RG, Feigelson HS. IGF-1, IGFBP-1, and IGFBP-3 polymorphisms predict circulating IGF levels but not breast cancer risk: findings from the Breast and Prostate Cancer Cohort Consortium (BPC3) PLoS One. 2008;3:e2578. doi: 10.1371/journal.pone.0002578. [DOI] [PMC free article] [PubMed] [Google Scholar]
- 49.Verheus M, McKay JD, Kaaks R, Canzian F, Biessy C, Johansson M, Grobbee DE, Peeters PH, van Gils CH. Common genetic variation in the IGF-1 gene, serum IGF-I levels and breast density. Breast Cancer Res Treat. 2008;112:109–122. doi: 10.1007/s10549-007-9827-x. [DOI] [PubMed] [Google Scholar]
- 50.Canzian F, McKay JD, Cleveland RJ, Dossus L, Biessy C, Rinaldi S, Landi S, Boillot C, Monnier S, Chajes V, Clavel-Chapelon F, Tehard B, Chang-Claude J, Linseisen J, Lahmann PH, Pischon T, Trichopoulos D, Trichopoulou A, Zilis D, Palli D, Tumino R, Vineis P, Berrino F, Bueno-de-Mesquita HB, van Gils CH, Peeters PH, Pera G, Ardanaz E, Chirlaque MD, Quiros JR, Larranaga N, Martinez-Garcia C, Allen NE, Key TJ, Bingham SA, Khaw KT, Slimani N, Norat T, Riboli E, Kaaks R. Polymorphisms of genes coding for insulin-like growth factor 1 and its major binding proteins, circulating levels of IGF-I and IGFBP-3 and breast cancer risk: results from the EPIC study. Br J Cancer. 2006;94:299–307. doi: 10.1038/sj.bjc.6602936. [DOI] [PMC free article] [PubMed] [Google Scholar]
- 51.Cheng I, DeLellis HK, Haiman CA, Kolonel LN, Henderson BE, Freedman ML, Le ML. Genetic determinants of circulating insulin-like growth factor (IGF)-I, IGF binding protein (BP)-I, and IGFBP-3 levels in a multiethnic population. J Clin Endocrinol Metab. 2007;92:3660–3666. doi: 10.1210/jc.2007-0790. [DOI] [PubMed] [Google Scholar]
- 52.Deal C, Ma J, Wilkin F, Paquette J, Rozen F, Ge B, Hudson T, Stampfer M, Pollak M. Novel promoter polymorphism in insulin-like growth factor-binding protein-3: correlation with serum levels and interaction with known regulators. J Clin Endocrinol Metab. 2001;86:1274–1280. doi: 10.1210/jcem.86.3.7280. [DOI] [PubMed] [Google Scholar]
- 53.Jernstrom H, Deal C, Wilkin F, Chu W, Tao Y, Majeed N, Hudson T, Narod SA, Pollak M. Genetic and nongenetic factors associated with variation of plasma levels of insulin-like growth factor-I and insulin-like growth factor-binding protein-3 in healthy premenopausal women. Cancer Epidemiol Biomarkers Prev. 2001;10:377–384. [PubMed] [Google Scholar]
- 54.Frayling TM, Hattersley AT, McCarthy A, Holly J, Mitchell SM, Gloyn AL, Owen K, Davies D, Smith GD, Ben-Shlomo Y. A putative functional polymorphism in the IGF-I gene: association studies with type 2 diabetes, adult height, glucose tolerance, and fetal growth in U.K. populations. Diabetes. 2002;51:2313–2316. doi: 10.2337/diabetes.51.7.2313. [DOI] [PubMed] [Google Scholar]
- 55.Morimoto LM, Newcomb PA, White E, Bigler J, Potter JD. Variation in plasma insulin-like growth factor-I and insulin-like growth factor binding protein-3: genetic factors. Cancer Epidemiol Biomarkers Prev. 2005;14:394–1401. doi: 10.1158/1055-9965.EPI-04-0694. [DOI] [PubMed] [Google Scholar]
- 56.Vaessen N, Heutink P, Janssen JA, Witteman JC, Testers L, Hofman A, Lamberts SW, Oostra BA, Pols HA, van Duijn CM. A polymorphism in the gene for IGF-I: functional properties and risk for type 2 diabetes and myocardial infarction. Diabetes. 2001;50:637–642. doi: 10.2337/diabetes.50.3.637. [DOI] [PubMed] [Google Scholar]
- 57.Yazdanpanah M, Rietveld I, Janssen JA, Njajou OT, Hofman A, Stijnen T, Pols HA, Lamberts SW, Witteman JC, van Duijn CM. An insulin-like growth factor-I promoter polymorphism is associated with increased mortality in subjects with myocardial infarction in an elderly Caucasian population. Am J Cardiol. 2006;97:1274–1276. doi: 10.1016/j.amjcard.2005.11.069. [DOI] [PubMed] [Google Scholar]
- 58.Dupuis J, Langenberg C, Prokopenko I, Saxena R, Soranzo N, Jackson AU, Wheeler E, Glazer NL, Bouatia-Naji N, Gloyn AL, Lindgren CM, Magi R, Morris AP, Randall J, Johnson T, Elliott P, Rybin D, Thorleifsson G, Steinthorsdottir V, Henneman P, Grallert H, Dehghan A, Hottenga JJ, Franklin CS, Navarro P, Song K, Goel A, Perry JRB, Egan JM, Lajunen T, Grarup N, Sparso T, Doney A, Voight BF, Stringham HM, Li M, Kanoni S, Shrader P, Cavalcanti-Proenca C, Kumari M, Qi L, Timpson NJ, Gieger C, Zabena C, Rocheleau G, Ingelsson E, An P, O'Connell J, Luan J, Elliott A, McCarroll SA, Payne F, Roccasecca RM, Pattou F, Sethupathy P, Ardlie K, Ariyurek Y, Balkau B, Barter P, Beilby JP, Ben-Shlomo Y, Benediktsson R, Bennett AJ, Bergmann S, Bochud M, Boerwinkle E, Bonnefond A, Bonnycastle LL, Borch-Johnsen K, Bottcher Y, Brunner E, Bumpstead SJ, Charpentier G, Chen YDI, Chines P, Clarke R, Coin UM, Cooper MN, Cornells M, Crawford G, Crisponi L, Day INM, de Geus EJC, Delplanque J, Dina C, Erdos MR, Fedson AC, Fischer-Rosinsky A, Forouhi NG, Fox CS, Frants R, Franzosi MG, Galan P, Goodarzi MO, Graessler J, Groves CJ, Grundy S, Gwilliam R, Gyllensten U, Hadjadj S, Hallmans G, Hammond N, Han X, Hartikainen AL, Hassanali N, Hayward C, Heath SC, Hercberg S, Herder C, Hicks AA, Hillman DR, Hingorani AD, Hofman A, Hui J, Hung J, Isomaa B, Johnson PRV, Jorgensen T, Jula A, Kaakinen M, Kaprio J, Kesaniemi YA, Kivimaki M, Knight B, Koskinen S, Kovacs P, Kyvik KO, Lathrop GM, Lawlor DA, Le Bacquer O, Lecoeur C, Li Y, Lyssenko V, Mahley R, Mangino M, Manning AK, Martinez-Larrad MT, McAteer JB, McCulloch U, McPherson R, Meisinger C, Melzer D, Meyre D, Mitchell BD, Morken MA, Mukherjee S, Naitza S, Narisu N, Neville MJ, Oostra BA, Orru M, Pakyz R, Palmer CNA, Paolisso G, Pattaro C, Pearson D, Peden JF, Pedersen NL, Perola M, Pfeiffer AFH, Pichler I, Polasek O, Posthuma D, Potter SC, Pouta A, Province MA, Psaty BM, Rathmann W, Rayner NW, Rice K, Ripatti S, Rivadeneira F, Roden M, Rolandsson O, Sandbaek A, Sandhu M, Sanna S, Sayer AA, Scheet P, Scott U, Seedorf U, Sharp SJ, Shields B, sson G, Sijbrands EJG, Silveira A, Simpson L, Singleton A, Smith NL, Sovio U, Swift A, Syddall H, Syvanen AC, Tanaka T, Thorand B, Tichet J, Tonjes A, Tuomi T, Uitterlinden AG, van Dijk KW, van Hoek M, Varma D, Visvikis-Siest S, Vitart V, Vogelzangs N, Waeber G, Wagner PJ, Walley A, Walters GB, Ward KL, Watkins H, Weedon MN, Wild SH, Willemsen G, Witteman JCM, Yarnell JWG, Zeggini E, Zelenika D, Zethelius B, Zhai G, Zhao JH, Zillikens MC, Borecki IB, Loos RJF, Meneton P, Magnusson PKE, Nathan DM, Williams GH, Hattersley AT, Silander K, Salomaa V, Smith GD, Bornstein SR, Schwarz P, Spranger J, Karpe F, Shuldiner AR, Cooper C, Dedoussis GV, Serrano-Rios M, Morris AD, Lind L, Palmer U, Hu FB, Franks PW, Ebrahim S, Marmot M, Kao WHL, Pankow JS, Sampson MJ, Kuusisto J, Laakso M, Hansen T, Pedersen O, Pramstaller PP. New genetic loci implicated in fasting glucose homeostasis and their impact on type 2 diabetes risk. Nat Genet. 2010;42:105–116. doi: 10.1038/ng.520. [DOI] [PMC free article] [PubMed] [Google Scholar]
- 59.Palles C, Johnson N, Coupland B, Taylor C, Carvajal J, Holly J, Fentiman IS, Silva IS, Ashworth A, Peto J, Fletcher O. Identification of genetic variants that influence circulating IGF1 levels: a targeted search strategy. Hum Mol Genet. 2008;17:1457–1464. doi: 10.1093/hmg/ddn034. [DOI] [PubMed] [Google Scholar]
- 60.Schumacher FR, Cheng I, Freedman ML, Mucci L, Allen NE, Pollak MN, Hayes RB, Stram DO, Canzian F, Henderson BE, Hunter DJ, Virtamo J, Manjer J, Gaziano JM, Kolonel LN, Tj+©nneland A, Albanes D, Calle EE, Giovannucci E, Crawford ED, Haiman CA, Kraft P, Willett WC, Thun MJ, Le Marchand Lc, Kaaks R, Feigelson HS, Bueno-de-Mesquita HB, Palli D, Riboli E, Lund E, Amiano P, Andriole G, Dunning AM, Trichopoulos D, Stampfer MJ, Key TJ, Ma J. A comprehensive analysis of common IGF1, IGFBP1 and IGFBP3 genetic variation with prospective IGF-I and IGFBP-3 blood levels and prostate cancer risk among Caucasians. Human Molecular Genetics. 2010;19:3089–3101. doi: 10.1093/hmg/ddq210. [DOI] [PMC free article] [PubMed] [Google Scholar]