Abstract
Until recently, the genus Epicrates (Boidae) presented only one continental species, Epicrates cenchria, distributed in Central and South America, but after a taxonomic revision using morphologic characters five species were recognized: E. cenchria, E. crassus, E. maurus, E. assisi, and E. alvarezi. We analyzed two independent data sets, environmental niche models and phylogeny based on molecular information, to explore species delimitation in the continental species of this genus. Our results indicated that the environmental requirements of the species are different; therefore there are not evidences of ecological interchangeability among them. There is a clear correlation between species distributions and the major biogeographic regions of Central and South America. Their overall distribution reveals that allopatry or parapatry is the general pattern. These evidences suggest that habitat isolation prevents or limits gene exchange among them. The phylogenetic reconstruction showed that the continental Epicrates are monophyletic, being E. alvarezi the sister species for the remaining two clades: E. crassus - E. assisi, and E. maurus - E. cenchria. The clade grouping the continental Epicrates is the sister taxon of the genus Eunectes and not of the Caribbean Epicrates clade, indicating that the genus is paraphyletic. There is a non-consistent pattern in niche evolution among continental Epicrates. On the contrary, a high variation and abrupt shifts in environmental variables are shown when ancestral character states were reconstructed on the sequence-based tree. The degree of genetic and ecological divergence among continental Epicrates and the phylogenetic analyses support the elevation to full species of E. cenchria, E. crassus, E. maurus, E. assisi, and E. alvarezi.
Introduction
Accurate species delimitation is one of the most basic tasks in systematic research. However, lineages separation is a temporally extended process that may result in populations with all or some of the following features: reciprocal monophyly, reproductive isolation, ecological divergence, and morphological distinctiveness [1], [2]. Considering this, any criterion or set of rules to define species status could fail at some level depending on the properties of the entities under study, which could lead to the recognition of more or fewer species than the existing ones [3]. Besides, in organisms displaying cryptic morphological characters, fine-scaled endemism patterns, low census size (that prevents obtaining a good sample), and/or absence of reproductive barriers (that allow the existence of gene flow among different taxa) it is particularly difficult to establish species limits using only one line of evidence, like morphological or genetic data.
In the genus Epicrates, nine insular species distributed in the region of the Great Antilles and the Bahamas have been recognized, and until recently only one continental species, Epicrates cenchria [4]. Its distribution encompasses the mainland portions of Central and South America, from Nicaragua to Argentina and the continental islands of Trinidad and Tobago and Margarita [5]. According to morphology and color pattern, nine subspecies were distinguished: E. c. cenchria, E. c. maurus, E. c. alvarezi, E. c. gaigei, E. c. crassus, E. c. barbouri, E. c. polylepis, E. c. hygrophilus and E. c. assisi [5], [6]. Despite the particularly wide distribution range of E. cenchria, covering areas with very different environmental conditions and the fact that some morphotypes present an important degree of differentiation in color patterns and meristic characters [7], it was considered as a single species. However, in the last few years, the taxonomy of this species complex has been widely discussed in several studies, based only on morphological data. Some authors elevated E. c. cenchria, E. c. maurus and/or E. c. crassus to the rank of full species [8], [9], [10], [11], but their conclusions lacked an extensive comparative study in the group. Others preferred to maintain all the morphotypes as subspecies [5], [12], [13]. Recently, a revision of the Epicrates cenchria complex based on an analysis of the morphological variation in meristic, color pattern and morphometric characters proposed a new taxonomic arrangement, which comprises the species E. cenchria (including the nominal forms E. c. gaigei and E. c. hygrophilus), E. crassus (including E. c. polylepis), E. maurus (including E. c. barbouri), E. assisi, and E. alvarezi [14]. However, to provide a sounder support for the independence of evolutionary lineages, it has been emphasized that it is essential to use multiple lines of evidence [15]; this approach would be particularly valuable to elucidate the validity of the last taxonomic arrangement in the continental Epicrates group.
Ecological divergence is an important step in the process of speciation [16] and can be evaluated using environmental niche modeling (ENM) [17], [18]. This methodology allows predicting the geographic distribution of a species and provides insights into the environmental factors affecting the distribution and the geographic limits of the different lineages. Furthermore, it can be used to shed light on whether speciation or variation (such as morphologic or genetic) is associated with divergence in the ecological niche [19].
The use of molecular markers also contributes to establish species limits since they provide solid information about the phylogenetic relationships among the taxa and/or individuals. Moreover, levels of genetic divergence among closely related recognized species can serve to systematists to infer, by comparison, the status of the evolutionary independent lineages observed in groups presenting a controversial taxonomy [20].
The aim of this study was to explore species delimitation in the continental forms of the genus Epicrates combining two independent data sets, environmental niche models and phylogeny based on molecular information. We also compared our results with the previously obtained from morphological data, predicting that morphologically distinctive species will also be ecologically and genetically divergent. Additionally, we assessed whether the genetic variation across lineages is associated with divergence in the ecological niche.
Results
Ecological modeling
After the correlation tests, thirteen independent variables were selected (Appendix S1). In the models performed with Maxent, the distributions of the species were influenced by almost all the environmental variables, but with different strength (Table 1). Temperature seasonality is the only variable that makes a large contribution to almost all models, except for that of E. maurus (5.8%). On the other hand, annual precipitation makes a large contribution only to the E. cenchria model. The assessment of the Maxent models accuracy by “receiver operated characteristics” (ROC) plots indicates that the models predicted for each continental species of the genus Epicrates are robust, with high values of “area under the curve” (AUC) (Table 1).
Table 1. Topographic and bioclimatic variables ranked according to their overall model contribution for continental species of the genus Epicrates.
| Rank | Epicrates alvarezi | Epicrates crassus | Epicrates assisi | Epicrates cenchria | Epicrates maurus | |||||
| 1 | TS | 42.1 | PWQ | 29.2 | TS | 21 | AP | 44.7 | MinTCM | 21.2 |
| 2 | PWQ | 17.8 | TS | 28.5 | MinTCM | 18.3 | TS | 23.4 | PDM | 21 |
| 3 | PCQ | 15.3 | PDM | 12.4 | MMTR | 17.5 | Altitude | 9.8 | MMTR | 18.2 |
| 4 | PS | 11.3 | Altitude | 11.3 | AP | 12.2 | MinTCM | 7.9 | I | 14.7 |
| 5 | MMTR | 5 | I | 5.7 | PWQ | 10 | I | 4.9 | PCQ | 8.1 |
| 6 | AMT | 3.2 | AMT | 5.4 | PDM | 9.3 | PCQ | 3.3 | PWQ | 7.5 |
| 7 | PDM | 1.7 | MinTCM | 3.3 | PCQ | 5 | PWM | 2 | TS | 5.8 |
| 8 | Altitude | 1.5 | PS | 1.6 | I | 2.6 | MMTR | 2 | AP | 1.1 |
| 9 | I | 0.9 | MaxTWM | 1.3 | MaxTWM | 1.5 | PDM | 1.5 | MaxTWM | 0.9 |
| 10 | MinTCM | 0.9 | PCQ | 0.7 | PWM | 1.3 | AMT | 0.2 | Altitude | 0.7 |
| 11 | MaxTWM | 0.2 | AP | 0.3 | altitude | 1.1 | PWQ | 0.1 | PS | 0.7 |
| 12 | PWM | 0.2 | MMTR | 0.2 | AMT | 0 | PS | 0.1 | PWM | 0.3 |
| 13 | AP | 0 | PWM | 0.1 | PS | 0 | MaxTWM | 0 | AMT | 0 |
| AUC | 0.977 | 0.975 | 0.937 | 0.87 | 0.962 | |||||
AUC is the area under the curve in ROC plots. Bioclimatic variables are as follows: AMT, Annual mean temperature; MMTR, Mean monthly temperature range; I, Isothermality; TS, Temperature seasonality; MaxTWM, Max. temperature warmest month, MinTCM, Min. temperature coldest month, AP, Annual precipitation, PWM, Precipitation wettest month; PDM, Precipitation driest month; PS, Precipitation seasonality; PWQ, Precipitation warmest quarter; PCQ, Precipitation coldest quarter.
The predicted distribution for each species was nearly identical in Maxent and GARP. The areas of probable occurrence determined by their respective models for E. alvarezi, E. crassus, E. assisi, E. cenchria and E. maurus are shown in Figure 1 to 5.
Figure 1. Occurrence probability map for Epicrates alvarezi, determined by its respective model and points of occurrence.
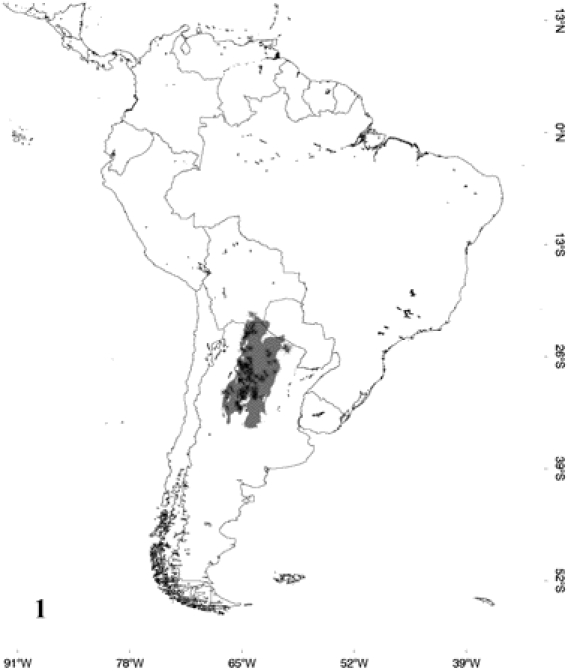
Figure 2. Occurrence probability map for Epicrates crassus, determined by its respective model and points of occurrence.
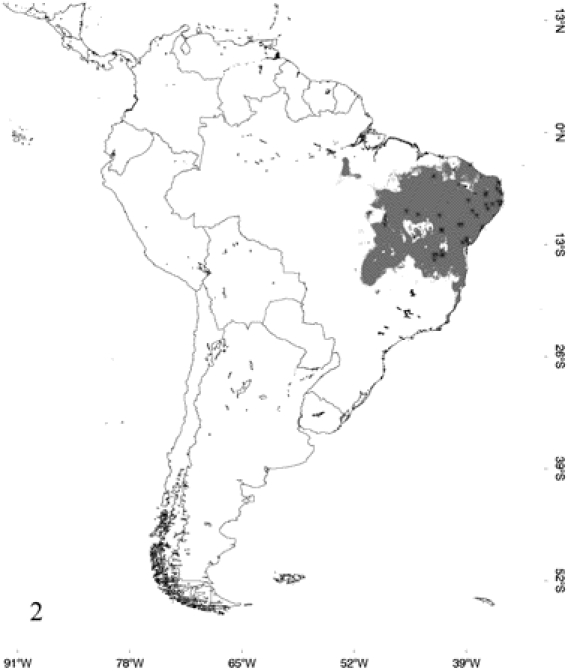
Figure 3. Occurrence probability map for Epicrates assisi, determined by its respective model and points of occurrence.
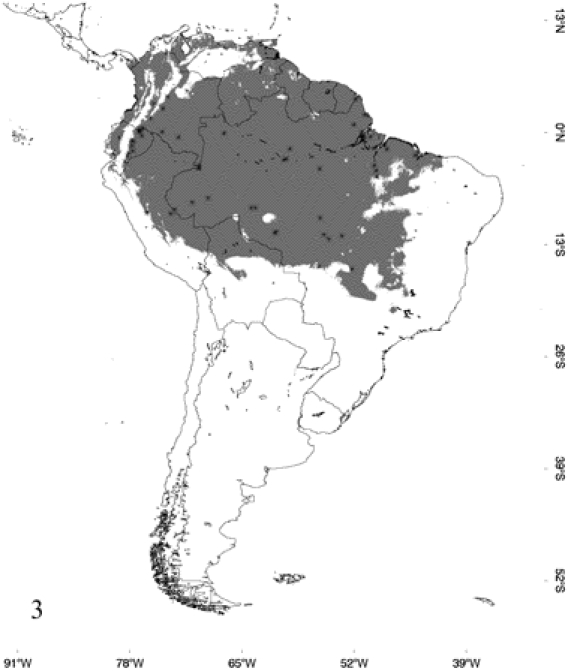
Figure 4. Occurrence probability map for Epicrates cenchria, determined by its respective model and points of occurrence.
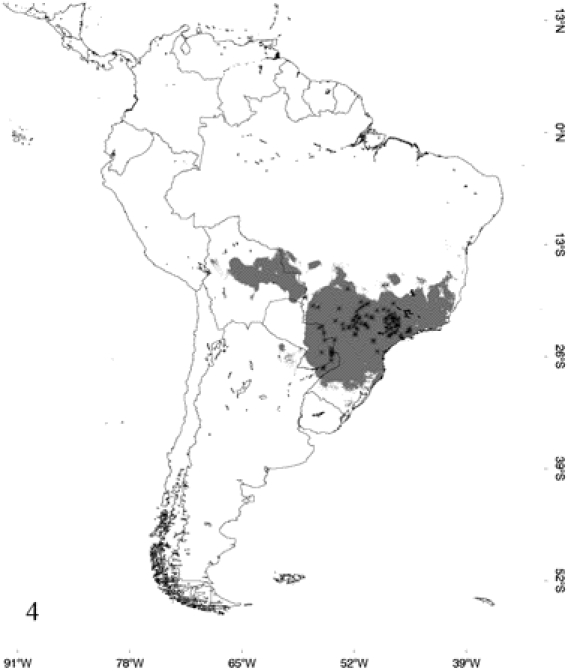
Figure 5. Occurrence probability map for Epicrates maurus, determined by its respective model and points of occurrence.
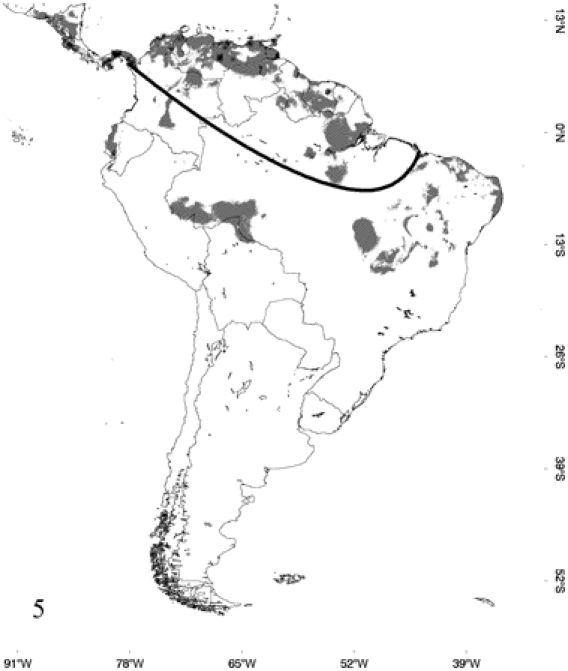
The areas below the line were not considered to calculate overlapping zones between species.
According to the models, E. alvarezi (Fig. 1) distributes mainly in the semiarid plains and sub-mountainous areas of the Gran Chaco; it also slightly extends to the biogeographic regions of Monte, Espinal and Pampa. Epicrates alvarezi is the species that inhabits the southernmost area in the coldest and most arid environments of the genus distribution. In accordance with this fact, the variable that mainly contributes to the ENM of E. alvarezi is temperature seasonality and then, in a lesser extent, variables associated with precipitation seasonality. Epicrates crassus occurs in open formations of the Andean slopes, in the tropical forest of Northeast of Argentina and Central-eastern of Paraguay, in the Brazilian Cerrado and in the grassland of South and Central Brazil. The ENM indicates that the distribution of E. crassus is disjunct, since the model does not show suitable habitats for the species between the Eastern limit of Bolivia and Western Brazil, suggesting a barrier to gene flow between those areas (Fig. 2). Regarding E. assisi, the species distributes mainly in the xerophytic forest of the Caatinga region, but it also occurs in a small area of the Cerrado and in the Atlantic Rainforest of Northeast of Brazil (Fig. 3). Epicrates cenchria is the species most widely distributed, occupying the entire biogeographic region of Amazonas. It would be also present in the rainforest of the Pacific region, in the East of Ecuador and Colombia and in the Neotropical Savanna in North of Venezuela (Fig. 4). The ENM of E. maurus shows a disjunct distribution, indicating its presence in the dry forest of the biogeographic regions Pacific Coast, Venezolana, Savanna, Guajira and some areas in the Amazonic domain, in Central America and Northern South America (Fig. 5). Although this model has a high performance in the ROC plots, overpredicts the presence of the species in some extremely separated areas, as shown on the map, in Central and West of Brazil in the biographic region of Amazonas, in the East of Brazil in the Caatinga and in the rainforest of the Pacific region, in the East of Ecuador and Colombia.
The overall distribution of the five species reveals that allopatry or parapatry is the general pattern. Small or none overlapping zones between species were detected (Fig. 6), except for E. maurus that overlaps in 65% of its distribution with E. cenchria and E. assisi in 24% with E. cenchria. In the first case, this wide percentage of overlapping is not due to the overpredicted distribution indicated for E. maurus by the model, since these areas are not considered in this analysis. The map shows the sympatry between these two species in Venezuela, Guyana, Surinam, French Guiana and in the North of Brazil. The sympatry of E. assisi with E. cenchria would be occurring in the ecotone between the Caatinga and the Amazonas biogeographic regions in north western Brazil. In its entire distribution, E. crassus overlaps only with E. cenchria in a small percentage (7%), in Central and East of Bolivia and West of Brazil. Epicrates alvarezi distributes allopatrically with respect to all the other members of the genus Epicrates.
Figure 6. Occurrence probability maps of overlapping zones between species of continental Epicrates, determined by their respective models.
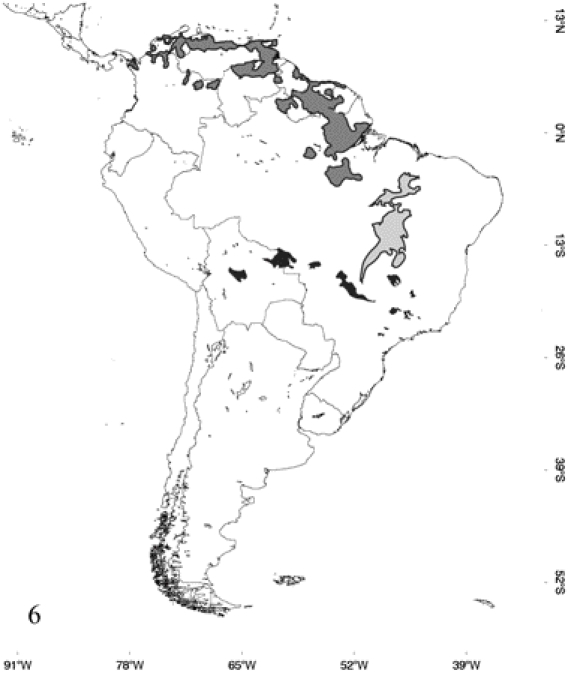
Black areas depict overlapping between E. cenchria and E. crassus, dark gray areas between E. cenchria and E. maurus, and gray areas between E. cenchria and E. assisi.
The PCA analysis revealed three components that collectively explain more than the 84% of the variation, with each PC responsible for 51%, 22% and 11% of the variation, respectively. The PC1 depicts a gradient from subtropical sites with a marked cold and dry winter, to tropical sites with higher temperatures (Fig. 7A, 7B). The PC2 represents a gradient from sites with seasonal precipitation to localities with year-round rainfall (Fig. 7A, 7C). The PC3 mainly represents a gradient of sites at low altitudes with marked seasonality in temperature to sites at high altitudes (Fig. 7B, 7C). PCA loading scores of each variable is indicated in Appendix S1. The MANOVA analysis, using the PC scores as dependent variables and species as categorical variables, shows differences in the climatic envelopes of the five species (Wilks' lambda = 0.04, P≤0.001). Furthermore, the statistically significant separation among species occurs along the three PC axes (PC1 axis: F4 ,360 = 560.4, P≤0.001; PC2 axis: F4 ,360 = 67.3 P≤0.001; the PC3 axis: F4 ,360 = 38.33 P≤0.001).
Figure 7. Principal components analysis (PCA) of continental species of the genus Epicrates for the first two PC axes (A), the first and the third (B) and the second and the third (C).
The PC1 explains 51%, the PC2 explains 22% and the PC3 explains 11% of the variation. Total variation explained by the first three principal components is 84%. E. alvarezi (black circles), E. crassus (black triangles), E. assisi (stars), E. cenchria (black sandglass) and E. maurus (white circles).
Phylogenetic analysis
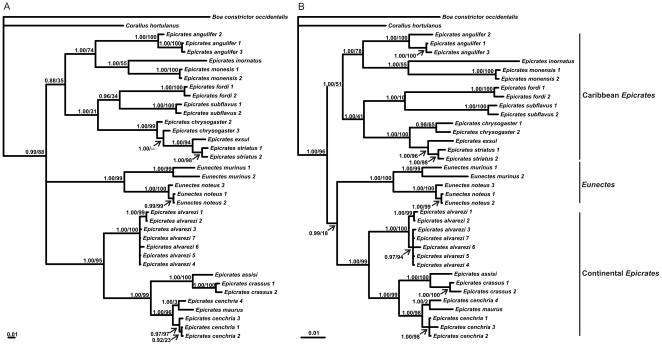
The MP and BI phylogenetic trees of each partition produced highly congruent estimates of phylogenetic relationships among the taxa; in general, the nodes received less support in the MP analyses (Fig. 8).
Figure 8. Bayesian phylogram of the 50% of majority rules consensus tree obtained from (A) the mtDNA data set (cytochrome b gene) and (B) the mtDNA (cytochrome b gene) and nDNA data set (RAG-1, NT-3 and c-mos genes).
The topology is highly congruent to that of maximum parsimony. The node supports are as following: Bayesian posterior probabilities/bootstrap support after 1000 replicates in MP analysis.
The four phylogenetic trees obtained show three well supported clades (Fig. 8). The first comprises all the sequences of the Caribbean Epicrates, the second clade groups those of the genus Eunectes and the third clade clusters all the sequences of the continental Epicrates. Within this last clade, E. alvarezi is recovered as the sister taxon of the rest of the lineages of the continental Epicrates. Epicrates crassus appears as the sister taxa of E. assisi and E. cenchria, of E. maurus. In this last clade, one sequence of Epicrates cenchria (U69777; E. cenchria 4 in Fig. 8A) taken from GenBank groups together with E. maurus. Undoubtedly, this case needs a revision to confirm if the specific name of the individual from which the DNA sample was obtained is correct, according to the new taxonomic arrangement in the group. In the trees recovered using only mtDNA, the three main clades group in a polytomy. However, in the mtDNA+nDNA analyses this polytomy is resolved.
The genetic distances among the continental species of Epicrates were, on average, of 10.1%, ranging from 3.4% (E. cenchria-E. maurus) to 13.9% (E. alvarezi-E. crassus). Epicrates alvarezi is the most genetically divergent of the continental clade. The sequence U69777 presents similar levels of genetic distance with E. cenchria and with E. maurus (2.6% and 2.7% respectively); given the uncertainty about the taxonomy of the specimen, this sequence was not considered in the genetic distance analysis. Among the Caribbean Epicrates the values of genetic distances are the highest, 14.2% on average, ranging from 6.0% (E. crisogaster-E. exsul) to 17.5% (E. angulifer-E. striatus). Between the species of the genus Eunectes the genetic distance was 12.1%. Within species, the genetic distances are, on average, 0.8% and 1.4% for the continental and Caribbean Epicrates, respectively (Table 2– 4).
Table 2. Kimura's two parameter (K2P) distance, for cytochrome b, within and among continental Epicrates spp.
| Taxon name | 1 | 2 | 3 | 4 | 5 |
| 1 Epicrates alvarezi | 0.007 | ||||
| 2 Epicrates crassus | 0.139 | 0.011 | |||
| 3 Epicrates assisi | 0.137 | 0.059 | 0.000 | ||
| 4 Epicrates cenchria | 0.115 | 0.110 | 0.098 | 0.005 | |
| 5 Epicrates maurus | 0.103 | 0.105 | 0.110 | 0.034 | 0.000 |
Table 3. Kimura's two parameter (K2P) distance, for cytochrome b, within and among Caribbean Epicrates spp.
| Taxon name | 1 | 2 | 3 | 4 | 5 | 6 | 7 | 8 |
| 1 Epicrates angulifer | 0.026 | |||||||
| 2 Epicrates chrysogaster | 0.163 | 0.020 | ||||||
| 3 Epicrates fordi | 0.162 | 0.138 | 0.008 | |||||
| 4 Epicrates inornatus | 0.140 | 0.161 | 0.168 | 0.000 | ||||
| 5 Epicrates exsul | 0.166 | 0.060 | 0.143 | 0.169 | 0.000 | |||
| 6 Epicrates monensis | 0.138 | 0.161 | 0.153 | 0.125 | 0.166 | 0.004 | ||
| 7 Epicrates subflavens | 0.162 | 0.133 | 0.116 | 0.155 | 0.147 | 0.143 | 0.011 | |
| 8 Epicrates striatus | 0.175 | 0.065 | 0.146 | 0.172 | 0.036 | 0.166 | 0.152 | 0.014 |
Table 4. Kimura's two parameter (K2P) distance, for cytochrome b, within and among Eunectes spp.
| Taxon name | 1 | 2 |
| 1 Eunectes noteus | 0.007 | |
| 2 Eunectes murinus | 0.121 | 0.057 |
A non directional niche evolution is observed in the continental Epicrates, since the Mantel test correlating ecological and genetic distances between species pairs was not significant (r = 0.33, P = 0.14). Sister species pairs showed different trends: E. maurus presents little divergence in genetic and moderate divergence in ecological distances with E. cenchria (3.4 and 3.53, respectively), but it is ecologically more similar to E. assisi despite their genetic differences (2.71 and 11, respectively).
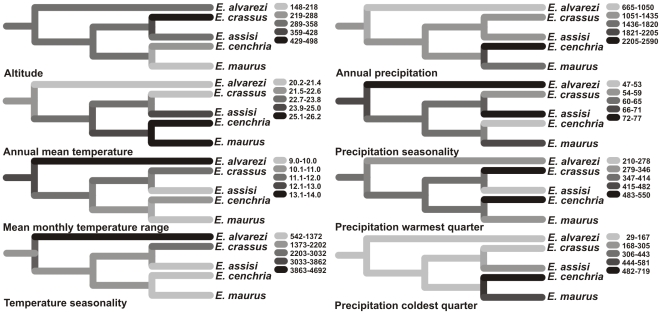
A high variation and abrupt ecological shifts in the history of the continental Epicrates are shown in the reconstruction of ancestral character states of environmental variables on the sequence-based tree (Fig. 9). The reconstruction suggests that the group's common ancestor inhabited subtropical areas with intermediate elevation.
Figure 9. Estimated evolutionary patterns of altitude, annual mean temperature, mean monthly temperature range, temperature seasonality, annual precipitation, precipitation seasonality, and precipitation in the warmest and in the coldest quarter.
Reconstruction of ancestral character states for ecological niche characters based on the phylogenetic tree derived from DNA sequences. Estimated ancestral trait values are shown at the internal nodes and visualized using a color gradient. The color gradient is described at the right of each tree.
Discussion
Ecological divergence among the continental Epicrates
The environmental niche models obtained from our data are in agreement with the known distribution of each species [14], in spite of the few or even none points of occurrence in some regions (e.g. Paraguay, Bolivia and Peru). The model for E. maurus is an exception, since it shows several isolated areas beyond the known range of the species, located in the Amazonic forest, in the Caatinga and in the Pacific Rainforest. Nevertheless, the geographical range of an organism could be related to historical as well to ecological factors (e.g. barriers to dispersal, interspecific competition, predation pressure) [21] that are not always taken into account when modeling the potential distribution.
There are not evidences of ecological interchangeability among the continental species of Epicrates. This is shown by the fact that the relative contribution of each environmental parameter is taxon specific (Table 1). The PCA analysis also reveals that the environmental characteristics of the presence sites for each species are different. This result is confirmed by the MANOVA analysis, which shows that the species are well separated in the environmental space. Furthermore, there is a clear correlation between species distribution and the major biogeographic regions of Central and South America [22]. The allopatric or parapatric distribution along with the differences in the environmental requirements indicates that there is clear habitat isolation that prevents or limits gene exchange among the continental species of Epicrates. The wide area of simpatry between E. maurus and E. cenchria, which corresponds to the 65% of the distribution of E. maurus, is in accordance with previous observations in notes on the geographic distribution of these species [14], [23], [24]. Considering the absence of intrinsic reproductive barriers among species in captivity, as indicated by the commercialization of a variety of hybrid forms as pets, hybridization and gene flow between species could be occurring in the few areas of sympatry detected.
In accordance with the new taxonomic arrangement [14], the ENM of E. crassus encompasses the Brazilian Cerrado, where E. c. polylepis occurs, that of E. maurus includes Marajo Island where E. c. barbouri was described, and the model of E. cenchria includes the Amazonic rainforest of Peru and North of Bolivia where the presence of E. c. gaigei was reported. In this study was also indicated that the population of the Atlantic Rainforest in Eastern Brazil corresponds to E. cenchria, suggesting a disjunct distribution for the species. The specimens of this area were originally described as E. c. higrophylus [6], but it was synonymized with E. cenchria because its variation in meristic characters does not differ from the latter [14]. In our study, the ENM for E. cenchria does not indicate the Atlantic Rainforest of Eastern Brazil as a suitable habitat for this species, suggesting that this population is not only geographically isolated from the other populations of E. cenchria but it is also ecologically divergent. Furthermore, the Atlantic Rainforest was indicated as a suitable habitat for E. crassus. This incongruence between two sources of evidence, morphology and ENM, poses the need of new studies using another type of data (e. g. molecular) to clarify the relationships among the population of this area and the continental species of Epicrates.
Phylogenetic relationships and genetic divergence among the continental Epicrates
This is the first molecular phylogenetic analysis of the genus Epicrates that includes all continental species and the majority of the Caribbean ones. The phylogenetic trees obtained with MP and BI show three well supported clades: the Caribbean Epicrates, the species of the genus Eunectes and the continental Epicrates. The three clades are grouped in a polytomy in the mtDNA tree, but in the nDNA+mtDNA analyses, this polytomy is resolved indicating that the Caribbean Epicrates are the sister taxon of the clade formed by the continental Epicrates and by the species of the Eunectes genus. This clearly indicated that the genus Epicrates is not monophyletic. The paraphyly of the genus was suggested in previous phylogenetic analyses of Boinae. Burbrink, using cytochrome b gene as molecular marker, recovered the continental Epicrates as the sister taxon of the Caribbean Epicrates and the Eunectes clade [25]. Noonan and Chippindale, on the base of sequences of one mitochondrial and five nuclear genes, recovered the Caribbean species of Epicrates outside the cluster grouping the continental Epicrates and Eunectes murinus [26]. Both studies analyzed only one sequence of the continental clade of Epicrates, E. cenchria, since they were performed before the new taxonomic arrangement [14]. Our study includes all the continental species of Epicrates, eight of the nine species of the Caribbean Epicrates and two of the three species of Eunectes, which greatly increases the reliability of the phylogenetic outcome obtained. Besides, the basal position of the clade grouping the insular Epicrates supports the hypothesis of a divergence between the South American Epicrates and Eunectes, posterior to the split of the Caribbean group.
Regarding the speciation pattern in the continental Epicrates, it was suggested that speciation could have been inhibited because of the high levels of gene flow that kept the populations connected [4]. Although genetic distances among the continental species of Epicrates are lower than those found among Caribbean species, they are similar to those obtained between the two well recognized species of the genus Eunectes here analyzed, thus confirming that lineage diversification has also occurred in the continental species.
The four phylogenetic trees (MP and BI) here presented clearly support the monophyly of the continental Epicrates. Epicrates alvarezi is recovered as the sister taxon of the clade, which contains the rest of the species. In agreement with this result, E. alvarezi is the most distinct taxa in morphological characters among the continental Epicrates, showing several exclusive features [14], and it is the species ecologically most divergent in the group. As for the other continental species, E. crassus appears as the sister taxon of E. assisi and E. cenchria as the sister taxon of E. maurus.
Within the continental Epicrates, there is a non-consistent pattern in niche evolution, as indicated by the lack of correlation between niche similarity and genetic distance. The reconstruction of ancestral characters on the phylogenetic tree shows important variations in environmental variables like elevation, temperature seasonality and minimum temperature of the coldest month. From a hypothetical subtropical ancestor, two different pathways diverge: on one hand, a lineage inhabiting tropical non seasonal areas, represented by E. cenchria and E. maurus; on the other hand, the branch comprising E. alvarezi, a species distributed in template, highly seasonal areas. However, our present data are not enough to assess a possible role of the ecological divergence in the speciation process in the group.
To sum up, the degree of genetic and ecological divergence among continental Epicrates and the phylogenetic analyses here performed support the elevation of E. cenchria, E. crassus, E. maurus, E. assisi, and E. alvarezi to the rank of species suggested by morphological data [14]. Nevertheless, the observed discrepancies between environmental niche modeling and morphology (in the population from the Atlantic Rainforest in Eastern Brazil), or between molecular phylogenetic inference and morphology (individual U69777) pose the need of new integrative analyses to elucidate discordant lineages boundaries among several sources of evidence in the continental Epicrates.
Materials and Methods
Ecological modeling
We obtained presence data from the five recognized continental species of the genus Epicrates. The database used includes a total of 105 points of presence of Epicrates alvarezi, 98 of E. crassus, 43 of E. assisi, 56 of E. cenchria and 69 of E. maurus that were gathered from the authors' field data, museum records obtained from http://splink.cria.org.br/ and http://www.herpnet.org/ and literature records [27], [28], [29], [30], [31], [32] (Appendix S2).
Two types of variables were used as predictors: topographic (altitude) derived from a digital elevation model, and bioclimatic, both obtained from WorldClim [33]. This set of environmental variables has shown to be effective data inputs for large-scale predictions of reptiles' distributions [34]. All variables were post-processed at a pixel size of 5×5 km. Resulting data layers have 714×1063 pixels and cover Central and South America between 10°N and 56°S and between 33° and 82°W. ENVI 4.5 software was used in all data analyses (http://www.ittvis.com/).
To avoid over-parameterize the analyses we extracted the environmental information from each species presence data and performed Pearson correlation tests. For pairs of variables that were highly correlated (coefficient ≥0.8), the variable considered easier to interpret biologically was chosen [18].
Several methods are used to estimate the probability area of occurrence of a species from presence-only data; these methods can result overly permissive or overly restrictive [35], which can introduce a bias in the ENMs. A method that tends to over predict ranges will probably indicate overlapped areas for parapatric lineages, leading to the spurious inference of current gene flow among them. On the other hand, an overly restrictive method will tend to indicate that the species are distributed allopatrically, showing niche differentiation where no actual ecological differences exist. To avoid this problem we used two methods, one characterized as more restrictive, the Maximum Entropy method (Maxent) [36] and the other, less restrictive, the Genetic Algorithm for Rule-Set Prediction (GARP) [37]. Maxent is used to find the probability distribution of maximum entropy subject to constraints imposed by the known distribution of the species and by the environmental conditions across the study area. All analysis were set with a convergence threshold of 1.0 E-5 with 1000 iterations; the regularization multiplier was set to 0.5, resulting in a more localized output distribution which is a closer fit to the given presence records.
GARP uses the values of environmental variables of known occurrences and pseudo-absence data to create a model of the specific requirements of the taxon. We used the “best subsets” procedure [38] based on omission and commission error statistics and the models obtained were summed up to produce predictions of potential distributions for each species. The final potential distribution models included areas where ≥5 out of 10 of the replicated models coincided in predicting presence.
A principal component analysis (PCA) was made using values of the environmental variables of each pixel with an observed presence record to examine the overall level of divergence in environmental space among the five species studied and to assess which environmental gradients separate the species. To determine whether separation in environmental space was statistically significant, a multivariate analysis of variance (MANOVA) was performed. The species were the fixed factor and PC scores were the dependent variables. A significant MANOVA score indicates potential non-overlap of ecological niche [19], [39]. In addition, each PC axis was also compared using ANOVA to assess species differentiation. All these analyses were performed using the program Infostat (http://www.infostat.com.ar/).
Phylogenetic analysis
We studied specimens of the five continental Epicrates, eight of the Caribbean species of Epicrates and two species of the sister genus Eunectes (E. notaeus and E. murinus). Corallus hortulanus and Boa constrictor occidentalis were used as outgroups for phylogenetic reconstructions.
Genomic DNA was obtained from muscle tissue or scales, using a saline extraction method [40]. For phylogenetic analyses, we used the mitochondrial cytochrome b (Cyt-b) gene and three nuclear genes, neurotrophin-3 (NT-3), recombination-activating protein 1 (RAG-1) and oocyte maturation factor (c-mos). Primer sequences for these loci are obtained from the literature [41], [42], [43], [44] and are listed in Table 5. All sequencing reactions were performed by Macrogen USA Inc (http://www.macrogenusa.com) in an ABI PRISM 3730x1 DNA automatic analyzer (PE Applied Biosystems, Forster City, California, USA). Sequences obtained in the present study have been deposited in GenBank (Table 6). For some species, available sequences from GenBank were included in the analyses.
Table 5. Primer sequences, sources, aligned fragment length (FL), number of parsimony informative sites (PI) and models of sequence evolution selected for the four loci used in this study.
| Locus | Primer | Primer sequence | Source | FL | PI | Selected model |
| Cyt-b | L14910H16064 | GACCTGTGATMTGAAAACCAYCGTTGT CTTTGGTTTACAAGAACAATGCTTTA | [41] | 1113 | 402 | HKY+G+I |
| RAG-1 | RAG1_f1aRAG1_r2 | CAGCTGYAGCCARTACCATAAAAT CTTTCTAGCAAAATTTCCATTCAT | [42] | 1053 | 19 | GTR+G |
| NT-3 | NT3-F3NT3-R4 | ATATTTCTGGCTTTTCTCTGTGGC GCGTTTCATAAAAATATTGTTTGACCGG | [26] | 664 | 28 | HKY+G |
| C-mos | L39S78 | CTGSARYTTTCTYCATCTGT CCTTGGGTGTGATTTTCTCACCT | [43], [44] | 718 | 6 | HKY |
Table 6. List of the species and accession numbers of the sequences used in this study.
| Taxon | Cytochrome b access | Rag-1 access | Nt-3 access | C-mos access |
| Epicrates alvarezi 1 | HQ399506* | |||
| Epicrates alvarezi 2 | HQ399507* | HQ399521* | HQ399531* | HQ399541* |
| Epicrates alvarezi 3 | HQ399508* | |||
| Epicrates alvarezi 4 | HQ399509* | |||
| Epicrates alvarezi 5 | HQ399510* | |||
| Epicrates alvarezi 6 | HQ399511* | |||
| Epicrates alvarezi 7 | HQ399512* | HQ399522* | HQ399532* | |
| Epicrates crassus 1 | HQ399504* | HQ399520* | HQ399530* | HQ399540* |
| Epicrates crassus 2 | HQ399505* | |||
| Epicrates cenchria 1 | HQ399500* | AY988062 | AY988045 | |
| Epicrates cenchria 2 | HQ399501* | HQ399518* | HQ399528* | HQ399538* |
| Epicrates cenchria 3 | HQ399502* | |||
| Epicrates cenchria 4 | U69777 | |||
| Epicrates assisi | HQ399503* | HQ399519* | HQ399529* | HQ399539* |
| Epicrates maurus | U69779 | |||
| Epicrates angulifer 1 | HQ399513* | HQ399523* | HQ399533* | HQ399542* |
| Epicrates angulifer 2 | U69774 | |||
| Epicrates angulifer 3 | U69776 | |||
| Epicrates inornatus | U69787 | |||
| Epicrates monensis 1 | U69792 | |||
| Epicrates monensis 2 | U69790 | |||
| Epicrates fordi 1 | U69784 | |||
| Epicrates fordi 2 | U69786 | |||
| Epicrates subflavus 1 | U69803 | |||
| Epicrates subflavus 2 | EU138901 | |||
| Epicrates chrysogaster 1 | U69780 | |||
| Epicrates chrysogaster 2 | U69781 | |||
| Epicrates exsul | U69782 | |||
| Epicrates striatus 1 | U69791 | EU402844 | EU390918 | AY099966 |
| Epicrates striatus 2 | U69798 | DQ465556 | DQ465554 | DQ465553 |
| Eunectes noteus 1 | HQ399499* | HQ399516* | HQ399526* | HQ399536* |
| Eunectes noteus 2 | AM236347 | AY988063 | AY988046 | |
| Eunectes noteus 3 | U69810 | |||
| Eunectes murinus 1 | U69809 | HQ399517* | HQ399527* | HQ399537* |
| Eunectes murinus 2 | U69808 | |||
| Corallus hortulanus | HQ399515* | HQ399525* | HQ399535* | HQ399544* |
| Boa constrictor occidentalis | HQ399514* | HQ399524* | HQ399534* | HQ399543* |
*Sequences obtained in this study.
Multiple-sequence alignments were done with MUSCLE [45] using the default parameters. Phylogenetic relationships were analyzed using Maximum Parsimony (MP) and Bayesian inference (BI), for two data sets, mitochondrial DNA (Cyt-b) and combined mitochondrial and nuclear DNA. For MP analysis, the TNT program [46] was used considering equal weighting for all characters and gaps as missing. The Wagner algorithm was used for the heuristic search of the phylogenetic reconstructions with 250 random addition sequences, saving five trees per replica and TBR branch swapping algorithm. Then, the minimum length trees were summarized in a strict consensus tree. The nodes support was evaluated by 1000 bootstrap replicates.
For BI, the most appropriate model of sequence evolution was selected using JModeltest [47], under the Akaike information criterion. The best-fit models for each partition were implemented as partition specific models within partitioned-model analyses of the combined dataset (Table 5). Bayesian analyses were performed using MrBayes 3.1.2 [48]. The analyses were made for two million generations, with sampling intervals of 1000 generations; two independent runs were simultaneously performed on the data; each one using one cold and three heated chains. We discarded the first 25% of the samples as “burn in”. Support for tree nodes was determined according to the values of Bayesian posterior probability obtained from a majority-rule consensus tree.
The Kimura 2 parameter genetic distance (K2P) was calculated using the Cyt-b gene. The nuclear genes were not used to calculate genetic distances due to their low level of variability, and the absence of data for some species.
To assess whether genetic variation across species is associated with divergence in the ecological niche, a Mantel test [49] was conducted comparing matrices of genetic distance (K2P) vs. ecological distance. Ecological distances were measured as the Euclidean distance between species pairs in principal component space. Mantel tests were performed with the program TFPGA (http://www.marksgeneticsoftware.net/tfpga.htm) and 10000 permutations were used in significance testing.
To estimate overall trends in evolution of niche traits, the Phylogenetic Generalized Least Squares method (PGLS) implemented in COMPARE 4.6b (http://compare.bio.indiana.edu) was used [50]. For each species the average value of each environmental parameter extracted from the presence data were stored in the species*variables matrix. The environmental niche traits are continuous variables and we inferred their evolution with common models of continuous trait evolution. Ancestral states were calculated as the weighted average (considering within-species variation, phylogeny, and model of character evolution) of the taxa on the phylogeny.
Supporting Information
List of selected topographical and bioclimatic variables and its PCA loading scores.
(DOCX)
List of the presence data use for the environmental niche model in the continental Epicrates.
(DOC)
Acknowledgments
We are very grateful to Alejandro Giraudo (INALI, Argentina), Gustavo Scrocchi (FML, Argentina), Paola Carrasco (CZA, Argentina), Walter Silva Suarez (UNMSM, Perú), Pedro Cacivio, Ariel Urquiola and Javier Torres for providing samples. We also thank the other members of the Laboratorio de Biología del Comportamiento, Gabriela Cardozo and Maximiliano Tourmente for their invaluable assistance in the field. We wish to thank Julia Mariano for comments that helped to improve this manuscript and to Soledad Rojo and Sol Garcia for their assistance with the figures.
Footnotes
Competing Interests: The authors have declared that no competing interests exist.
Funding: V. D. and J. J. M. are Fellows and P. C. R. and C. N. G. are Career Investigators of the Consejo Nacional de Investigaciones Científicas y Tecnológicas of Argentina (CONICET). V. D. and J. J. M. are doctoral students of the Doctorado de Ciencias Biológicas, Universidad Nacional de Córdoba. The funders had no role in study design, data collection and analysis, decision to publish, or preparation of the manuscript.
References
- 1.de Queiroz K. Howard DJ, Berlocher SH, editors. The general concept of species, species criteria, and the process of speciation: a conceptual unification and terminological recommendations. Endless Forms: Species and Speciation. 1998. pp. 57–75. Oxford University Press, Oxford.
- 2.Nosil P, Sandoval CP. Ecological Niche Dimensionality and the Evolutionary Diversification of Stick Insects. PLoS ONE. 2008;3:e1907. doi: 10.1371/journal.pone.0001907. [DOI] [PMC free article] [PubMed] [Google Scholar]
- 3.Frost DR, Hillis DM. Species in concept and practice: herpetological applications. Herpetologica. 1990;46:87–104. [Google Scholar]
- 4.Tolson PJ. Phylogenetics of the boid snake genus Epicrates and Caribbean vicariance theory. Occas Pap Mus Zool Univ Mich. 1987;715:1–68. [Google Scholar]
- 5.McDiarmid RW, Campbell JA, Touré T. Snakes Species of the World: A Taxonomic and Geographical Reference, Vol. 1. Washington D.C.: The Herpetologist's League; 1999. 511 [Google Scholar]
- 6.Amaral A. Contribução ao conhecimento dos ophidios neotropicos XXXVII. Subespécies de Epicrates cenchria (Linnaeus, 1758). Mem Inst Butantan. 1954;26:227–247. [Google Scholar]
- 7.Duellman WE. Cusco Amazónico: the Lives of Amphibians and Reptiles in an Amazonian Rainforest. Ithaca: Comstock; 2005. 433 [Google Scholar]
- 8.Chippaux JP. Les Serpents de la Guyane Française. Faune Tropicale. 1986;27:1–165. [Google Scholar]
- 9.Gorzula SJ, Señaris JC. Contribution to the herpetofauna of the Venezuelan Guyana I. A data base. Scientia Guaianae. 1999;8:1–269. [Google Scholar]
- 10.de Lema T. Os répteis do Rio Grande do Sul: atuais e fósseis, biogeografia e ofidismo. Porto Alegre: Edipucrs; 2002. 264 [Google Scholar]
- 11.Matz G. Epicrates maurus Gray, 1849 description des sous-espéces. Situla. 2004;10:2–9. [Google Scholar]
- 12.Pérez-Santos C, Moreno AG. Ofidios de Colombia. Museo Regionale di Scienze Naturali di Torino Monografie. 1988;6:6–512. [Google Scholar]
- 13.Tipton BL. Snakes of the Americas, Checklist and Lexicon. Florida: Krieger Publishing; 2005. 492 [Google Scholar]
- 14.Passos P, Fernandes R. Revision of the Epicrates cenchria complex (Serpentes: Boidae). Herpetological Monographs. 2008;22:1–30. [Google Scholar]
- 15.de Queiroz K. Species Concepts and Species Delimitation. Syst Biol. 2007;56:879–886. doi: 10.1080/10635150701701083. [DOI] [PubMed] [Google Scholar]
- 16.Funk DJ, Nosil P, Etges WJ. Ecological divergence exhibits consistently positive associations with reproductive isolation across disparate taxa. Proc Natl Acad Sci USA. 2006;103:3209–3213. doi: 10.1073/pnas.0508653103. [DOI] [PMC free article] [PubMed] [Google Scholar]
- 17.Wiens JJ, Graham CH. Niche conservatism: integrating evolution, ecology, and conservation biology. Annu Rev Ecol Evol Syst. 2005;36:519–539. [Google Scholar]
- 18.Rissler LJ, Apodaca JJ. Adding more ecology into species delimitation: Ecological niche models and phylogeography help define cryptic species in the black salamander (Aneides flavipunctatus). Syst Biol. 2007;56:924–942. doi: 10.1080/10635150701703063. [DOI] [PubMed] [Google Scholar]
- 19.Graham CH, Ron SR, Santos JC, Schneider CJ, Moritz C. Integrating phylogenetics and environmental niche models to explore speciation mechanisms in dendrobatid frogs. Evolution. 2004;58:1781–1793. doi: 10.1111/j.0014-3820.2004.tb00461.x. [DOI] [PubMed] [Google Scholar]
- 20.Bradley RD, Baker RJ. A test of the genetic species concept: cytochrome-b sequences and mammals. J Mammal. 2001;82:960–973. doi: 10.1644/06-MAMM-F-038R2.1. [DOI] [PMC free article] [PubMed] [Google Scholar]
- 21.Peterson AT. Predicting species' geographic distributions based on ecological niche modeling. Condor. 2001;103:599–605. [Google Scholar]
- 22.Cabrera AL, Willink A. Biogeografía de América Latina, Serie Biología, Monografía N° 13. Washington: OEA; 1973. 121 [Google Scholar]
- 23.Ávila Pires TCS. Checklist of the Terrestrial Vertebrates of the Guiana Shield. Bull Biol Soc Wash. 2005;13:25–40. [Google Scholar]
- 24.Barrio-Amorós CL, Díaz de Pascual A. Reptilia, Boidae, Epicrates cenchria cenchria: Distribution extension. Check List. 2008;4:244–247. [Google Scholar]
- 25.Burbrink FT. Inferring the phylogenetic position of Boa constrictor among the Boinae. Mol Phylogenet Evol. 2005;34:167–180. doi: 10.1016/j.ympev.2004.08.017. [DOI] [PubMed] [Google Scholar]
- 26.Noonan BP, Chippindale PT. Dispersal and vicariance: the complex evolutionary history of boid snakes. Mol Phylogenet Evol. 2006;40:347–358. doi: 10.1016/j.ympev.2006.03.010. [DOI] [PubMed] [Google Scholar]
- 27.Cei JM. Reptiles del noroeste, nordeste y este de la Argentina. Museo Regionale Sci. Naturale Torino, Monografie. 1993;14:1–949. [Google Scholar]
- 28.Waller T, Micucci PA, Palumbo EB. Distribución y conservación de la familia Boidae en el Paraguay. Asunción: Secretaría CITES y TRAFFIC Sudamérica; 1995. 98 [Google Scholar]
- 29.Reati GJ. Serpientesd de la provincia de Córdoba, Argentina. In: di Tada IE, Bucher EH, editors. Biodiversidad de la Provincia de Córdoba, vol. 1. Fauna. Río Cuarto: Universidad Nacional de Río Cuarto; 1996. pp. 239–254. [Google Scholar]
- 30.Giraudo AR. Diversidad de serpientes de la selva Paranaense y del Chaco Húmedo: Taxonomía, biogeografia y conservación. Buenos Aires: Editorial LOLA; 2001. 285 [Google Scholar]
- 31.Álvarez BB, Aguirre RH, Céspedez JA, Hernando AB, Tedesco ME. Atlas de Anfibios y Reptiles de las Provincias de Corrientes, Chaco y Formosa (Argentina) I. (Anuros, Cecílidos, Saurios, Amphisbénidos y Serpientes) Corrientes: EUDENE; 2002. 156 [Google Scholar]
- 32.Scrocchi GJ, Moreta JC, Kretzschmar S. Serpientes del Noroeste Argentino. Tucumán: Fundación Miguel Lillo; 2006. 154 [Google Scholar]
- 33.Hijmans RJ, Cameron SE, Parra JL, Jones PG, Jarvis A. Very high resolution interpolated climate surfaces for global land areas. International Journal of Climatology. 2005;25:1965–1978. [Google Scholar]
- 34.Di Cola V, Cardozo G, Lanfri M, Scavuzzo CM, Chiaraviglio M. Modelling the distribution of the Boid snakes, Epicrates cenchria alvarezi and Boa constrictor occidentalis in the Gran Chaco (South America). Amphib-reptil. 2008;29:299–310. [Google Scholar]
- 35.Elith J, Graham CH, Anderson RP, Dudík M, Ferrier S, et al. Novel methods improve prediction of species' distributions from occurrence data. Ecography. 2006;29:129–151. [Google Scholar]
- 36.Phillips SJ, Anderson RP, Schapire RE. Maximum entropy modeling of species geographic distributions. Ecol Modell. 2006;190:231–259. [Google Scholar]
- 37.Stockwell DRB, Peters DP. The GARP modelling system: problems and solutions to automated spatial prediction. Int J Geogr Inf Sci. 1999;13:143–158. [Google Scholar]
- 38.Anderson RP, Lew D, Peterson AT. Evaluating predictive models of species' distributions: Criteria for selecting optimal models. Ecol Modell. 2003;162:211–232. [Google Scholar]
- 39.Stockman AK, Bond JE. Delimiting cohesion species: extreme population structuring and the role of ecological interchangeability. Mol Ecol. 2007;16:3374–3392. doi: 10.1111/j.1365-294X.2007.03389.x. [DOI] [PubMed] [Google Scholar]
- 40.Bruford ME, Hanotte O, Brookfield JFY, Burke T. Single-locus and multilocus DNA fingerprinting. In: Hoelzel AR, editor. Molecular Genetic Analysis of Populations: A Practical Approach. New York: Oxford University Press; 1992. pp. 225–269. [Google Scholar]
- 41.Burbrink FT, Lawson R, Slowinski JB. Mitochondrial DNA phylogeography of the polytypic north american rat snake (Elaphe obsoleta): a critique of the subspecies concept. Evolution. 2000;54:2107–2118. doi: 10.1554/0014-3820(2000)054[2107:MDPOTP]2.0.CO;2. [DOI] [PubMed] [Google Scholar]
- 42.Wiens JJ, Kuczynski CA, Smith SA, Mulcahy DG, Sites JW, Jr, et al. Branch Lengths, Support, and Congruence: Testing the Phylogenomic Approach with 20 Nuclear Loci in Snakes. Syst Biol. 2008;57:420–431. doi: 10.1080/10635150802166053. [DOI] [PubMed] [Google Scholar]
- 43.Saint KM, Austin CC, Donnellan SC, Hutchinson MN. C-mos, A Nuclear Marker Useful for Squamate Phylogenetic Analysis. Mol Phylogenet Evol. 1998;10:259–263. doi: 10.1006/mpev.1998.0515. [DOI] [PubMed] [Google Scholar]
- 44.Slowinski JB, Lawson R. Snake phylogeny: evidence from nuclear and mitochondrial genes. Mol Phylogenet Evol. 2002;24:194–202. doi: 10.1016/s1055-7903(02)00239-7. [DOI] [PubMed] [Google Scholar]
- 45.Edgar RC. MUSCLE: multiple sequence alignment with high accuracy and high throughput. Nucleic Acids Res. 2004;32:1792–1797. doi: 10.1093/nar/gkh340. [DOI] [PMC free article] [PubMed] [Google Scholar]
- 46.Goloboff P, Farris J, Nixon K. TNT, a free program for phylogenetic analysis. Cladistics. 2008;24:774–786. [Google Scholar]
- 47.Posada D. jModelTest: Phylogenetic Model Averaging. Mol Biol Evol. 2008;25:1253–1256. doi: 10.1093/molbev/msn083. [DOI] [PubMed] [Google Scholar]
- 48.Ronquist F, Huelsenbeck JP. MrBayes 3: Bayesian phylogenetic inference under mixed models. Bioinformatics. 2003;19:1572–1574. doi: 10.1093/bioinformatics/btg180. [DOI] [PubMed] [Google Scholar]
- 49.Mantel N. The detection of disease clustering and a generalized regression approach. Cancer Res. 1967;27:209–20. [PubMed] [Google Scholar]
- 50.Martins EP, Hansen TF. Phylogenies and the comparative method: a general approach to incorporating phylogenetic information into the analysis of interspecific data. Am Nat. 1997;149:646–667. [Google Scholar]
Associated Data
This section collects any data citations, data availability statements, or supplementary materials included in this article.
Supplementary Materials
List of selected topographical and bioclimatic variables and its PCA loading scores.
(DOCX)
List of the presence data use for the environmental niche model in the continental Epicrates.
(DOC)


