

Abstract
In the differentiating bacterium Caulobacter crescentus, the cell division initiation protein FtsZ is present in only one of the two cell types. Stalked cells initiate a new round of DNA replication immediately after cell division and contain FtsZ, whereas the progeny swarmer cells are unable to initiate DNA replication and do not contain FtsZ. We show that FtsZ expression is controlled by cell cycle-dependent transcription and proteolysis. Transcription of ftsZ is repressed in swarmer cells and is activated concurrently with the initiation of DNA replication. At the end of the DNA replication period, transcription of ftsZ decreases substantially. We show that the global cell cycle regulator CtrA is involved in the cell cycle control of ftsZ transcription. CtrA binds to a site that overlaps the ftsZ transcription start site. Removal of the CtrA-binding site results in transcription of the ftsZ promoter in swarmer cells. Decreasing the cellular concentration of CtrA increases ftsZ transcription and conversely, increasing the concentration of CtrA decreases ftsZ transcription. Because CtrA is present in swarmer cells, is degraded at the same time as ftsZ transcription begins, and reappears when ftsZ transcription decreases at the end of the cell cycle, we propose that CtrA is a repressor of ftsZ transcription. We show that proteolysis is an important determinant of cell type-specific distribution and cell cycle variation of FtsZ. FtsZ is stable when it is synthesized and assembles into the cytokinetic ring at the beginning of the cell cycle. After the initiation of cell division, the rate of FtsZ degradation increases as both the constriction site and the FtsZ ring decrease in diameter. When ftsZ is expressed constitutively from inducible promoters, the abundance of FtsZ still varies during the cell cycle. The coupling of transcription and proteolysis to cell division ensures that FtsZ is inherited only by the progeny cell that will begin DNA replication immediately after cell division.
Keywords: Caulobacter, FtsZ, cell division, proteolysis, cell cycle, differentiation
The mechanism by which cells coordinate DNA replication, cell growth, and cell division are not well understood (Donachie 1993; Vicente and Errington 1996). Research on cell division in Escherichia coli has pointed to the FtsZ protein as an essential determinant of the timing and the localization of cell division (Erickson 1995; Rothfield and Justice 1997). FtsZ is a tubulin-like GTPase that polymerizes and forms a cytokinetic ring associated with the cytoplasmic membrane at the site of cell division in bacteria (Bi and Lutkenhaus 1991) and archaea (Baumann and Jackson 1996; Margolin et al. 1996; Wang and Lutkenhaus 1996). Localization of FtsZ is likely to be the key event in assembly of the cell division apparatus. FtsZ recruits other cell division proteins to the site of division (Addinall and Lutkenhaus 1996; Addinall et al. 1996; Ma et al. 1996) and may constrict, providing mechanical force for division. In E. coli, the concentration of FtsZ is critical for the timing of cell division (Bi and Lutkenhaus 1990; Garrido et al. 1993). Although the level of the ftsZ mRNA has been shown to vary, it is not known to what extent the level of FtsZ varies during the cell cycle in E. coli (Zhou and Helmstetter 1994; Zhou et al. 1997).
Cells that differentiate by asymmetric cell division must not only coordinate cell division with DNA replication and cell growth, but also with developmental events (Horvitz and Herskowitz 1992). In addition to compartmentalizing the predivisional cell, the cell division barrier can be a target for localization of proteins that control developmental events. In the differentiating bacterium Caulobacter crescentus, a motile swarmer cell and a sessile stalked cell are produced by each division (Brun et al. 1994; Gober and Marques 1995). Swarmer cells are unable to initiate a new round of DNA replication immediately after cell division. Initiation of DNA replication is coincident with the differentiation of the swarmer cell into a stalked cell. Growth of the stalked cell eventually leads to the formation of a predivisional cell in which a flagellum is synthesized de novo at the pole opposite the stalk. After cell division, the progeny stalked cell is immediately capable of initiating a new round of DNA replication, cell growth, and division. Initiation of cell division plays an essential role in the establishment of differential programs of gene expression that sets up the fates of the progeny cells (for review, see Shapiro and Losick 1997). Completion of late steps in cell division is required for the activation of flagellar rotation and for stalk synthesis at the new pole of the cell (Huguenel and Newton 1982; Ohta and Newton 1996). For example, the association of the FlbE kinase with the site of cell division in the swarmer compartment of the predivisional cell is thought to result in the pole-specific activation of flagellar transcription (Wingrove and Gober 1996).
We have begun to study the regulation of cell division in Caulobacter because of the ease with which synchronous populations can be obtained and because the regulation of cell division is important in the control of cell differentiation. Previously, we found that the concentration of FtsZ varies dramatically during the cell cycle of Caulobacter (Quardokus et al. 1996). The FtsZ protein is absent from swarmer cells immediately after cell division and is first detected coincident with the swarmer to stalked cell differentiation when a new round of DNA replication is initiated. The concentration of FtsZ then increases rapidly and reaches a maximal level around the time when the first sign of constriction becomes visible. Once cells have started to constrict, the concentration of FtsZ decreases precipitously. After cell separation, FtsZ is found only in stalked cells. In this study, we demonstrate that both transcriptional regulation and proteolysis are involved in the regulation of FtsZ. We show that the transcription of ftsZ is regulated temporally during the cell cycle in a manner that parallels the variation of FtsZ concentration and DNA replication. Once cell division has begun, transcription of ftsZ decreases rapidly. Our data suggest that transcription of ftsZ is regulated negatively by the essential cell cycle transcription regulator CtrA. After the initiation of cell division, the rate of degradation of FtsZ increases, especially in the swarmer compartment of the predivisional cell. The temporal control of FtsZ degradation is an important regulatory step for its cell type-specific distribution and for the cell cycle variation in its concentration.
Results
ftsZ is transcribed from a single promoter
The transcriptional control of genes in the ftsZ cell division cluster is very complex in E. coli where ftsZ is transcribed from at least five promoters subject to differential regulation (Vicente and Errington 1996). In Caulobacter, the arrangement of genes upstream of ftsZ is similar to that in E. coli, with at least ddl, ftsQ, and ftsA being present directly upstream of ftsZ (Ohta et al. 1997; Sackett et al. 1998). Thus, we needed to define the minimal promoter of ftsZ to study FtsZ expression in Caulobacter. We used transcriptional fusions of different fragments upstream of ftsZ with a promoterless lacZ reporter gene to locate the ftsZ promoter. All fusions ending at the BamHI site downstream of ftsA produced essentially no β-galactosidase activity (for example, plac290/HB2.5 in Fig. 1A). A sequence typical of a ρ-independent terminator is present between the end of the ftsA coding region and the BamHI site (Sackett et al. 1998). Once a fusion was made that extended downstream of the BamHI site within the ftsZ coding region, like in pCF3, β-galactosidase activity increased to 2560 Miller units. plac290/HB2.0BP contains a fragment that begins at this BamHI site and extends within the ftsZ coding region. This fusion produced ∼3200 Miller units, confirming that the ftsZ promoter is downstream of the BamHI site. Removal of sequences downstream from the DdeI site (pL13) abolished promoter activity completely, whereas a 12-bp extension of the fusion to the HpaI site (plac290/E2) restored promoter activity, indicating that an essential element of the promoter is situated in this small region. No promoter activity was found downstream of the second HpaI site as illustrated by p1A1. Finally, extending the fusion to the HindIII site found downstream of the ftsZ coding region abolished promoter activity (pD1E), suggesting the presence of a transcriptional terminator downstream of ftsZ. A putative ρ-independent terminator starts 23 nucleotides downstream from the ftsZ stop codon, with a stem consisting of 9 GC bp followed by a series of T residues (not shown).
Figure 1.

ftsZ is transcribed from one promoter. (A) A partial restriction map of the ftsAZ region is shown with the boundaries of ddl, ftsQ, ftsA, and ftsZ indicated by arrows. ρ-independent terminators are indicated by T. The lines show the different fragments that were subcloned into the pRKlac290 promoter probe plasmid. β-Galactosidase activities are the average of at least four independent assays with s.d. <10%. The approximate location of the ftsZ promoter is indicated with a bent arrow. In plac290/E1, the open box with a Δ represents a deletion of the HpaI fragment. (B) Determination of the ftsZ transcription start site by primer extension and S1 nuclease mapping. Both reactions (P for primer extension and S for S1 nuclease mapping) were run with a dideoxy-sequencing reaction using a primer with the same 5′ end as the primer extension primer (oligonucleotide ftsZPE1) and the S1 probe. The DNA sequence corresponding to the promoter is shown between the two reactions and the −10 and −35 regions are boxed. The cDNA product common to primer extension and S1 mapping is indicated by an arrow and an asterisk indicates the transcription start site in the DNA sequence. The position of the DdeI and the HpaI sites is indicated.
Primer extension and S1 nuclease protection were used to determine the 5′ end of the ftsZ mRNA. Both primer extension and S1 nuclease mapping detected only one common transcript with a 5′ end 115 nucleotides upstream of the translation start site (arrow in Fig. 1B). No ftsZ mRNA end was detected further upstream of −115. The lower band seen in the primer extension (below the band shown with an arrow in Fig. 1B) is not seen in the S1 mapping shown here and in S1 mapping experiments using two different probes (not shown), suggesting that they are artifacts caused by premature termination of the reverse transcriptase. Because of the correspondence between the fusion and the mRNA analysis, we conclude that ftsZ has only one promoter whose transcription initiates at the C residue situated 115 nucleotides upstream of the translation start site and terminates after a ρ-independent terminator that starts 23 nucleotides downstream from the stop codon. Upstream of the transcription start site is a sequence that matches the consensus for σ70 promoters (TTaGCgS N10–14 GCtANAWC, −35 and −10 in Fig. 1B) (Malakooti et al. 1995).
Cell cycle control of ftsZ transcription
To determine whether ftsZ transcription varies during the cell cycle, we isolated swarmer cells by density centrifugation and allowed them to proceed through the cell cycle. We used immunoprecipitation of pulse-labeled β-galactosidase synthesized by a ftsZ–lacZ transcriptional fusion (plac290/HB2.0BP) to measure the transcription of ftsZ at different stages of the cell cycle. Flagellin synthesis was followed as an internal control (Fig. 2B). In the same experiment, we measured the concentration of FtsZ by immunoblot and DNA synthesis as incorporation of [8-3H]dGTP into DNA. Progression through the cell cycle was monitored by light microscopy and representative cells are shown (Fig. 2C). Figure 2A shows that transcription of ftsZ is highly regulated. There was essentially no transcription of ftsZ in swarmer cells. Transcription of ftsZ increased coincident with the initiation of DNA replication. At the time of stalk synthesis initiation (∼0.3 cell division unit), the rate of ftsZ transcription and the rate of DNA replication were both at 70% of their maximal level, and FtsZ had accumulated to ∼30% of its maximal level. ftsZ transcription and DNA replication remained parallel during the cell cycle with a peak around the middle of the cell cycle (0.5 cell division unit). By 0.6 cell division unit, the majority of cells had started to constrict (Fig. 2C) and both DNA replication and ftsZ transcription had begun to decrease. The maximal concentration of FtsZ was reached shortly thereafter at 0.7 cell division unit. At 0.8 cell division unit, cell constriction was more pronounced, the concentration of FtsZ had started to decrease, and flagellar rotation had been activated as indicated by the large number of swimming predivisional cells observed. By 150 min (1 cell division unit), most of the cells had divided. We measured the rate of ftsZ transcription and of FtsZ synthesis in swarmer and stalked cells immediately after cell division. Both ftsZ transcription and FtsZ synthesis were almost completely shut down in swarmer cells (Fig. 3). ftsZ transcription was also low in stalked cells (9% of the maximal rate as determined by phosphorimaging), but the rate of FtsZ synthesis was much higher in stalked cells than in swarmer cells (20% of the maximal rate compared to 0.3% in swarmer cells; see Fig. 3)
Figure 2.
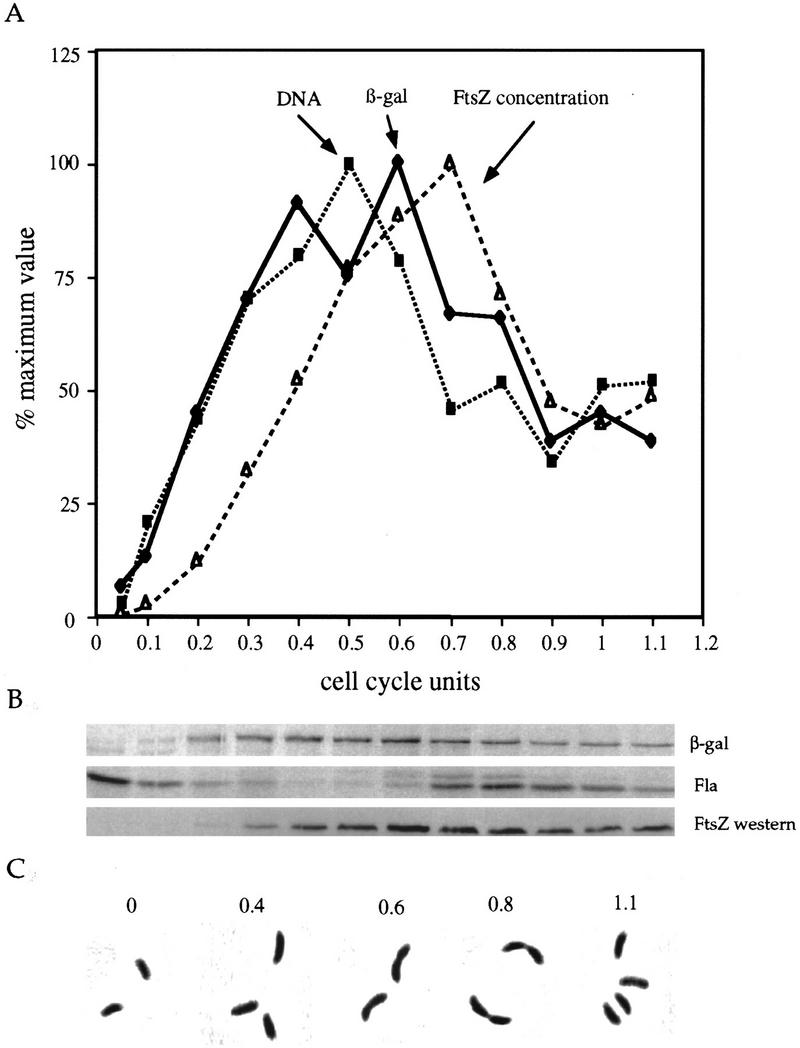
Cell cycle expression of ftsZ. Swarmer cells of strain NA1000 harboring ftsZ–lacZ fusion plasmid plac290/HB2.0BP were collected by density centrifugation and were allowed to proceed through the cell cycle. Cell division occurred at 150 min (1 cell division unit). From the same synchronized culture, aliquots were taken at the times indicated and were either pulse-labeled with [35S]methionine to follow protein synthesis, labeled with [8-3H]GTP to follow DNA synthesis, immunoblotted with anti-FtsZ antibody, or used for photomicroscopy. (A) Plot of the relative rates of β-galactosidase (♦) synthesis as measured by phosphorimaging, DNA replication (▪) as measured by incorporation of [8-3H]GTP into DNA, and FtsZ concentration (▵) as measured by densitometric scanning of immunoblots revealed by chemiluminescence. (B) Autoradiograms from the immunoprecipitation of β-galactosidase (β-gal), flagellins (Fla), and immunoblot with anti-FtsZ antibody (FtsZ western). (C) Photomicrographs of cells at different stages of the cell cycle.
Figure 3.

Expression of FtsZ in different cell types before and after cell division. A synchronized population of swarmer cells harboring ftsZ–lacZ fusion plasmid plac290/HB2.0BP was allowed to proceed through the cell cycle. After 0.7 and 0.9 cell division unit the cells were pulse-labeled for 5 min with [35S]methionine. The label was chased with unlabeled methionine and the cells were allowed to divide. Immediately after division, swarmer (SW) and stalked (ST) cells were separated by density centrifugation. Cell extracts were immunoprecipitated with antibodies to β-galactosidase, FtsZ, and flagellins. The labeled proteins were visualized by autoradiography following SDS-PAGE. In addition, when the cells had just completed division, they were pulse-labeled for 5 min and swarmer and stalked cells were separated. The relative rates of synthesis of β-galactosidase (a measure of the rate of ftsZ transcription) and of FtsZ were measured by phosphorimaging quantitation of immunoprecipitated proteins.
Transcription of ftsZ in the predivisional cell
The difference in FtsZ synthesis in swarmer and stalked progeny cells could be attributable to differential transcription in the two poles of the predivisional cell. To address this possibility, we synchronized swarmer cells containing a ftsZ–lacZ transcriptional fusion (plac290/HB2.0BP) and allowed them to proceed through the cell cycle. At 0.7 cell division unit, when cells had just begun constricting, and at 0.9 cell division units when cells were at a late stage in division, cells were pulse-labeled with [35S]methionine for 5 min. The label was chased with unlabeled methionine and the cells were allowed to divide. Immediately after cell division, newborn swarmer and stalked cells were separated by density centrifugation and the rate of ftsZ transcription in each pole of the predivisional cell was measured by determining the amount of β-galactosidase that was synthesized during the pulse period. Because β-galactosidase is very stable, the amount of labeled β-galactosidase in a progeny cell provides a snapshot of the rate of ftsZ transcription in the corresponding pole of the predivisional cell. We followed the synthesis of flagellins as a control. As previously shown (Gober et al. 1991), flagellin synthesis occurred only in the swarmer pole after a cell division barrier had compartmentalized the predivisional cell (Fig. 3). The β-galactosidase synthesized at 0.7 cell division unit was inherited equally by swarmer and stalked cells indicating that transcription of ftsZ was occurring in both poles (Fig. 3). At 0.9 cell division unit, ftsZ transcription was clearly biased to the swarmer pole (Fig. 3). This indicates that the difference in the synthesis of FtsZ between the progeny cells immediately after cell division is not simply attributable to differential transcription. Indeed, there is more transcription of ftsZ in the swarmer pole than in the stalked pole of the predivisional cell, the opposite of the situation seen in the progeny cells. Whether the higher rate of ftsZ transcription observed in the swarmer pole of the predivisional cell has any biological significance is not known.
CtrA is a negative regulator of ftsZ transcription
Overlapping with the transcription start site of ftsZ (−5 to +10) is a perfect match to the consensus binding site for the CtrA response regulator (Fig. 4). CtrA has been shown to affect positively and negatively the expression of many cell cycle-regulated genes in Caulobacter (Fig. 4B) (Quon et al. 1996). We used DNase I footprinting to confirm that CtrA binds to this region of the ftsZ promoter. A 150-bp fragment corresponding to position −73 to +76 with respect to the transcription start site was amplified by PCR in the presence of labeled 5′ primer or 3′ primer. The two fragments were used in separate experiments. The addition of His6-CtrA∼P protects a 24-bp region centered over the CtrA-binding site (Fig. 5). Furthermore, the addition of His6-CtrA∼P caused an enhancement of DNase I digestion around −14, +19, and +38 (see arrows in Fig. 5). Binding of CtrA to a site overlapping the ftsZ transcription start site suggests that it acts as a repressor of ftsZ transcription. Indeed, the region overlapping the transcription start site is the preferred repressor site in negatively controlled promoters (Collado-Vides et al. 1991). In contrast, the CtrA-binding sites of promoters that appear to be regulated both positively and negatively by CtrA are centered around −30 (Fig. 4B) where CtrA could act both as an activator and a repressor. Comparison of CtrA levels with the rate of ftsZ transcription during the cell cycle indicated that ftsZ transcription rate was low when CtrA was present, consistent with the hypothesis that CtrA is a repressor of ftsZ (Fig. 6).
Figure 4.


Regulatory sequence of ftsZ gene. (A) The sequence of the ftsZ regulatory region and the first few codons is shown. The −10 and −35 regions of the promoter are underlined and the ribosome binding site (RBS) and relevant restriction sites are indicated. The transcription start site is indicated by a bent arrow. The perfect match to the CtrA-binding site is shown by asterisks. Sequences protected from DNase I digestion by CtrA are indicated by thick lines. Coordinates indicated above the sequence are with respect to the transcription start site. (B) Comparison of CtrA-binding sites in ftsZ and other promoters. The transcription start sites are underlined.
Figure 5.
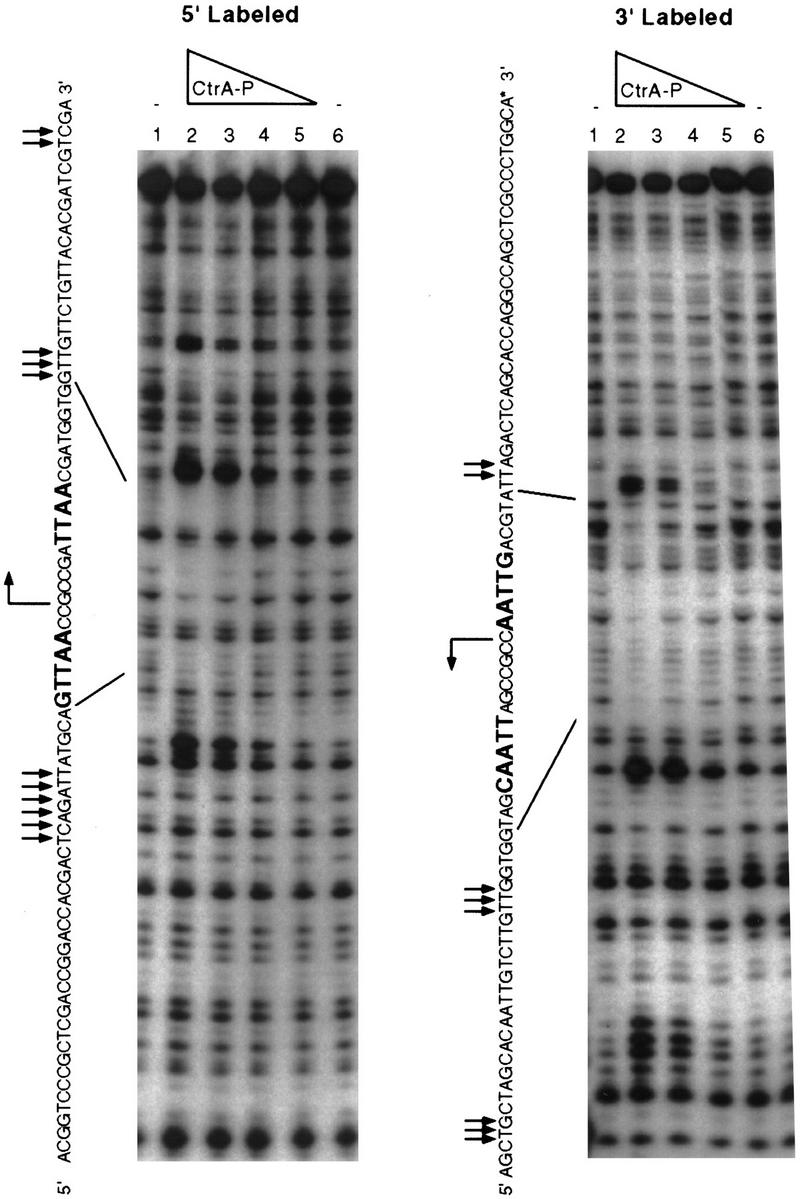
DNase I footprinting of the ftsZ promoter by His6-CtrA∼P. A 150-bp fragment from −73 to +76 of the ftsZ promoter was amplified by PCR and labeled at both ends by using a different 32P-labeled oligonucleotide in each reaction. The sequence of the probes was determined by A+G Maxam-Gilbert sequencing reactions. The sequence of the top strand is shown with boldface letters indicating sequences that match the consensus CtrA binding site. The bent arrows indicate the transcription start site, straight arrows indicate sites of enhanced cleavage, and lines indicate the position of the protected regions on the DNA sequences. In each panel lanes 1 and 6 contain no added protein; lanes 2,3,4, and 5 contain 24, 18, 12, and 6 μg/ml of His6-CtrA∼P, respectively.
Figure 6.
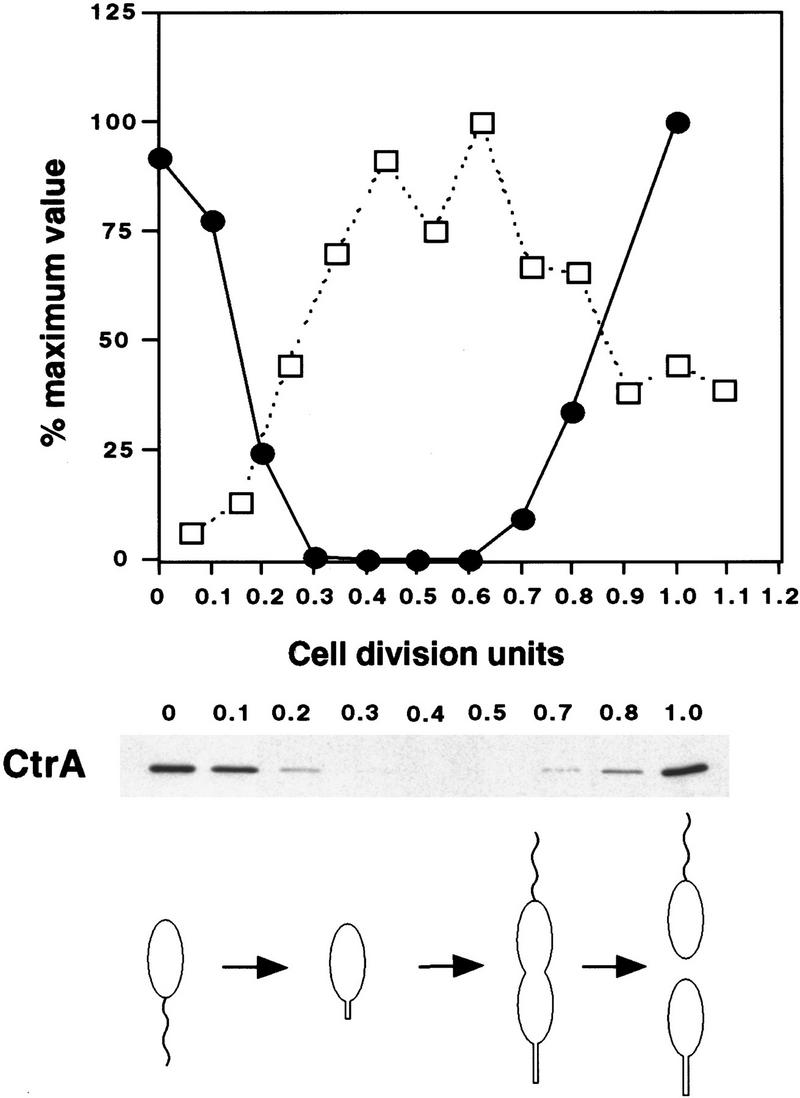
Comparison of CtrA levels and ftsZ transcription rates during the cell cycle. Swarmer cells of strain NA1000 were collected by density centrifugation and were allowed to proceed through the cell cycle. Cell division occurred at 150 min (1 cell division unit). Aliquots were taken at the times indicated and were immunoblotted with anti-CtrA antibody. (Top) The concentration of CtrA (•) is shown as measured by densitometric scanning of immunoblots revealed by chemiluminescence and the rate of ftsZ transcription (□) as determined for Fig. 2. The progression through the cell as determined by microscopic examination is depicted below the immunoblot.
To investigate whether CtrA is a repressor of ftsZ transcription, we used a strain, LS2528, in which the sole copy of ctrA is under the control of the chromosomal xylose inducible promoter PxylX. In LS2528, the concentration of CtrA is substantially lower than in wild-type cells, even when ctrA is transcribed by the induced xylX promoter (Fig. 7B). Under these conditions, the rate of ftsZ transcription is 1.4-fold that of wild-type cells grown in the same conditions (Fig. 7A). When CtrA was depleted by growing LS2528 in the absence of xylose (see Fig. 7B), the rate of ftsZ transcription was increased to approximately twice its rate in wild-type cells grown in the same conditions (Fig. 7A). We used a high copy plasmid, pxylX::ctrAD51EΔ3Ω, that encodes a stable and constitutively active CtrA (CtrAD51EΔ3Ω) under the control of the xylX promoter to test the effect of overproducing CtrA on ftsZ transcription. Even in the absence of xylose, the rate of ftsZ transcription was lower than in wild-type cells (Fig. 7A), probably because the xylX promoter is expressed at a low level under these conditions (Meisenzahl et al. 1997) and thus synthesizes a low level of CtrAD51EΔ3Ω. When xylose was added to induce synthesis of CtrAD51EΔ3Ω, transcription of ftsZ decreased 2.6-fold compared to wild-type cells (Fig. 7A). In comparison, expression of a stable allele of CtrA repressed transcription of the origin of replication strong promoter by threefold in a CtrA null background (Quon et al. 1998). As a control, we analyzed the effect of CtrAD51EΔ3Ω expression on the rsaA promoter, a promoter that is transcribed constitutively during the cell cycle (Fisher et al. 1988) and whose expression is not affected by ctrA (Quon et al. 1996). Transcription of rsaA was reduced only slightly by induction of CtrAD51EΔ3Ω synthesis (Fig. 7A).
Figure 7.


Effect of CtrA on ftsZ transcription. (A) Transcription rates were measured by β-galactosidase assays of exponentially growing cultures as described (Quon et al. 1996) by measuring OD420 and OD660 at various times for 4 hr. During this time, cells continued to increase exponentially in mass and the plots of OD420 and OD660 formed straight lines. Rates were calculated as the slope dOD420/dOD660 by linear least squares analysis and were normalized to wild-type cells. In all experiments, β-galactosidase activity was measured in triplicate. ctrA+ is the wild-type strain NA1000. In LS2528 (xylX::ctrA), the sole copy of ctrA is under the control of the chromosomal xylX promoter. CtrA is expressed in the presence of xylose and is depleted when xylose is removed. In NA1000/pxylX::ctrAD51EΔ3Ω (labeled pxylX::ctrAD51EΔ3Ω) the wild-type allele of ctrA is intact. CtrAD51EΔ3Ω is a stable and constitutively active form of CtrA and is expressed in the presence of xylose. The promoters fused to lacZ are indicated (promoter): ftsZ, wild-type ftsZ promoter (plac290/HB2.0BP); ftsZ(E1), ftsZ promoter without CtrA-binding site (plac290/E1); and rsaA, rsaA-lacZ. (B) Immunoblot of CtrA in NA1000 (ctrA+) and LS2528 (xylX::ctrA) in the presence and absence of xylose. Equal amounts of protein were loaded in each lane. The relative concentration of CtrA was determined by densitometry and is given below the immunoblot.
The decrease of ftsZ transcription after induction of CtrAD51EΔ3Ω synthesis may be caused by binding of CtrAD51EΔ3Ω to the ftsZ promoter. Alternatively, the reduction of ftsZ transcription could be an indirect effect of the cell cycle arrest caused by CtrAD51EΔ3Ω expression (Domian et al. 1997). To distinguish between these possibilities, we analyzed the transcription of a mutant ftsZ promoter, PftsZ(E1), in which the CtrA-binding site had been deleted (plac290/E1; see Fig. 1). Transcription of PftsZ(E1) was 1.7-fold higher than that of the wild-type ftsZ promoter in a wild-type background (Fig. 7A). Furthermore, transcription of PftsZ(E1) was not affected by overexpression of CtrAD51EΔ3Ω (Fig. 7A). These results indicate that the mutation in the ftsZ promoter has removed a repressor site and support the hypothesis that CtrA is a repressor of ftsZ transcription.
Removal of the CtrA-binding site affects the cell cycle transcription of ftsZ
We tested whether removal of the CtrA-binding site affected the cell cycle expression of ftsZ. We first compared the transcription rate of PftsZ(E1) and of another mutant promoter missing the CtrA-binding site, PftsZ(E2) (plac290/E2; Fig. 1), in swarmer and stalked cells (Fig. 8A). Transcription of the wild-type ftsZ promoter was barely detectable in swarmer cells. Both mutant promoters had a substantial transcription rate in swarmer cells, ∼20% of their rate of transcription in stalked cells. The rate of transcription of the two mutant ftsZ promoters in swarmer cells was at least 50-fold higher than the rate of transcription of the wild-type ftsZ promoter. Removal of the CtrA-binding site also affected the rate of ftsZ transcription in stalked cells; the transcription rate of PftsZ(E1) and PftsZ(E2) in stalked cells was 2.6- and 2.3-fold higher than the wild-type promoter, respectively.
Figure 8.


Effect of deletion of the CtrA-binding site on the cell cycle transcription of the ftsZ promoter. (A) Swarmer (SW) and stalked cells (ST) from cultures of NA1000 containing lacZ transcriptional fusions of the wild-type ftsZ promoter (plac290/HB2.0BP, labeled ftsZ) or two mutant ftsZ promoters without the CtrA-binding site (plac290/E1, labeled E1) and (plac290/E2, labeled E2) were separated by density centrifugation. Cells were pulse-labeled with [35S]methionine and β-galactosidase was immunoprecipitated from cell extracts containing equal counts with anti-β-galactosidase antibody. Labeled β-galactosidase was revealed by autoradiography and was quantitated by phosphorimaging. (SW/ST) Ratio of labeled β-galactosidase in swarmer and stalked cells. (B) The cell cycle rate of transcription of a mutant ftsZ promoter without the CtrA-binding site (plac290/E1) was measured as described in A at 15-min intervals in a synchronized population. The progression through the cell cycle is indicated schematically.
Analysis of the cell cycle transcription of PftsZ(E1) confirmed that it was altered compared to that of the wild-type ftsZ promoter (cf. Fig. 8B with Fig. 2B). Transcription of PftsZ(E1) was higher early in the cell cycle and remained relatively high during the late stages of the cell cycle. Although the transcription of PftsZ(E1) was altered, it is clear from the data presented in Figure 8 that it is still subject to some level of cell cycle control; transcription of PftsZ(E1) was still lower early and late in the cell cycle than in the middle of the cell cycle. These experiments indicate that although the CtrA-binding site is required for the proper temporal control of ftsZ transcription, other regulatory elements are likely to be involved in this control.
Cell cycle variation in the stability of FtsZ
The FtsZ immunoblot in Figure 2 shows that the concentration of FtsZ decreases dramatically with an apparent half-life of 0.2 cell division unit after the cells begin to constrict (Fig. 9). Pulse-chase experiments with mixed cultures indicated that the half-life of FtsZ did not follow first-order kinetics (not shown). The deviation from first-order kinetics suggests that all the FtsZ molecules in the cell do not have the same stability. Because these mixed cultures are comprised of cells at different stages of the cell cycle, we asked whether the stability of FtsZ changes during the cell cycle. Swarmer cells were isolated and allowed to proceed through the cell cycle. At 0.1, 0.3, and 0.6 cell division unit, an aliquot of the synchronized culture was pulse-labeled with [35S]methionine for 5 min and the label was chased with unlabeled methionine. For each pulse-labeled aliquot, samples were collected every 15 min after the chase, quickly frozen, and the remaining labeled FtsZ was quantitated. Figure 9 shows that FtsZ synthesized early in the cell cycle (0.1 and 0.3 cell division unit) had a half-life of 0.5 cell division unit (80 min) until at least 0.6 cell division unit. After 0.7 cell division unit, when cells were constricting and the level of FtsZ has started to decrease (see Fig. 2), the half-life of FtsZ decreased to less than 0.1 cell division unit (10–15 min; Fig. 9).
Figure 9.

Cell cycle stability of FtsZ. A synchronized population of swarmer cells was allowed to proceed through the cell cycle. At 15 (□), 45 (▴), and 90 (○) min (0.1, 0.3, and 0.6 cell division units, respectively), aliquots of the culture were pulse-labeled with [35S]methionine and chased for increasing amounts of time. Every 15 min after the chase, the level of radiolabeled FtsZ was determined by immunoprecipitation followed by SDS-PAGE and phosphorimaging. Counts were normalized to equal number of cells. The percentage of radiolabeled FtsZ compared to the level immediately after the labeling period is plotted relative to the time of the cell cycle. Progression through the cell cycle was determined microscopically and is indicated schematically below the graph.
To confirm that FtsZ was less stable late in the cell cycle, we determined the half-life of FtsZ that was synthesized at the time of cell division initiation. FtsZ that had been pulse labeled at 0.6 cell division unit was rapidly degraded with a half-life of ∼20 min (Fig. 9). These results indicate that the stability of FtsZ varies during the cell cycle; it is relatively stable early in the cell cycle when it is being assembled into the cytokinetic ring and becomes unstable late in the cell cycle when the cells are constricting and FtsZ depolymerizes. The FtsZ that had been synthesized early in the cell cycle at 0.1 and 0.3 cell division unit was almost completely degraded by the time the cells divided. Thus, the FtsZ detected in stalked cells after cell division is synthesized during the late stages of the previous cell cycle. This is confirmed by the results of the experiment described in Figure 3. FtsZ that had been pulse labeled at 0.7 and at 0.9 cell division unit was inherited by stalked cells.
One model to explain the cell cycle variation in FtsZ stability is that FtsZ stability varies depending on its assembly state. We used immunofluorescence to determine the assembly state of FtsZ in different cell types. Whereas only weak background fluorescence can be detected in swarmer cells (Fig. 10B), midcell FtsZ immunostaining could be detected as early as 0.4 cell division unit in stalked cells (Fig. 10D). Figure 10F shows FtsZ immunostaining in predivisional cells. Midcell FtsZ immunostaining of varying width can be seen, probably reflecting the constriction of the FtsZ ring as the cells constrict.
Figure 10.
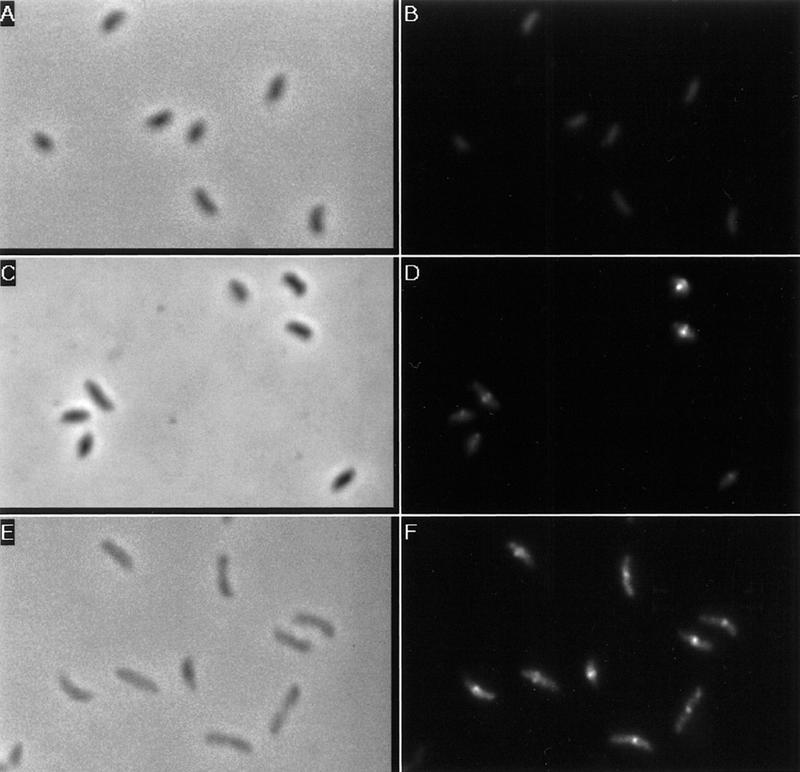
Immunolocalization of FtsZ in different cell types. Cells were synchronized and allowed to proceed through the cell cycle in M2-G medium. Samples of swarmer cells (A,B), stalked cells (C,D), and predivisional cells (E,F) were taken and processed for immunofluorescence. (A,C,E) Phase contrast micrographs; (B,D,F) the FITC immunostaining of FtsZ of the same field as shown in phase contrast micrographs.
Role of proteolysis in the cell type-specific distribution and the temporal variation of FtsZ
To determine whether cell cycle-regulated transcription and proteolysis are both required for the cell cycle variation of FtsZ and for its cell type-specific localization, we put the ftsZ gene under the control of different promoters that are expressed throughout the cell cycle. In YB1793, the chromosomal ftsZ is transcribed from the lacZ promoter whose constitutive activity is approximately the same as that of the ftsZ promoter (R. Janakiraman and Y. Brun, unpubl.). YB1793 showed no sign of cell division or developmental defects (not shown). In NA1000/pZtac, ftsZ is under the control of its own promoter and the tac promoter. The tac promoter is expressed throughout the cell cycle and its transcription rate is similar to that of the ftsZ promoter when induced with IPTG (C. Stephens, pers. comm.). When expression of the tac promoter is induced with IPTG, cells still divide normally but have stalk defects (Quardokus et al. 1996). In NA1000/pUJftsZ, ftsZ is expressed under the control of the xylose-inducible xylX promoter on a multicopy plasmid. In the presence of xylose, transcription from PxylX is constitutive throughout the cell cycle (Meisenzahl et al. 1997). Under these conditions, the level of FtsZ is increased to 10 times its level in wild-type mixed cultures and causes hyperconstriction (Din et al. 1998). Immunoblot analysis of swarmer and stalked cell extracts from each strain clearly shows that in all cases, although FtsZ is detectable in swarmer cells, it is present at a much higher level in stalked cells (Fig. 11A). This indicates that the FtsZ proteolysis system can only be overloaded when ftsZ is transcribed at a high rate. This is especially obvious in NA1000/pUJftsZ where there is 10–20 times more FtsZ in stalked cells, although immunoprecipitation of pulse-labeled FtsZ indicates that FtsZ is being synthesized at the same rate in both cell types (Fig. 11B). This indicates that FtsZ proteolysis is an important component of its cell type-specific localization.
Figure 11.

Effect of FtsZ overexpression on cell type-specific localization and cell cycle variation of FtsZ. (A) Western blot of FtsZ from swarmer and stalked cells separated by density gradient centrifugation. Loading was normalized for equal number of cells. For NA1000/pZtac, expression of FtsZ was induced with 1 mm IPTG for 2 hr and for NA1000/pUJftsZ FtsZ expression was induced with 0.03% xylose for 1 hr before cell separation. (B) Autoradiograph of immunoprecipitated FtsZ from swarmer and stalked cells of pulse-labeled cultures of NA1000 and of NA1000/pUJftsZ grown with 0.03% xylose for 1 hr. Immunoprecipitation was from equal counts of radiolabeled proteins. (C) Cell cycle Western blot of NA1000/pZtac expressing FtsZ constitutively. ftsZ expression was induced with 1 mm IPTG 1 hr before cell separation and was added to the synchronized culture. Loading was normalized for equal number of cells. (ST) Stalked cells; (SW) swarmer cells.
To determine whether proteolysis also contributes to the cell cycle regulation of FtsZ concentration, both YB1793 and NA1000/pZtac grown with 1 mm IPTG were synchronized and the concentration of FtsZ was measured through the cell cycle by immunoblot. In both cases, the variation in FtsZ level was similar to that of wild-type cells and is shown for NA1000/pZtac in Figure 11C. FtsZ was barely detectable before swarmer to stalked cell differentiation. The level of FtsZ then increased until the middle of the cell cycle after which it decreased. We conclude from these experiments that proteolysis is a major regulatory step that controls both the cell type-specific distribution of FtsZ and its cell cycle variation. However, because constitutive expression of ftsZ does result in a low level of FtsZ in swarmer cells, it is clear that, in addition to proteolysis, transcription must be properly controlled to ensure that no FtsZ is present in swarmer cells.
Discussion
Exactly how the expression of cell division genes is coupled to progression through the cell cycle is not known in any bacterium. In Caulobacter, the concentration of the cell division initiation protein FtsZ varies dramatically during the cell cycle and roughly parallels DNA synthesis. Swarmer cells contain no FtsZ. The concentration of FtsZ begins to increase when DNA replication is initiated, reaches a maximum when cytokinesis becomes visible, and then decreases. In this study, we show that two different regulatory mechanisms contribute to the variation of FtsZ concentration. ftsZ transcription is temporally controlled during the cell cycle and parallels DNA synthesis. In addition, the stability of FtsZ varies during the cell cycle; FtsZ is stable when the FtsZ ring is assembled and unstable during cytokinesis when the diameter of the FtsZ ring decreases. The same two regulatory mechanisms contribute to the cell type-specific distribution of FtsZ after cell division.
Transcription of ftsZ is off in swarmer cells and increases at the beginning of S-phase. Coincident with the end of S-phase, at the time when the first signs of cell division are apparent, transcription of ftsZ begins to decrease. Thus, the initiation of cell division or the end of S-phase somehow regulates ftsZ transcription. Immediately after the completion of cell division, the transcription of ftsZ and the synthesis of FtsZ are reduced drastically in both progeny cells. Transcription of ftsZ resumes rapidly in stalked cells but remains off in swarmer cells. We hypothesize that the CtrA cell cycle response regulator can repress ftsZ transcription based on the following evidence: (1) depletion of CtrA causes an increase in the rate of ftsZ transcription; (2) expression of a stable and constitutively active CtrA decreases ftsZ transcription; (3) CtrA binds to a site that overlaps with the ftsZ transcription start site; and (4) removal of the CtrA-binding site renders ftsZ transcription nonresponsive to CtrA overproduction, causes an increase of ftsZ transcription in swarmer cells, and alters the cell cycle control of ftsZ. CtrA is present in swarmer cells, is degraded during the swarmer to stalked cell transition, and starts accumulating again after the initiation of cell division (Domian et al. 1997). These results are consistent with a model where CtrA represses ftsZ transcription in swarmer cells and late in the cell cycle by binding to a site that overlaps with its transcription start site (Fig. 12). However, CtrA is probably not the only regulator of ftsZ cell cycle transcription as a mutant ftsZ promoter missing the CtrA-binding site still exhibits some degree of cell cycle control. It is possible that transcriptional activation by an unknown factor also contributes to the control of ftsZ transcription. CtrA also plays a negative role in the regulation of DNA replication by binding to the origin of replication and repressing transcription from the origin promoter and replication in vivo (Quon et al. 1998). Expression of a CtrA mutant that is constitutively active and is resistant to degradation results in a dominant cell cycle arrest and inhibits cell division (Domian et al. 1997). Thus, one of the roles of CtrA may be to coordinate DNA replication and cell division.
Figure 12.

Model of FtsZ regulation in Caulobacter. In swarmer cells, where no FtsZ is present, CtrA represses ftsZ transcription. During the swarmer to stalked cell differentiation, CtrA is degraded and allows ftsZ transcription to be turned on. The FtsZ concentration increases and FtsZ polymerizes to form the cytokinetic ring. During this time the domain of FtsZ recognized by a protease is masked by its rapid assembly into multimeric complexes. Initiation of cell division provides a signal that inhibits ftsZ transcription, perhaps through CtrA which has reached a high level. FtsZ depolymerizes as the cytokinetic ring constricts. The degradation signal of FtsZ is unmasked and rapidly degraded, especially in the swarmer pole. A small pool of FtsZ is inherited by the stalked cell and is protected from proteolysis as it assembles to form the new cytokinetic ring.
The transcription of ftsZ may be subject to cell cycle control in other bacteria. In E. coli, ftsZ is part of a gene cluster that contains genes involved in peptidoglycan biosynthesis and in cell division. ftsZ is transcribed by at least five promoters located in upstream genes (Donachie 1993; Vicente and Errington 1996). Many studies of ftsZ transcription in E. coli have reached conflicting conclusions, but recent experiments indicate that ftsZ is expressed periodically in the cell cycle. One study showed that ftsZ transcription is activated periodically during the cell cycle, coincident with the initiation of DNA replication (Garrido et al. 1993), and another that ftsZ expression is maximal around the middle of the cell cycle and is minimal at the time of cell division (Zhou and Helmstetter 1994). However, it is not clear what the effect of this variation in ftsZ transcription has on the concentration of FtsZ during the cell cycle of E. coli.
Superimposed on the transcriptional control of ftsZ is a cell cycle-regulated variation in FtsZ stability. We have shown that proteolysis is a major regulatory step in the control of the cell cycle variation of FtsZ. FtsZ has a half-life of 80 min (0.5 cell cycle unit) early in the cell cycle, then becomes highly unstable with a short half-life of 10–20 min (∼0.1 cell cycle unit) after cell division begins. In comparison, FtsZ is stable for more than one generation in E. coli (Garrido et al. 1993). In E. coli, both progeny cells immediately begin a new cell division cycle and FtsZ is assembled rapidly into a new ring after cell division (Addinall et al. 1996). In Caulobacter, only the stalked cells begin a new round of DNA replication immediately after cell division. The swarmer cell must go through a gap phase before resuming growth, replication, and division. In the environment, because nutrients are usually scarce, the swarmer cell spends a long time in this gap phase. It may be that degradation of an abundant protein that is not required, such as FtsZ, and recycling of its amino acids is energetically advantageous to the cell in a manner analogous to the degradation of an important fraction of ribosomes by starved E. coli cells (Siegele and Kolter 1992).
One of the factors controlling the stability of FtsZ in Caulobacter may be its assembly state. Many unstable proteins are stabilized when they are assembled in multimeric complexes (Gottesman and Maurizi 1992). For example, the unassembled forms of the principal components of the membrane cytoskeleton in erythroid cells, α- and β-spectrin, are both unstable. Newly synthesized α- and β-spectrin assemble rapidly in the membrane skeleton and are resistant to degradation (Lazarides and Moon 1984). α- and β-spectrin are degraded by two different pathways and the more rapid degradation of unassembled β-spectrin suggests that degradation is an important regulatory step in the assembly of the erythroid membrane cytoskeleton (Woods and Lazarides 1985). We hypothesize that FtsZ is relatively stable early in the cell cycle because an important fraction of the protein is polymerized. Later in the cell cycle, as the cell constricts and the diameter of the FtsZ ring is decreasing, FtsZ becomes cytoplasmic and unstable. Perhaps the domain of FtsZ recognized by a protease for degradation is inaccessible when FtsZ is assembled but becomes exposed when FtsZ is not assembled. Alternatively, the synthesis or the activity of the protease responsible for FtsZ degradation could be subject to cell cycle control.
During the late stages of the cell cycle, ftsZ is transcribed in both poles of the predivisional cell. Even increasing transcription of ftsZ using inducible promoters does not produce a significant level of FtsZ in swarmer cells, although it increases considerably its concentration in other cell types. We conclude that the cell type-specific distribution of FtsZ is attributable to a higher rate of degradation of FtsZ in the swarmer pole (Fig. 12). The simplest model is that the higher rate of degradation of FtsZ in the swarmer pole is a consequence of its inability to polymerize in the incipient swarmer cell. It may be that a factor required for FtsZ polymerization is missing from swarmer cells or that an inhibitor of FtsZ polymerization is present. In addition, as the level of FtsZ still varies during the cell cycle when ftsZ is transcribed constitutively, it is clear that proteolysis is a major determinant of the cell cycle variation of FtsZ concentration.
Proteins whose stability is regulated usually have well coordinated synthesis and degradation pathways and the balance between these pathways is important to avoid the potentially damaging activity of the unstable protein when present at the wrong place or at the wrong time (Gottesman and Maurizi 1992). It is important that the level of FtsZ be tightly regulated to allow normal progression through the cell division cycle and the developmental cycle in Caulobacter. A low constitutive expression of FtsZ at a level two- to threefold over the wild-type level causes aberrant stalk synthesis (Quardokus et al. 1996). An even higher level of FtsZ blocks cell separation transiently and results in hyperconstriction (Din et al. 1998). Because of its central importance in the initiation of cell division, overproduction of FtsZ also has detrimental effects in many bacteria. In E. coli, a low level overproduction of FtsZ causes minicell formation and higher levels inhibit cell division (Ward and Lutkenhaus 1985). In Rhizobium meliloti, overproduction of either of the two FtsZ proteins causes branching and swelling of cells (Latch and Margolin 1997). There is a similar requirement for control of the level of at least one other cell division protein. Overproduction of FtsA inhibits cell division in E. coli and Caulobacter and causes the mislocalization of stalks in Caulobacter (Wang and Gayda 1990; Dai and Lutkenhaus 1992; Dewar et al. 1992; Sackett et al. 1998).
Other proteins are subject to cell cycle-dependent proteolysis in Caulobacter. CtrA is degraded during the swarmer to stalked cell differentiation (Domian et al. 1997). The MS-ring protein FliF, which anchors the flagellum in the cell membrane, is degraded during swarmer to stalked cell differentiation (Jenal and Shapiro 1996). The Lon-dependent proteolysis of the CcrM adenine DNA methyltransferase is required for the cell cycle-dependent variation of the methylation state of the chromosome (Wright et al. 1996). When CcrM is present through the cell-cycle, cells exhibit defects in cell division and in the timing of initiation of DNA replication (Zweiger et al. 1994). Also, stable mutants of the McpA chemoreceptor protein are localized to both the stalked pole and to the normal McpA localization site at the swarmer pole of the cell (Alley et al. 1993). Pole-specific proteolysis may ensure that FtsZ is degraded completely in the swarmer pole to prevent its detrimental effects on stalk synthesis while still allowing FtsZ to accumulate rapidly in the incipient stalked cell.
Materials and methods
Materials, bacterial strains, plasmids, and growth conditions
Oligonucleotides ftsZPE1 (5′-TCGGTCGTACGCGGCGCGGA-3′), 5′FootZ (5′-GGATTCTGTTGATAGACC-3′), and 3′FootZ (5′-AGACCTCGGCGACACCCA-3′) were obtained from GIBCO BRL. Radionucleotides were obtained from Amersham, DuPont, or ICN Biomedicals Inc, antibiotics from Sigma or Amresco, and Ludox from Dupont. Bacterial strains and plasmids used in this study are described in Table 1. YB1793 was constructed by replacing the ftsZ promoter on the chromosome with the lacZ promoter by cloning the HpaI–PstI fragment in pBGST18 in the same orientation as the lacZ promoter and integrating the plasmid at the ftsZ locus by homologous recombination. The structure of the integrant was verified by Southern blot hybridization. This produces a first copy of ftsZ encoding only 159 of the 508 amino acids under the control of the ftsZ promoter followed by plasmid sequence and a complete copy of ftsZ under the control of the lacZ promoter from the plasmid. The lacZ promoter is expressed constitutively at 3000–5000 Miller units in Caulobacter (R. Janakiraman and Y. Brun, unpubl.) and thus, is comparable in strength to the ftsZ promoter. Transcriptional fusions were constructed by subcloning various DNA fragments into pSKII+ and then into pRKlac290. Caulobacter was grown at 30°C in peptone–yeast extract (PYE) medium (Poindexter 1964), and in minimal M2-glucose medium (Johnson and Ely 1977). Tetracycline was used at a concentration of 2 μg/ml for Caulobacter and 12.5 μg/ml for E. coli. Ampicillin was used at a concentration of 100 μg/ml, and nalidixic acid at a concentration of 20 μg/ml.
Table 1.
Strains and plasmids
| Strain
|
Relevant genotype
|
Source or reference
|
|---|---|---|
| E. coli | ||
| S17-1 | 294∷RP4-2(Tc∷Mu)(Km∷Tn7) | Simon et al. (1983) |
| DH11S F‘ | DH11S: mcrAΔ(mrr hsd RMS mcrBC)Δ(lac–proAB) Δ(recA1398) deoR rpsL srl− thi− /F‘ proAB+ lacIq ZΔM15 | Lin et al. (1992) |
| C. crescentus | ||
| NA1000 | previously called CB15N, a synchronizable derivative of CB15 | Evinger and Agabian (1977) |
| NA1000/pZtac | ftsZ under the control of the tac promoter | Quardokus et al. (1996) |
| LS2528 | NA1000, rec-526 xylX∷pXPC15 (pxylX–ctrA) ΔctrA1∷spec | L. Shapiro (Stanford University, CA) |
| YB1793 | NA1000 ftsZ∷pBGST18HpaPst690 | this work |
| LS2195 | NA1000 ctrA401 | Quon et al. (1996) |
| Plasmid | Relevant characteristic or construction | Source or reference |
| pHB2.0 | 2-kb BamHI–HindIII fragment containing ftsZ from pH10 in pSKII+ | Quardokus et al. (1996) |
| pxylX∷ctrAD51EΔ3Ω | constitutively active and stable CtrA | Domian et al. (1997) |
| pD1E | 2-kb BamHI–HindIII fragment containing ftsZ from pH10 in pRKlac290 | this work |
| plac290/HB2.5 | 2.5-kb BamHI fragment of pH10 in pRKlac290 | this work |
| plac290/HB2.0BP | 0.4-kb BamHI–PvuII fragment of ftsZ in pRKlac290 | this work |
| p1A1 | 0.3-kb HpaI–PvuII fragment of ftsZ in pRKlac290 | this work |
| pLLC | 0.3-kb DdeI–PvuII fragment of ftsZ in pRKlac290 | this work |
| plac290/E1 | 0.4-kb BamHI–PvuII fragment of ftsZ with HpaI fragment deleted in pRKlac290 | this work |
| plac290/E2 | 0.9-kb PstI–HpaI fragment upstream of ftsZ in pRKlac290 | this work |
| pBGST18HpaPst690 | 0.7-kb HpaI–PstI ftsZ fragment in SmaI–PstI of pBGST18 | this work |
| pL13 | 0.9-kb PstI–DdeI fragment upstream of ftsZ in pRKlac290 | this work |
| pH10 | 10-kb HindIII fragment containing ftsZ from cosmid T46 in pSKII+ | this work |
| T46 | cosmid containing ftsZ cluster genes | Quardokus et al. (1996) |
| pCF3 | 2.7-kb SphI fragment from pH10 in pRKlac290 | C. Fink, (unpubl.) |
| pSKII+ | phagemid, AmpR, ColE1 ori, f1(+) ori | Stratagene |
| pUJfstZ | ftsZ under the control of the xylX promoter | Din et al. (1998) |
| pRKlac290 | lacZ transcriptional fusion vector, TetR, IncP-1 replicon, mob+ | Gober and Shapiro (1992) |
Transcriptional control of ftsZ
Transcriptional fusions were first screened for β-galactosidase activity to determine the minimal promoter region. Cell cycle transcription rates were determined in synchronous populations of swarmer cells as described (Evinger and Agabian 1977; Brun and Shapiro 1992). Cells were collected by centrifugation in a Ludox gradient and 1-ml samples were labeled for 5 min at each time point with 15 μCi of [35S]methionine. Immunoprecipitation from cell extracts containing equal counts was done as described (Gomes and Shapiro 1984) with an anti-FtsZ (Caulobacter) antibody (E.M. Quardokus, unpubl.) at a 1:20 dilution, an anti-β-galactosidase antibody (Boehringer-Mannheim) at a 1:200 dilution, and an anti-flagellin antibody at a 1:100 dilution. Quantitation of radiolabeled proteins was done using a Molecular Dynamics PhosphorImager and ImageQuant software. To verify that the low transcription rate of ftsZ in synchronized swarmer cells was not attributable to the synchronization procedure, we measured ftsZ transcription from both swarmer and stalked cells coming from the same Ludox density gradient. Transcription was much higher in the stalked cells than in the swarmer cells indicating that the Ludox treatment did not inhibit ftsZ transcription (not shown). The rate of ftsZ transcription was measured as the rate of β-galactosidase synthesis driven by a ftsZ–lacZ transcriptional fusion by pulse-labeling with [35S]methionine as described above or as the slope dOD420/dOD660 in β-galactosidase assays (Miller 1972), as described (Quon et al. 1996). DNA synthesis was measured as described (Marczynski et al. 1990) by labeling 1-ml samples of cells at each time point with 1 μCi of [8-3H]dGTP for 2 min before 100 μl of 5 n NaOH was added. Samples were incubated for 30 min at 65°C, precipitated with 4 ml of 20% trichloroacetic acid and filtered through GF/C glass fiber filters before counting.
Primer extension and S1 nuclease mapping were done as described (Ausubel et al. 1989) using oligonucleotide ftsZPE1. An annealing temperature of 50°C was used for primer extension and an annealing temperature of 42°C was used for S1 mapping. RNA was purified with the Purescript RNA Isolation kit from Gentra. NA1000 was grown overnight in PYE at 30°C with vigorous shaking and cells were collected from 2.5 ml of culture and resuspended in 300 μl of resuspension buffer. Because of the volume of cell debris during the DNA/protein precipitation step, we found it necessary to add 400 μl of CHCl3. This was not necessary when doing the large-scale purification as described by the manufacturer, although 25 ml of cells was used instead of the recommended 5 ml. DNA sequencing was done using the Tequence Sequencing kit from U.S. Biochemical. Additional sequencing was done using the Sequitherm long read kit from Epicentre Technologies and run on a LiCor Long Ranger Autosequencer.
Western blot analysis was done as described (Quardokus et al. 1996) using an anti-FtsZ antibody at a 1:6000 dilution and a goat anti-rabbit IgG (H+L)– horseradish peroxidase (HRP) conjugate preabsorbed with acetone powdered NA1000 (Maddock and Shapiro 1993) at a 1:20,000 dilution.
Half-life determination
The stability of FtsZ through the cell cycle was determined by pulse-chase experiments as follows. Swarmer cells were isolated by density centrifugation, placed into fresh M2-G minimal medium at 30°C at a final OD660 of 0.2, and were incubated at 30°C with shaking. Aliquots of cells were removed at 15, 45, and 90 min into the cell cycle and labeled with 5 μCi/ml [35S]methionine for 5 min and then chased with 0.5 μm of methionine for the indicated times. Cells were collected by centrifugation and frozen in a dry ice–ethanol bath before being stored at −20°C. The amount of labeled FtsZ present in the samples was determined by lysing the cells and immunoprecipitating with anti-FtsZ antibody. The level of labeled FtsZ protein on SDS-PAGE gels was determined by PhosphorImaging with a Molecular Dynamics PhosphorImager using ImageQuant software.
DNase I footprinting
DNase I footprinting of the ftsZ promoter region was accomplished by designing primers (5′FootZ and 3′FootZ) to flank the putative CtrA-binding site to result in a PCR product of 150 bp for footprinting assays. Each primer was phosphorylated independently with polynucleotide kinase (New England Biolabs). The labeled primers were then used to amplify the 150-bp fragment flanking the putative CtrA-binding site by PCR (Ausubel et al. 1989). The PCR products were loaded onto a 12% polyacrylamide nondenaturing gel, electrophoresed in 1× TBE, and the PCR products were isolated using the MerMaid Spin Kit (Bio 101).
Hexahistidine–CtrA (0.6 μg/μl) was purified as described (Quon et al. 1996) and phosphorylated with 0.5 μg/ml MBP-EnvZ (a gift from M. Igo; Huang and Igo 1996). The phosphorylated hexahistidine–CtrA was used immediately after the phosphorylation reaction in DNase I footprinting experiments as described (Quon et al. 1996).
Immunolocalization of FtsZ
Samples for immunofluorescence were prepared essentially as described (Maddock and Shapiro 1993) with modifications as described in Harry et al. (1995) and specifically for FtsZ by Levin and Losick (1996), except that glutaraldehyde was omitted from the fixing medium. Samples were incubated overnight at ambient temperature with polyclonal antibody to FtsZ (E.M. Quardokus and Y.V. Brun, in prep.), which was affinity purified as described (Grepinet et al. 1988; Salamitou et al. 1994). Goat anti-rabbit FITC-conjugated secondary antibody was used at a dilution of 1:50 in 2% BSA in 1× PBS and incubated for 1 hr at ambient temperature. SlowFade (Molecular Probes) antifading reagent was added before mounting the coverslip on the sample. Epifluorescence photomicroscopy was performed on a Nikon Eclipse E800 light microscope equipped with a Nikon B-2E FITC filter cube for FITC and a 100× Plan Apo oil objective. Images were captured using a Princeton Instruments Cooled CCD camera model 1317 and the Metamorph Imaging Software package v. 3.0.
Acknowledgments
We thank C. Bauer, T. Bird, G. Marczynski, C. Stephens, and members of our laboratory for critical reading of the manuscript. We thank A. Reseinauer, K. Quon, I. Domian, and L. Shapiro for the gift of strains and of CtrA–His overproducing plasmid and for helpful discussions, M. Igo for the gift of EnvZ-MBP and overproducing plasmid, and C. Stephens and G. Marczynski for sharing unpublished results. We are particularly grateful to A. Reisenauer for sharing unpublished protocols and to T. Bird for advice on DNase I footprinting. This work was supported by a National Institutes of Health Predoctoral Fellowship GM07757 to M.J.S., by an Undergraduate Research Fellowship from the American Society for Microbiology, an Indiana University RUGS Fellowship, and a McClung Fellowship to A.J.K., and by a National Institutes of Health Grant GM51986 to Y.V.B.
The publication costs of this article were defrayed in part by payment of page charges. This article must therefore be hereby marked “advertisement” in accordance with 18 USC section 1734 solely to indicate this fact.
Footnotes
E-MAIL ybrun@bio.indiana.edu; FAX (812) 855-6705.
References
- Addinall S, Lutkenhaus J. FtsA is localized to the septum in an FtsZ-dependent manner. J Bacteriol. 1996;178:7167–7172. doi: 10.1128/jb.178.24.7167-7172.1996. [DOI] [PMC free article] [PubMed] [Google Scholar]
- Addinall SG, Bi E, Lutkenhaus J. FtsZ ring formation in fts mutants. J Bacteriol. 1996;178:3877–3884. doi: 10.1128/jb.178.13.3877-3884.1996. [DOI] [PMC free article] [PubMed] [Google Scholar]
- Alley MRK, Maddock JR, Shapiro L. Requirement of the carboxyl terminus of a bacterial chemoreceptor for its targeted proteolysis. Science. 1993;259:1754–1757. doi: 10.1126/science.8456303. [DOI] [PubMed] [Google Scholar]
- Ausubel FM, Brent R, Kingston RE, Moore D, Steidman JG, Smith JA, Struhl K. Current protocols in molecular biology. New York, NY: Wiley/Greene; 1989. [Google Scholar]
- Baumann P, Jackson S. An archaebacterial homologue of the essential eubacterial cell division protein FtsZ. Proc Natl Acad Sci. 1996;93:6726–6730. doi: 10.1073/pnas.93.13.6726. [DOI] [PMC free article] [PubMed] [Google Scholar]
- Bi E, Lutkenhaus J. FtsZ regulates frequency of cell division in Escherichia coli. J Bacteriol. 1990;172:2765–2768. doi: 10.1128/jb.172.5.2765-2768.1990. [DOI] [PMC free article] [PubMed] [Google Scholar]
- ————— FtsZ ring structure associated with division in Escherichia coli. Nature. 1991;354:161–164. doi: 10.1038/354161a0. [DOI] [PubMed] [Google Scholar]
- Brun YV, Shapiro L. A temporally controlled sigma factor is required for cell-cycle dependent polar morphogenesis in Caulobacter. Genes & Dev. 1992;6:2395–2408. doi: 10.1101/gad.6.12a.2395. [DOI] [PubMed] [Google Scholar]
- Brun YV, Marczynski G, Shapiro L. The expression of asymmetry during cell differentiation. Annu Rev Biochem. 1994;63:419–450. doi: 10.1146/annurev.bi.63.070194.002223. [DOI] [PubMed] [Google Scholar]
- Collado-Vides J, Magasnik B, Gralla JD. Control site location and transcriptional regulation in Escherichia coli. Microbiol Rev. 1991;55:371–394. doi: 10.1128/mr.55.3.371-394.1991. [DOI] [PMC free article] [PubMed] [Google Scholar]
- Dai K, Lutkenhaus J. The proper ratio of FtsZ to FtsA is required for cell division to occur in Escherichia coli. J Bacteriol. 1992;174:6145–6151. doi: 10.1128/jb.174.19.6145-6151.1992. [DOI] [PMC free article] [PubMed] [Google Scholar]
- Dewar SJ, Begg KJ, Donachie WD. Inhibition of cell division initiation by an imbalance in the ratio of FtsA to FtsZ. J Bacteriol. 1992;174:6314–6316. doi: 10.1128/jb.174.19.6314-6316.1992. [DOI] [PMC free article] [PubMed] [Google Scholar]
- Din N, Quardokus EM, Sackett MJ, Brun YV. Dominant C-terminal deletions of FtsZ that affect its ability to localize in Caulobacter and its interaction with FtsA. Mol Microbiol. 1998;27:1051–1064. doi: 10.1046/j.1365-2958.1998.00752.x. [DOI] [PubMed] [Google Scholar]
- Domian IJ, Quon KC, Shapiro L. Cell type-specific phosphorylation and proteolysis of a transcriptional regulator controls the G1-to-S transition in a bacterial cell cycle. Cell. 1997;90:415–424. doi: 10.1016/s0092-8674(00)80502-4. [DOI] [PubMed] [Google Scholar]
- Donachie WD. The cell cycle of Escherichia coli. Annu Rev Microbiol. 1993;47:199–230. doi: 10.1146/annurev.mi.47.100193.001215. [DOI] [PubMed] [Google Scholar]
- Erickson HP. FtsZ, a prokaryotic homolog of tubulin? Cell. 1995;80:367–370. doi: 10.1016/0092-8674(95)90486-7. [DOI] [PubMed] [Google Scholar]
- Evinger M, Agabian N. Envelope-associated nucleoid from Caulobacter crescentus stalked and swarmer cells. J Bacteriol. 1977;132:294–301. doi: 10.1128/jb.132.1.294-301.1977. [DOI] [PMC free article] [PubMed] [Google Scholar]
- Fisher JA, Smit J, Agabian N. Transcriptional analysis of the major surface array gene of Caulobacter crescentus. J Bacteriol. 1988;170:4706–4713. doi: 10.1128/jb.170.10.4706-4713.1988. [DOI] [PMC free article] [PubMed] [Google Scholar]
- Garrido T, Sánchez M, Palacios P, Aldea M, Vincente M. Transcription of ftsZ oscillates during the cell cycle of Escherichia coli. EMBO J. 1993;12:3957–3965. doi: 10.1002/j.1460-2075.1993.tb06073.x. [DOI] [PMC free article] [PubMed] [Google Scholar]
- Gober JW, Marques M. Regulation of cellular differentiation in Caulobacter crescentus. Microbiol Rev. 1995;59:31–47. doi: 10.1128/mr.59.1.31-47.1995. [DOI] [PMC free article] [PubMed] [Google Scholar]
- Gober JW, Shapiro L. A developmentally regulated Caulobacter flagellar promoter is activated by 3′ enhancer and IHF binding elements. Mol Biol Cell. 1992;3:913–926. doi: 10.1091/mbc.3.8.913. [DOI] [PMC free article] [PubMed] [Google Scholar]
- Gober JW, Champer R, Reuter S, Shapiro L. Expression of positional information during cell differentiation in Caulobacter. Cell. 1991;64:381–391. doi: 10.1016/0092-8674(91)90646-g. [DOI] [PubMed] [Google Scholar]
- Gomes SL, Shapiro L. Differential expression and positioning of chemotaxis methylation proteins in Caulobacter. J Mol Biol. 1984;177:551–568. doi: 10.1016/0022-2836(84)90238-9. [DOI] [PubMed] [Google Scholar]
- Gottesman S, Maurizi M. Regulation by proteolysis: Energy-dependent proteases and their targets. Microbiol Rev. 1992;56:592–621. doi: 10.1128/mr.56.4.592-621.1992. [DOI] [PMC free article] [PubMed] [Google Scholar]
- Grepinet O, Chebrou M-C, Beguin P. Purification of Clostridium thermocellum xylanase Z expressed in Escherichia coli and identification of the corresponding product in the culture medium of C. thermocellum. J Bacteriol. 1988;170:4576–4581. doi: 10.1128/jb.170.10.4576-4581.1988. [DOI] [PMC free article] [PubMed] [Google Scholar]
- Harry EJ, Pogliano K, Losick R. Use of immunofluorescence to visualize cell-specific gene expression during sporulation in Bacillus subtilis. J Bacteriol. 1995;177:3386–3393. doi: 10.1128/jb.177.12.3386-3393.1995. [DOI] [PMC free article] [PubMed] [Google Scholar]
- Horvitz H, Herskowitz I. Mechanisms of asymmetric cell division: Two Bs or not two Bs, that is the question. Cell. 1992;68:237–255. doi: 10.1016/0092-8674(92)90468-r. [DOI] [PubMed] [Google Scholar]
- Huang K-J, Igo M. Identification of the bases in the ompF regulatory region which interact with the transcription factor OmpR. J Mol Biol. 1996;262:615–628. doi: 10.1006/jmbi.1996.0540. [DOI] [PubMed] [Google Scholar]
- Huguenel ED, Newton A. Localization of surface structures during procaryotic differentiation: Role of cell division in Caulobacter crescentus. Differentiation. 1982;21:71–78. doi: 10.1111/j.1432-0436.1982.tb01199.x. [DOI] [PubMed] [Google Scholar]
- Jenal U, Shapiro L. Cell cycle-controlled proteolysis of a flagellar motor protein that is asymmetrically distributed in the Caulobacter predivisional cell. EMBO J. 1996;15:2393–2406. [PMC free article] [PubMed] [Google Scholar]
- Johnson RC, Ely B. Isolation of spontaneously derived mutants of Caulobacter crescentus. Genetics. 1977;86:25–32. doi: 10.1093/genetics/86.1.25. [DOI] [PMC free article] [PubMed] [Google Scholar]
- Latch JN, Margolin W. Generation of buds, swellings, and branches instead of filaments after blocking the cell cycle of Rhizobium meliloti. J Bacteriol. 1997;179:2373–2381. doi: 10.1128/jb.179.7.2373-2381.1997. [DOI] [PMC free article] [PubMed] [Google Scholar]
- Lazarides E, Moon RT. Assembly and topogenesis of the spectrin-based membrane skeleton in erythroid development. Cell. 1984;37:354–356. doi: 10.1016/0092-8674(84)90364-7. [DOI] [PubMed] [Google Scholar]
- Levin P, Losick R. Transcription factor SpoOA switches the localization of the cell division protein FtsZ from a medial to a bipolar pattern in Bacillus subtilis. Genes & Dev. 1996;10:478–488. doi: 10.1101/gad.10.4.478. [DOI] [PubMed] [Google Scholar]
- Lin JJ, Smith M, Jesse J, Bloom F. DH11S: An Escherichia coli strain for preparation of single-stranded DNA from phagemid vectors. BioTechniques. 1992;12:718–721. [PubMed] [Google Scholar]
- Ma X, Ehrhardt DW, Margolin W. Colocalization of cell division proteins FtsZ and FtsA to cytoskeletal structures in living Escherichia coli cells by using green fluorescent protein. Proc Natl Acad Sci. 1996;93:12998–13003. doi: 10.1073/pnas.93.23.12998. [DOI] [PMC free article] [PubMed] [Google Scholar]
- Maddock JR, Shapiro L. Polar location of the chemoreceptor complex in the Escherichia coli cell. Science. 1993;259:1717–1723. doi: 10.1126/science.8456299. [DOI] [PubMed] [Google Scholar]
- Malakooti J, Wang SP, Ely B. A consensus promoter sequence for Caulobacter crescentus genes involved in biosynthetic and housekeeping functions. J Bacteriol. 1995;177:4372–4376. doi: 10.1128/jb.177.15.4372-4376.1995. [DOI] [PMC free article] [PubMed] [Google Scholar]
- Marczynski GT, Dingwall A, Shapiro L. Plasmid and chromosomal DNA replication and partitioning during the Caulobacter crescentus cell cycle. J Mol Biol. 1990;212:709–722. doi: 10.1016/0022-2836(90)90232-B. [DOI] [PubMed] [Google Scholar]
- Margolin W, Wang R, Kumar M. Isolation of an ftsZ homolog from the archaebacterum Halobacterium salinarium: Implications for the evolution of FtsZ and tubulin. J Bacteriol. 1996;178:1320–1327. doi: 10.1128/jb.178.5.1320-1327.1996. [DOI] [PMC free article] [PubMed] [Google Scholar]
- Meisenzahl AC, Shapiro L, Jenal U. Isolation and characterization of a xylose-dependent promoter from Caulobacter crescentus. J Bacteriol. 1997;179:592–600. doi: 10.1128/jb.179.3.592-600.1997. [DOI] [PMC free article] [PubMed] [Google Scholar]
- Miller JH. Experiments in molecular genetics. Cold Spring Harbor, NY: Cold Spring Harbor Laboratory; 1972. pp. 352–355. [Google Scholar]
- Ohta N, Newton A. Signal transduction in the cell cycle regulation of Caulobacter differentiation. Trends Microbiol. 1996;4:326–332. doi: 10.1016/0966-842x(96)10050-0. [DOI] [PubMed] [Google Scholar]
- Ohta N, Ninfa A, Allaire N, Kulick L, Newton A. Identification, characterization, and chromosomal organization of cell division cycle genes in Caulobacter crescentus. J Bacteriol. 1997;179:2169–2180. doi: 10.1128/jb.179.7.2169-2180.1997. [DOI] [PMC free article] [PubMed] [Google Scholar]
- Poindexter JS. Biological properties and classification of the Caulobacter group. Bacteriol Rev. 1964;28:231–295. doi: 10.1128/br.28.3.231-295.1964. [DOI] [PMC free article] [PubMed] [Google Scholar]
- Quardokus EM, Din N, Brun YV. Cell cycle regulation and cell type-specific localization of the FtsZ division initiation protein in Caulobacter. Proc Natl Acad Sci. 1996;93:6314–6319. doi: 10.1073/pnas.93.13.6314. [DOI] [PMC free article] [PubMed] [Google Scholar]
- Quon KC, Marczynski GT, Shapiro L. Cell cycle control by an essential bacterial two-component signal transduction protein. Cell. 1996;84:83–93. doi: 10.1016/s0092-8674(00)80995-2. [DOI] [PubMed] [Google Scholar]
- Quon KC, Yang B, Domian IJ, Shapiro L, Marczynski GT. Negative control of DNA replication by a cell cycle regulatory protein that binds at the chromosome origin. Proc Natl Acad Sci. 1998;95:120–125. doi: 10.1073/pnas.95.1.120. [DOI] [PMC free article] [PubMed] [Google Scholar]
- Rothfield L, Justice S. Bacterial cell division: The cycle of the ring. Cell. 1997;88:581–584. doi: 10.1016/s0092-8674(00)81899-1. [DOI] [PubMed] [Google Scholar]
- Sackett, M.J., A.J. Kelly, and Y.V. Brun. 1998. Ordered expression of ftsQA and ftsZ during the Caulobacter crescentus cell cycle. Mol. Microbiol. (in press). [DOI] [PubMed]
- Salamitou S, LeMaire M, Fujino T, Ohayon H, Gounon P, Beguin P, Aubert J-P. Subcellular localization of clostridium thermocellum ORF3p, a protein carrying a receptor for the docking sequence borne by the catalytic components of the cellulosome. J Bacteriol. 1994;176:2828–2834. doi: 10.1128/jb.176.10.2828-2834.1994. [DOI] [PMC free article] [PubMed] [Google Scholar]
- Shapiro L, Losick R. Protein localization and cell fate in bacteria. Science. 1997;276:712–718. doi: 10.1126/science.276.5313.712. [DOI] [PubMed] [Google Scholar]
- Siegele DA, Kolter R. Minireview: Life after log. J Bacteriol. 1992;174:345–348. doi: 10.1128/jb.174.2.345-348.1992. [DOI] [PMC free article] [PubMed] [Google Scholar]
- Simon R, Prieffer U, Puhler A. A broad host range mobilization system for in vivo genetic engineering: Transposon mutagenesis in gram negative bacteria. Bio/Technology. 1983;1:784–790. [Google Scholar]
- Vicente M, Errington J. Structure, function and controls in microbial division. Mol Microbiol. 1996;20:1–7. doi: 10.1111/j.1365-2958.1996.tb02482.x. [DOI] [PubMed] [Google Scholar]
- Wang H, Gayda RC. High-level expression of the FtsA protein inhibits cell septation in Escherichia coli K-12. J Bacteriol. 1990;172:4736–4740. doi: 10.1128/jb.172.8.4736-4740.1990. [DOI] [PMC free article] [PubMed] [Google Scholar]
- Wang X, Lutkenhaus J. FtsZ ring: The eubacterial division apparatus conserved in archaebacteria. Mol Microbiol. 1996;21:313–319. doi: 10.1046/j.1365-2958.1996.6421360.x. [DOI] [PubMed] [Google Scholar]
- Ward JEJ, Lutkenhaus J. Overproduction of ftsZ induces minicell formation in E. coli. Cell. 1985;42:941–949. doi: 10.1016/0092-8674(85)90290-9. [DOI] [PubMed] [Google Scholar]
- Wingrove JA, Gober JW. Identification of an asymmetrically localized sensor histidine kinase responsible for temporally and spatially regulated transcription. Science. 1996;274:597–601. doi: 10.1126/science.274.5287.597. [DOI] [PubMed] [Google Scholar]
- Woods CM, Lazarides E. Degradation of unassembled α- and β-spectrin by distinct intracellular pathways: Regulation of spectrin topogenesis by β-spectrin degradation. Cell. 1985;40:959–969. doi: 10.1016/0092-8674(85)90356-3. [DOI] [PubMed] [Google Scholar]
- Wright R, Stephens C, Zweiger G, Shapiro L, Alley MRK. Caulobacter lon protease has a critical role in cell-cycle control of DNA methylation. Genes & Dev. 1996;10:1532–1542. doi: 10.1101/gad.10.12.1532. [DOI] [PubMed] [Google Scholar]
- Zhou P, Helmstetter CE. Relationship between ftsZ gene expression and chromosome replication in Escherichia coli. J Bacteriol. 1994;176:6100–6106. doi: 10.1128/jb.176.19.6100-6106.1994. [DOI] [PMC free article] [PubMed] [Google Scholar]
- Zhou P, Bogan J, Welch K, Pickett S, Wang H, Zaritsky A, Helmstetter C. Gene transcription and chromosome replication in Escherichia coli. J Bacteriol. 1997;179:163–169. doi: 10.1128/jb.179.1.163-169.1997. [DOI] [PMC free article] [PubMed] [Google Scholar]
- Zweiger G, Marczynski G, Shapiro L. A Caulobacter methyltransferase that functions only in the predivisional cell. J Mol Biol. 1994;235:472–485. doi: 10.1006/jmbi.1994.1007. [DOI] [PubMed] [Google Scholar]