Abstract
Purpose: This study presents the results obtained from both simulation and experimental techniques that show the effect of mechanically or electronically steering a phased array transducer on proximal tissue heating.
Methods: The thermal response of a nine-position raster and a 16-mm diameter circle scanning trajectory executed through both electronic and mechanical scanning was evaluated in computer simulations and experimentally in a homogeneous tissue-mimicking phantom. Simulations were performed using power deposition maps obtained from the hybrid angular spectrum (HAS) method and applying a finite-difference approximation of the Pennes’ bioheat transfer equation for the experimentally used transducer and also for a fully sampled transducer to demonstrate the effect of acoustic window, ultrasound beam overlap and grating lobe clutter on near-field heating.
Results: Both simulation and experimental results show that electronically steering the ultrasound beam for the two trajectories using the 256-element phased array significantly increases the thermal dose deposited in the near-field tissues when compared with the same treatment executed through mechanical steering only. In addition, the individual contributions of both beam overlap and grating lobe clutter to the near-field thermal effects were determined through comparing the simulated ultrasound beam patterns and resulting temperature fields from mechanically and electronically steered trajectories using the 256-randomized element phased array transducer to an electronically steered trajectory using a fully sampled transducer with 40 401 phase-adjusted sample points.
Conclusions: Three distinctly different three distinctly different transducers were simulated to analyze the tradeoffs of selected transducer design parameters on near-field heating. Careful consideration of design tradeoffs and accurate patient treatment planning combined with thorough monitoring of the near-field tissue temperature will help to ensure patient safety during an MRgHIFU treatment.
Keywords: magnetic resonance-guided high-intensity focused ultrasound, phased array transducer, near-field, thermal modeling
INTRODUCTION
The manipulation of an ultrasound beam’s shape and location with phased array transducers offers significant advantages in MR-guided high-intensity focused ultrasound (MRgHIFU) treatments, allowing spatial and temporal switching between beam patterns, correcting for phase aberrations due to heterogeneous media, and reducing artifacts in the MRI images (such as those due to fluid motion and susceptibility effects) that are often associated with mechanical transducer translation. Indeed, previous studies have indicated that MRgHIFU treatment times can be reduced through the use of phased array transducers.1, 2, 3
For effective, accurate and fast thermal treatments, the design objectives for a phased array transducer include a small focal spot size, suppressing grating lobes and side lobes, maximizing the range of electronic steering in 3D and achieving maximum pressure at the focal zone.4 These objectives are achieved by manipulating the frequency of operation, radius of curvature, number of elements, interelement spacing, element size, and aperture diameter of the transducer. Tradeoffs between these parameters, the cost of manufacturing and control electronics, and the difficulty of fabrication constrain HIFU phased array transducer design. Current HIFU transducer configurations vary in the number of elements (256-element,5, 6 512-element,7, 8 and 1000 element systems9), frequency of operation [670 kHz to 4 MHz10] and the interelement spacing (random, semirandom, and uniform); each configuration represents a tradeoff between the transducer complexity and the desired beam characteristics for a specific clinical application.
This study concentrates on the analysis of near-field thermal buildup when using a phased array transducer. Several investigators have noted that such thermal buildup occurs in the proximal tissues when executing a treatment with a phased array transducer.2, 11, 12 This paper extends those studies in three ways. First, it uses both simulation and experimental studies to quantify the increase in the near-field tissue temperatures when electronically steering a phased array transducer compared with mechanical motion. Second, it separates the relative contributions of beam overlap and grating lobe clutter on the observed near-field thermal build-up using simulation. Third, it compares the effect of manipulating transducer design parameters on near-field energy deposition by simulating three different transducer configurations.
METHODS
Simulations
All acoustic beam simulations were performed using the hybrid angular spectrum (HAS) method.13 Due to tissue inhomogeneities, scattering, and hardware imperfections, previous investigators14 have empirically found that the experimentally determined focal zone diameter is approximately twice as large in actual media than that predicted by simulations assuming uniform medium properties. Therefore, an adjustment factor was used to increase the simulated focal zone in the transverse plane by a factor of approximately 2, producing a half-intensity focal zone diameter and length of 2 and 10 mm, respectively, approximating the size we have observed when using an existing phased array applicator (transducer #1 in Table TABLE II., described later) to experimentally heat homogeneous agar phantoms. The presented simulations used a homogeneous tissue model 10 × 10 × 10 cm with an isotropic spatial resolution of 1 mm; the assumed tissue acoustic and thermal properties are listed in Table TABLE I..
Table 2.
Transducers analyzed and summary of results.
| Transducer configuration | |||||
|---|---|---|---|---|---|
| # 1 | # 2 | # 3 | |||
| Physical configuration | Radiating surface intensity (W∕cm2) | 2.0 | 2.0 | 2.0 | |
| Radius of curvature (cm) | 13 | 13 | 13 | ||
| Aperture diameter (cm) | 15.4 | 10.3 | 15.4 | ||
| Frequency (MHz) | 1.0 | 1.0 | 0.5 | ||
| Number of elements | 256 | 256 | 256 | ||
| Element radius (cm) | 0.33 | 0.22 | 0.33 | ||
| Element location | Random | Random | Random | ||
| Average interelement spacing | 6λ | 3λ | 3λ | ||
| Beam characteristics | Near-field deposition ratio γ | Unsteered | 0.03 | 0.11 | 0.08 |
| Steered 1 cm transverse | 0.04 | 0.08 | 0.07 | ||
| Steered 1 cm axial | 0.07 | 0.11 | 0.08 | ||
| Maximum Q at focus ( × 108 W∕m3) | Unsteered | 1.15 | 0.25 | 0.2 | |
| Steered transverse | 0.66 | 0.18 | 0.16 | ||
| Steered axial | 0.88 | 0.19 | 0.16 | ||
| focal size (transverse × axial) (mm) | 1.6 × 7.2 | 2.4 × 15.3 | 3.3 × 14.5 | ||
Table 1.
Tissue properties used in simulations.
| Density ρ (kg∕m3) | 1000 | |
| Specific heats ct, cb (kJ∕kg-K) | 4186 | |
| Thermal conductivity k (W∕m-K) | 0.45 | |
| Perfusion w (kg∕m3-s) | 0, 1, 5 | |
| Attenuation (Np∕cm-MHz) | 0.05 | |
| Speed of sound (m∕s) | 1538 |
Several transducer configurations were simulated. An existing 256-randomized element phased array transducer (f = 1 MHz, rc = 13 cm, Imasonics, Besancon, France) was modeled to evaluate the effects of mechanically and electronically steering the ultrasound beam. In order to investigate the individual contributions of grating lobe clutter and beam overlap on near-field thermal buildup, a fully sampled transducer with 40 401 sample points (without any grating lobes) was also simulated. The aperture size, radius of curvature, frequency, and total power output of the fully sampled transducer were equal to those of the 256-element phased array transducer (given in Table TABLE II.), but the number of samples was increased to 40 401 (interelement spacing < λ), and the sample points were arranged in a raster pattern on the transducer surface. In an effort to understand real transducer design tradeoffs, (since electronically steering a fully sampled transducer is a purely a theoretical case) two additional transducer configurations were simulated, and their acoustic performance was compared with the reference 256-element phased array transducer (#1) used in all experiments. The average interelement spacing in transducer #1 is approximately 6λ. In order to decrease grating lobe clutter, element spacing should be as close to 1λ as possible. Therefore, the two alternative transducer configurations investigate different techniques to reduce this spacing. Transducer #2 decreases the interelement spacing by reducing the aperture size of the transducer (which causes tighter element packing, reducing average interelement spacing to ∼3λ). The tighter packing limits the radius of each element to 0.22 cm. Transducer #3 in Table TABLE II. reduces the frequency of operation to 0.5 MHz, thereby increasing the wavelength. Keeping the same absolute random element spacing as transducer #1, an increase in the wavelength reduces the average interelement spacing from 6λ to 3λ. This configuration retains the same element size (keeping total power output equal) and aperture size (keeping the exposure window equal) as transducer #1. The radius of curvature was fixed at 13 cm for all three transducers analyzed, and the distance between the transducer face and tissue model was 8 cm. The physical parameters for all analyzed transducers are given in Table TABLE II..
Thermal responses were calculated using a finite-difference approximation of the Pennes’ bioheat transfer equation,15
| (1) |
where ρ is the tissue density, ct and cb are the specific heats of tissue and blood, respectively, k is the thermal conductivity, Tb is the arterial blood temperature, w is the Pennes’ perfusion, and Qap is the absorbed power density in Watt per cubic meter. Spatial and temporal resolutions were 1 mm isotropic and 0.05 s for all thermal simulations. Thermal dose was calculated based on the formulation given in Sapareto and Dewey.16
Experiments
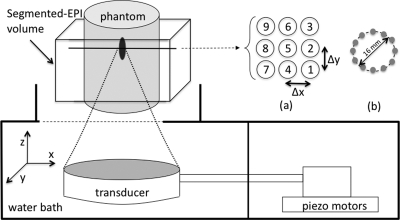
Experiments were conducted using an MR-compatible 256-element phased array applicator (Transducer #1 in Table TABLE II.) HIFU system (Image Guided Therapy, Bordeaux, France) in a 3T Siemens Trio MRI scanner. The experimental setup is shown in Fig. 1. A 3D segmented EPI sequence (2 × 2 × 2 mm, 4.9-s resolution, TR∕TE (ms): 23∕12, FA: 25°, matrix: 64 × 128 × 32) was used to acquire the image data; temperature maps were calculated using a proton resonance frequency-based17 referenceless technique18 in order to reduce any susceptibility effects caused by transducer movement during mechanical translation. All images were postprocessed using zero-filled interpolation by a factor of 2 in all directions, resulting in 1-mm isotropic voxel spacing.19
Figure 1.
Schematic of the experimental setup. The phased array transducer, tissue-mimicking phantom, 3D segmented EPI volume location, and scan path patterns in an x-y plane projection are all shown. (a) Nine-point scanning pattern, Δx = Δy = 1 cm. (b) Twelve-point, 16-mm diameter circular scanning pattern.
Two path trajectories were evaluated, as detailed in Fig. 1. Both linear raster 20 and circular path patterns11, 21 are commonly used in focused ultrasound treatments. Here, we used a single-plane, nine-position raster pattern with 1-cm spacing, and a 16-mm diameter circular pattern composed of 12 discrete points. In the linear raster pattern trajectory, the ultrasound beam was steered either mechanically or electronically. For both types of steering, the ultrasound beam was applied at each point for 30 s before moving to the next point. During mechanical steering over the raster path, the transducer was translated in the x-y plane through the nine points with a continuously applied power of 33 acoustic watts. The mean transducer velocity was 6.25 cm∕s, requiring an average of 190 ms to move between points in the trajectory. During electronic steering, the transducer was centered directly beneath position 5 (Fig. 1), and the ultrasound beam was steered electronically to treat the remaining eight points; the applied power was varied between 33 and 49 acoustic watts when steering away from the center position to compensate for known steering losses,11 depending upon location as determined by acoustic beam simulations using the HAS method. There was a 10-μs interrupt between points, resulting in a virtually seamless transition between sonication points. After the trajectory was completed, the temperatures were monitored for an additional 60 s during cooling.
For the circular path, only electronic steering was used in the experiment since fast temporal switching between points in the circle was not possible with mechanical translation. For the experiment, the transducer was positioned at the center of the circle, and each point was sonicated by electronically steering the ultrasound beam at 114 acoustic watts. Within each circular cycle, each of the 12 points was sonicated for 200 ms. The trajectory was continuously repeated 25 times for a total sonication time of 60 s, resulting in each point receiving a cumulative exposure of 5 s. Since mechanical scanning was not experimentally possible for this case, the trajectory was simulated by translating a numerically calculated beam pattern transversely by a distance corresponding to each respective circle position. The acoustic power input for the simulated mechanically steered case was adjusted such that the peak temperature reached was equivalent to the peak temperature achieved during the experimental electronically steered trajectory.
RESULTS
Simulations and experiments
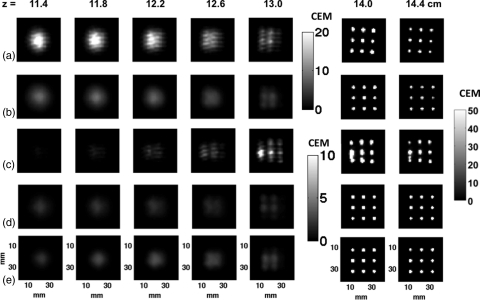
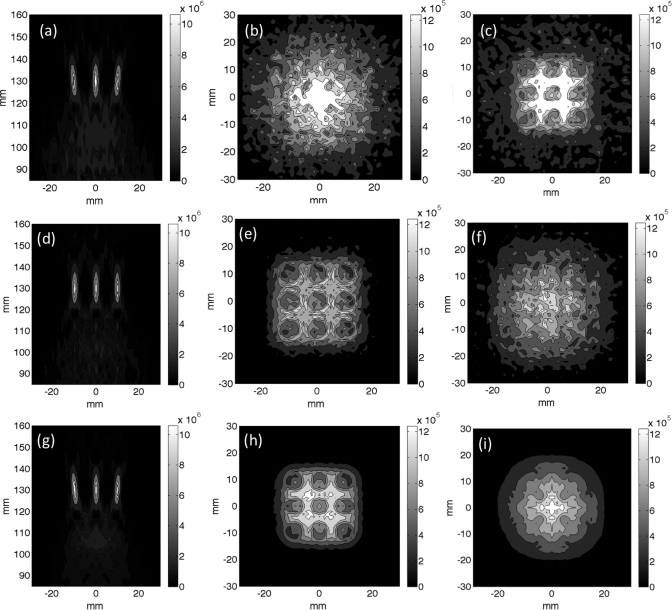
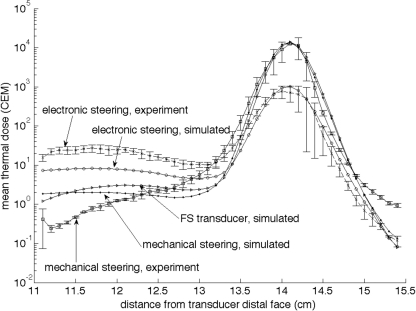
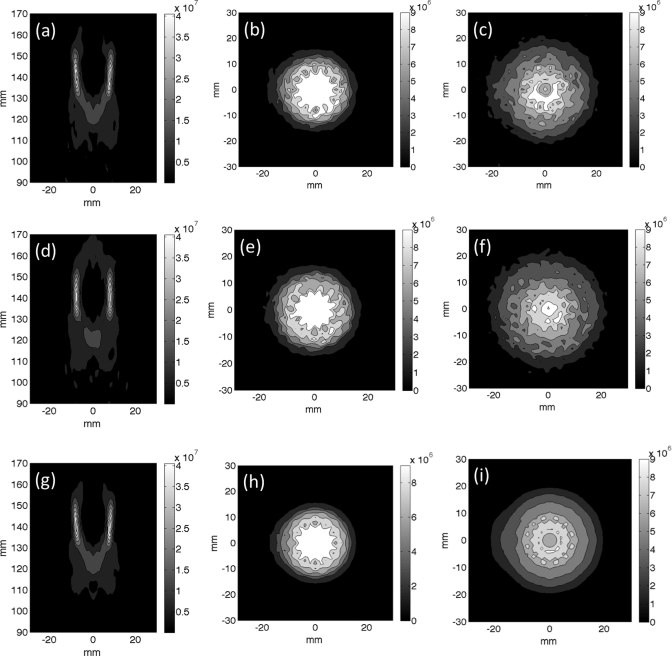
The experimentally determined and corresponding simulated thermal doses resulting from executing the nine-point raster pattern through either mechanical or electronic steering are displayed in Fig. 2 for planes at various locations in the tissue-mimicking phantom with the focal plane at 14 cm from the transducer’s distal face. A superposition of all nine simulated power deposition (Q) patterns in the raster trajectory for both the electronically and mechanically steered trajectories for the 256-element transducer and electronically steered trajectory for the fully sampled transducer are shown in Fig. 3. An increased amount of energy and subsequent thermal dose are deposited in the proximal tissues at all locations when electronically steering through the trajectory with the 256-element phased array transducer compared with the other two cases. Figure 4 shows the mean of the 25 voxels containing the highest thermal dose in each x-y plane plotted as a function of distance from the transducer’s face. This figure clearly shows that in addition to an increased amount of thermal dose deposited in the proximal tissues during electronic steering, there is less thermal dose delivered in the focal plane for the electronically steered trajectory despite the increase of applied power when steered to off-axis points to compensate for steering losses. Despite having less thermal dose deposited in the focal plane, there is more thermal dose deposited in the near-field region when electronically steering the ultrasound beam compared with mechanically steering the beam.
Figure 2.
The experimental and simulated thermal dose maps accumulated in a tissue-mimicking phantom for the nine-point raster scan with the focal plane of the trajectory located at z = 14 cm. The electronically steered, (a) experimental, and (b) simulated thermal dose maps [33–49 W] are shown at distances measured from the transducer’s distal face. (The acoustic power ranges for each are given in square parentheses.) The mechanically steered (c) experimental and (d) simulated thermal dose maps [33 W] are also shown. (e) Simulated thermal dose maps for the fully sampled transducer electronically steered. The scale bar for the dose maps is 0–50 CEM43 °C at z = 14.0 and 14.4 cm, 0–20 CEM43 °C for (a) and (b) and 0–10 CEM43 °C for (c)–(e) at z = 11.4–13.0 cm.
Figure 3.
Superposition of the simulated power deposition patterns used in the thermal simulations presented in Figs. 24 for the nine-point raster trajectory. (a)–(c) Superimposed beam patterns for the electronically steered trajectory for (a) an axial slice, (b) transverse slice 1.5 cm proximal to the focal plane, and (c) transverse slice 2.5 cm proximal to the focal plane. (d)–(f) Superimposed beam patterns for the mechanically steered trajectory for (d) an axial slice, (e) transverse slice 1.5 cm proximal to the focal plane and (f) transverse slice 2.5 cm proximal to the focal plane. (g)–(i) Superimposed beam patterns for the fully sampled transducer electronically steered trajectory for (g) an axial slice, (h) transverse slice 1.5 cm proximal to the focal plane and (i) transverse slice 2.5 cm proximal to the focal plane. All scale bars have the units of Watts per cubic meter.
Figure 4.
Log plot of the mean of the 25 voxels with the highest thermal dose (CEM43 °C) accumulated in planes perpendicular to the ultrasound beam’s axis during the nine-position raster trajectory as a function of distance from the transducer face. The error bars for the experimental data at each point represent one standard deviation (n = 3). The focal plane is located at z = 14 cm. Both simulated and experimental data are shown for both electronic and mechanical steering. The simulation of the electronically steered fully sampled (FS) transducer is also shown.
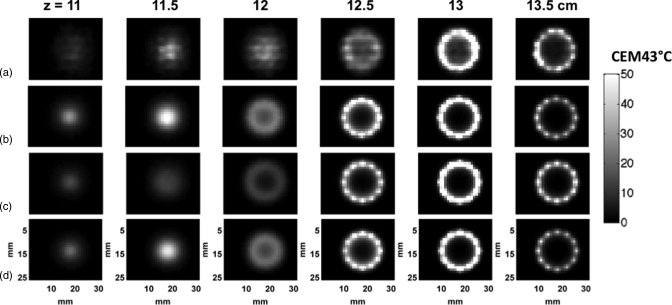
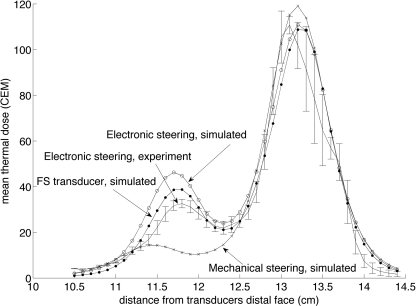
Increased temperature rise in the near-field and therefore increased thermal dose accumulation can also be seen when executing the 16-mm diameter circle trajectory. Both the mechanically and electronically steered cases were simulated and the Q patterns, superimposed for all 12 points in the 16-mm circular trajectory are shown in Fig. 5 for both axial and transverse orientations. The thermal dose accumulated in several x-y planes along the ultrasound beam’s axis for both electronic and mechanical steering for the 256-element phased array transducer and for electronic steering with the fully sampled transducer is shown in Fig. 6. Here, the experimental and the simulated electronically steered results are compared with the simulated mechanically steered and the simulated electronically steered fully sampled transducer cases. For the electronically steered case, the experimental results agree reasonably well with the simulation results, both showing a noticeable accumulation of thermal dose at a location approximately 1.5 cm proximal to the focal zone (at z = 11.5 cm). The mean of the 25 voxels containing the highest thermal dose as a function of position perpendicular to the transducer’s axis is plotted for all four experimental and simulated cases in Fig. 7.
Figure 5.
Superposition of the simulated power deposition patterns used in the thermal simulations presented in Figs. 67 for the 12 point, 16 mm circular trajectory. (a)–(c) Superimposed beam patterns for the electronically steered trajectory for (a) an axial slice, (b) transverse slice 1.5 cm proximal to the focal plane, and (c) transverse slice 2.5 cm proximal to the focal plane. (d)–(f) Superimposed beam patterns for the mechanically steered trajectory for (d) an axial slice, (e) transverse slice 1.5 cm proximal to the focal plane and (f) transverse slice 2.5 cm proximal to the focal plane. (g)–(i) Superimposed beam patterns for the fully sample transducer electronically steered trajectory for (g) an axial slice, (h) transverse slice 1.5 cm proximal to the focal plane and (i) transverse slice 2.5 cm proximal to the focal plane. All scale bars have units of Watts per cubic meter.
Figure 6.
Thermal dose (in CEM43 °C) accumulated during the 16-mm circle trajectory in various x-y planes along the transducer’s axis for both electronically and mechanically steered trajectories. Electronically steered (a) experimental and (b) simulated data, (c) simulated mechanically steered data and (d) simulated electronically steered fully sampled transducer. The focal plane for the ultrasound beam is located at z = 13 cm. In all cases, the total sonication time was 60 s. The power for the electronically steered trajectory (both simulated and experimental) was 114 acoustic W to account for steering losses. The mechanically steered trajectory power input was 108 W.
Figure 7.
Mean of the 25 voxels with the highest thermal dose (CEM43 °C) accumulated in planes perpendicular to the transducer’s axis for the 16-mm circular trajectory. The focal plane is at 13 cm. Both experimental and simulated results are displayed for electronic steering, and simulated data for the mechanically steered trajectory, and the electronically steered fully sampled (FS) transducer. The error bars for the experimental data at each point represent one standard deviation (n = 3).
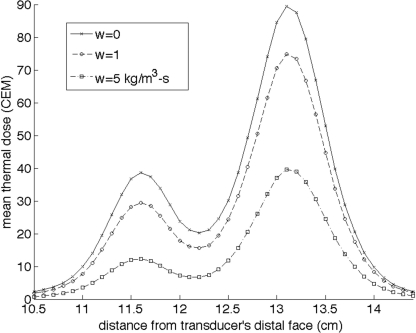
All of the above experiments and simulations were performed in a zero-perfusion environment using the same tissue-mimicking phantom.22 Figure 8 displays simulation results showing the effect of perfusion on the dose accumulated in various planes throughout the phantom for the electronically steered 16-mm diameter circular trajectory.
Figure 8.
Effect of perfusion on the mean of the 25 voxels with the highest thermal dose accumulated in planes perpendicular to the transducer’s axis for the 16-mm circle trajectory. Pennes’ perfusion values of 0,1, and 5 kg∕m3-s are shown. The focal plane for the ultrasound beam is located at z = 13 cm.
Effect of transducer design
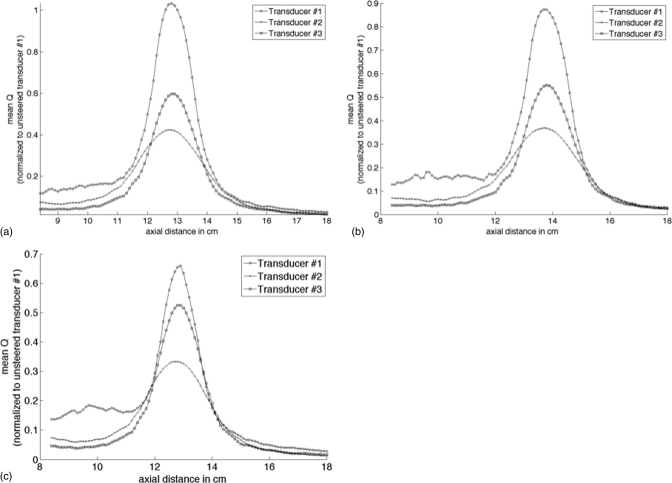
Table TABLE II. lists two alternate transducer configurations (changing aperture size or frequency of operation) that were analyzed in order to decrease the effect of near-field heating, and compares the performance of these transducers (#2 and #3) to the transducer (#1) employed in the above tests. The transducer beam characteristics used for comparison are near-field clutter, maximum power deposition Q in the focal zone, and focal zone size. The near-field clutter is quantified using a near-field deposition ratio γ defined as
| (2) |
where Qmax,FZ is the maximum power deposition value in the focal zone, and Qmax,NF is the maximum power deposition value in the near-field, with the near-field defined as the region between the transducer face and the x-y plane 1.5-cm proximal to the focal zone in the axial direction. This ratio was calculated for the cases of: (a) the transducer focused at its geometric focus, (b) electronically steered in the axial (z) direction only, and (c) electronically steered 1 cm in both the x and y directions in the transverse plane. All transducer configurations had elements distributed randomly on the surface of the transducer. In order to eliminate the effect of different random placement of elements (since better randomization will improve transducer performance during electronic steering) the relative angular position of all elements between different transducer configurations was kept constant. Figure 9 displays the mean power deposition Q deposited in the 25 voxels with the highest Q values as a function of distance from the transducer’s distal face for each of the steering conditions. The Q for each transducer is normalized to the maximum Q deposited at the geometric focus by transducer #1.
Figure 9.
Mean of the 25 voxels with the highest power deposition Q as a function of distance from the transducer’s distal face for three different transducer configurations of (a) an unsteered beam at the geometric focus, (b) a beam steered 1 cm away from the transducer axially, and (c) a beam steered 1 cm off-axis in both the x and y transverse directions. The power deposition for each transducer is normalized to the mean power deposition in the peak 25 voxels at the geometric focus for transducer #1.
DISCUSSION
The electronic steering capability of a phased array transducer offers many advantages in MRgHIFU. It is well suited to the MRI environment where fluid motion and susceptibility artifacts should be minimized. It allows the user to vary the size and shape of the ultrasound beam profile and allows for very fast temporal switching between sonication points, offering more flexibility during a treatment. However, this study has shown that electronically steering a 256-randomized element phased array can significantly increase the thermal dose deposited in the near-field region over mechanical steering of the same phased array transducer.
Near-field thermal buildup was evaluated experimentally for mechanical and electronic steering scenarios for two commonly used trajectories in MRgHIFU. In order to identify the source of the near-field thermal buildup, simulations were performed using the experimental transducer and were compared with a theoretical fully sampled transducer with no grating lobe clutter. The results from the nine-point raster trajectory are shown in Figs. 2 through 4. While there is a significant difference in the near-field thermal buildup in all presented cases, there is also a difference in the dose accumulated in the focal plane. Despite the power being increased when steering off-axis to account for theoretical losses when executing the electronically steered trajectory, there was more thermal dose deposited in the focal plane during the mechanically steered case. This discrepancy was due to the underestimation of the off-axis steering losses. This underestimation resulted in a difference between peak temperatures for the electronically and the mechanically steered trajectories of approximately ± 3 °C at each of the nine points. Due the nonlinearity of the thermal dose formulation used in the calculations, this small variation in temperature translated to a much larger difference in thermal dose. It should be noted that even though there is less thermal dose deposited in the focal plane during the electronically steered case, there is still a large increase of dose deposited in the near-field when compared with the mechanically steered case.
Figure 4 shows the higher near-field heating seen experimentally in both the mechanically and the electronically steered trajectories. The simulations for the 256-element phased array transducer show trends very similar to those seen in the experimental data. The under predicted profiles could be the result of a disparity between the assumed attenuation of the model used in the simulation and the actual attenuation value of the tissue-mimicking phantom. For the fully sampled transducer, there is no increase in grating lobe clutter when steering the beam electronically, but the acoustic window is smaller when compared with the mechanically steered trajectory. Therefore, while all near-field thermal buildup is primarily due to the beam overlap in both the 256-element phased array mechanically steered and fully sampled electronically steered transducer cases, more near-field heating is seen in the fully sampled transducer case due to the decreased acoustic window size. It should be noted that while Fig. 4 (and Fig. 7) displays the mean of the 25 voxels with the highest thermal dose accumulated in various planes along the ultrasound beam propagation path, the mean of thermal dose over a fixed area in each axial plane (132 total voxels), the maximum thermal dose in each plane, and the mean of the nine voxels containing the highest thermal dose in each axial plane were analyzed in addition to the 25 voxels metric. In each of these additional cases, the trend displayed in Fig. 4 was the same with the only difference being the overall magnitude of the thermal dose accumulated. Therefore, this particular metric was deemed appropriate for the presented analysis.
A 16-mm circular trajectory with a smaller steering angle and hence smaller acoustic window in the near-field was also evaluated. In this case, experiments and simulation results matched well, showing a near-field maxima approximately 1.5 cm proximal to the focal plane. The near-field thermal build-up is most pronounced, as expected, for the electronically steered case both because beam overlap is greater when the transducer is nontranslating and because of grating lobe clutter that is added to the main lobe overlap. Similar to the nine point raster trajectory results, the fully sampled transducer simulation produced higher thermal dose in the near-field than the mechanically steered trajectory due to the reduced acoustic window in the fully sampled transducer simulation when compared with the mechanically steered trajectory.
The superimposed power deposition patterns for both the nine-point raster trajectory (Fig. 3) and 16-mm circular trajectory (Fig. 5) show an increase of power deposition in the near-field in the electronically steered trajectory when compared with the mechanically steered trajectory. The comparison of the electronically steered power deposition patterns from the 256-element phased array transducer [Figs. 3a–3c] to the power deposition patterns from the fully sampled transducer [Figs. 3g–3i] show the increased power deposition that occurs due to grating lobe clutter. The effect is more pronounced in Fig. 3 than in Fig. 5, which is to be expected due to the increased angle of steering for the nine-point raster trajectory.
Both trajectories were not designed to ablate a defined volume of tissue. In other studies,11, 20, 21 both trajectory types have been extended to ablate defined volumes by adding additional points and planes. This extension would result in an increased total sonication time, exacerbating the effect of increased near-field buildup. In addition, while an increase in perfusion does reduce the effect of increased near-field buildup, it does not eliminate the thermal dose accumulation, as seen in Fig. 8.
In an effort to better analyze the root cause of the increased near-field heating, two additional transducer configurations were simulated and their performance was compared with the reference transducer (#1) used in the above experiments. Transducer #2 in Table TABLE II. reduces the interelement spacing by reducing the aperture size of the transducer, limiting the radius of each element to 0.22 cm. Figures 9a–9c show that transducer #2 deposits less power density in the focal zone compared with transducer #1 because of the smaller element size (since the transducer’s radiated surface power density was kept constant) and larger axial focal zone size (Table TABLE II.). In addition, as expected from the smaller aperture size (and lower interelement spacing), the percentage loss in power deposition due to the electronic steering for transducer #2 is lower than seen in transducer #1; however transducer #1 still deposits more power deposition during electronic steering in the focal zone (and the near-field) due to its larger element size. The reduction in aperture size decreases the interelement spacing and should in theory reduce the grating lobe clutter; however combining the effects of a larger focal zone and smaller area in the exposure window of the transducer leads to a near-field deposition ratio γ that is larger for transducer #2 than for transducer #1.
Transducer #3 reduces the frequency of operation to 0.5 MHz, thereby increasing the wavelength while retaining the same element and aperture size as transducer #1. Figure 9 shows that transducer #3 deposits more power deposition in the focal zone compared with transducer #2 even with a lower frequency and with a larger focal size. Reducing the interelement spacing in terms of wavelength (thus, decreasing the percentage power lost when steering) while maintaining a large aperture size (spreading the prefocal beam over a larger area) improves γ of transducer #3 compared with transducer #1 for the steered case. This study shows that transducer design characteristics can be altered to reduce the Q deposited in the near-field tissues. However, these changes may result in tradeoffs in the maximum Q at the focus and in focal spot size that can be undesirable in MRgHIFU treatments.
This study has presented data that characterize the near-field heating effects of a 256-element phased array transducer. While the results presented herein are specific to the designs simulated and tested, the general nature of the results is applicable to all phased array transducers. Although each individual design will give somewhat different results based on the specific transducer configuration, the potential for near-field heating can be expected to be similar. In addition, only two paths commonly used in HIFU were analyzed while a great number of path options are available to the user with the increasingly diverse flexibility of phased array transducers. All experiments and simulations were conducted in a homogeneous material. In vivo environments present a much more complex problem that would alter the beam patterns presented in this work. However, despite the limitations of the studies presented in this paper, the results show the necessity of patient treatment planning and real-time treatment monitoring to predict and monitor the expected near-field thermal buildup that will occur during the treatment.
CONCLUSION
Phased array transducers offer many advantages in MRgHIFU treatments. However, the simulation and experimental results in this study show that because of more pronounced near-field heating due to a combination of beam overlap and increased grating lobe clutter, there are some disadvantages to using electronic steering. While strategic transducer design and detailed pretreatment planning may be able to reduce this effect, near-field thermal buildup is unavoidable, making real-time treatment monitoring with MR thermometry essential. The results presented herein show that if 2D MR thermometry is used with only one or two slices placed in the near-field, there may be significant heating occurring that is not being monitored during the treatment that could potentially cause undesired normal tissue damage. These effects should be taken into account during the design and characterization of a HIFU transducer, as well as in the treatment planning and monitoring process.
ACKNOWLEDGMENTS
The authors gratefully acknowledge support from Siemens Healthcare AG, Image Guided Therapy, the Ben and Iris Margolis Foundation and NIH-1-R01-CA134599. We also thank Emilee Minalga, Dr. Rock Hadley, and Dr. Bob Roemer for their contribution to the work.
References
- Wu X. and Sherar M., “Theoretical evaluation of moderately focused spherical transducers and multi-focus acoustic lens/transducer systems for ultrasound thermal therapy,” Phys. Med. Biol. 47(9), 1603–1621 (2002). 10.1088/0031-9155/47/9/313 [DOI] [PubMed] [Google Scholar]
- Fan X. and Hynynen K., “Ultrasound surgery using multiple sonications—treatment time considerations,” Ultrasound Med. Biol. 22(4), 471–482 (1996). 10.1016/0301-5629(96)00026-9 [DOI] [PubMed] [Google Scholar]
- Daum D. R. and Hynynen K., “Thermal dose optimization via temporal switching in ultrasound surgery,” IEEE Trans. Ultrason. Ferroelectr. Freq. Control 45(1), 208–215 (1998). 10.1109/58.646926 [DOI] [PubMed] [Google Scholar]
- Clay A. C., Wooh S.-C., Azar L., and Wang J.-Y., “Experimental Study of Phased Array Beam Steering Characteristics,” Journal of Nondestructive Evaluation 18 (2), 59–71 (1999). 10.1023/A:1022618321612 [DOI] [Google Scholar]
- de Senneville B. D., Mougenot C., and Moonen C. T., “Real-time adaptive methods for treatment of mobile organs by MRI-controlled high-intensity focused ultrasound,” Magn. Reson. Med. 57(2), 319–330 (2007). 10.1002/mrm.v57:2 [DOI] [PubMed] [Google Scholar]
- Daum D. R. and Hynynen K., “A 256-element ultrasonic phased array system for the treatment of large volumes of deep seated tissue,” IEEE Trans. Ultrason. Ferroelectr. Freq. Control 46(5), 1254–1268 (1999). 10.1109/58.796130 [DOI] [PubMed] [Google Scholar]
- Hynynen K., Clement G. T., McDannold N., Vykhodtseva N., King R., White P. J., Vitek S., and Jolesz F. A., “500-element ultrasound phased array system for noninvasive focal surgery of the brain: a preliminary rabbit study with ex vivo human skulls,” Mag. Reson. Med. 52(1), 100–107 (2004). 10.1002/mrm.v52:1 [DOI] [PubMed] [Google Scholar]
- Gorny K. R., Hangiandreou N. J., Hesley G. K., Gostout B. S., McGee K. P., and Felmlee J. P., “MR guided focused ultrasound: Technical acceptance measures for a clinical system,” Phys. Med. Biol. 51(12), 3155–3173 (2006). 10.1088/0031-9155/51/12/011 [DOI] [PubMed] [Google Scholar]
- Jolesz F. A., “MRI-guided focused ultrasound surgery,” Ann. Rev. Med. 60, 417–430 (2009). 10.1146/annurev.med.60.041707.170303 [DOI] [PMC free article] [PubMed] [Google Scholar]
- Hynynen K., “MRI-guided focused ultrasound treatments,” Ultrasonics 50(2), 221–229 (2010). 10.1016/j.ultras.2009.08.015 [DOI] [PubMed] [Google Scholar]
- Kohler M. O., Mougenot C., Quesson B., Enholm J., Le Bail B., Laurent C., Moonen C. T., and Ehnholm G. J., “Volumetric HIFU ablation under 3D guidance of rapid MRI thermometry,” Med. Phys. 36(8), 3521–3535 (2009). 10.1118/1.3152112 [DOI] [PubMed] [Google Scholar]
- Wan H., Aarsvold J., O’Donnell M., and Cain C. A., “Ultrasound surgery: Comparison of strategies using phased array systems,” IEEE Trans. Ultrason 43(6), 1085–1097 (1996). 10.1109/58.542052 [DOI] [Google Scholar]
- Vyas U. and Christensen D., “Ultrasound beam propagation using the hybrid angular spectrum method,” Proceedings of the 30th Annual International Conference of the IEEE Engineering in Medicine and Biology Society, 2526–2529 (2008). [DOI] [PubMed]
- Mahoney K., Fjield T., McDannold N., Clement G. T., and Hynynen K., “Comparison of modelled and observed in vivo temperature elevations induced by focused ultrasound: Implications for treatment planning,” Phys. Med. Biol. 46, 1785–1798 (2001). 10.1088/0031-9155/46/7/304 [DOI] [PubMed] [Google Scholar]
- Pennes H., “Analysis of tissue and arterial blood temperatures in the resting human forearm,” Appl. Physiol. 1(2), 93–122 (1948). [DOI] [PubMed] [Google Scholar]
- Sapareto S. A. and Dewey W. C., “Thermal dose determination in cancer therapy,” Int. J. Radiat. Oncol., Biol., Phys. 10(6), 787–800 (1984). 10.1016/0360-3016(84)90379-1 [DOI] [PubMed] [Google Scholar]
- De Poorter J., De Wagter C., De Deene Y. and Thomsen C., “The proton resonance frequency shift method compared with molecular diffusion for quantitative measurement of two-dimensional time-dependent temperature distribution in a phantom,” J. Magn. Reson. Series B 103, 234241 (1994). 10.1006/jmrb.1994.1035 [DOI] [Google Scholar]
- Rieke V., Vigen K. K., Sommer F. G., Daniel B. L., Pauly J. M. and Butts K., “Referenceless PRF shift thermometry,” Magn. Reson. Med. 51(6), 1223–1231 (2004). 10.1002/mrm.v51:6 [DOI] [PubMed] [Google Scholar]
- Todd N., Vyas U., de Bever J., Payne A., and Parker D. L., “The effects of spatial sampling choices on MR temperature measurements,” Magn. Reson. Med. 65(2), 515–521 (2011). 10.1002/mrm.22636 [DOI] [PMC free article] [PubMed] [Google Scholar]
- Wu F., Wang Z. B., Zhu H., Chen W. Z., Zou J. Z., Bai J., Li K. Q., Jin C. B., Xie F. L., and Su H. B., “Extracorporeal high intensity focused ultrasound treatment for patients with breast cancer,” Breast Cancer Res. Treat. 92(1), 51–60 (2005). 10.1007/s10549-004-5778-7 [DOI] [PubMed] [Google Scholar]
- Salomir R., Palussiere J., Vimeux F. C., de Zwart J. A., Quesson B., Gauchet M., Lelong P., Pergrale J., Grenier N., and Moonen C. T., “Local hyperthermia with MR-guided focused ultrasound: spiral trajectory of the focal point optimized for temperature uniformity in the target region,” J. Magn. Reson. Imaging 12(4), 571–583 (2000). [DOI] [PubMed] [Google Scholar]
- Madsen E. L., Zagzebski J. A., and Frank G. R., “Oil-in-gelatin dispersions for use as ultrasonically tissue-mimicking materials,” Ultrasound Med. Biol. 8(3), 277–287 (1982). 10.1016/0301-5629(82)90034-5 [DOI] [PubMed] [Google Scholar]


