Abstract
While temperature mapping is desired during cryosurgery for prostate cancer treatment, an effective approach for this purpose is still needed. We have demonstrated a phase shift with temperature in our in-vivo canine experiments and ex-vivo tissue sample experiments within the frozen tissue. The phase shift is much larger (~0.7 degree/°C with an echo time (TE) of 0.1 ms at 0.5T) in magnitude than that predicted by conventional proton resonant frequency shift (0.008 degree/°C). It shows little dependence on the TEs of used and thus is not due to a frequency change, though frequency dependent phase shift has been observed near the frozen tissue. This phase shift varies monotonically with temperature within the frozen tissue, and therefore may be potentially used as a novel temperature mapping approach in cryoablation applications.
Keywords: temperature monitoring, cryoablation, phase shift, ultra short TE imaging, intervention
INTRODUCTION
MR-guided cryosurgery is a promising minimally invasive treatment for localized prostate cancer (1). For an effective treatment, a sufficiently low temperature (e.g., <−40°C) is often required throughout the tumor for tissue destruction, while a warm enough temperature is maintained in the surrounding tissues to avoid complications (2, 3). In liver and kidney, it is relatively easy to produce the desired isotherm empirically at a distance (e.g. 1cm) beyond the tumor to ensure tumor destruction by monitoring the boundary of the iceball (4). However, due to the proximity of the rectum and urethra, temperature monitoring is of critical importance for prostate cryosurgery, as strongly advised by the American Urology Association (5). Currently, temperature monitoring in cryosurgery is often achieved by the placement of temperature sensitive probes in the region of interest. However, this procedure is invasive and time-consuming, and only provides temperature information at several discrete locations accessible to the thermal probes. Estimating temperature elsewhere based on simplified tissue properties can be problematic near large vessels and in heterogeneous tissues. Non-invasive approaches to map temperature throughout the frozen tissue region are therefore desirable, especially in patients at advanced stages of disease and in patients undergoing salvage cryosurgery where the risk of serious complications is high.
Previous work has found that MR parameters such as relative signal intensity (SI) and R2* are sensitive to temperature changes and could be used for MR thermometry (6,7). Relative signal intensity (SI) obtained using a spoiled gradient echo (SPGR) sequence decreases monotonically with decreasing temperature in frozen tissue. Using a calibration curve, temperature maps can be calculated. This approach only requires one acquisition at each temperature sampling point and can be achieved with high signal-to-noise ratio (SNR). However, the relative SI is a complicated function of other parameters such as the longitudinal relaxation time (T1) of the tissue, temperature, echo time (TE), repetition time (TR), flip angle, coil sensitivity, and so on. Therefore, care must be taken to maintain all these parameters the same as those used for the calibration curve to use this method. This is difficult in practice. For example, prostate gland swelling between the first and second freeze changes the relative spatial location of the tissue to the surface coil, and consequently changes the receive sensitivity seen by the tissue. R2* has been demonstrated to increase with decreasing temperature in frozen tissue and to be independent of these parameters (6, 7). However, relating R2* to temperature requires multiple images collected at different TEs within the 0 – 1 ms range. This results in longer acquisition times that potentially introduce errors in temperature quantification when the temperature change is fast. In addition, the lower SNR of the later echoes also introduce additional uncertainty in the R2* calculation.
Another potential approach is MRI thermometry using the proton resonance frequency shift (PRF), which is widely used in heating applications (8, 9). As the proton resonant frequency decreases linearly with increasing temperature over a broad temperature range (10), the phase shift (Δϕ) of MR images collected with gradient recalled echo (GRE) pulse sequences can be related to temperature change (ΔT) by
| (1) |
where γ is the gyromagnetic ratio of proton, B0 is the magnetic field strength and TE is the echo time, α is the apparent PRF coefficient (~−0.01ppm/°C). The apparent PRF coefficient contains contributions from the changes in the electron screening constant and magnetic susceptibility. If a similar coefficient were extrapolated to the temperature range used in cryosurgery, echo times on the order of ~ 10ms would be required to achieve reasonable temperature sensitivity at 0.5T, leaving little MR signal in the frozen tissue.
In this paper, we demonstrate phase shifts at echo times of 0.1 ms that are significantly larger in magnitude than expected from the proton resonant frequency shift. A spoiled gradient recalled sequence (known as SPGR, FLASH, or T1-FFE) is used to investigate the phase variation during cryoablation experiments (11, 12). The sequence uses a half-pulse RF pulse for slice selective excitation to achieve ultra-short TEs and consequently sufficient signal in the frozen tissue even at very low temperature (9,10). Our ex vivo tissue sample experiments and in vivo canine experiments demonstrate that a local temperature-dependent phase shift is readily observable within the frozen tissue. The phase shift observed within the frozen tissue is significantly larger than that predicted by the conventional PRF effect. A frequency dependent phase shift has also been demonstrated in the tissue surrounding the frozen tissue.
MATERIALS AND METHODS
Ex vivo experiments
For the ex vivo experiments, freshly excised tissue samples of beef muscle were used. The size of the tissue was approximately 1.5 cm × 2.5 cm × 1 cm. Two MRI compatible gas-driven cryoablation probes (Galil Medical, Yokneam, Israel), each inserted into a drilled hole in the middle of a rectangular copper bar forming a freezing unit (FU), were placed on each side of the sample. The copper bars were used to increase the area in contact with the sample and thus improve the homogeneity of temperature distribution in the sample especially in the left-right direction as MR imaging was performed in the axial plane. The cryoablation system uses argon gas for cooling (as low as −187 °C) and helium for heating (as high as 67 °C). Four fiberoptic temperature sensors (LumaSense Technologies, Santa Clara, CA) were placed ~0.5 cm apart in the sample parallel to the cryoprobes for temperature monitoring. A short T2 phantom made of rubber band was placed on top of the coil in the same field of view as the tissue sample to serve as a phase reference for phase drift correction. The tissue sample was slowly frozen to −40°C.
In-vivo experiments
In-vivo canine experiments (n=4) were approved by the institutional animal care and use committee at Stanford University. Either two or three cryoprobes were inserted through the anterior abdominal wall into the prostate with MR guidance. For direct measurement of the temperature, two fiberoptic temperature sensors were placed medially in the prostate, each 7–8 mm away from the cryoprobes. MR imaging was performed in the coronal plane for the in vivo experiments.
Pulse sequence
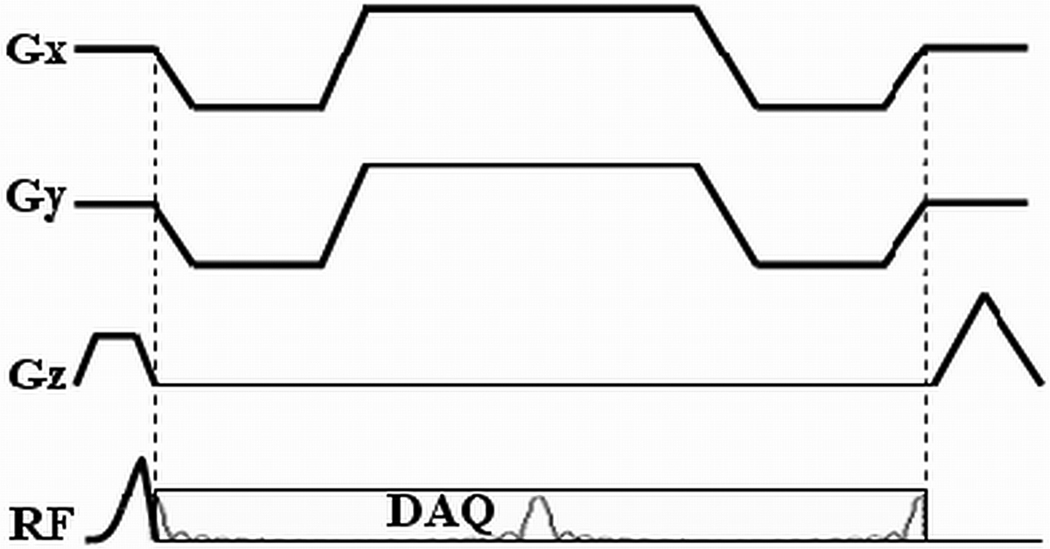
The pulse sequence used for in vivo experimentation is shown in Fig. 1. Half pulse RF excitation is employed in order to achieve slice selective excitation with ultra-short TEs (11). In this approach, two acquisitions are combined, the second with alternate slice selective gradient polarity. Data from the two acquisitions are then combined to generate images from the desired slice. Starting immediately after the RF pulse, four half-echoes are acquired in each TR with a multiple-echo radial readout gradient. Although only the first echo was used to investigate the phase shift, the multiple echo acquisition scheme was adopted to improve R2* mapping so that the same data could also be used to study R2* changes in frozen tissue. The TEs were adjusted to investigate their impact on the phase shift (13) and also for R2* mapping. Both B0 and linear eddy currents induced by the slice selective gradient are compensated by pulse sequence design to improve the slice profile (12).
Fig. 1.
Waveform of a four-half-echo radial acquisition sequence with slice-selective half-pulse RF pulse.
As no slice selection is required for ex vivo tissue sample imaging, the half pulse RF pulse is replaced by a standard non-selective constant RF pulse for excitation to avoid any potential effect due to imperfections of half pulse RF excitation, and to demonstrate the phase shift is not specific to half pulse RF pulse.
MR Imaging
MR imaging was performed on a 0.5T GE Signa scanner (GE healthcare, Milwaukee, WI) with a maximum gradient amplitude of 1.2 G/cm and a maximum slew rate 1.2 G/cm/ms. Given the performance of the gradient systems, the length of the half pulse RF pulse was designed to be 1.6 ms with Gaussian slice profile. The four-half-echo radial acquisition sequence was used for imaging with the following acquisition parameters: TR = 14 ms, flip angle = 30°, field of view = 32 cm, slice thickness = 7 mm, receiver bandwidth = 31.25 kHz, in-plane resolution = 1.25 mm. To study the effect of TE on the phase shift and to obtain R2*changes during freezing, four images were acquired with the echo times of the first echoes in the four-half-echo train being 0.1 ms, 0.4 ms, 0.7 ms and 1.0 ms at each temperature sampling point during the experiments. The total acquisition time for each R2* map was ~35 seconds, where 300 radial lines were sampled at each TE. The shortest TE for ex vivo imaging was 0.2 ms with a 200 µs non-selective RF pulse. Both a receive-only endorectal coil and a receive-only surface coil were used simultaneously for in vivo imaging while only the endorectal coil was used for the tissue sample experiment. The body coil was used for transmission in all experiments.
For image reconstruction, k-space data was first re-sampled onto Cartesian grids with both B0 and linearly eddy currents compensation (12), inverse Fourier transform was then used to generate the images.
Phase shift calculation
The polarity of the image phase was adjusted so that the relative phase evolutions of fat- and water-signals at different TEs agree with the chemical shift between them in the in vivo experiments (water resonance frequency water resonance frequency is ~70 Hz greater than that of fat at 0.5T). After adjusting for phase polarity, phase shift images were then obtained by subtracting the pre-freezing reference phase images acquired either at room temperature (ex-vivo experiments) or normal body temperature (in vivo experiments) from the phase images acquired during freezing. Therefore, the resultant phase shift in the frozen tissue corresponds to a negative temperature change. A constant phase drift correction was applied by subtracting the mean phase in a region not affected by the cryoablation procedure. Unless otherwise mentioned, the phase shift images were obtained from the images with the shortest TE, i.e., 0.1 ms, for the in vivo experiments.
To study the dependence of the phase shift on temperature, the locations of the temperature sensors were first estimated based on either the reduced signal intensity in the long TE images, or their relative locations to the cryoprobes. As the temperature sensors and their optical fibers do not contribute to MR signal, voxels containing the sensors have lower signal intensity. The average phase shift values were then obtained from 2×2 voxel regions that included the estimated sensors. To study the dependence of the phase shift on frequency, the phase difference between images collected at the same temperature point during the cryoablation experiment but with different TEs was also calculated.
R2* mapping
Images reconstructed from these relatively short TE intervals were designed to quantify short T2*. For better calculation of R2* for tissues with longer T2*, especially those surrounding the frozen region, images reconstructed from the 3rd echo were also used with a total of eight different TEs for the fitting. R2* maps were obtained by exponentially fitting the signals acquired at different TEs on a pixel-by-pixel basis (14).
RESULTS
Tissue sample experiments
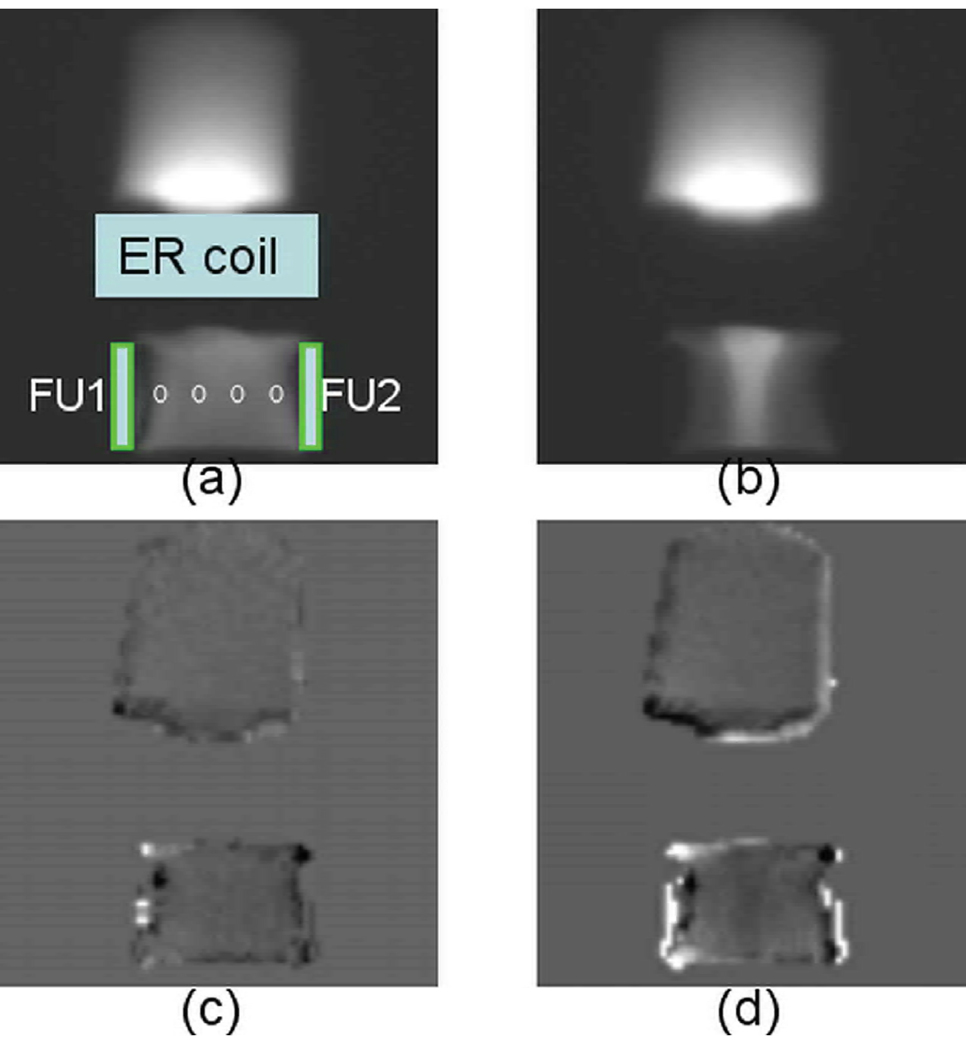
Fig. 2 demonstrates the axial magnitude (Fig. 2a and 2b) and phase (Fig. 2c and 2d) images in a tissue sample during the freezing experiment. The placement of the freezing units and the coils is also illustrated in Fig. 2a. Fig. 2a and 2c were acquired at the beginning of the freezing process, while Fig. 2b and 2d were acquired in the middle of the freezing process when the temperature sensor readings were −5.1°C, −1.3°C, −2.1°C and −5.2°C from left to right. These images were reconstructed from the first echo signal with a TE of 0.2 ms. The phase shift image was obtained by subtracting the phase during freezing from the reference phase image at room temperature. As can be seen in Figure 2b, sufficient signal was achieved in the frozen tissue (confirmed by the temperature readings from the temperature probes). The tissue in the middle of the sample demonstrated elevated signal intensity as compared to that at room temperature (Fig. 2a) due to the dependence of Boltzmann distribution and T1 on temperature. The phase shift image in Fig. 2c before tissue froze is relatively homogeneous in both the phantom and the tissue sample. In contrast, the localized phase shift in the frozen tissue (Fig. 2d) is readily visible and spatially correlates to the signal intensity change, while the phase shift remains relatively homogeneously in the unfrozen phantom. The frozen regions close to the frozen units show lower signal intensity and increased phase shift.
Fig. 2.
Representative magnitude images (a, b), the corresponding phase shift images (c, d) in a tissue sample experiment at the beginning when all temperature readings were ~20 °C and during the during freezing when the temperature sensor readings were −5.1°C, −1.3°C, −2.1°C and −5.2°C from left to right (circles). The placement of the RF coil, phantom and the freezing units (FU1 and FU2) is also demonstrated in (a). The signal intensity is arbitrarily scaled. The phase shift pattern closely matches that of the signal intensity change in the frozen tissue.
In vivo canine experiments
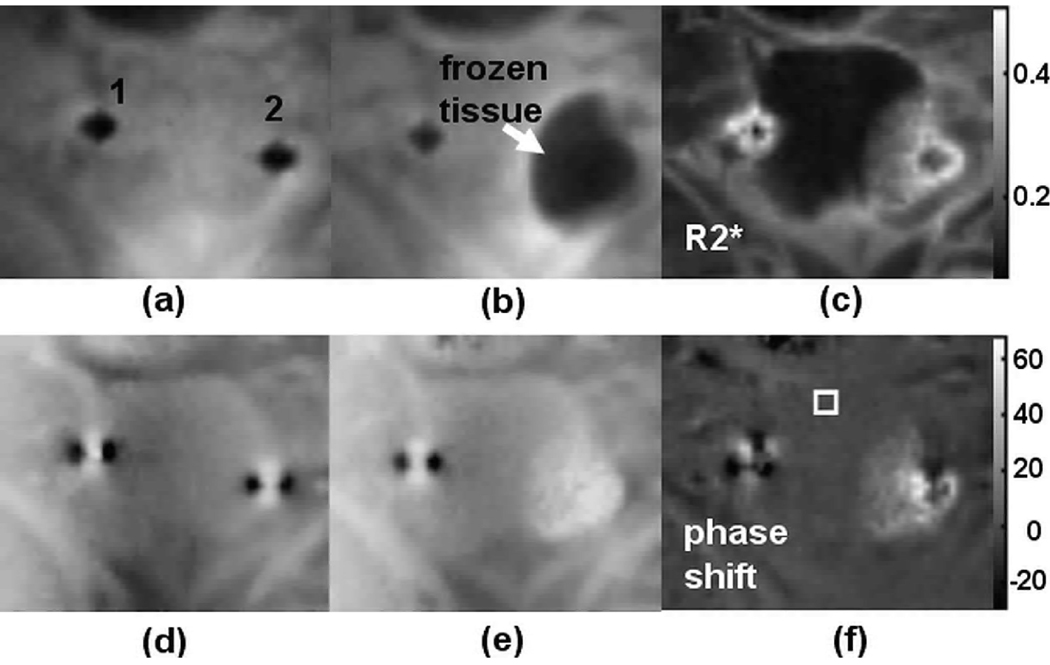
Fig. 3 shows representative magnitude, R2*, phase and phase difference images during the cryoablation experiment. Fig. 3a and 3b are the magnitude images at the beginning (reference images) and in the middle of the cryoablation experiment. The cryoprobes (labeled 1 and 2) are recognized as the signal voids in the reference magnitude image (Fig. 3a). The frozen region is well defined near the cryoprobe 2, as indicated by the arrow in Fig. 3b. The temperature reading of a sensor placed approximately 8 mm from cryoprobe 2 was −21.6°C. The R2* image (Fig. 3c) shows elevated R2* values in the frozen tissue. Localized phase variations are clearly seen in the frozen tissue with elevated phase values near the cryoprobe in Fig. 3e, which are bright in the corresponding phase shift image (Fig. 3f).
Fig. 3.
Representative cropped coronal images during an in vivo canine prostate cryoablation experiment (a) Reference magnitude image before freezing. The locations of the cryoprobes are labeled. (b) Magnitude image during freezing. The temperature reading of a sensor place ~8 mm from cryoprobe 2 was −21.6°C. The frozen tissue has lower signal intensity (arrow). (c) The R2* map corresponds to image (b). (d) Phase image corresponds to (a). (e) Phase image corresponds to (b). (f) Phase shift image obtained by subtracting (d) from (e) highlights the phase variation in the frozen tissue.
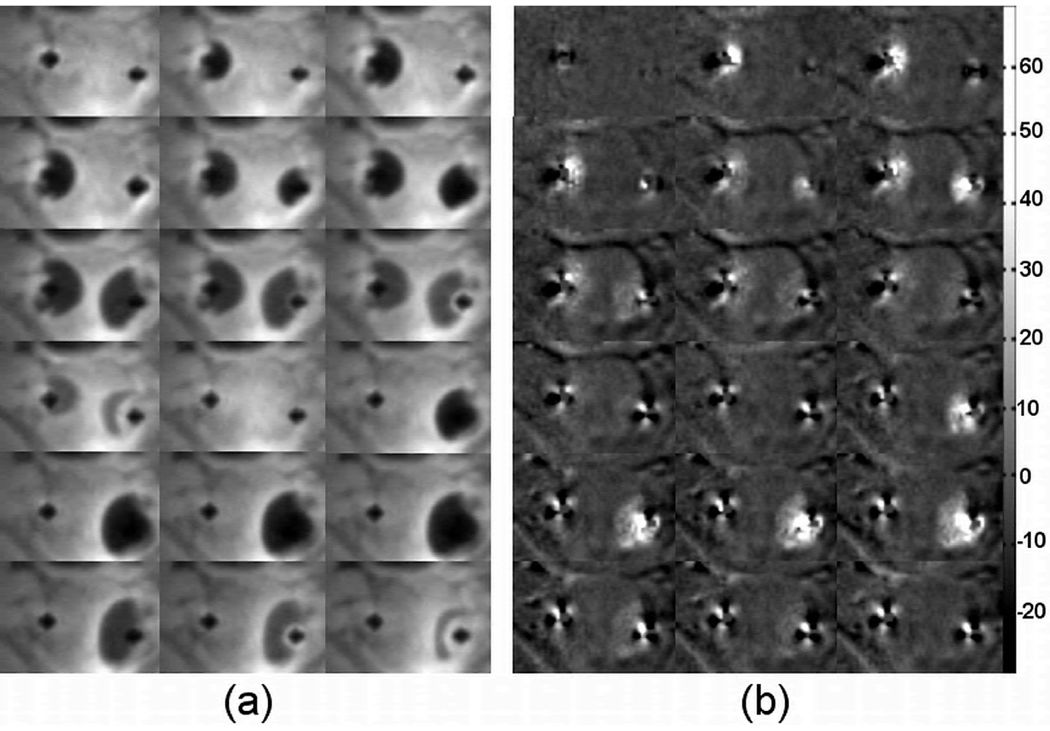
Fig. 4a shows a time series of magnitude images acquired during the same cryoablation experiment as Fig. 3. The corresponding phase shift images are shown in Fig 4b. The magnitude images show that left side of the prostate experienced one freeze-thaw cycle, while the right side experienced two freeze-thaw cycles. The phase shift images demonstrate the same freeze-thaw pattern and the phase changes within the frozen tissue are readily visible throughout the process with elevated phase shift values between −5°~30°.
Fig. 4.
A series of magnitude images (a) and the corresponding phase shift images during the same cryoablation experiment shown in Fig. 3. As can be clear see in the magnitude images, the left side of the prostate experience on freeze-thaw cycle, while the right side experience two. The same pattern is seen in the phase shift images. The colorbar shows the phase shift in degrees.
Dependence of phase shift on temperature
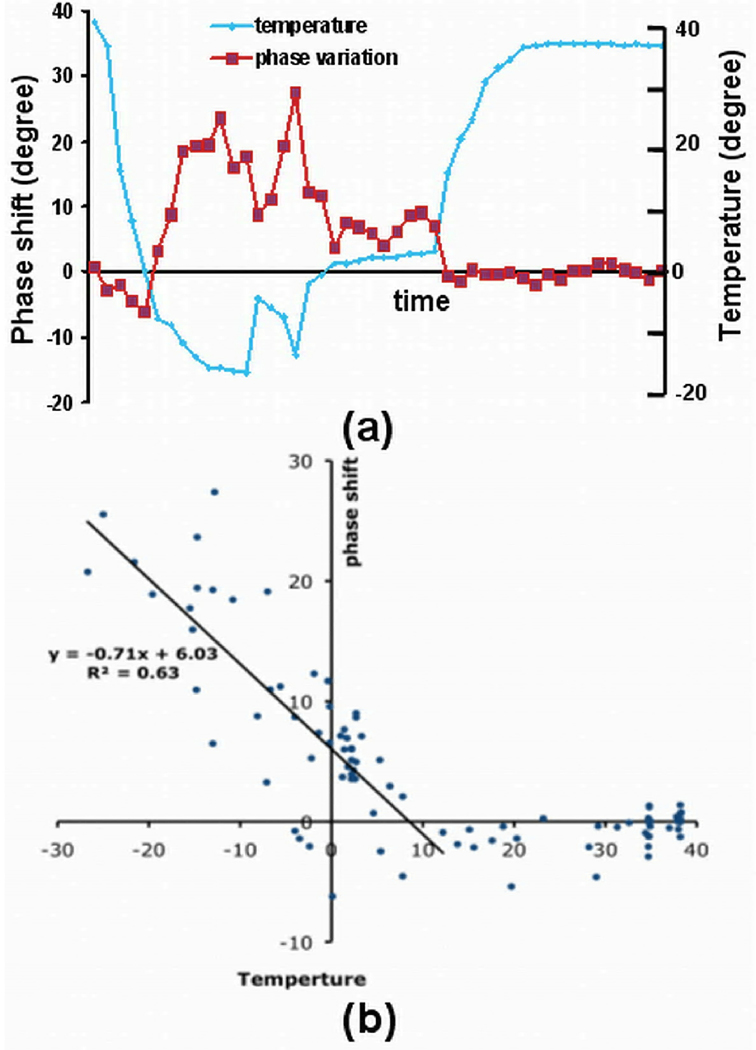
The correlation between the phase shift in the frozen tissue and temperature in the same experiment shown in Fig. 4 is demonstrated in Fig. 5. The phase shift over time in a 2×2 region of interest (ROI) near cryoprobe 1 is plotted in Fig. 5a, along with the corresponding temperature readings. The phase shift values are closely coupled to the temperature changes. In Fig. 5b, the phase shift values in two ROIs near the two cryoprobes are plotted against temperature, where two segments can be recognized. A linear relationship is shown in one segment where the phase variations increase from ~5° to ~30° when temperature recorded by the sensors decrease from ~10°C to ~−27°C. The slope of the linear fitting curve is ~−0.7 degree/°C. The phase shift is nearly constant in the other segment.
Fig. 5.
Plots show the relationship between phase shift (degree) and the corresponding readings (°C) from nearby temperature sensors in the same experiment as shown in Fig 4. (a) Phase shift and the corresponding readings from a nearby temperature sensor in a ROI near cryoprobe 1. (b) Phase shift were plotted against temperature in two ROIs near the two cryoprobes. A linear relationship is shown at low temperature.
Dependence of phase shift on TE
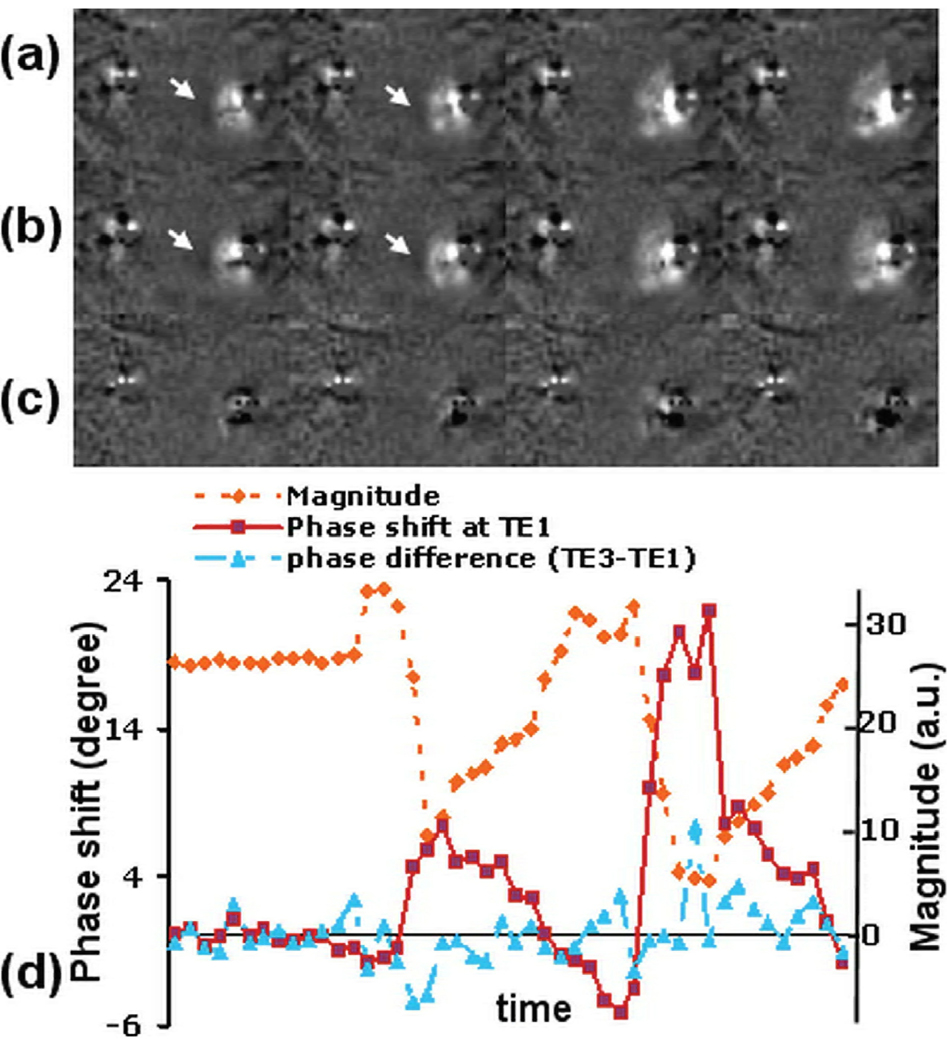
Representative phase shift images with TEs of 0.1 ms and 0.7 ms at four temperature points with temperature readings of −14.8°C, −19.6°C, −25°C, −26.7°C by the sensor near cryoprobe 2 from the same experiment shown Fig. 4 are shown in Fig. 6a and 6b, respectively. The corresponding phase difference images are shown in Fig. 6c. All these images have the same window level. Phase shift variations in the frozen region in Fig. 6a and 6b are apparent and similar in pattern and magnitude. As indicated by the arrows, regions with decreased phase shift values are seen near the frozen tissues. This is likely due to the susceptibility effect as will be shown later. However, no phase variation pattern is visible in the phase difference images (Fig. 6c) except artifacts from the cryoprobes.
Fig. 6.
Images and plots demonstrate that TE has little impact on the observed phase shift. (a) Phase shift images at TE1 = 0.1 ms. (b) Phase shift images at TE3 = 0.7 ms. (c) Difference between (a) and (b). (d) The dotted line show the phase shift changes in a 2×2 ROI. The corresponding signal intensity is also plotted in arbitrarily scale. The solid line is the phase shift in the same ROI at TE1, which shows change closely correlates to the signal intensity change. The dash-doted line shows the phase difference in the ROI between TE3 and TE1.
The phase variations in a 2×2 ROI near cryoprobe 2 in the experiment shown in Fig. 4, and the corresponding phase differences at two different TEs (0.7 ms and 0.1ms), are shown in Fig. 6d. The signal intensity in the same ROI is also plotted as a reference of temperature change. The region experienced two freeze-thaw cycles, as can be seen from the signal intensity change curve. Again while the phase shift tightly coupled to the magnitude change, little correlation is seen between the phase difference at the two TEs and the signal intensity.
Phase shift vs. signal intensity
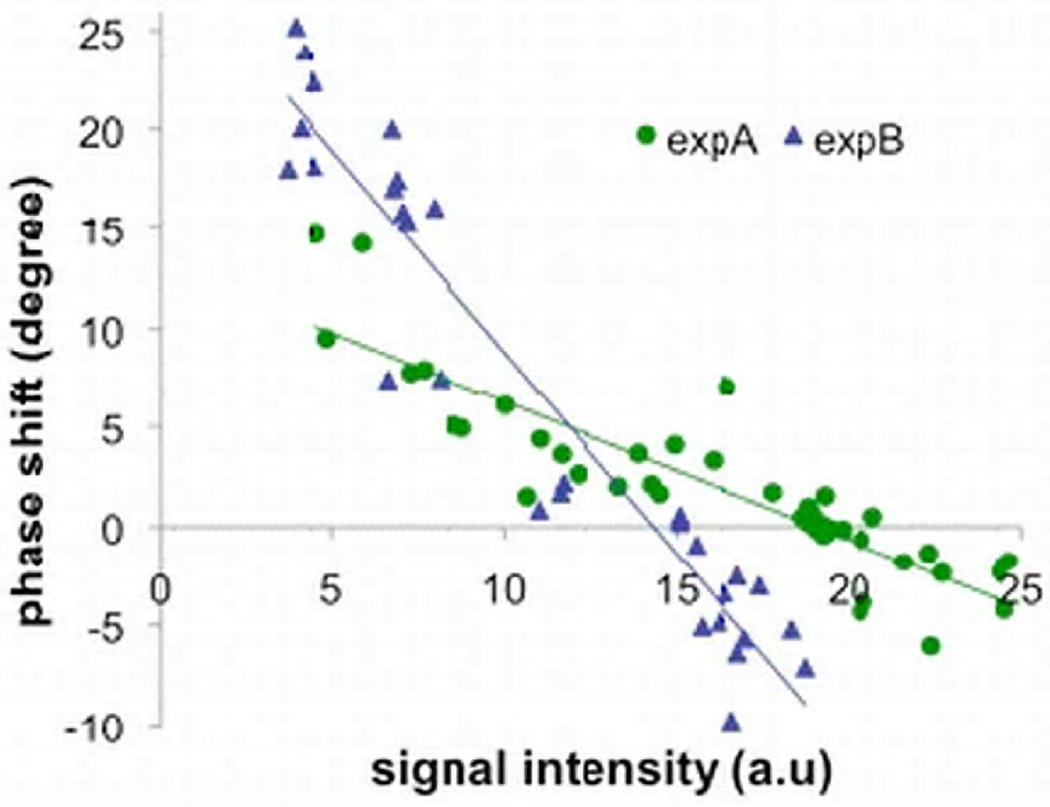
In Fig. 7, the phase shift from two different in vivo experiments was plotted against the corresponding signal intensities near the cryoprobes. The readings of the nearby temperature sensors ranged from −24.0°C to 38.3°C. In each experiment, a nearly linear relationship is seen between the phase shift and the signal intensity. The trend lines from the two experiments show different slopes as the signal intensities were scaled differently and were also affected by other factors such as coil sensitivity. As the signal intensity decrease monotonically with decrease in temperature in frozen tissues, The correlation between the observed phase shift and the signal intensity demonstrate indirectly that the phase shift are temperature dependent while avoiding the possible mismatch between locations of the phase shift measured and the temperature probes.
Fig. 7.
The phase shift was plotted against the corresponding signal intensity in the same ROIs near the cryoprobes in two different in vivo cryoablation experiments (expA and expB). The temperatures readings near these ROIs ranged from −24.0°C to 38.3°C. The signal intensities have arbitrary unit.
Phase shift in the tissues surrounding the frozen tissue
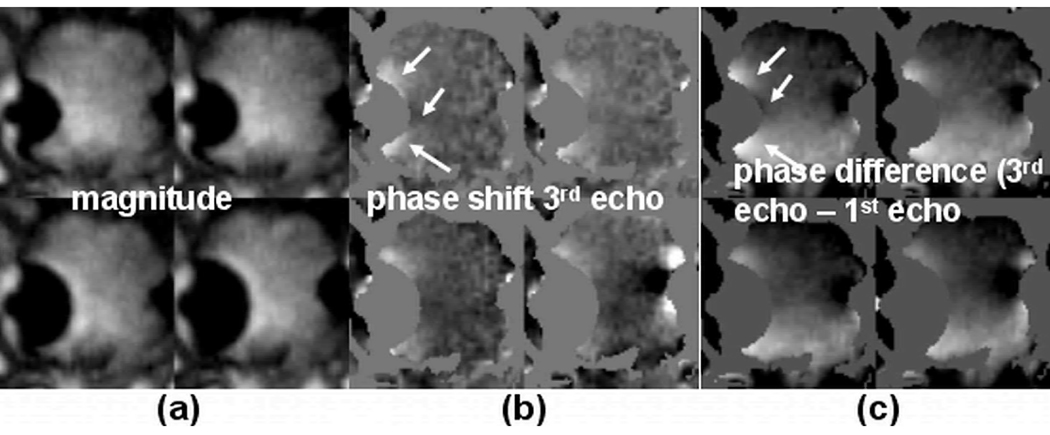
In Figure 8, images are shown to relate the phase shift to the frequency change within the frozen tissue as a result of increased susceptibility and/or temperature induced proton frequency shift. Fig. 8a and 8b show representative magnitude and phase shift images obtained from the 3rd echo signals (TE= 5.7 ms) from an in vivo experiment. Fig. 8c shows the phase difference between images reconstructed from the 3rd echo and the 1st echo (3rd echo phase −1st echo phase, ΔTE = 5.6ms). The magnitude images were used to generate masks in order to highlight phase changes outside the frozen tissue. Despite a global phase variation in Fig. 8c across the field of view likely due to imperfect shimming, local phase variations that are both temperature and frequency dependent (TE-dependent) are clearly visualized in Fig. 8b and 8c and near the frozen tissues. These phase variations are mainly due to the susceptibility difference between the frozen tissues and the surrounding tissues (15), as characterized by the phase variation pattern where both positive and negative phase shift regions are seen (arrows).
Fig. 8.
Representative images from an in vivo experiment show frequency-dependent phase shift in tissue near the iceball. (a) Magnitude images showing the iceballs at four different time points. These images were used to generate masks to remove the iceball regions in the phase images. (b) Corresponding phase shift images obtained from the 3rd echo signals (TE = 5.7ms). (c) Phase difference between the 3rd echo and the 1st echo (ΔTE = 5.6ms). Phase variations near the iceball are clearly visualized and have similar patterns in both (b) and (c) as indicated by the arrows. The phase shift in the location indicated by the top arrow in (b) is ~20°.
DISCUSSION
We have shown that localized phase shift within the frozen tissue is readily visible in both ex vivo and in vivo cryoablation experiments. The correlation between the observed phase shift and the signal intensity at the same location is also demonstrated. As the signal intensity decrease monotonically with decrease in temperature in frozen tissues, this shows indirectly that the phase shift correlates to temperature.
Directly relating the phase shift to temperature is desired but has been hampered by the difficulty in finding the locations of the temperature sensors accurately in vivo. The sensor locations were estimated based on reduced signal intensity and the relative displacements of the sensors to the cryoprobes. The exact locations were barely visible in the images with the current spatial resolution. Also, although care was taken to place the sensors in the imaging plane, this may not always be the case, especially when even slight motion is involved. Nevertheless, the temperature readings provide an estimation of the temperature in the regions where the phase shifts were investigated. A linear relationship is seen in Fig. 5b between the phase shift and the temperature at the temperature range of interest, where the phase shift increases with decreasing temperature. With a slope of ~−0.7°/°C as shown, the phase shift is fairly sensitive to temperature, and could potentially be used to derive temperature in cryoablation experiments.
The experiments were performed on an interventional MRI scanner at 0.5 T with relatively low gradient performance. Use of higher field strength scanners should allow better image quality, and/or higher temporal and spatial resolutions to be achieved. These improvements can potentially enable us to resolve the location of the temperature sensors and thus the phase shift can be related to the temperature change more accurately. The use of a higher field strength scanner may also increase the sensitivity of the observed phase shift to temperature depending on the origin of the phase shift.
Similar to the PRF method where a baseline reference phase image is required, the calculation of the phase shift is also sensitive to subject motion. As can be seen in Fig 4b, image misalignment caused by motion results in dark rings at the edge of the prostate in several images since the phases of prostate and the fatty tissue surrounding it are very different. Fortunately, the baseline phase within the prostate is relatively homogeneous; therefore the impact of motion on calculating the phase shift is expected to be small when subject motion is mild. The impact of rigid body in-plane motion can potentially be corrected for using image registration before the phase calculation. Only constant phase drift correction has been applied in this work. However, it is well known that there are also linear and non-linear phase drifts during long experiments (8, 9). Therefore, correcting for these phase drifts using methods such as that proposed by Barkauskas et al. (16) could also potentially improve the proposed phase shift measurement.
Historically cryosurgery has centered on the critical temperature that is required to effectively destroy the tumor cells. Though controversial still remains, it has been suggested that satisfactory tissue ablation can be achieved with a target temperature of −40 to −50°C in various tissues (3). However, other factors such as cooling rate, duration of the freezing and repetition of the freezing cycle have also been reported to influence cryosurgical outcome. The observed phase-temperature correlation reported in this research can potentially be used to generate temperature maps to ensure the target temperature are reached in the cancer while a warm temperature is maintained in the surrounding structures at every time point. The other factors that influence the cryosurgical outcome can either be directly obtained or derived from the temperature maps and incorporated to generate a tool to visualize regions where tissues are killed, similar to MRI-guided laser and focused ultrasound ablations (17).
The underlying mechanism that introduces the phase shift is still not clear. Phase shift dependent on TE has been observed near the frozen tissue as a result of increased susceptibility and/or temperature induced frequency shift in Fig. 8. Similar effect has also been demonstrated in (15) in a tissue sample. However, as shown in Fig. 6, despite the TE difference of 0.6 ms being much larger than the shortest TE (0.1 ms) used to obtain readily visible phase shifts within the frozen tissue, little frequency-dependent/TE-dependent phase shift is observed in the frozen tissues. Although the relatively low signal-to-noise ratio potentially reduced the sensitivity of the phase shift measurement to frequency change, the plots in Fig.6d show that while the phase shift within the frozen tissue tightly coupled to the magnitude change at different signal levels, little correlation is seen between the phase difference at the two TEs and the signal intensity. This indicates that the proton resonant frequency shift did not contribute significantly to the observed phase shift change in the frozen tissue at the echo times used. A phase shift that is independent of echo time has been demonstrated as a result of changes in tissue conductivity and dielectric properties with temperature (13). However, the effect here is seen within a relative small frozen region, while a large heating region was necessary to demonstrate the phase offset variation in Ref. 13. Since the dielectric properties such as permittivity of tissues change dramatically before and after freeze, it is possible that these changes contribute to the observed phase shift in frozen tissue (18). Further study is needed to identify the source(s).
CONCLUSIONS
We have demonstrated a significant temperature dependent phase shift in both tissue samples and in vivo canine prostate cryosurgery experiments within the frozen region. A frequency dependent phase shift has also been observed surrounding the frozen tissue. The phase shift localized in the frozen region demonstrates a linear relationship with temperature in the temperature range of interest for cryosurgery. Further study of this phenomenon is warranted to exploit its potential application for temperature mapping during cryosurgery.
Acknowledgments
This work was supported in part by NIH CA092061, P41 RR009784.
REFERENCE
- 1.Onik G. The male lumpectomy: rationale for a cancer targeted approach for prostate cryoablation. A review. Technol Cancer Res Treat. 2004;3:365–370. doi: 10.1177/153303460400300406. [DOI] [PubMed] [Google Scholar]
- 2.Wong WS, Chinn DO, Chinn M, Chinn J, Tom WL, Tom WL. Cryosurgery as a treatment for prostate carcinoma: results and complications. Cancer. 1997;79:963–974. [PubMed] [Google Scholar]
- 3.Gage AA, Baust JM, Baust JG. Experimental cryosurgery investigations in vivo. Cryobiology. 2009;59:229–243. doi: 10.1016/j.cryobiol.2009.10.001. [DOI] [PMC free article] [PubMed] [Google Scholar]
- 4.Sheen AJ, Poston GJ, Sherlock DJ. Cryotherapeutic ablation of liver tumours. Br J Surg. 2002;89:1396–1401. doi: 10.1046/j.1365-2168.2002.02292.x. [DOI] [PubMed] [Google Scholar]
- 5.Babaian RJ, Donnelly B, Bahn D, Baust JG, Dineen M, Ellis D, Katz A, Pisters I, Rukstalis D, Shinohara K, Thrasher JB. Best pratice policy statement on dryosurgery for the treatment of localized prostate cancer. J Urol. 2008;180:1993–2004. doi: 10.1016/j.juro.2008.07.108. [DOI] [PubMed] [Google Scholar]
- 6.Wansapura JP, Daniel BL, Vigen KK, Butts K. In vivo MR thermometry of frozen tissue using R2* and signal intensity. Acad Radiology. 2005;12:1080–1084. doi: 10.1016/j.acra.2005.06.006. [DOI] [PubMed] [Google Scholar]
- 7.Kaye EA, Josan S, Lu A, Rosenberg J, Daniel BL, Pauly KB. Consistency of signal intensity and T2* in frozen ex vivo heart muscle, kidney, and liver tissue. J Magn Reson Imaging. 2010;31:719–724. doi: 10.1002/jmri.22029. [DOI] [PMC free article] [PubMed] [Google Scholar]
- 8.Ishihara Y, Calderon A, Watanabe H, Okamoto K, Suzuki Y, Kuroda K, Suzuki Y. A precise and fast temperature mapping using water proton chemical shift. Magn Reson Med. 1995;34:814–823. doi: 10.1002/mrm.1910340606. [DOI] [PubMed] [Google Scholar]
- 9.De Poorter J, De Wagter C, De Deene Y, Thomsen C, Stahlberg F, Achten E. The proton-resonance-frequency-shift method compared with molecular diffusion for quantitative measurement of two-dimensional time-dependent temperature distribution in a phantom. J Magn Reson. 1994;103:234–241. [Google Scholar]
- 10.Hindman JC. Proton Resonance Shift of Water in the Gas and Liquid States. J Chem Phys. 1966;44:4582–4592. [Google Scholar]
- 11.Pauly JM, Conolly S, Macovski A. Slice-selective excitation for very short T2 species. Proceedings of the 8th annual Meeting of SMRM; 1989; Amsterdam. p. 28. [Google Scholar]
- 12.Lu A, Daniel BL, Pauly JM, Pauly KB. Improved slice selection for R2* mapping during cryoablation with eddy current compensation. J Magn Reson Imaging. 2008;28:190–198. doi: 10.1002/jmri.21396. [DOI] [PMC free article] [PubMed] [Google Scholar]
- 13.Peters RD, Henkelman RM. Proton-resonance frequency shift MR thermometry is affected by changes in the electrical conductivity of tissue. Magn Reson Med. 2000;43:62–71. doi: 10.1002/(sici)1522-2594(200001)43:1<62::aid-mrm8>3.0.co;2-1. [DOI] [PubMed] [Google Scholar]
- 14.Press WH, Teukosky SA, Vetterling WT, Flannery BP. Numerical recipes: the art of scientific computing. Cambridge University Press; 2007. [Google Scholar]
- 15.Kickhefel A, Salomir R, Roland J, Gross P, Schick F, Weiss CR. Temperature measurement nearby an iceball using the proton resonance frequency shift method: recalculation of the susceptibility artifacts. Proceedings of the Joint Annual Meeting ISMRM-ESMRMB; 2010; Stockholm. p. 250. [Google Scholar]
- 16.Barkauskas KJ, Lewin JS, Duerk JL. Variation correction algorithm: analysis of phase suppression and thermal profile fidelity for proton frequency magnetic resonance thermometry at 0.2 T. J Magn Reson Imaging. 2003;17:227–240. doi: 10.1002/jmri.10239. [DOI] [PubMed] [Google Scholar]
- 17.Jolesz FA, Talos IF. MRI-Guided Thermal therapy for brain tumors. In: Proctor MR, Black PM, editors. Minimally invasive neurosurgery. NJ: Humana Press Inc.; 2005. pp. 261–268. [Google Scholar]
- 18.Kyber J, Hansgen J, Pliquett F. Dielectric properties of biological tissue at low temperatures demonstrated on fatty tissue. Physics in Medicine and Biology. 1992;37:1675. doi: 10.1088/0031-9155/37/8/004. [DOI] [PubMed] [Google Scholar]


