

Abstract
Rationale
Induction of the fetal hypertrophic marker gene beta-myosin heavy chain (β-MyHC) is a signature feature of pressure overload hypertrophy in rodents. β-MyHC is assumed present in all or most enlarged myocytes.
Objective
To quantify the number and size of myocytes expressing endogenous β-MyHC using a flow cytometry approach.
Methods and Results
Myocytes were isolated from the LV of male C57Bl/6J mice after transverse aortic constriction (TAC), and the fraction of cells expressing endogenous β-MyHC was quantified by flow cytometry on 10,000–20,000 myocytes, using a validated β-MyHC antibody. Side scatter by flow cytometry in the same cells was validated as an index of myocyte size. β-MyHC-positive myocytes were 3±1% of myocytes in control hearts (n=12), increasing to 25±10% at 3d-6w after TAC (n=24, p<0.01). β-MyHC-positive myocytes did not enlarge with TAC, and were smaller at all times than myocytes without β-MyHC (~70% as large, p<0.001). β-MyHC-positive myocytes arose by addition of β-MyHC to α-MyHC, and had more total MyHC after TAC than did the hypertrophied myocytes that had α-MyHC only. Myocytes positive for β-MyHC were found in discrete regions of the LV, in 3 patterns, peri-vascular, in areas with fibrosis, and in apparently normal myocardium.
Conclusion
β-MyHC protein is induced by pressure overload in a minor sub-population of smaller cardiac myocytes. The hypertrophied myocytes after TAC have α-MyHC only. These data challenge the current paradigm of the fetal hypertrophic gene program, and identify a new sub-population of smaller working ventricular myocytes with more myosin.
Keywords: beta-myosin heavy chain, cardiac hypertrophy, fetal genes, flow cytometry, pressure overload
INTRODUCTION
In 1979, Lompre et al. described the appearance in rat cardiac overload of a V3 myosin isoenzyme with reduced ATPase activity and slower mobility on non-denaturing gels.1 V3 myosin contains β-myosin heavy chain (β-MyHC), whereas the normal adult V1 myosin with higher ATPase activity contains α-MyHC, and protein changes are caused by changes in the mRNAs.2–4 In rats and mice, β-MyHC mRNA and protein are induced reliably by disease-related hypertrophic stimuli in vivo and by hypertrophic agonists in culture,3–5 but not by physiological stimuli such as exercise training.6 Thus β-MyHC has become the classical marker for pathological hypertrophy. Indeed, β-MyHC is emblematic of an entire “fetal gene program” that is normally low or absent in adult heart and myocytes and is induced in rodent models of pathological hypertrophy in vivo and in vitro, including skeletal α-actin, β-tropomyosin, ANF, and proto-oncogene such as myc, fos and jun.7–9
In the human ventricle, β-MyHC and skeletal α-actin are predominant normally,10,11 but the concept of fetal gene induction in human myocardial disease appears to be valid, as represented by up-regulation of ANF, MB creatine kinase, and atrial β-MyHC.12–14
If β-MyHC is indeed a valid marker for pathological cardiac myocyte hypertrophy, then 2 criteria would seem to follow. First, β-MyHC should be induced in most or all myocytes in a hypertrophied heart, and, second, the myocytes expressing β-MyHC should be hypertrophied, or larger in size. However, a few reports indicate that endogenous β-MyHC is expressed heterogeneously in the overloaded myocardium,15,16 a mean 30% of myocytes in one report,15 and the same can be true for other fetal genes.16–18 The most extensive study used a knockin reporter mouse with yellow fluorescent protein (YFP) fused to the N-terminus of β-MyHC (YFP-β-MyHC). This approach estimated that myocytes positive for YFP-β-MyHC were 38% of total myocytes after prolonged transverse aortic constriction (TAC); YFP-β-MyHC-expressing myocytes were in areas of fibrosis in several hypertrophy models, and were hypertrophied the same as myocytes that did not express β-MyHC.19–22
Here we sought to simultaneously quantify and size myocytes that expressed endogenous β-MyHC protein after TAC, using an unbiased approach that did not rely on a genetic marker, and that analyzed at least 10,000 cells per heart. To do this, we validated a flow cytometry technique, using standard instruments and a commercial monoclonal antibody (mAb) for β-MyHC. Using this approach, we found that β-MyHC is induced after TAC in a minor sub-population of smaller myocytes.
METHODS (details in online supplement)
Adult male C57Bl/6J mice (Jackson) age 11–12w had TAC by the Rockman method,23 sufficient to give a gradient after 3w of ~100mmHg by Doppler echocardiography.24 Control animals (CON) were sex- and age-matched littermates that were sham operated or had no surgery, since these 2 groups had identical β-MyHC protein expression.
Adult mouse and rabbit myocytes and nonmyocytes (NMCs) were isolated by perfusion with collagenase; and fetal and neonatal mouse myocytes, by digestion with collagenase. Neonatal rat ventricular myocytes (NRVMs) were isolated with trypsin and cultured in serum-free medium. Isolated cells were fixed in formalin and ethanol for flow cytometry or immunocytochemistry, or in formalin for volume assay by Coulter Multisizer. Live cells were used in Western blot.
Flow cytometry used 3 different standard bench top flow cytometers (FACScan, FACSCalibur, and LSRII) with a flow cell 430μm×180μm. Fixed cells were permeabilzed, blocked, and stained for DNA and with conjugated primary antibodies (Abs). Optimal titration of all reagents used the coexisting NMCs in each preparation as the in-tube negative control for myocyte-specific proteins, and the positive control for proliferation markers. Preliminary studies defined the Ab dilution that detected the maximum number of cells. At least 10,000 myocytes were assayed in each run, setting positive and negative gates by fluorescence of negative control cells stained with nonspecific mouse IgG. Data were analyzed using FlowJo software on Mac OSX.
The IgG mAbs included MF-20 mouse anti-sarcomeric MyHC (Developmental Studies Hybridoma Bank, DSHB); NOQ7.5.4D mouse anti-β-MyHC (Sigma); 13-11 mouse anti-troponin T (Lab Vision); mouse anti-α-MyHC (Clone BA-G5, Abcam); mouse anti-Ki67 (Clone B56, BD Pharmingen); and rat anti-CD45 conjugated to allophycocyanin (APC)-Cy7 (BD Pharmingen). Anti-phospho-histone H3 (H3P) serine 10 was a rabbit polyclonal IgG (Millipore). The mouse mAbs were labeled with Zenon (Invitrogen) conjugated to Alexa 488 (green), -546 (orange), -647 (red), or biotin streptavidin-APC-Alexa 780 (far red). For DNA synthesis, a flow cytometry kit quantified incorporation of the thymidine analogue ethynyl deoxyuridine (EdU).
For immunohistochemistry, the heart was arrested and fixed in diastole to cut 7μm frozen sections.
Results are mean ± SD. Significant differences (p<0.05) were tested in GraphPad Prism v5.0 using one-way ANOVA and Bonferroni’s multiple comparison or Newman-Keuls tests for more than two groups, or Student’s unpaired t-test for two groups. Linear regression tested for association between cell size by flow cytometry and Coulter Multisizer.
RESULTS
Flow cytometry of isolated adult mouse cardiac cells
Reliable analysis of myocytes expressing endogenous β-MyHC protein required a flow cytometry approach to phenotype large numbers of isolated adult mouse cardiac myocytes, and to measure cell size simultaneously. We avoided the usual problem of instrument clogging by attention to protocol details (Supplemental Methods), and were able to analyze 10,000–20,000 myocytes per run on any one of 3 different standard flow cytometers.
Figure 1A illustrates the approach. All small and large cells isolated from mouse LV were fixed and stained with propidium iodide (PI) or 7-Amino-actinomycin D (7-AAD) for DNA; with anti-CD-45 to label white blood cells (WBCs); and with MF-20 anti-sarcomeric myosin to label all myocytes. An aliquot of cells stained with isotype IgGs was the negative control to set the gates for fluorescent signals. As shown in Figure 1A left, we first eliminated debris by gating on nucleated cells with ≥ 2N DNA content, then gated nucleated cells for WBCs, myocytes, and NMCs, the last defined as cells that were negative for both CD-45 and MF-20 (Figure 1A middle).
Figure 1. Flow cytometry of single cells from adult mouse LV.
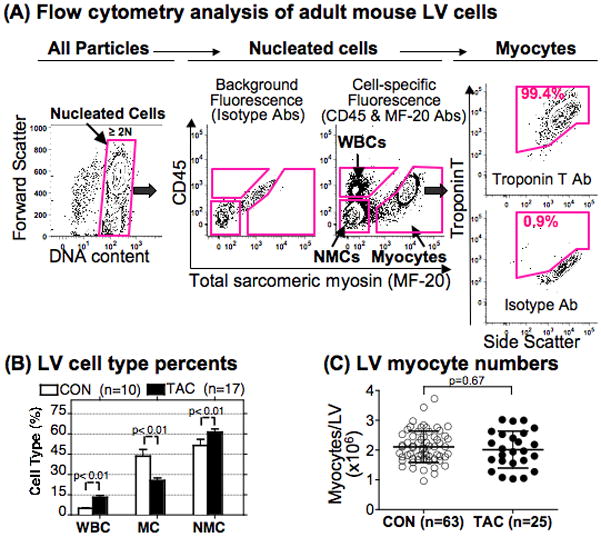
(A) Cells isolated from an adult mouse LV were fixed, stained, and analyzed by flow cytometry. Left panel, cells were first gated for DNA content to eliminate debris and identify nucleated cells (boxed area). Middle panel, left side, fluorescence of isotype Abs in the same cell population defined background. Middle panel, right side, cells were identified as WBCs by CD45, as myocytes by MF-20, or as NMCs negative for both proteins. Note that CD45-positive cells do not shift on the X axis, indicating absence of nonspecific binding of anti-myosin Ab. Right panel, myocytes positive for myosin by MF-20 were also positive for troponin T. The 10% contour plots include at least 10,000–20,000 nucleated myocytes, and outliers (small dots) represent <~2% of the cell population. Side scatter (right panel) is an index of cell size. Cell gates (pink) were set to include <1% positive cells when cells from the same LV were stained with isotype Ab.
(B) The fraction of different cell types in the LV was measured 1–3w after TAC or Sham control (CON). MC=myocyte, values are mean ± SD, p by 1-way ANOVA and Bonferroni’s post-test.
(C) Myocytes isolated from TAC and CON hearts were counted in a hemocytometer. Values are mean ± SD, p by Student-t test.
As an additional control for myocyte identification with MF-20, the cells in Figure 1 were also stained with anti-troponin T, and all cells positive for MF-20 were also positive for troponin T. In Figure 1A right, troponin reactivity is plotted against side scatter, a flow cytometry index of cell size, showing the broad size range of these cells.
We tested the flow cytometry approach using cells isolated from the LV at 1–3w after TAC or CON. TAC in these experiments was sufficient to cause dilated cardiomyopathy in C57Bl/6J mice,24 with a pressure gradient at 3w 110±18mmHg (n=4) (also see Online Figure III). As shown in Figure 1B, TAC caused a significant decrease in the fraction of LV cells that were myocytes (44±5% to 26±2%, p<0.01), and an increase in the fraction of WBCs (5±1% to 13±1%, p<0.01) and NMCs (52±5% to 61±2%, p<0.05), as expected from the inflammation and fibrosis in the model.24,25 The 40% relative decrease in myocytes as a fraction of total LV cells was a dilution effect caused by more WBCs and NMCs, and was not caused by myocyte loss.
As shown in Figure 1C, TAC did not change the absolute number of myocytes isolated per LV, by hemocytometer counts (in millions, CON 2.1±0.5, TAC 2.0±0.6, n=63-25, p=0.7). Approximately 40% of myocytes in both groups were rod-shaped (43±9% and 40±13%, p=0.4). Notably, the fraction of myocytes in the mouse LV is lower than estimated by microscopic counts,26 but similar to another flow cytometry analysis.27 As shown in Figure 2B below, the neonatal heart had a higher fraction of myocytes (66%), as also observed by others.27
Figure 2. Validation of β-MyHC antibody.
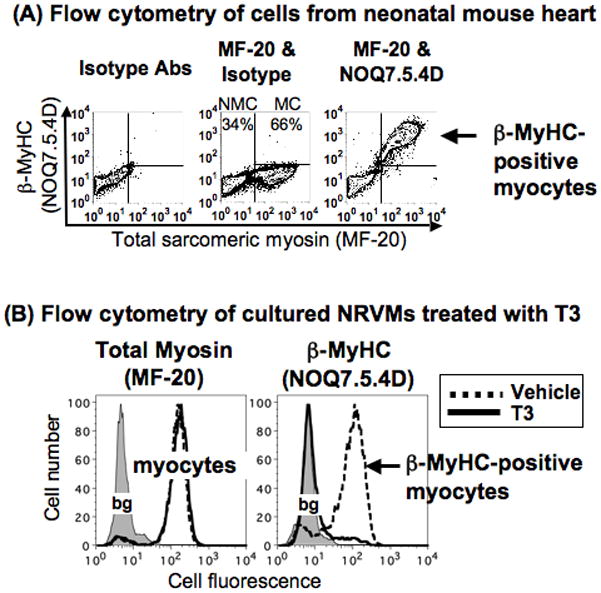
(A) Cells isolated from the neonatal mouse heart were stained with MF-20, NOQ7.5.4D, or isotype Ab controls, and analyzed by bivariate flow cytometry. Left panel, background defined by isotype Abs. Middle panel, MF-20 defines myocytes (MCs) (66% of cells) and NMCs (34% of cells). Right panel, almost all myocytes stain for β-MyHC with NOQ7.5.4D. At least 10,000–20,000 nucleated cells were analyzed for each heart, and 6 hearts from the same litter had similar results.
(B) Cultured NRVMs in serum-free medium were treated 3d with vehicle (dashed lines) or T3 (100nM, solid lines), removed from the dish, fixed, and stained for flow cytometry with (left panel) MF-20 for total sarcomeric myosin, or with (right panel) NOQ7.5.4D for β-MyHC. T3 eliminates cells with β-MyHC. Background fluorescence (bg, shaded area) was defined by isotype Abs, and each plot is from at least 10,000–20,000 nucleated cells, in n=2 cultures with the same result, run in duplicate.
We concluded that our flow cytometry approach could reproducibly phenotype large and equal numbers of myocytes from the mouse LV, before and after TAC.
Validation of a β-MyHC antibody
We screened 4 commercial mouse mAbs against the beta or slow MyHC isoform in striated muscle (NOQ7.5.4D from Sigma, N2.261 and A4.840 from the DSHB, and NCL-MHCs from Novacastra), testing their specificity in identifying cardiac β-MyHC. NOQ7.5.4D was the single mAb that satisfied 3 criteria. First, NOQ7.5.4D recognized known developmental and species differences. NOQ7.5.4D recognized that almost all newborn mouse heart myocytes, as defined by MF-20, expressed β-MyHC (Figure 2A), whereas most adult myocytes did not (Figure 3 below). NOQ7.5.4D also found 99%+ β-MyHC-positive myocytes in fetal mouse heart and adult rabbit heart (Online Figure II). Second, NOQ7.5.4D identified down-regulation of β-MyHC by triiodothyronine (T3) in cultured NRVMs, as expected (Figure 2B).28 Third, NOQ7.5.4D identified a band of appropriate size (~200kD) in adult TAC myocytes, by western blot of 400 myocytes. This band was absent in adult CON myocytes (Figure 3A).
Figure 3. TAC induces β-MyHC in 25% of adult mouse LV myocytes.
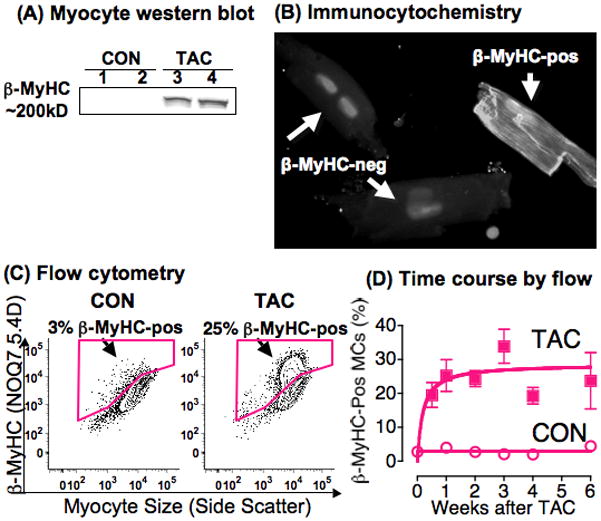
(A) Western blot for β-MyHC with NOQ7.5.4D in 400 isolated myocytes per lane from 2 Sham CON and 2 TAC LVs at 3w.
(B) Immunocytochemistry with NOQ7.5.4D in three isolated LV myocytes 3w after TAC; nuclei were stained with PI (original 40X).
(C) Flow cytometry of 10,000–20,000 myocytes positive for MF-20 from CON and TAC LVs at 3w, plotted as side scatter, a size index (X axis), versus staining for the β-MyHC mAb NOQ7.5.4D (Y axis). Percent β-MyHC-positive is the fraction positive for NOQ7.5.4D divided by the total MF-20-positive myocytes analyzed. Plots are 10% contours, with dots for outlier myocytes. Positive gates for NOQ7.5.4D were set by isotype staining of myocytes from the same heart (not shown), to include <1% positive cells above the isotype-stained population, and the same gate was then applied to the sample stained for β-MyHC, as illustrated in Figure 1A, right panel.
(D) The % β-MyHC-positive LV myocytes (MCs) was measured, as in panel C, at 3d to 6w after TAC, and in concurrent Sham CON. N=24 TAC, 12 Sham, p<0.01 for all CON vs. TAC by 1-way ANOVA and Bonferroni’s post-test; p=0.24 among times after TAC.
In summary, NOQ7.4.5D satisfied 3 criteria for specific recognition of cardiac β-MyHC, and was used in all subsequent experiments.
β-MyHC is induced in a minor sub-population of LV myocytes
As shown in Figure 3A, TAC caused a very robust induction of β-MyHC when assayed by western blot of 400 LV myocytes. This finding would typically be interpreted as β-MyHC induction in all 400 myocytes. However, Figure 3B shows by immunocytochemistry with the mAb NOQ7.5.4D that β-MyHC was present in a minority of myocytes. We used flow cytometry to quantify the fraction of myocytes that expressed β-MyHC.
LV myocytes were isolated from CON and TAC hearts at 3w, stained with PI for DNA, with CD-45 for WBCs, with MF-20 for myocytes, and with NOQ7.5.4D for β-MyHC, and analyzed by flow cytometry. Figure 3C shows a flow cytometry analysis of the total MF-20-positive myocyte population, similar to the right side of Figure 1A, with β-MyHC intensity on the Y-axis, and side scatter, a size index, on the X-axis. This CON heart had 3% of total MF-20-positive myocytes also positive for β-MyHC, whereas the TAC heart had 25% of myocytes positive (Figure 3C).
To test whether a higher fraction of myocytes expressed β-MyHC at times earlier or later than 3w, we isolated LV myocytes from TAC hearts and concurrent Sham CON at 3d to 6w after surgery. Figure 3D shows that the fraction of β-MyHC-positive myocytes was increased at 3d (20±8%, n=5), reached a maximum at 1w, and was stable for 6w, with overall 25±10% positive (n=24, p<0.0001 vs. Sham; p=0.24 for TAC %β-MyHC-positive over time). Sham CON hearts had 3±1% of myocytes positive for β-MyHC (n=12). The %-β-MyHC-positive myocytes was the same whether NOQ7.5.4D was labeled with Alexa-488 (green) or Alexa-647 (red) (data not shown).
We concluded that endogenous β-MyHC was present in 3% of CON myocytes, and was induced in only 25% of myocytes after TAC.
Validation of flow cytometry to quantify myocyte size
We wanted to use flow cytometry to quantify the size of the myocytes that did and did not express β-MyHC. The advantage of this strategy, compared with microscopic methods, would be a much larger sample size. To test whether myocyte side scatter by flow cytometry could be used to quantify size, we compared side scatter with myocyte volume from the Coulter Multisizer, a robust and validated assay.24,29 Forward side scatter gave results similar to side scatter (data not shown); however, since the optical geometry of forward scatter varies between instruments, side scatter using a log scale minimized variance from different cytometers, as shown by others.30
Figure 4A plots volume by Coulter, and side scatter by flow, versus cell number for LV and RV myocytes from a CON heart. Flow correctly identified that LV myocytes were larger than RV myocytes (left panels), and the correlation was excellent between the relative size of LV and RV myocytes detected by flow and by Coulter (Figure 4A, right). Similarly, as shown in Figure 4B, side scatter correctly identified the increased size of LV myocytes after TAC (left panels), and the correlation was excellent between relative size determined by the 2 assays (right panel). The relative size increase was somewhat compressed by the side scatter assay, as compared with Coulter, indicating that flow somewhat underestimated the cell size differences (right panels in Figures 4A and 4B).
Figure 4. Validation of flow cytometry side scatter for myocyte size.
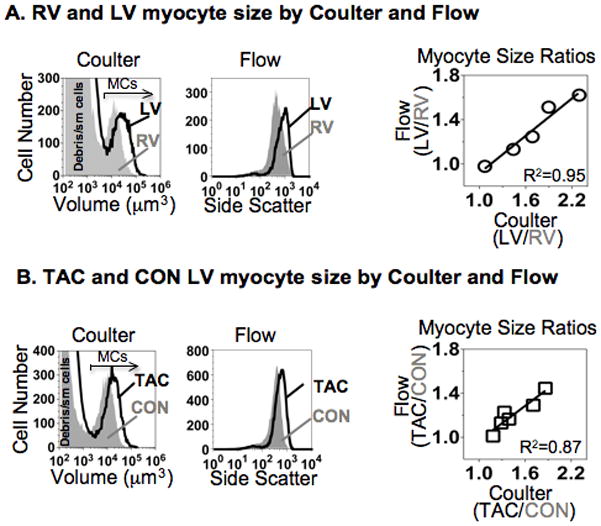
(A) Left panels, myocytes from LV (black line) and RV free wall (grey shade) of the same mouse heart were analyzed concurrently by Coulter Multisizer for cell volume, and by Flow Cytometry for side scatter. Arrow in Coulter panel shows the gate used to identify large myocytes (MCs; 10,000–20,000per ventricle). Flow panel depicts only the nucleated myocytes (MF-20-positive, 10,000–20,000 per ventricle), to eliminate debris and small (sm) nonmyocytes from size analysis. Note that a right-shift of the profiles indicates larger cell size. Right panel plots myocyte size ratios (LV/RV) determined by Flow mean side scatter vs. Coulter mean cell volume for myocytes from 5 adult mouse hearts. R2 by linear regression, p<0.01.
(B) Left panels, LV myocytes from a pair of TAC (black line) and CON (grey shade) hearts were analyzed concurrently both by Coulter cell volume and Flow side scatter, exactly as in A. Right panel plots myocyte size ratios (TAC/CON) determined by Flow vs. Coulter for 6 pairs of hearts. R2 by linear regression, p<0.01.
We concluded that we could use side scatter by flow cytometry as a surrogate for relative myocyte size.
β-MyHC-positive myocytes are smaller
We used side scatter to quantify the relative size of LV myocytes in the same heart that did and did not express β-MyHC. Figure 5A presents side scatter versus myocyte number profiles for 3 CON and 3 TAC hearts. In each case, β-MyHC protein and myocyte size were measured in the same cells from the same LV. Myocytes that express β-MyHC were barely detected in CON LV, but became readily apparent after TAC, and their size was clearly smaller relative to β-MyHC-negative myocytes from the same LV (Figure 5A).
Figure 5. β-MyHC-positive myocytes are smaller.
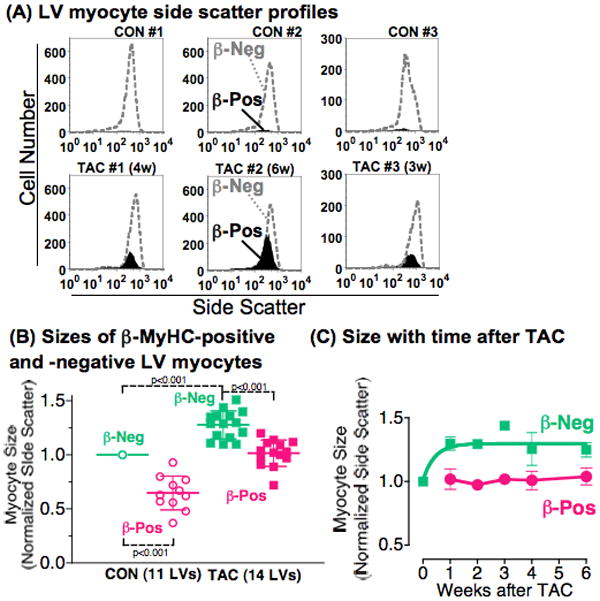
(A) LV myocytes (10,000–20,000) from 3 CON LVs (#1–3) and 3 TAC LVs at 3–6w (#1–3) were stained with MF-20 and the β-MyHC mAb NOQ7.5.4D, and side scatter profiles were determined by flow cytometry. β-MyHC-positive myocytes are solid black fill, β-MyHC-negative myocytes are grey dotted line. Note the left-shift to smaller sizes of β-MyHC-positive cells.
(B) Mean side scatter of β-MyHC-positive and -negative myocytes from the same LV was quantified as in panel A, for 11 CON and 14 mice at 1–6w after TAC. Pairs of TAC and CON LVs were assayed on the same cytometer on the same day, and side scatter of each sub-population was normalized to the mean side scatter of CON β-MyHC-negative myocytes, arbitrarily set at 1. In 1 assay, 3 TAC LVs were normalized to 1 CON LV. Each point is 1 LV. Lines indicate mean ± SD, p by 1-way ANOVA and Bonferroni’s post-test.
(C) Myocyte size was plotted versus time after TAC. Values are mean±SE; the number of LVs is 5, 2, 1, 3, and 3 at weeks 1, 2, 3, 4, and 6.
Figure 5B summarizes the relative size of β-MyHC-positive and β-MyHC-negative myocytes from 11 CON and 14 TAC LVs at 1–6w after banding. Mean side scatter for each LV myocyte sub-population was normalized to the side scatter of the CON β-MyHC-negative myocytes run in an identical manner on the same cytometer on the same day.
In CON LVs, the few β-MyHC-positive myocytes (3% of total myocytes) were only 65±16% as large as the majority β-MyHC-negative myocytes (p<0.001) (Figure 5B). In TAC LVs, there were now 25% β-MyHC-positive myocytes, and they were only 78±7% as large as the β-MyHC-negative myocytes (p<0.001).
Furthermore, the 75% of β-MyHC-negative myocytes were the only cells that enlarged after TAC. TAC myocytes negative for β-MyHC were 1.28±0.13-fold larger than the CON β-MyHC-negative cells (p<0.001), equivalent to a 1.59-fold increase in size by cell volume (by extrapolation from the regression equation in the validation experiment, Figure 4B right). β-MyHC-negative myocytes enlarged to a plateau over the first week after TAC (Figure 5C).
In marked contrast, the 25% of β-MyHC-positive myocytes in TAC LVs were the same size as the 97% of β-MyHC-negative cells in CON hearts (side scatter 1.02±0.12-fold, p=0.27; volume 1.10-fold by extrapolation from the regression in Figure 4B). β-MyHC-positive myocytes did not enlarge over the entire 6 weeks after TAC (Figure 5C). Therefore, β-MyHC was induced in smaller myocytes that did not enlarge with TAC.
In summary, LV myocytes that express endogenous β-MyHC were smaller than myocytes that do not express β-MyHC, both before and after TAC. Myocytes without β-MyHC, and therefore with α-MyHC only, were the myocytes that enlarged with TAC.
β-MyHC-positive myocytes are in discrete regions and areas of the LV after TAC
We used immunohistochemistry with the mAb NOQ7.5.4D to map the distribution of β-MyHC-expressing myocytes after TAC. The 3% of β-MyHC-positive cells in CON hearts were too few to localize precisely. β-MyHC expression after TAC was restricted to the LV, where it was most abundant in the base of the heart, and was less toward the apex, except for a small area of intense expression at the apex (not shown). As shown in Figures 6A/B, β-MyHC-positive cells in the base of the heart were notable around larger coronary arteries, and were infrequent in smaller vessels. Isolated clusters of β-MyHC-positive cells were also present in the LV septum close to the junction with the RV, and near the insertions of the mitral valve leaflets (Figure 6A). The tips of the papillary muscles had many β-MyHC-positive cells (not shown). Cells staining with the mAb NOQ7.5.4D had clear cross striations, confirming them as myocytes (Figure 6C).
Figure 6. β-MyHC positive myocytes by immunohistochemistry are in discreet areas of the LV after TAC.
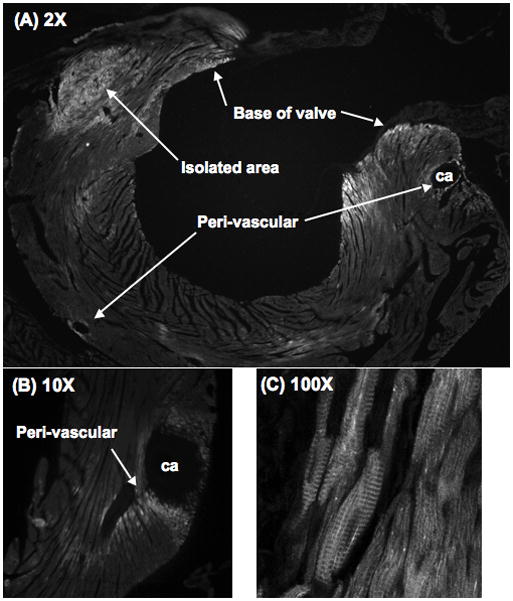
Fixed frozen sections 3w after TAC were stained with the β-MyHC mAb NOQ7.5.4D conjugated to Zenon-488 (green).
(A) Low magnification shows discrete regions with β-MyHC-positive myocytes (bright), including peri-vascular (coronary artery, ca), the base of the mitral valve, and an isolated positive region.
(B) Detail of a peri-vascular area.
(C) High magnification confirms that positive myocytes have cross striations, indicating sarcomere staining.
Prior studies using a reporter gene localized β-MyHC induction to areas of fibrosis.19,20,22 To test this localization for endogenous β-MyHC, we did double staining for β-MyHC and with wheat germ agglutinin to label collagen in fibrotic areas.24,31 As shown in Figure 7, a few myocytes positive for β-MyHC were found in Sham CON hearts (Figure 7A). After TAC, cells expressing β-MyHC were observed peri-vascular (Figure 7B, also Figures 6A/B), in isolated areas away from vessels or fibrosis (Figures 7B/C), and in areas of fibrosis (Figure 7C).
Figure 7. β-MyHC-positive LV myocytes after TAC in relation to vessels and fibrosis.
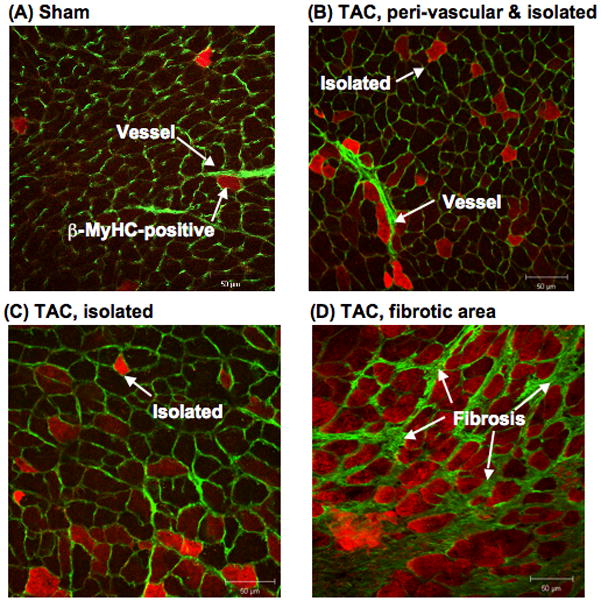
Fixed frozen sections 3w after TAC or Sham surgery were stained with the mAb NOQ7.5.4D conjugated to Zenon-546 to label β-MyHC-positive myocytes (orange), plus wheat germ agglutinin to label membranes, vessels, and fibrosis (green).
(A) In Sham, peri-vascular and isolated areas have a few β-MyHC-positive myocytes.
After TAC, β-MyHC-positive myocytes are found (B) peri-vascular and in an isolated area away from a vessel or fibrosis; (C) in an isolated area away from vessels or fibrosis; and (D) clustered in an area of fibrosis.
These data showed that cells expressing endogenous β-MyHC after TAC were in discrete regions of the LV, and were in fibrotic areas, peri-vascular, and isolated.
β-MyHC-positive myocytes after TAC arise from myocytes with α-MyHC
To test whether the β-MyHC-positive myocytes after TAC arose by proliferation of the pre-existing β-MyHC cells or some progenitor, we measured by flow cytometry incorporation of EdU into DNA, and cell cycle markers Ki67 and H3P. As shown in Online Figure I, these markers were positive in nonmyocytes after TAC, but were not positive in myocytes, without or with β-MyHC.
Next, we validated an Ab for α-MyHC (Online Figure II), and quantified α-MyHC in CON and TAC myocytes. As shown in Online Figure III, the relative level of α-MyHC per cell, quantified as median fluorescent intensity, was the same in cells without and with β-MyHC, before and after TAC. These data indicated that the β-MyHC-positive cells arose by new synthesis of β-MyHC in cells that already had α-MyHC. Importantly, the level of total MyHC, measured with the mAb MF-20, was significantly higher in the β-MyHC-positive cells after TAC than in β-MyHC-negative cells, suggesting that β-MyHC was added toα-MyHC, rather than replacing α-MyHC. Total MyHC in β-MyHC-negative cells increased with TAC by 28%, versus a 59% increase in cell volume, whereas total MyHC increased by 41% in β-MyHC-positive cells that did not enlarge with TAC.
In summary, β-MyHC-positive myocytes arose without proliferation or hypertrophy after TAC by new synthesis of β-MyHC in α-MyHC-containing cells. β-MyHC-negative cells after TAC had hypertrophy, but a smaller increase in total myosin.
DISCUSSION
The major findings here are: (1) endogenous β-MyHC protein is induced by pressure overload in only 25% of mouse myocytes; (2) β-MyHC-positive myocytes are smaller, and do not enlarge with TAC; (3) β-MyHC-negative myocytes with α-MyHC only are the cells that enlarge with TAC; and (4) β-MyHC-positive myocytes arise without proliferation or hypertrophy by addition of β-MyHC to α-MyHC, and have more total MyHC. These data challenge the current paradigm of the fetal hypertrophic gene program, showing a fetal gene in non-hypertrophied myocytes, and no β-MyHC in hypertrophied cells. The data also identify an interesting sub-population of smaller myocytes containing β-MyHC, α-MyHC, and more total MyHC. Figure 8 is a model to summarize the main findings.
Figure 8. β-MyHC is in a small sub-population of small myocytes.
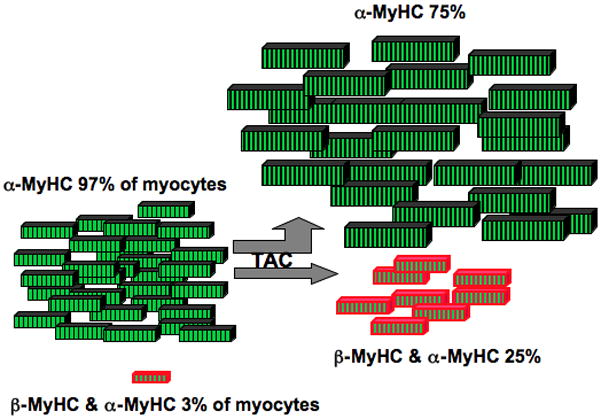
The rectangles represent myocytes, and are shown in the relative number and volume measured in this study. In control C57Bl/6J male mouse hearts, 97% of myocytes had α-MyHC protein only (green), and 3% of myocytes co-expressed both β-MyHC (red) and α-MyHC proteins. After TAC, 25% of myocytes were positive for both β-MyHC and α-MyHC, suggesting that the β-MyHC cells arose by new synthesis of β-MyHC in α-MyHC-containing myocytes. Myocytes with β-MyHC were significantly smaller than the myocytes with α-MyHC only, before TAC and after TAC. The hypertrophied myocytes after TAC expressed only α-MyHC, and the amount of α-MyHC per myocyte did not appear to increase as much as did cell size. β-MyHC cells had significantly more total MyHC.
Flow cytometry allowed us to quantify β-MyHC expression and myocyte size simultaneously in large numbers of myocytes (Figure 1). Our approach is applicable to any standard cytometer, with careful attention to protocol details to avoid instrument clogging. Myocytes were identified by the well-vetted mAb MF-20, and β-MyHC-expressing myocytes were defined by a commercial mAb, which was selective for β-MyHC by several criteria, and was used at a dilution maximum for specific detection, and in the green or red fluorescent spectra (Figure 2). We used a model of severe TAC (~100mmHg gradient for 6w), to induce remodeling and recruit the maximum number of β-MyHC-positive cells. Equal numbers of LV myocytes were isolated from control and TAC hearts (~2 million), and 10,000–20,000 myocytes were analyzed in each run. Side scatter quantified myocyte size, which was as accurate as a Coulter Multisizer in detecting relative myocyte size differences in validation studies (Figure 4).
Our estimate of 25% of myocytes expressing β-MyHC after TAC for 3d-6w (Figure 3) agrees well with 2 earlier studies, although we studied far more hearts (41 vs. 6–8) and more myocytes per heart (>10,000 vs. 200–3000). A mean 30% of rat myocytes are β-MyHC-positive at 2–14d after ascending aortic banding, by counts of 200 isolated cells stained with anti-V3 myosin Ab (mean calculated from Figure 3 in Rappaport et al.).15 Similarly, 38% of mouse myocytes have YFP-β-MyHC at 4–8w after TAC, by imaging 3000 myocytes in LV sections.20 Therefore, our data confirm in a large number of hearts and myocytes that endogenous β-MyHC is induced by pressure overload in only a minor sub-population of LV myocytes.
However, our finding that β-MyHC-positive myocytes are smaller disagrees with the report that YFP-β-MyHC-positive and -negative myocytes are equally hypertrophied.19,21,22 In contrast, we found that the β-MyHC-negative cells were the only cells that enlarged with TAC. The difference might be explained by sampling. We quantified size in at least 10,000 myocytes in each of 25 hearts (Figure 5), whereas Smithies’ lab measured cross-sectional area of 100 myocytes in each of 6 hearts.19,21,22 Alternately, the YFP-β-MyHC fusion protein might itself have induced myocyte hypertrophy,32 whereas we studied endogenous β-MyHC.
An intriguing observation here was that the few β-MyHC-expressing myocytes were reproducibly present in discrete LV regions, including the LV-RV junction at the base, the insertions of the mitral valve, the papillary muscles, and the apex (Figure 6). This regional distribution is extremely similar to that seen in 5- to 9-month old FVB/N mice.33 We also foundβ-MyHC-positive cells around larger coronaries, similar to ANF.34 Besides peri-vascular, β-MyHC myocytes were in areas of fibrosis, and in isolated areas away from vessels or fibrosis (Figure 7). In this respect, induction of endogenous β-MyHC protein was not limited to areas of fibrosis, unlike the YFP-β-MyHC fusion protein.19,22 It is unknown what might determine the localization of β-MyHC cells, but there is an intriguing overlap with a stem cell niche in the apex,35 and ANF and skeletal α-actin can also be found in fibrotic areas.17,18
We show that the β-MyHC-positive myocytes arise without proliferation or hypertrophy by new synthesis of β-MyHC in cells with α-MyHC. There was no isoform “switch”. Co-expression of α-MyHC in β-MyHC cells was noted in earlier studies.15,36,37 However, since all neonatal myocytes can express β-MyHC (Figure 2), it is unknown why only a sub-population of smaller adult myocytes in discrete LV regions retains the ability to transcribe β-MyHC with the stress of TAC. Also unknown is what else might distinguish the β-MyHC cells. For example, we have so far been unable to validate suitable Abs for other fetal genes, such as ANF. The smallβ-MyHC cells might be related to the small mononuclear, high-functioning myocytes identified in the cat and mouse heart,38,39 although we could not measure nuclear number reliably in the β-MyHC cells. In any case, the β-MyHC myocytes must uniquely have signaling molecules that can activate β-MyHC transcription with stress. One candidate is α1-adrenergic receptors (ARs), which induce β-MyHC,4,24,40 and are also expressed in a sub-population of myocytes.41
Our findings have important implications for study of hypertrophic signaling. First and most obviously, β-MyHC induction does not indicate myocyte hypertrophy. Myocytes with α-MyHC but not β-MyHC are the predominant population with hypertrophy after TAC. Therefore, signaling schemes focused on β-MyHC transcription might not be relevant to most myocytes (Figure 8). β-MyHC transcription is a poor marker for “hypertrophic signaling”. Second, the data caution against genetic approaches which test the functional role of β-MyHC by placing β-MyHC in most or all myocytes, such as adenovirus or transgenesis with the α-MyHC promoter.42,43
It is controversial whether β-MyHC induction and the fetal program are maladaptive11,44 or adaptive,45–47 and reliable induction as a function of disease severity does not answer this question. Transgenic models show that even high-level replacement of α-MyHC with β-MyHC causes no or mild pathology,42,43,48,49 or can be beneficial.50,51 In our experiments, the β-MyHC cells with more total MyHC did not hypertrophy, whereas the cells with only α-MyHC did. β-MyHC might be anti-hypertrophic; for example, replacing α-MyHC with β-MyHC causes less hypertrophy in a troponin T mutant mouse.51 Increasing myocyte total MyHC and myofibrils causes improved function,52,53 whereas loss of myosin and myofibrils causes worse function, in human cardiomyopathy, and in an α1-AR KO model where β-MyHC and other fetal genes are not induced.24,54 Possibly the β-MyHC-positive myocytes have a larger volume fraction of myofibrils, better function, and no deleterious secondary hypertrophy.
In summary, we used flow cytometry to show that β-MyHC is induced by pressure overload in only a minor sub-population of smaller cardiac myocytes. These data challenge the current paradigm of the fetal hypertrophic gene program, and identify a new sub-population of smaller working ventricular myocytes with more myosin.
Supplementary Material
NOVELTY & SIGNIFICANCE.
What is known?
Re-expression of the cardiac “fetal gene”, β-myosin heavy chain (β-MyHC), is a signature feature of pressure overload hypertrophy in rodents, and is thought to be pathological.
Endogenous β-MyHC mRNA, and a fusion protein of yellow fluorescent protein-βMyHC, have a heterogeneous myocardial expression pattern after stress.
What new information does this article contribute?
Endogenous β-MyHC protein is induced by pressure overload in only a small sub-population of mouse cardiac myocytes.
Pressure-overloaded myocytes with β-MyHC are not hypertrophied, and are smaller than the myocytes that have only α-MyHC, the normal adult MyHC isoform.
Myocytes with β-MyHC arise without proliferation or hypertrophy by adding β-MyHC to α-MyHC, and have more total MyHC per cell than the hypertrophied myocytes with only α-MyHC.
β-MyHC in rodent cardiac myocytes is expressed normally during fetal development, is replaced by α-MyHC after birth. It is induced robustly in the adult heart with pressure overload and other cardiac diseases. β-MyHC induction has therefore become a classical marker for pathological hypertrophy, but the functional significance of β-MyHC induction remains controversial. Here, we used flow cytometry to quantify the number and size of mouse cardiac myocytes that expressed β-MyHC after pressure overload caused by transverse aortic constriction. We found that β-MyHC is induced in a minor sub-population of smaller myocytes that have more total MyHC. Surprisingly, myocytes with only α-MyHC accounted for hypertrophy after pressure overload, but these α-MyHC myocytes had relatively less MyHC per cell, a potentially maladaptive phenotype. These data challenge the current paradigm of the fetal hypertrophic gene program, by showing the fetal gene β-MyHC in nonhypertrophied myocytes, and no β-MyHC in hypertrophied cells. The data also identify an interesting sub-population of smaller myocytes containing α-MyHC plus β-MyHC, and more total MyHC. This sub-population of myocytes might represent be an adaptive mechanism, which could be amplified in the stressed myocardium as a novel therapeutic target.
Acknowledgments
We thank Donald M. Bers for rabbit myocytes.
SOURCES OF FUNDING
Support was from the Sarnoff Cardiovascular Research Foundation (JEL), the Department of Veterans Affairs and the NIH (PCS), the PhRMA Foundation (MDM), and the Western States Affiliate of the American Heart Association (JEL, B-EM, and MCR). The Northern California Institute for Research and Education administered grants, and the Veterans Affairs Medical Center, San Francisco, California, provided resources.
Non-standard Abbreviations and Acronyms
- 7-AAD
7-Amino-actinomycin D
- Ab
antibody
- APC
allophycocyanin
- AR
adrenergic receptor
- β-MyHC
beta-myosin heavy chain
- CON
control
- DSHB
Developmental Studies Hybridoma Bank
- EdU
ethynyl deoxyuridine
- H3P
phospho-histone H3
- mAb
monoclonal antibody
- MC
myocyte
- NMC
nonmyocyte
- NRVM
neonatal rat ventricular myocyte
- PI
propidium iodide
- RIPA
Radio-Immunoprecipitation Assay
- T3
triiodothyronine
- TAC
transverse aortic constriction
- WBCs
white blood cells
- YFP
yellow fluorescent protein
Footnotes
DISCLOSURES
None
References
- 1.Lompre AM, Schwartz K, d’Albis A, Lacombe G, Van Thiem N, Swynghedauw B. Myosin isoenzyme redistribution in chronic heart overload. Nature. 1979;282:105–107. doi: 10.1038/282105a0. [DOI] [PubMed] [Google Scholar]
- 2.Lompre AM, Nadal-Ginard B, Mahdavi V. Expression of the cardiac ventricular alpha- and beta-myosin heavy chain genes is developmentally and hormonally regulated. J Biol Chem. 1984;259:6437–6446. [PubMed] [Google Scholar]
- 3.Izumo S, Lompre AM, Matsuoka R, Koren G, Schwartz K, Nadal-Ginard B, Mahdavi V. Myosin heavy chain messenger RNA and protein isoform transitions during cardiac hypertrophy. Interaction between hemodynamic and thyroid hormone-induced signals. J Clin Invest. 1987;79:970–977. doi: 10.1172/JCI112908. [DOI] [PMC free article] [PubMed] [Google Scholar]
- 4.Waspe LE, Ordahl CP, Simpson PC. The cardiac beta-myosin heavy chain isogene is induced selectively in alpha 1-adrenergic receptor-stimulated hypertrophy of cultured rat heart myocytes. J Clin Invest. 1990;85:1206–1214. doi: 10.1172/JCI114554. [DOI] [PMC free article] [PubMed] [Google Scholar]
- 5.Mercadier JJ, Lompre AM, Wisnewsky C, Samuel JL, Bercovici J, Swynghedauw B, Schwartz K. Myosin isoenzyme changes in several models of rat cardiac hypertrophy. Circ Res. 1981;49:525–532. doi: 10.1161/01.res.49.2.525. [DOI] [PubMed] [Google Scholar]
- 6.Scheuer J, Malhotra A, Hirsch C, Capasso J, Schaible TF. Physiologic cardiac hypertrophy corrects contractile protein abnormalities associated with pathologic hypertrophy in rats. J Clin Invest. 1982;70:1300–1305. doi: 10.1172/JCI110729. [DOI] [PMC free article] [PubMed] [Google Scholar]
- 7.Starksen NF, Simpson PC, Bishopric N, Coughlin SR, Lee WM, Escobedo JA, Williams LT. Cardiac myocyte hypertrophy is associated with c-myc protooncogene expression. Proc Natl Acad Sci U S A. 1986;83:8348–8350. doi: 10.1073/pnas.83.21.8348. [DOI] [PMC free article] [PubMed] [Google Scholar]
- 8.Bishopric NH, Simpson PC, Ordahl CP. Induction of the skeletal alpha-actin gene in alpha 1-adrenoceptor-mediated hypertrophy of rat cardiac myocytes. J Clin Invest. 1987;80:1194–1199. doi: 10.1172/JCI113179. [DOI] [PMC free article] [PubMed] [Google Scholar]
- 9.Izumo S, Nadal-Ginard B, Mahdavi V. Protooncogene induction and reprogramming of cardiac gene expression produced by pressure overload. Proc Natl Acad Sci U S A. 1988;85:339–343. doi: 10.1073/pnas.85.2.339. [DOI] [PMC free article] [PubMed] [Google Scholar]
- 10.Boheler KR, Carrier L, de la Bastie D, Allen PD, Komajda M, Mercadier JJ, Schwartz K. Skeletal actin mRNA increases in the human heart during ontogenic development and is the major isoform of control and failing adult hearts. J Clin Invest. 1991;88:323–330. doi: 10.1172/JCI115295. [DOI] [PMC free article] [PubMed] [Google Scholar]
- 11.Lowes BD, Zolty R, Shakar SF, Brieke A, Gray N, Reed M, Calalb M, Minobe W, Lindenfeld J, Wolfel EE, Geraci M, Bristow MR, Cleveland J., Jr Assist devices fail to reverse patterns of fetal gene expression despite beta-blockers. J Heart Lung Transplant. 2007;26:1170–1176. doi: 10.1016/j.healun.2007.08.003. [DOI] [PMC free article] [PubMed] [Google Scholar]
- 12.Edwards BS, Ackermann DM, Lee ME, Reeder GS, Wold LE, Burnett JC., Jr Identification of atrial natriuretic factor within ventricular tissue in hamsters and humans with congestive heart failure. J Clin Invest. 1988;81:82–86. doi: 10.1172/JCI113314. [DOI] [PMC free article] [PubMed] [Google Scholar]
- 13.Ingwall JS, Kramer MF, Fifer MA, Lorell BH, Shemin R, Grossman W, Allen PD. The creatine kinase system in normal and diseased human myocardium. N Engl J Med. 1985;313:1050–1054. doi: 10.1056/NEJM198510243131704. [DOI] [PubMed] [Google Scholar]
- 14.Tsuchimochi H, Sugi M, Kuro-o M, Ueda S, Takaku F, Furuta S, Shirai T, Yazaki Y. Isozymic changes in myosin of human atrial myocardium induced by overload. Immunohistochemical study using monoclonal antibodies. J Clin Invest. 1984;74:662–665. doi: 10.1172/JCI111466. [DOI] [PMC free article] [PubMed] [Google Scholar]
- 15.Rappaport L, Samuel JL, Bertier B, Bugaisky L, Marotte F, Mercadier A, Schwartz K. Isomyosins, microtubules and desmin during the onset of cardiac hypertrophy in the rat. Eur Heart J. 1984;5 (Suppl F):243–250. doi: 10.1093/eurheartj/5.suppl_f.243. [DOI] [PubMed] [Google Scholar]
- 16.Schiaffino S, Samuel JL, Sassoon D, Lompre AM, Garner I, Marotte F, Buckingham M, Rappaport L, Schwartz K. Nonsynchronous accumulation of alpha-skeletal actin and beta-myosin heavy chain mRNAs during early stages of pressure-overload--induced cardiac hypertrophy demonstrated by in situ hybridization. Circ Res. 1989;64:937–948. doi: 10.1161/01.res.64.5.937. [DOI] [PubMed] [Google Scholar]
- 17.Vikstrom KL, Bohlmeyer T, Factor SM, Leinwand LA. Hypertrophy, pathology, and molecular markers of cardiac pathogenesis. Circ Res. 1998;82:773–778. doi: 10.1161/01.res.82.7.773. [DOI] [PubMed] [Google Scholar]
- 18.Clement S, Chaponnier C, Gabbiani G. A subpopulation of cardiomyocytes expressing alpha-skeletal actin is identified by a specific polyclonal antibody. Circ Res. 1999;85:e51–58. doi: 10.1161/01.res.85.10.e51. [DOI] [PubMed] [Google Scholar]
- 19.Pandya K, Kim HS, Smithies O. Fibrosis, not cell size, delineates beta-myosin heavy chain reexpression during cardiac hypertrophy and normal aging in vivo. Proc Natl Acad Sci U S A. 2006;103:16864–16869. doi: 10.1073/pnas.0607700103. [DOI] [PMC free article] [PubMed] [Google Scholar]
- 20.Pandya K, Cowhig J, Brackhan J, Kim HS, Hagaman J, Rojas M, Carter CW, Jr, Mao L, Rockman HA, Maeda N, Smithies O. Discordant on/off switching of gene expression in myocytes during cardiac hypertrophy in vivo. Proc Natl Acad Sci U S A. 2008;105:13063–13068. doi: 10.1073/pnas.0805120105. [DOI] [PMC free article] [PubMed] [Google Scholar]
- 21.Pandya K, Porter K, Rockman HA, Smithies O. Decreased beta-adrenergic responsiveness following hypertrophy occurs only in cardiomyocytes that also re-express beta-myosin heavy chain. Eur J Heart Fail. 2009;11:648–652. doi: 10.1093/eurjhf/hfp073. [DOI] [PMC free article] [PubMed] [Google Scholar]
- 22.Konno T, Chen D, Wang L, Wakimoto H, Teekakirikul P, Nayor M, Kawana M, Eminaga S, Gorham JM, Pandya K, Smithies O, Naya FJ, Olson EN, Seidman JG, Seidman CE. Heterogeneous myocyte enhancer factor-2 (Mef2) activation in myocytes predicts focal scarring in hypertrophic cardiomyopathy. Proc Natl Acad Sci U S A. 2010;107:18097–18102. doi: 10.1073/pnas.1012826107. [DOI] [PMC free article] [PubMed] [Google Scholar]
- 23.Rockman HA, Ross RS, Harris AN, Knowlton KU, Steinhelper ME, Field LJ, Ross J, Jr, Chien KR. Segregation of atrial-specific and inducible expression of an atrial natriuretic factor transgene in an in vivo murine model of cardiac hypertrophy. Proc Natl Acad Sci U S A. 1991;88:8277–8281. doi: 10.1073/pnas.88.18.8277. [DOI] [PMC free article] [PubMed] [Google Scholar]
- 24.O’Connell TD, Swigart PM, Rodrigo MC, Ishizaka S, Joho S, Turnbull L, Tecott LH, Baker AJ, Foster E, Grossman W, Simpson PC. Alpha1-adrenergic receptors prevent a maladaptive cardiac response to pressure overload. J Clin Invest. 2006;116:1005–1015. doi: 10.1172/JCI22811. [DOI] [PMC free article] [PubMed] [Google Scholar]
- 25.Xia Y, Lee K, Li N, Corbett D, Mendoza L, Frangogiannis NG. Characterization of the inflammatory and fibrotic response in a mouse model of cardiac pressure overload. Histochem Cell Biol. 2009;131:471–481. doi: 10.1007/s00418-008-0541-5. [DOI] [PMC free article] [PubMed] [Google Scholar]
- 26.Soonpaa MH, Kim KK, Pajak L, Franklin M, Field LJ. Cardiomyocyte DNA synthesis and binucleation during murine development. Am J Physiol. 1996;271:H2183–2189. doi: 10.1152/ajpheart.1996.271.5.H2183. [DOI] [PubMed] [Google Scholar]
- 27.Banerjee I, Fuseler JW, Price RL, Borg TK, Baudino TA. Determination of cell types and numbers during cardiac development in the neonatal and adult rat and mouse. Am J Physiol Heart Circ Physiol. 2007;293:H1883–1891. doi: 10.1152/ajpheart.00514.2007. [DOI] [PubMed] [Google Scholar]
- 28.Kinugawa K, Yonekura K, Ribeiro RC, Eto Y, Aoyagi T, Baxter JD, Camacho SA, Bristow MR, Long CS, Simpson PC. Regulation of thyroid hormone receptor isoforms in physiological and pathological cardiac hypertrophy. Circ Res. 2001;89:591–598. doi: 10.1161/hh1901.096706. [DOI] [PubMed] [Google Scholar]
- 29.Gerdes AM, Moore JA, Hines JM, Kirkland PA, Bishop SP. Regional differences in myocyte size in normal rat heart. Anat Rec. 1986;215:420–426. doi: 10.1002/ar.1092150414. [DOI] [PubMed] [Google Scholar]
- 30.Tzur A, Moore JK, Jorgensen P, Shapiro HM, Kirschner MW. Optimizing optical flow cytometry for cell volume-based sorting and analysis. PLoS One. 2011;6:e16053. doi: 10.1371/journal.pone.0016053. [DOI] [PMC free article] [PubMed] [Google Scholar]
- 31.Soderstrom KO. Lectin binding to collagen strands in histologic tissue sections. Histochemistry. 1987;87:557–560. doi: 10.1007/BF00492470. [DOI] [PubMed] [Google Scholar]
- 32.Agbulut O, Huet A, Niederlander N, Puceat M, Menasche P, Coirault C. Green fluorescent protein impairs actin-myosin interactions by binding to the actin-binding site of myosin. J Biol Chem. 2007;282:10465–10471. doi: 10.1074/jbc.M610418200. [DOI] [PubMed] [Google Scholar]
- 33.Krenz M, Sadayappan S, Osinska HE, Henry JA, Beck S, Warshaw DM, Robbins J. Distribution and structure-function relationship of myosin heavy chain isoforms in the adult mouse heart. J Biol Chem. 2007;282:24057–24064. doi: 10.1074/jbc.M704574200. [DOI] [PubMed] [Google Scholar]
- 34.Gardner DG, Deschepper CF, Ganong WF, Hane S, Fiddes J, Baxter JD, Lewicki J. Extra-atrial expression of the gene for atrial natriuretic factor. Proc Natl Acad Sci U S A. 1986;83:6697–6701. doi: 10.1073/pnas.83.18.6697. [DOI] [PMC free article] [PubMed] [Google Scholar]
- 35.Urbanek K, Cesselli D, Rota M, Nascimbene A, De Angelis A, Hosoda T, Bearzi C, Boni A, Bolli R, Kajstura J, Anversa P, Leri A. Stem cell niches in the adult mouse heart. Proc Natl Acad Sci U S A. 2006;103:9226–9231. doi: 10.1073/pnas.0600635103. [DOI] [PMC free article] [PubMed] [Google Scholar]
- 36.Samuel JL, Rappaport L, Mercadier JJ, Lompre AM, Sartore S, Triban C, Schiaffino S, Schwartz K. Distribution of myosin isozymes within single cardiac cells. An immunohistochemical study. Circ Res. 1983;52:200–209. doi: 10.1161/01.res.52.2.200. [DOI] [PubMed] [Google Scholar]
- 37.Dechesne CA, Leger JO, Leger JJ. Distribution of alpha- and beta-myosin heavy chains in the ventricular fibers of the postnatal developing rat. Dev Biol. 1987;123:169–178. doi: 10.1016/0012-1606(87)90439-8. [DOI] [PubMed] [Google Scholar]
- 38.Chen X, Wilson RM, Kubo H, Berretta RM, Harris DM, Zhang X, Jaleel N, MacDonnell SM, Bearzi C, Tillmanns J, Trofimova I, Hosoda T, Mosna F, Cribbs L, Leri A, Kajstura J, Anversa P, Houser SR. Adolescent feline heart contains a population of small, proliferative ventricular myocytes with immature physiological properties. Circ Res. 2007;100:536–544. doi: 10.1161/01.RES.0000259560.39234.99. [DOI] [PubMed] [Google Scholar]
- 39.Rota M, Hosoda T, De Angelis A, Arcarese ML, Esposito G, Rizzi R, Tillmanns J, Tugal D, Musso E, Rimoldi O, Bearzi C, Urbanek K, Anversa P, Leri A, Kajstura J. The young mouse heart is composed of myocytes heterogeneous in age and function. Circ Res. 2007;101:387–399. doi: 10.1161/CIRCRESAHA.107.151449. [DOI] [PubMed] [Google Scholar]
- 40.Chan T, Dash R, Simpson PC. An alpha-1A-adrenergic receptor subtype agonist prevents cardiomyopathy without increasing blood pressure (abstract) Circulation. 2008;118:S533. [Google Scholar]
- 41.Myagmar B-E, Rodrigo MC, Swigart PM, Simpson PC. The alpha-1A adrenergic receptor subtype Is expressed in only a sub-population of ventricular myocytes (abstract) Circulation. 2007;116:II–184. [Google Scholar]
- 42.Tardiff JC, Hewett TE, Factor SM, Vikstrom KL, Robbins J, Leinwand LA. Expression of the beta (slow)-isoform of MHC in the adult mouse heart causes dominant-negative functional effects. Am J Physiol Heart Circ Physiol. 2000;278:H412–419. doi: 10.1152/ajpheart.2000.278.2.H412. [DOI] [PubMed] [Google Scholar]
- 43.Ishibashi Y, Takahashi M, Isomatsu Y, Qiao F, Iijima Y, Shiraishi H, Simsic JM, Baicu CF, Robbins J, Zile MR, Cooper Gt. Role of microtubules versus myosin heavy chain isoforms in contractile dysfunction of hypertrophied murine cardiocytes. Am J Physiol Heart Circ Physiol. 2003;285:H1270–1285. doi: 10.1152/ajpheart.00654.2002. [DOI] [PubMed] [Google Scholar]
- 44.McKinsey TA, Olson EN. Toward transcriptional therapies for the failing heart: chemical screens to modulate genes. J Clin Invest. 2005;115:538–546. doi: 10.1172/JCI24144. [DOI] [PMC free article] [PubMed] [Google Scholar]
- 45.Nadal-Ginard B, Mahdavi V. Molecular basis of cardiac performance. Plasticity of the myocardium generated through protein isoform switches. J Clin Invest. 1989;84:1693–1700. doi: 10.1172/JCI114351. [DOI] [PMC free article] [PubMed] [Google Scholar]
- 46.Jensen BC, O’Connell TD, Simpson PC. Alpha-1-adrenergic receptors: Targets for agonist drugs to treat heart failure. J Mol Cell Cardiol. 2010 doi: 10.1016/j.yjmcc.2010.11.014. [DOI] [PMC free article] [PubMed] [Google Scholar]
- 47.Taegtmeyer H, Sen S, Vela D. Return to the fetal gene program: a suggested metabolic link to gene expression in the heart. Ann N Y Acad Sci. 2010;1188:191–198. doi: 10.1111/j.1749-6632.2009.05100.x. [DOI] [PMC free article] [PubMed] [Google Scholar]
- 48.Krenz M, Sanbe A, Bouyer-Dalloz F, Gulick J, Klevitsky R, Hewett TE, Osinska HE, Lorenz JN, Brosseau C, Federico A, Alpert NR, Warshaw DM, Perryman MB, Helmke SM, Robbins J. Analysis of myosin heavy chain functionality in the heart. J Biol Chem. 2003;278:17466–17474. doi: 10.1074/jbc.M210804200. [DOI] [PubMed] [Google Scholar]
- 49.Krenz M, Robbins J. Impact of beta-myosin heavy chain expression on cardiac function during stress. J Am Coll Cardiol. 2004;44:2390–2397. doi: 10.1016/j.jacc.2004.09.044. [DOI] [PubMed] [Google Scholar]
- 50.Hoyer K, Krenz M, Robbins J, Ingwall JS. Shifts in the myosin heavy chain isozymes in the mouse heart result in increased energy efficiency. J Mol Cell Cardiol. 2007;42:214–221. doi: 10.1016/j.yjmcc.2006.08.116. [DOI] [PMC free article] [PubMed] [Google Scholar]
- 51.Rice R, Guinto P, Dowell-Martino C, He H, Hoyer K, Krenz M, Robbins J, Ingwall JS, Tardiff JC. Cardiac myosin heavy chain isoform exchange alters the phenotype of cTnT-related cardiomyopathies in mouse hearts. J Mol Cell Cardiol. 2010;48:979–988. doi: 10.1016/j.yjmcc.2009.11.018. [DOI] [PMC free article] [PubMed] [Google Scholar]
- 52.Chang KC, Figueredo VM, Schreur JH, Kariya K, Weiner MW, Simpson PC, Camacho SA. Thyroid hormone improves function and Ca2+ handling in pressure overload hypertrophy. Association with increased sarcoplasmic reticulum Ca2+-ATPase and alpha-myosin heavy chain in rat hearts. J Clin Invest. 1997;100:1742–1749. doi: 10.1172/JCI119699. [DOI] [PMC free article] [PubMed] [Google Scholar]
- 53.D’Antona G, Pellegrino MA, Adami R, Rossi R, Carlizzi CN, Canepari M, Saltin B, Bottinelli R. The effect of ageing and immobilization on structure and function of human skeletal muscle fibres. J Physiol. 2003;552:499–511. doi: 10.1113/jphysiol.2003.046276. [DOI] [PMC free article] [PubMed] [Google Scholar]
- 54.Zimmer G, Zimmermann R, Hess OM, Schneider J, Kubler W, Krayenbuehl HP, Hagl S, Mall G. Decreased concentration of myofibrils and myofiber hypertrophy are structural determinants of impaired left ventricular function in patients with chronic heart diseases: a multiple logistic regression analysis. J Am Coll Cardiol. 1992;20:1135–1142. doi: 10.1016/0735-1097(92)90369-x. [DOI] [PubMed] [Google Scholar]
Associated Data
This section collects any data citations, data availability statements, or supplementary materials included in this article.