

Abstract
The nodes of a parietal–frontal pathway that mediates grasping in primates are in anterior intraparietal area (AIP) and ventral premotor cortex (PMv). Nevertheless, multiple somatosensory and motor representations of the hand, in parietal and frontal cortex, respectively, suggest that additional pathways remain unrealized. We explored this possibility in macaque monkeys by injecting retrograde tracers into grasp zones identified in primary motor cortex (M1), PMv, and area 2 with long train electrical stimulation. The M1 grasp zone was densely connected with other frontal cortex motor regions. The remainder of the connections originated from somatosensory areas 3a and second somatosensory cortex/parietal ventral area (S2/PV), and from the medial bank and fundus of the intraparietal sulcus (IPS). The PMv grasp zone was also densely connected with frontal cortex motor regions, albeit to a lesser extent than the M1 grasp zone. The remainder of the connections originated from areas S2/PV and aspects of the inferior parietal lobe such as PF, PFG, AIP, and the tip of the IPS. The area 2 grasp zone was densely connected with the hand representations of somatosensory areas 3b, 1, and S2/PV. The remainder of the connections was with areas 3a and 5 and the medial bank and fundus of the IPS. Connections with frontal cortex were relatively weak and concentrated in caudal M1. Thus, the three grasp zones may be nodes of parallel parietal–frontal pathways. Differential points of origin and termination of each pathway suggest varying functional specializations. Direct and indirect connections between those parietal–frontal pathways likely coordinate their respective functions into an accurate grasp.
Introduction
Parietal–frontal networks in primate brains support the sensorimotor transformations necessary for various actions including grasping (Jeannerod et al., 1995; Fogassi and Luppino, 2005). The anterior intraparietal area (AIP) of the lateral bank of the intraparietal sulcus (IPS) and the ventral premotor cortex (PMv) are the parietal and frontal nodes of a grasping network, respectively. Activities of neuronal populations in AIP (Sakata et al., 1995; Murata et al., 2000) and rostral aspects of PMv (Rizzolatti et al., 1988; Murata et al., 1997; Raos et al., 2006) are strongly correlated with hand and digit shaping during grasping. Deactivation of AIP or PMv disrupts appropriate hand shaping to target contours (Gallese et al., 1994; Fogassi et al., 2001). Preferential anatomical connections linking AIP with PMv support the interpretation that both areas are nodes of a parietal–frontal network specialized in grasping (Luppino et al., 1999; Borra et al., 2008). This network may have been preserved in humans, and likely elaborated, because similar activation patterns have been detected in AIP and PMv during grasping (Hinkley et al., 2009; Cavina-Pratesi et al., 2010).
Nevertheless, the organization of the parietal–frontal network for grasping in monkeys remains unclear for at least three reasons. First, neurophysiological results have only occasionally guided tracer injections into the putative AIP and PMv grasp zones. Second, cortical connections have only occasionally been related to neurophysiological results from the same animal. Third, the distributions of the connections have been primarily sampled from cortical sections in the vicinities of AIP and PMv. For these reasons, an understanding of the full extent of the parietal–frontal network for grasping may remain unrealized and connections of cortex adjoining grasp zones may have been inadvertently attributed to this network.
The objective of our study was to comprehensively trace the corticocortical connections of neurophysiologically defined grasp zones. We hypothesized that the motor representations of the hand in primary motor cortex (M1) and PMv, and the somatosensory representations of the hand in areas 2 and 5, contain grasp zones that are part of the parietal–frontal network of grasping. Our hypothesis was in part based on neurophysiological studies, which have shown that grasping and hand manipulations, can be evoked with long train (500 ms) electrical stimulation from M1 and PMv in Old World monkeys (Graziano et al., 2002), and from M1, PMv, and parietal cortex in New World monkeys (Gharbawie et al., 2011). Projections of M1 and PMv to spinal cord motoneurons (Dum and Strick, 1991; Galea and Darian-Smith, 1994) and connections linking areas 2 and 5 with M1 (Jones et al., 1978; Strick and Kim, 1978; Pons and Kaas, 1986; Ghosh et al., 1987) also shaped this hypothesis.
We identified grasp zones in M1, PMv, and area 2 of the parietal cortex using long train stimulation in macaque monkeys. In two cases, we also mapped the somatosensory receptive fields in parietal cortex using multiunit recordings. Retrograde tracers revealed the corticocortical connections of the three grasp zones. Injections in multiple cortical fields in each case facilitated direct comparisons of their connections.
Materials and Methods
Animals.
Four male macaque monkeys (two Macaca fascicularis, one Macaca mulatta, one Macaca radiata) were used in the present study. Animals were 3–9 years of age and weighed 3.5–10.5 kg. All procedures were approved by Vanderbilt University Animal Care and Use Committee and followed the guidelines of the National Institutes of Health Guide for the Care and Use of Laboratory Animals.
Intracortical electrical stimulation.
Motor mapping was conducted with the objective of identifying grasp zones in motor/premotor cortex (M1/PM) and parietal cortex. Long train electrical stimulation (trains of 150 biphasic pulses delivered over 500 ms) was favored here because it evokes sequences of movements and was therefore more likely to evoke grasping compared with standard stimulation parameters (trains of cathodal pulses delivered over 50 ms) that evoke only muscle twitches. Nevertheless, most microelectrode penetration sites in M1/PM were also explored with standard stimulation parameters. An additional benefit of long train stimulation in the present study is that it evokes movements from parietal cortex, whereas the efficacy of standard stimulation parameters is mostly limited to M1/PM.
Each monkey was tranquilized with ketamine hydrochloride (10–30 mg/kg, i.m.). The head was secured in a stereotaxic frame and anesthesia maintained on 2% isoflurane during surgical procedures. A water blanket was positioned underneath the animal for heating. The skull was opened under aseptic conditions to expose the frontal and parietal lobes of the left hemisphere. The rostrocaudal extent of the opening included most of the intraparietal sulcus caudally and the caudal bank of the arcuate sulcus rostrally. The mediolateral extent of the opening included the M1 trunk representation medially and the face representation laterally. The dura was dissected and saline was consistently applied to the exposed cortex. The surface of the cortex was digitally photographed and a printout was used to record microelectrode penetrations. Anesthesia was switched at this time to a continuous perfusion of ketamine hydrochloride mixed in physiological saline (20–40 mg · kg−1 · h−1), which was delivered through the short saphenous vein. Small doses of xylazine (0.2–0.4 mg/kg) were occasionally administered to control excessive muscle tone. Vital signs (respiratory rate, expired CO2 levels, oxygen saturation in blood, and heart rate) were monitored and recorded every 10 min for the duration of anesthesia.
A tungsten microelectrode (1 MΩ impedance at 1 kHz) was perpendicularly lowered with a micromanipulator into the cortex to depths 1600–2000 μm below the pia, but the range extended to 1600–3000 μm in the banks of the sulci. Interpenetration distances were 0.5–1.0 mm, varying primarily to avoid vascular branches on the cortex. Stimulation trains consisted of 150 biphasic pulses delivered over 500 ms. The duration of each phase was 0.2 ms at 300 Hz. For M1/PM long train stimulation, current intensity was increased from low levels (10 μA) until a movement was reliably evoked (up to a maximum of 200 μA), whereas the starting point for parietal cortex was 150 μA and current was increased until a movement was reliably evoked (up to a maximum of 400 μA).
Anatomical tracer injections.
Once motor mapping was complete, ketamine was withdrawn and anesthesia was maintained with 2% isoflurane. Two to four retrograde tracers were injected into zones in M1/PM and parietal cortex in four hemispheres of four monkeys. A total of 10 injections were confined to the target zones and labeled sufficient numbers of cells for inclusion in the present analysis. Tracers were pressure injected with a 1 or 2 μl Hamilton syringe fitted with a glass pipette beveled to a sharp tip. Tracers included cholera toxin B subunit (CTB) (Invitrogen; 1% in distilled water), and the fluorescent tracers Diamidino Yellow (DY) (Sigma-Aldrich; 2% in distilled water), Fluoro Ruby (FR) (Invitrogen; 10% in distilled water), and Fast Blue (FB) (Polysciences; 2% in distilled water). Two depths beneath the surface of the cortex (1200 and 800 μm) were targeted at each injection site. The total volume for each injection site was 0.4 μl for DY, FB, and CTB, and 1.0 μl for FR. After tracer injections, a protective layer of Gelfilm was placed over the exposed cortex. A skullcap prepared from dental acrylic was secured over the craniotomy. The scalp was then sutured and covered with a topical antibacterial.
Terminal mapping.
Approximately 10–12 d were allowed for tracer transport before the start of a terminal procedure. The skullcap and Gelfilm were removed, and the cortex was covered with an inert silicone fluid. The same motor mapping procedures were conducted to further characterize functional zones in M1/PM and parietal cortex as well as to confirm results from the first experiment. In two cases, the somatosensory representations between the central sulcus and the intraparietal sulcus were mapped with multiunit recordings. This mapping was primarily focused on the hand and forelimb representations. A tungsten microelectrode (1 MΩ impedance at 1 kHz) was perpendicularly lowered with a hydraulic micromanipulator to 600–700 μm below the pia. Cutaneous receptive fields were identified near threshold stimulation using fine probes and soft brushes (Nelson and Kaas, 1981). Recording sites that required more intense stimulation such as tapping the skin were considered high-threshold sites, whereas sites responsive only to moving limb joints and stimulating muscles were classified as having deep receptors (Pons et al., 1985). Receptive fields were recorded on templates of line drawing of body parts. The sizes and orientations of the receptive fields on the cortical maps aided in the identification of the borders between areas 1, 2, and 5. Strategic sites in M1/PM and parietal cortex were identified at the end of the terminal experiment. A microelectrode delivered 5 μA DC as it was retracted through the depth of cortex at each of these sites. The resulting microlesions were later identified in histological sections.
Histology.
Animals were injected with a lethal dose of sodium pentobarbital (380 mg/kg) after the microlesions were induced. Intracardial perfusion started with PBS, pH 7.4, followed by 2% paraformaldehyde in PBS, and then 2% paraformaldehyde in PBS with 10% sucrose solution. The brain was removed from the skull and the cortex was separated from the thalamus and the brainstem. The cortex was flattened between glass slides (Fig. 1) and submerged overnight in 2% paraformaldehyde in PBS with 30% sucrose solution for additional fixation and cryoprotection. Flattened cortex was dissected to include the medial wall in one block and the remainder of the frontal and parietal cortex in a separate block (Fig. 1E). Blocks of cortex were sectioned parallel to the cortical surface at 40 μm and saved in four series of adjacent sections. One series was not processed and mounted onto glass slides for analysis of the distribution of fluorochrome-labeled cells. A second series was reacted for CTB immunohistochemistry and then labeled cells were visualized with a DAB (diaminobenzidine dihydrochloride) reaction that was nickel intensified (Bruce and Grofova, 1992). Two nonsuccessive series were stained for cytochrome oxidase (CO) and myelinated fibers to identify architectonic cortical borders.
Figure 1.

Select stages of flattening the frontal and parietal cortex from the left hemisphere of a macaque monkey brain. A, Medial and dorsolateral views of the left hemisphere. B, The medial and lateral banks of the intraparietal sulcus are partially separated from one another. The rostral and caudal banks of the inferior arcuate sulcus are also partially separated from one another. The upper bank and fundus of the lateral sulcus are separated from the lower bank. C, The occipital lobe and most of the temporal lobe are removed. D, The banks of the intraparietal sulcus and the arcuate sulcus are further separated. The rostral and caudal banks of the central sulcus are partially separated. The medial wall and the insular cortex are unfolded. Most of the prefrontal cortex is removed and the remaining banks of the principal sulcus are separated. E, The cortex is blocked into two pieces, which are flattened between two glass slides. The top block includes most of the medial wall. Scale bar applies to all panels. Abbreviations are described in Table 1.
Cortical borders.
Sections stained for CO and myelin were instructive particularly for the identification of borders in anterior parietal cortex. Outlines of the sections and the cortical borders were traced onto sheets of paper with the aid of a projection microscope. The tracings were digitized and redrawn in Adobe Illustrator. A combination of strategies facilitated identification of additional cortical borders that were included in the same tracings. Mapping results were instructive for identifying the borders of motor, premotor, and somatosensory areas. Experimentally induced microlesions facilitated alignment of the maps to the same architectonic sections. The expected locations of less apparent cortical areas were identified in relation to other less ambiguous cortical borders and in relation to cortical landmarks. The lips and fundi of sulci were apparent in architectonic sections and facilitated the identification of cortical areas in the vicinities of the intraparietal sulcus, arcuate sulcus, lateral sulcus, and cingulate sulcus. Photographs captured during various stages of cortical flattening (Fig. 1) were referenced to confirm the locations of sulci.
The borders of somatosensory areas 3a, 3b, 1, and 2 were readily identified according to variations in staining intensities in CO and myelin sections (Fig. 2). Abbreviations are described in Table 1. In two cases, receptive field mapping confirmed the borders identified for areas 1 and 2. Area 3a was largely confined to the fundus of the central sulcus, and area 3b was in the caudal bank of the central sulcus. Most of area 1 was on the cortical surface caudal to the central sulcus and area 2 was completely on the cortical surface. Second somatosensory cortex/parietal ventral areas (S2/PV) were not apparent in all cases. They were distinguishable in Figure 2 as a darkly stained zone in the upper bank of the lateral sulcus. Nevertheless, in most cases, their location was confirmed from previous receptive field mappings (Krubitzer et al., 1995) and anatomical connections (Disbrow et al., 2003).
Figure 2.

Representative sections of the cortex shown in Figure 1E after staining for cytochrome oxidase (A) and myelinated fibers (B). The solid white lines represent cortical borders apparent in the preset sections. The dashed white lines represent less apparent cortical borders. The solid gray lines represent the lips of sulci, and the dashed gray lines represent the fundi of the sulci. Abbreviations are described in Table 1.
Table 1.
List of abbreviations
| Abbreviation | |
|---|---|
| 1 | Area 1 |
| 2 | Area 2 |
| 3a | Area 3a |
| 3b | Area 3b |
| 5 | Area 5 |
| 7b | Area 7b |
| AIP | Anterior intraparietal area |
| ArS | Arcuate sulcus |
| cc | Corpus callosum |
| CgS | Cingulate sulcus |
| CIP | Caudal intraparietal area |
| CMAc | Caudal cingulate motor area |
| CMAd | Dorsal cingulate motor area |
| CMAr | Rostral cingulate motor area |
| CMAv | Ventral cingulate motor area |
| CS | Central sulcus |
| FEF | Frontal eye field |
| FL | Forelimb |
| iArS | Inferior arcuate sulcus |
| iPrCS | Inferior precentral sulcus |
| IPS | Intraparietal sulcus |
| IIPS | Lateral bank intraparietal sulcus |
| LIP | Lateral intraparietal area |
| LS | Lateral sulcus |
| LuS | Lunate sulcus |
| M | Medial |
| M1 | Primary motor cortex |
| MIP | Medial intraparietal area |
| mIPS | Medial bank intraparietal sulcus |
| PCS | Postcentral sulcus |
| PE | Area PE |
| PEc | Area PE caudal |
| PEip | Area PE in intraparietal sulcus |
| PF | Area PF |
| PFC | Prefrontal cortex |
| PFG | Area PFG |
| PG | Area PG |
| PGm | Area PG medial |
| PMd | Dorsal premotor cortex |
| PMv | Ventral premotor cortex |
| PPC | Posterior parietal cortex |
| PR | Parietal rostral area |
| PrCo | Precentral opercular cortex |
| PreSMA | Presupplementary area |
| PS | Principal sulcus |
| PV | Parietal ventral area |
| R | Rostral |
| S2 | Second somatosensory cortex |
| SMA | Supplementary motor area |
| sPrCS | Superior precentral sulcus |
| ULS | Upper bank lateral sulcus |
| VIP | Ventral intraparietal area |
A large portion of M1 was in the rostral bank of the central sulcus directly anterior to area 3a. This cortex was not mapped, but electrical stimulation anterior to the rostral lip of the central sulcus evoked movements with the lowest current thresholds. The border between M1 and premotor cortex was defined to separate low-threshold electrical stimulation points from electrical stimulation points that required ≥60 μA to evoke movements. In some cases, architectonic sections confirmed this border as an abrupt change in staining intensity between M1 and premotor cortex (Fig. 2). The rostral borders of dorsal premotor cortex (PMd) and PMv were presumed to be in the fundus of the superior and inferior arcuate sulcus, respectively. The border separating PMd from PMv was presumed to be near the spur of the arcuate sulcus. In two cases, electrical stimulation identified a grasp zone immediately posterior to the caudal bank of the inferior arcuate sulcus, which confirmed the identification of rostral aspects of PMv (e.g., F5) (Rizzolatti et al., 1988). In all cases, the orofacial zone in M1 was also a reliable indicator that caudal aspects of PMv (e.g., F4) (Gentilucci et al., 1988) were directly rostral.
Additional frontal areas had to be identified because they contained labeled cells. Those areas were not mapped and their borders were not apparent in architectonic sections. Thus, the borders of those areas were estimated from cortical landmarks and from their spatial relationships to other cortical areas identified with more certainty. Previous neurophysiological, architectonic, and connectional studies were cross-referenced for border identification.
Frontal cortex injections consistently labeled cells in the supplementary motor area (SMA) and the cingulate motor areas. The SMA was medial to PMd and straddled the dorsolateral surface and the medial wall. The location of SMA as identified by microstimulation mapping (Mitz and Wise, 1987) and corticospinal projections (Dum and Strick, 1996) guided our characterization of SMA. The dorsal, ventral, and rostral, cingulate motor areas were on the medial wall in the dorsal and ventral banks of the cingulate sulcus. The locations of the cingulate motor areas as defined by projections to the spinal cord (Dum and Strick, 1996) and connections with M1, PMd, and PMv (Dum and Strick, 2005), guided our characterization of the cingulate motor areas.
Frontal and parietal cortex injections labeled cells in the intraparietal sulcus and the inferior parietal lobe. The banks and fundus of the intraparietal sulcus were readily distinguishable in flattened sections of cortex. Subdivisions of the intraparietal sulcus and the inferior parietal lobe could not be consistently identified in architectonic sections, although several were in Figure 2. Previous architectonic studies (Pandya and Seltzer, 1982) and single-unit recordings (Johnson et al., 1996) were instructive for estimating the location of a border within the medial bank of the intraparietal sulcus to divide it into a rostral area PEip (area PE in intraparietal sulcus) and a more caudal, medial intraparietal area (MIP). Recording and connection studies guided our identification of the ventral intraparietal area in the fundus of the intraparietal sulcus (Maunsell and van Essen, 1983; Colby et al., 1993). Similarly, the borders of the AIP and the lateral intraparietal area (LIP) were identified in the lateral bank of the intraparietal sulcus according to previous recordings (Colby et al., 1993; Sakata et al., 1995) and connection patterns (Andersen et al., 1990; Borra et al., 2008). The borders of PF, PFG, PG, and Opt were identified in the inferior parietal lobe according to previous architectonic and connection studies (Pandya and Seltzer, 1982; Gregoriou et al., 2006; Rozzi et al., 2006).
Data analysis.
Distributions of labeled cells in the cortex were plotted with a Leitz microscope (Leica Microsystems) connected to an X–Y encoder. An experimenter manually marked the positions of labeled cells on a computer system running Neurolucida software (version 5.05.4; MicroBrightField). Examples of injection sites and labeled cells are presented in Figure 3. CTB-labeled cells were visualized under bright-field illumination. FR-labeled cells were visualized with fluorescence illumination passed through a 530–560 nm wavelength filter, whereas a 360 nm wavelength filter was used for cells labeled with DY or FB. Cells labeled from each injection were plotted from seven or eight sections collected from each block of cortex.
Figure 3.

Photomicrographs of tracer injection sites in cortex (top panels) and examples of the corresponding cells labeled in cortex (bottom panels). Images were captured with a digital camera mounted onto a light microscope to show cholera toxin B subunit (A), or a fluorescent microscope to show Fluoro Ruby (B), Fast Blue (C), and Diamidino Yellow (D). The inner dashed outline marks the core of each tracer injection, whereas the surrounding dashed outline marks a halo of intense tracer diffusion. Examples of labeled cells (arrowheads) are in E–H, which were sampled from the same cortical section as the panel directly above it. Scale bars: A–D, 250 μm; E–H, 50 μm. Contrast was digitally enhanced in all panels to improve illustration.
Plots generated in Neurolucida were aligned to the digitized tracings of cortical borders using Adobe Illustrator. Microlesions, sulci, and tissue artifacts guided alignment. Symbols marking the locations of labeled cells were adjusted for shape and color and digitally merged onto the retraced borders. Thus, the distributions of cells labeled from each injection are presented as a composite of all plotted sections.
To assess the spatial overlap and segregation of two populations of labeled cells in the same case, composites of cells labeled from two injections were superimposed in the same illustration. Outlines were drawn around clusters of cells labeled from each injection. Multiple outlines were drawn for each population of labeled cells to conservatively estimate its spatial extent. Borders for each population were shaded and resembled islands of varying shapes and sizes. Regions of overlap between the two populations of labeled cells were inferred from overlapping aspects of the shaded islands. Intermingling between the two populations of labeled cells was inferred from the close proximity of the shaded islands and partial overlap. Segregation between the two populations of labeled cells was inferred from the separation of the shaded islands.
Results
Motor maps
Long train stimulation delivered to M1/PM evoked complex movements of the contralateral forelimb and face. The classes of evoked movements are described only in brief here but will be presented in more detail in a future report. Nevertheless, several of the present classes of movements have been illustrated for macaques (Graziano et al., 2002) and galagos (Stepniewska et al., 2005).
Grasp
Several constellations of digit movements were considered grasping: (1) flexion of all digits (Fig. 4); (2) Flexion of digit 2 and opposition with digit 1; (3) concurrent flexion of all digits and forearm supination or wrist extension.
Figure 4.

Sequential still frames captured from a video recording of a grasp evoked in the right hand with long train electrical stimulation in the contralateral PMv. A, Hand posture before electrical stimulation. B–E, Successive hand postures after ∼50, 83, 117, and 150 ms of electrical stimulation.
Supination
Forearm supination was the most common forearm movement, and it often involved the wrist approaching the mouth.
Forelimb to body
Adduction of the shoulder and concurrent elbow flexion moved the forelimb toward the body. Some stimulation sites also included concurrent forearm supination.
Forelimb defense
Two constellations of movements were characterized as defensive. First, the shoulder extended and the forelimb concurrently abducted while the digits extended. The end point of the open palm was either near the face or lateral to the body presumably for protection. Second, the forelimb was withdrawn directly toward the body by a shoulder extension and a slight elbow adduction. The utility of the actions was presumed to remove the forelimb from a threatening stimulus.
Orofacial
Several subclasses of orofacial movements were included here: (1) mouth opening; (2) tongue protrusion; (3) aggressive face gestures typically involved a combination of ear pinna retraction against the neck, eye blinking, and exposure of the teeth in a grimace posture.
Organization of M1/PM grasp zones
The organization of M1/PM was explored to varying extents in four macaque monkeys (Fig. 5). Long train stimulation revealed M1 maps that included a medial trunk zone, a more lateral zone of proximal forelimb movements, an even more lateral zone of forearm supination and hand movements, and orofacial movements in the most lateral zone. A large portion of the forearm and hand zones evoked grasping or grasping with concurrent forearm supination. A grasp zone extended from the lip of the rostral bank of the central sulcus to the border with PMd. In two cases, an additional and smaller grasp zone was identified medial to the forearm supination zone. The somatotopic organization of PMd was less clear. Unlike the M1 organization, small zones of trunk movements were identified near zones of distal forelimb movements in PMd. In two cases (Fig. 5A,B), the small grasp zone near the caudal bank of the inferior arcuate sulcus indicated the location of rostral aspects of PMv. The M1 and PMv orofacial zones separated the M1 grasp zone and the PMv grasp zones.
Figure 5.
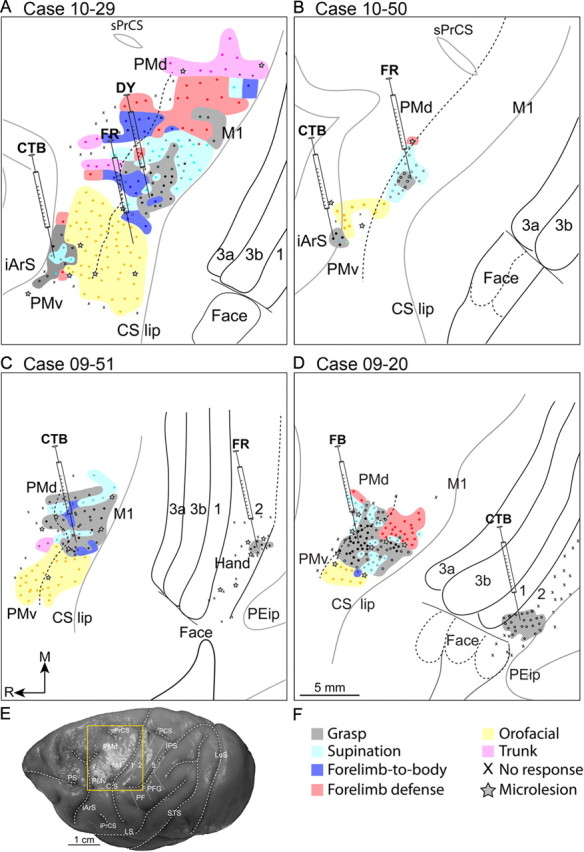
Maps of movements evoked with long train electrical stimulation (each train is comprised of 150 biphasic pulses delivered over 500 ms) aligned to the respective flattened cortex (A–D). Microelectrode penetration sites are color-coded to reflect evoked movements. Dual movements are represented in two colors. Each Hamilton syringe represents the location of a tracer injection including CTB, FR, DY, and FB. The solid black lines represent cortical borders identified from adjacent sections stained for cytochrome oxidase and myelinated fibers. The solid gray lines mark different banks of sulci. The border between motor M1, PMd, and PMv was estimated from current thresholds for evoking movements and is marked with a dashed black line. Receptive fields were mapped in cases 10-29 and 09-51 with multiunit recordings. In both cases, the territories mapped were between area 1 and the medial bank of the intraparietal sulcus. In case 09-51, the solid line separating areas 2 and 5 represents the mediolateral extent of the mapped territory. The remainder of this border was estimated from architectonic results and is represented by a dashed black line. Scale bar: A–D, 5 mm. E, The yellow box on the dorsolateral view of a macaque brain shows the approximate area of cortex in A–D. F, Legend for the motor maps.
The borders separating M1, PMd, and PMv, were estimated from current thresholds of electrical stimulation, myeloarchitecture, and spatial relationships to cortical landmarks. Although the depth of the rostral bank of the central sulcus was not comprehensively explored with electrical stimulation, current thresholds for evoking movements were lowest near the rostral bank of the central sulcus. Current thresholds increased incrementally in more rostral stimulation sites. Movements evoked with currents >60 μA were likely in PMd or PMv and not in M1. Sites that evoked trunk movements near the spur of the arcuate sulcus were on the same mediolateral level as the M1 grasp zone and confirmed the territory of PMd. Approximately 5 mm lateral to the spur of the arcuate sulcus was the medial aspect of the grasp zone that characterized the hand representation of the PMv.
Organization of parietal cortex grasp zone
In two cases (Fig. 5C,D), electrode penetrations were systematically placed in the region between the medial bank of the intraparietal sulcus and the caudal bank of the central sulcus to determine whether a grasp zone exists. The approximate locations of the hand representations were especially targeted on the assumption that they may also be the locations of a parietal cortex grasp zone. Indeed, long train electrical stimulation evoked opposition between digits 1 and 2 in the contralateral hand, a movement reminiscent of grasping, from a small zone on the cortical convexity. Sites that evoked flexions of D1 alone were interspersed within this grasp zone. Multiunit recordings in case 09-51 directly showed that this grasp zone overlapped receptive fields of digits 1 and 2 in area 2. The grasp zone extended caudally slightly beyond area 2 into a territory where multiunits were unresponsive to body stimulation and was presumed to be area 5. The grasp zone was larger in case 09-20. The receptive fields of this zone were not mapped with multiunit recordings. Nevertheless, architectonic results showed that it mostly overlapped area 2 and encroached only slightly into area 1 rostrally and area 5 caudally (Fig. 5D). The spatial location of this grasp zone in relation to the two receptive field maps in this study and in previous work (Pons et al., 1985), suggest that this grasp zone overlapped lateral aspects of area 2. In the present cases, electrical stimulation did not evoke movements from the lateral bank of the intraparietal sulcus and adjacent cortex.
M1/PM connections
M1 grasp zone
A grasp zone was consistently identified on the dorsolateral surface of M1. Connections were investigated in all four cases and the distributions of labeled cells are presented in Table 2.
Table 2.
Distributions of cells labeled from seven injections into M1/PM
| M1 grasp |
PMv grasp |
M1 orofacial 10-29 FR 4325 |
|||||
|---|---|---|---|---|---|---|---|
| 10-29 DY 6743 |
10-50 FR 4106 |
09-51 CTB 14,129 |
09-20 FB 5345 |
10-29 CTB 13,870 |
10-50 CTB 31,917 |
||
| Frontal cortex | |||||||
| M1 | Inj | Inj | Inj | Inj | 36.64 | 24.64 | Inj |
| PMd | 12.13 | 37.38 | 39.11 | 43.00 | 6.65 | 1.22 | 25.56 |
| PMv | 24.68 | 14.69 | 24.44 | 10.88 | Inj | Inj | 43.86 |
| SMA | 23.82 | 7.92 | 16.46 | 15.03 | 15.19 | 6.93 | 5.64 |
| CMAd | 23.70 | 5.35 | 0.99 | 11.74 | 1.25 | 0.68 | — |
| CMAv | 0.51 | 0.32 | 0.15 | 2.30 | 2.34 | — | — |
| CMAr | — | — | 3.03 | — | — | 0.52 | — |
| FEF | — | — | — | — | — | 0.66 | — |
| PS | — | — | — | — | 0.17 | — | — |
| PFC | — | — | — | — | — | 0.63 | — |
| Prco | — | 0.37 | 0.38 | — | 0.35 | 2.23 | — |
| Subtotal | 84.85 | 66.04 | 84.55 | 82.95 | 62.60 | 37.57 | 75.06 |
| Anterior parietal cortex | |||||||
| 3a | 5.83 | — | 0.25 | 2.87 | 0.51 | — | 3.77 |
| 3b | 0.19 | 1.20 | — | — | — | 3.02 | 0.95 |
| 1 | — | 3.59 | — | — | — | 1.00 | 0.99 |
| 2 | — | 5.16 | 0.25 | — | 0.15 | 0.27 | 5.76 |
| S2/PV | 3.51 | 3.40 | 1.94 | 0.63 | 12.67 | 19.05 | 4.00 |
| PR | — | — | — | — | — | 1.50 | 0.74 |
| Subtotal | 9.53 | 13.35 | 2.43 | 3.50 | 13.32 | 24.83 | 16.22 |
| Insula and LS fundus | 0.45 | — | 1.90 | 2.17 | 0.79 | 4.47 | 0.37 |
| Posterior parietal cortex | |||||||
| 5 | — | 2.93 | 2.65 | 0.36 | 1.03 | — | 2.06 |
| PEip | 0.83 | 9.39 | 2.17 | — | 7.74 | — | — |
| Caudal medial bank IPS | 0.25 | 0.22 | — | — | — | — | — |
| MIP | — | 4.28 | 0.23 | 1.54 | — | — | — |
| AIP | 0.61 | 0.34 | 0.71 | — | 1.90 | 6.91 | — |
| VIP | 0.30 | 2.52 | 4.07 | 5.61 | 0.66 | 1.08 | — |
| LIP | — | — | — | — | — | — | 0.44 |
| PF | 0.52 | 0.32 | — | — | 7.68 | 20.95 | 5.62 |
| PFG | 0.28 | 0.54 | 1.13 | — | 1.37 | 1.37 | — |
| PG | — | — | — | — | 0.46 | 0.40 | — |
| 7b | 2.33 | — | — | 3.61 | 2.10 | — | — |
| Subtotal | 5.13 | 20.54 | 10.96 | 11.13 | 22.94 | 30.72 | 8.12 |
Rows sequentially list the M1/PM functional zones, case number of each monkey, tracer injected, and total numbers of labeled cells excluding cells labeled in the local cortical area of the injection. Cortical fields are listed in the first column, and the successive columns contain the respective percentage of labeled cells. Cells labeled in the local injection location are listed as “Inj,” and concentrations <0.1% are listed as “—.”
A DY injection in lateral aspects of the grasp zone was near the lip of the rostral bank of the central sulcus (case 10-29) (Fig. 5A). This was the most caudal of the M1 injections and primarily labeled cells that overlapped the grasp and supination zones or were in the same mediolateral extent as those zones, but in the rostral bank of the central sulcus (Fig. 6). A smaller proportion of labeled cells overlapped zones that involved proximal forelimb movements. Beyond M1, labeled cells were primarily in frontal cortex motor regions (85%). Labeled cells were equally distributed among the SMA, the dorsal cingulate motor area (CMAd), and PMv. The majority of the cells labeled in SMA were on the medial wall. A large proportion of cells labeled in PMv overlapped the small grasp zone, which was posterior to the caudal bank of the inferior arcuate sulcus. This concentration of labeled cells extended rostrally and laterally within the caudal bank of the inferior arcuate sulcus, likely into other divisions of PMv (Gerbella et al., 2011). Cells were also labeled more caudally within PMv and overlapped the orofacial zone. The next densest concentration of labeled cells was in PMd, where it overlapped zones of forearm supination and forelimb-to-body. The densest concentration of labeled cells outside of frontal cortex motor regions was in anterior parietal cortex (10%), largely in areas 3a and S2/PV. Cells labeled in area 3a were at the same mediolateral extent as the grasp and forearm supination zones in M1. Approximately 5% of labeled cells were in posterior parietal cortex (PPC), and they were primarily in area 7b in caudal aspects of the upper bank of the lateral sulcus. The remainder of the labeled cells was near equally distributed among the PEip, ventral intraparietal area (VIP), AIP, and areas PF and PFG of the inferior parietal lobe.
Figure 6.

The distributions of cells labeled from a DY injection into the M1 grasp zone (blue) and a CTB injection into the PMv grasp zone (red). Each filled circle represents a labeled cell. Injection cores are represented in light blue and pink to facilitate identification from dense concentrations of labeled cells. The illustration is a composite of multiple flattened sections that were aligned according to the locations of blood vessels, tissue artifact, and microlesions. Cells labeled from the PMv injection completely obscure the PMv grasp zone; cross-reference the map in Figure 5A. The distributions of the two cell populations were similar in frontal cortex, but they were largely segregated in parietal cortex. The cortical borders of areas 3a, 3b, 1, were readily apparent from architectonic sections and are marked with solid black lines. Receptive field mapping confirmed the borders of areas 1 and 2. The solid line separating areas 2 and 5 represents the mediolateral extent of receptive field mapping. The medial and lateral extensions of this border were estimated from architectonic sections and are represented with dashed lines. The border separating M1 from premotor cortex was estimated from current thresholds for evoking movements with electrical stimulation and is marked with a dashed line. The lips of sulci are represented as solid gray lines, whereas the fundi are represented as dashed gray lines.
A FR injection was primarily in the M1 grasp zone but also encroached into the adjacent forearm supination zone (case 10-50) (Fig. 5B). This FR injection was slightly more rostral than the injection in case 10-29. Although the present injection also primarily labeled cells within the mediolateral extent of the M1 grasp and forearm supination zones, the distribution of cells labeled beyond M1 was somewhat different from that in case 10-29. Most labeled cells were in frontal cortex motor regions (66%) and more than one-half of those cells were in PMd, mostly in its lateral aspects (Fig. 7). The next densest concentration of labeled cells was in PMv in the caudal bank of the inferior arcuate sulcus and at the same mediolateral level as the PMv grasp zone. Smaller concentrations of labeled cells were in SMA and CMAd. The densest concentration of labeled cells outside of frontal cortex motor regions was in posterior parietal cortex (21%). Those labeled cells were primarily in two clusters in the medial bank of the intraparietal sulcus. The lateral cluster was at the same mediolateral level as the M1 injection and extended rostrally into area 5 and caudally into the expected location of VIP. The medial cluster was less dense and overlapped the expected location of the MIP. Only a few labeled cells were in the tip and lateral bank of the intraparietal sulcus and in the inferior parietal lobe. The next densest concentration of labeled cells was in the anterior parietal cortex (13%), and it was near equally distributed among areas 1, 2, and S2/PV. Only a few labeled cells were in area 3b.
Figure 7.

The distributions of cells labeled from a FR injection into the M1 grasp zone (blue) and a CTB injection into the PMv grasp zone (red). Cells labeled from the PMv injection completely obscure the PMv grasp zone; cross-reference the map in Figure 5B. The distributions of the two cell populations were similar in frontal cortex, but they were largely segregated in parietal cortex. The cortical borders of areas 3a, 3b, 1, and 2 were readily apparent from architectonic sections and are marked with solid black lines. The border separating M1 from premotor cortex was estimated from current thresholds for evoking movements with electrical stimulation and is marked with a dashed line. The lips of sulci are represented as solid gray lines, whereas the fundi are represented as dashed gray lines.
A CTB injection in lateral aspects of the grasp zone (case 09-51) (Fig. 5C) was more rostral than the previous two injections. The distribution patterns of cells labeled from this injection shared features of the patterns revealed from the two previous injections. Labeled cells were primarily in M1 and overlapped the grasp and forearm supination zones and extended within the same mediolateral level into the rostral bank of the central sulcus. Beyond M1, labeled cells were primarily in frontal cortex motor regions (85%) and nearly one-half of those cells were in PMd (Fig. 8). The next densest concentration of labeled cells was in PMv and was near equally distributed between the posterior bank of the inferior arcuate sulcus and the adjacent lip. Although this territory was not mapped in the present case, mapping results from the previous two cases suggest that the cells labeled in PMv on the dorsolateral surface would have overlapped the PMv grasp zone. A less dense concentration of labeled cells was in SMA. Three separate and sparse clusters of labeled cells were in cingulate motor areas. The densest concentration of cells labeled outside of frontal cortex motor regions was in PPC (11%). Those cells were primarily distributed within the vicinity of VIP, the rostral bank of the intraparietal sulcus, and area 5. Most cells labeled in PPC were at the approximate mediolateral level of the grasp and forearm supination zones of M1. Small concentrations of labeled cells overlapped MIP, AIP, and the adjacent PFG. Fewer labeled cells were in the anterior parietal cortex (2%), and they were primarily in areas S2/PV. Only a few labeled cells were in areas 3a and 2. Small concentrations of labeled cells were in insular cortex and the adjacent lower bank of the lateral sulcus.
Figure 8.

The distributions of cells labeled from a CTB injection into the M1 grasp zone (blue) and a FR injection into the area 2 grasp zone (red). Cells labeled from the M1 grasp injection obscure most of the M1 grasp zone; cross-reference the map in Figure 5C. The two cell populations intermingled in caudal aspects of M1, PFG, and S2/PV, but were otherwise spatially segregated. The cortical borders of areas 3a, 3b, and 1 were readily apparent from architectonic sections and are marked with solid black lines. Receptive field mapping confirmed the borders of areas 1 and 2. The solid line separating areas 2 and 5 represents the mediolateral extent of receptive field mapping. The medial extension of this border was estimated from architectonic sections and is represented as a dashed line. The border separating M1 from premotor cortex was estimated from current thresholds for evoking movements with electrical stimulation and is marked with a dashed line. The lips of sulci are represented as solid gray lines, whereas the fundi are represented as dashed gray lines.
A FB injection in rostral aspects of the M1 grasp zone (case 09-20) (Fig. 5D) was the most rostral of all of the M1 injections. The distribution patterns of labeled cells shared features of the previous injections. Most labeled cells overlapped the M1 grasp zone or were in the rostral bank of the central sulcus at the same mediolateral level as the grasp, forearm supination, and forelimb zones (Fig. 9). Beyond M1, labeled cells were primarily in frontal cortex motor regions (83%) and nearly one-half of those cells were in PMd. Three separate clusters of labeled cells were in the medial wall primarily distributed between SMA and CMAd and, to a much smaller extent, the ventral cingulate motor area (CMAv). The concentration of cells labeled in PMv was sparser than in the previous injections. Cells labeled in PMv were near equally distributed between the caudal bank of the inferior arcuate sulcus and the adjacent lip. Mapping results from the previous two cases suggest that the relative location of the PMv cells on the dorsolateral surface would have overlapped the PMv grasp zone had this territory been mapped with electrical stimulation. The next densest concentration of labeled cells was in PPC (11%). Those cells were primarily in the medial bank and fundus of the intraparietal sulcus. A separate concentration of labeled cells was in caudal aspects of the upper bank of the lateral sulcus, likely area 7b. The small concentration (3%) of labeled cells in anterior parietal cortex was in area 3a.
Figure 9.

The distributions of cells labeled from a FB injection into the M1 grasp zone (blue) and a CTB injection into the area 2 grasp zone (red). The two cell populations intermingled in the medial bank of the IPS, area 3a, caudal M1, PMv, and motor areas on the medial wall, but were otherwise spatially segregated. The cortical borders of areas 3a, 3b, and 1 were readily apparent from architectonic sections and are marked with solid black lines. The border separating M1 from premotor cortex was estimated from current thresholds for evoking movements with electrical stimulation and is marked with a dashed line. The lips of sulci are represented as solid gray lines, whereas the fundi are represented as dashed gray lines.
PMv grasp zone
Motor mapping extended sufficiently rostral and lateral to the M1 grasp zone in two cases and identified the PMv grasp zone, which was in the lip of the caudal bank of the inferior arcuate sulcus and the adjacent cortex. The connections of the PMv grasp zone were investigated in both cases and the distributions of labeled cells are presented in Table 2.
A CTB injection into the center of the PMv grasp zone (case 10-29) (Fig. 5A) primarily labeled cells within PMv. Most of those cells overlapped the grasp zone and extended rostrally, but within the same mediolateral level, into the caudal bank of the inferior arcuate sulcus (Fig. 6). The same concentration of labeled cells extended lateral to the PMv grasp zone. Beyond PMv, labeled cells were primarily in frontal cortex motor regions (63%). More than one-half of those cells were in M1 and they mostly overlapped the grasp zone or were at the same mediolateral level, but in the rostral bank of the central sulcus. The next densest concentration of labeled cells was in SMA primarily on the medial wall. Two separate and smaller clusters of labeled cells were in CMAd and CMAv. Even smaller concentrations of labeled cells were in the lateral bank of the principal sulcus and the frontal operculum. The concentration of labeled cells in PMd primarily overlapped the orofacial zone. The densest concentration of labeled cells outside of frontal cortex motor regions was in PPC (23%). Those cells were primarily in the tip of the intraparietal sulcus and the adjacent PF. Fewer labeled cells were in AIP, the adjacent PFG, and area 7b in caudal aspects of the upper bank of the lateral sulcus. Only small concentrations of labeled cells were in MIP, VIP, and LIP. A dense concentration of labeled cells in anterior parietal cortex (14%) primarily overlapped S2/PV.
A large CTB injection filled the small grasp zone in the caudal lip of the inferior arcuate sulcus (case 10-50) (Fig. 5B). Although this injection was relatively rostral compared with the previous PMv injection, it may have encroached into the adjacent orofacial zone. The injection primarily labeled cells in PMv on the dorsolateral surface and in the caudal bank of the inferior arcuate sulcus (Fig. 7). Cells labeled in PMv medial to the injection primarily overlapped the orofacial zone. Beyond PMv, labeled cells were primarily in frontal cortex motor regions (38%), which is relatively lower than the previous PMv injection. This difference is attributed to higher concentrations of cells labeled in anterior and posterior parietal cortex from the present injection. More than one-half of the cells labeled in frontal cortex from the present injection were in M1. A dense concentration of labeled cells was in SMA on the dorsolateral surface. Only small concentrations of labeled cells were in cingulate motor areas. The densest concentration of labeled cells outside of frontal cortex motor regions was in PPC (33%). More than one-half of those cells were in PF. This dense concentration of labeled cells extended rostrally into lateral aspects of areas 1 and 2, which may have been due to encroachment of the injection into the orofacial zone. A less dense concentration of labeled cells was in the rostral half of the lateral bank of the intraparietal sulcus. Those cells were presumed to be in AIP and cortex at the tip of the intraparietal sulcus. The concentration of labeled cells in AIP extended medially into VIP and laterally into PFG. The other dense concentration of labeled cells outside of frontal cortex was in anterior parietal cortex (25%). Those cells were primarily in S2/PV, and a more rostral but smaller concentration of labeled cells was presumed to be in the rostral parietal area (PR). Patches of cells labeled in the fundus of the lateral sulcus were likely in insular cortex.
M1 orofacial zone
An orofacial zone was immediately lateral and slightly rostral to the M1 grasp zone in all cases (Fig. 5). The orofacial zone extended rostrally into premotor cortex. Higher current thresholds characterized rostral aspects of the orofacial zone. The connections of the M1 orofacial zone were traced in a single case to compare them directly to the connections of the M1 grasp zone (case 10-29) (Fig. 5A). The orofacial zone was targeted because of its proximity to the M1 grasp zone and because it did not include any sites that also evoked forelimb or hand movements. The distributions of labeled cells are presented in Table 2. A FR injection primarily labeled cells in the M1 orofacial zone and adjacent cortex in the rostral bank of the central sulcus (Fig. 10). Beyond M1, labeled cells were primarily in frontal cortex motor regions (75%) and more than one-half of those cells were in PMv. Most of those cells overlapped the orofacial zone in PMv and to a much lesser extent the PMv grasp zone. A dense concentration of labeled cells was in PMd and primarily overlapped the orofacial representation. The small concentration of cells labeled in SMA was near equally distributed between the dorsolateral surface and the medial wall. The densest concentration of labeled cells outside of frontal cortex motor regions was in anterior parietal cortex (17%). Those cells were primarily in areas 3a, 2, and S2/PV. The cells labeled in areas 3a and 2 were lateral to the architectonically defined hand/face border. The remainder of the labeled cells was in PPC (8%) and primarily overlapped PF. Only a few cells were labeled in the intraparietal sulcus, and they were primarily in the lateral bank and the fundus.
Figure 10.

The distributions of cells labeled from a DY injection into the M1 grasp zone (blue) and a FR injection into the M1 orofacial zone (red). The two cell populations intermingled in PMd, PMv, and SMA, but were otherwise spatially segregated. Conventions for cortical borders are the same as in Figure 6.
Parietal cortex connections
Parietal cortex grasp zone
Long train electrical stimulation identified a grasp zone in two cases in parietal cortex. The spatial location of those grasp zones, architectonic results, and multiunit recordings confirmed that they primarily overlapped area 2. The connections were investigated in both cases and the distributions of labeled cells are presented in Table 3.
Table 3.
Distributions of cells labeled from three injections into parietal cortex
| Area 2 grasp |
PFG 09-20 DY 4949 |
||
|---|---|---|---|
| 09-51 FR 781 |
09-20 CTB 18,406 |
||
| Frontal cortex | |||
| M1 | 4.62 | 2.80 | — |
| PMd | 0.90 | — | 0.93 |
| PMv | — | 0.24 | 2.81 |
| SMA | — | 1.02 | 0.23 |
| CMAd | — | 0.19 | — |
| CMAv | — | — | 0.60 |
| CMAr | — | — | — |
| CMAc | — | — | 1.05 |
| Subtotal | 5.52 | 4.26 | 5.63 |
| Anterior parietal cortex | |||
| 3a | 2.31 | 6.87 | — |
| 3b | 32.35 | 45.37 | — |
| 1 | 21.18 | 16.10 | — |
| 2 | Inj | Inj | — |
| S2/PV | 15.28 | 5.42 | 5.67 |
| Subtotal | 71.12 | 73.76 | 5.67 |
| LS fundus | — | — | 0.97 |
| Posterior parietal cortex | |||
| 5 | 18.49 | — | |
| PEc | — | — | 3.08 |
| PEip | 0.39 | 11.96 | — |
| Caudal medial bank IPS | — | — | 14.11 |
| MIP | — | — | 1.72 |
| AIP | 0.26 | — | 22.48 |
| VIP | 0.26 | 9.64 | 6.64 |
| PF | — | — | 19.28 |
| PFG | 3.21 | — | Inj |
| PG | 0.51 | — | 14.33 |
| PGm | — | — | 4.49 |
| 7b | 0.26 | — | 1.37 |
| Subtotal | 23.36 | 21.60 | 87.49 |
Rows sequentially list the M1/PM functional zones, case number of each monkey, tracer injected, and total numbers of labeled cells excluding cells labeled in the local cortical area of the injection. Cortical fields are listed in the first column, and successive columns contain the respective percentage of labeled cells. Cells labeled in the local injection location are listed as “Inj,” and concentrations <0.1% are listed as “—.”
A small FR injection in the center of the parietal cortex grasp zone (case 09-51) (Fig. 5C) primarily labeled cells within the grasp zone and its vicinity (Fig. 8). Beyond area 2, cells were primarily labeled in anterior parietal cortex (71%). The majority of those cells were in a narrow strip that extended across the hand representations of areas 3b and 1. Only a small concentration of cells was in area 3a and it was along the same mediolateral extent. A separate and dense concentration of labeled cells was in areas S2/PV. The next densest concentration of cells outside of anterior parietal cortex was in PPC (22%). Most of those cells were on the cortical surface directly caudal to the grasp zone. Receptive field mapping suggested that those labeled cells overlapped area 5. A small concentration of labeled cells was in PFG. Frontal cortex motor regions contained only a small proportion of labeled cells (6%), and they were primarily in M1 in the rostral bank of the central sulcus, and at the same mediolateral level as the grasp zone. The few cells on the M1 cortical surface overlapped the grasp zone.
A CTB injection in the center of the parietal cortex grasp zone (case 09-20) (Fig. 5D) labeled a much larger concentration of cells than the previous area 2 grasp injection, but the distributions were comparable in both cases (Fig. 9). Beyond area 2, cells were primarily labeled in anterior parietal cortex (74%). Most of those cells were arranged along a narrow strip in areas 3b and 1 that likely overlapped the hand representations. A smaller concentration of labeled cells was in area 3a in the same mediolateral extent and a comparable concentration of labeled cells was in areas S2/PV. The densest concentration of labeled cells outside of anterior parietal cortex was in PPC (22%). Approximately one-half of those cells were in the medial bank of the intraparietal sulcus at the same mediolateral extent as the grasp zone. Separate patches of labeled cells were in the medial bank of the intraparietal sulcus and VIP. Similar to the previous injection, frontal cortex motor regions had the smallest concentration of labeled cells (4%). Most of those cells were in M1 in the rostral bank of the central sulcus. Cells labeled on the dorsolateral surface of M1 overlapped the grasp zone. Small patches of labeled cells were in SMA, CMAd, CMAv, and PMv.
PFG
Electrical stimulation of the lateral bank of the intraparietal sulcus and inferior parietal lobe failed to evoke movements in the present cases. Nevertheless, a DY injection was delivered into PFG (case 09-20) to directly compare its connections with the connections of the parietal cortex grasp zone and the connections of the M1 grasp zone. PFG was targeted because its functions and connection patterns are similar to those of AIP (Rozzi et al., 2006, 2008), with the additional advantage of accessibility on the cortical surface. The distributions of labeled cells are presented in Table 3. Labeled cells were primarily within PFG (Fig. 11), but beyond that they were mostly concentrated in other parts of PPC (75%). The densest concentrations of those cells were in AIP and PF. Less dense concentrations of cells were in PG and caudal aspects of the medial bank of the IPS. Smaller concentrations of cells were in VIP, 7b in the upper bank of the lateral sulcus, and PGm (area medial PG) on the medial wall. The anterior parietal cortex had the next densest concentration of cells (7%), which was primarily in areas S2/PV. Only a small concentration of cells was in frontal cortex motor regions (6%), and one-half of those cells were in PMv.
Figure 11.

The distributions of cells labeled from a CTB injection into the area 2 grasp zone (red) and a DY injection into area PFG in the inferior parietal lobe (blue). The two cell populations intermingled in the medial bank of the IPS and the upper bank of the lateral sulcus, but were otherwise spatially segregated. Conventions for cortical borders are the same as in Figure 9.
Topography of grasp zone connections
Injecting multiple zones in each case facilitated direct comparisons of the topographical organization of their connections. Five comparisons were particularly pertinent.
First, directly comparing the connections of the M1 and PMv grasp zones was possible in two cases. Injections in both grasp zones in case 10-29 showed substantial overlap in frontal cortex motor regions between the two populations of labeled cells (Fig. 6). This was particularly apparent in the M1 and PMv grasp zones and in caudal M1 in the rostral bank of the central sulcus. The two populations also overlapped in SMA, CMAd, CMAv, and CMAr. Both populations intermingled in the upper bank of the lateral sulcus. Despite the overlap and intermingling of the two populations in the medial wall and in the upper bank of the lateral sulcus, cells labeled from the M1 injection were in the main caudal to the cells labeled from the PMv injection. Distribution differences between the two populations were more apparent in PPC. The PMv injection labeled a higher proportion of cells in the intraparietal sulcus than the M1 injection. The small number of cells labeled from the M1 injection was primarily in the medial bank of the intraparietal sulcus and was spatially segregated from cells labeled from the PMv injection. The few cells labeled in the tip of the intraparietal sulcus, AIP, PF, and PFG overlapped the denser clusters of cells labeled from the PMv injection.
Injections in the M1 and PMv grasp zones in case 10-50 labeled two populations of cells (Fig. 7) that had similar spatial relationship as in the previous case. An apparent difference between the present case (10-50) and the previous case (10-29) was that there was less overlap between the two populations of labeled cells in M1, the medial wall, and the upper bank of the lateral sulcus. Slight differences in injection locations in the two cases may explain these differences (Fig. 5A,B). Both injections in case 10-50 labeled more cells in PPC than the counterpart injections in case 10-29, and the two populations of cells were more clearly segregated in case 10-50. This was most apparent in the intraparietal sulcus where the cells labeled from the M1 injection were primarily in the medial bank, whereas the cells labeled from the PMv injection were in the lateral bank and tip.
Second, comparisons of cell distributions from injections into the M1 and area 2 grasp zones were possible in two cases. The comparison is somewhat complicated in case 09-51 because the M1 injection labeled nearly 18 times more cells than the area 2 injection. Nevertheless, the two populations intermingled in caudal M1, PFG, and areas 5 and S2/PV (Fig. 8). Other cortical fields included cells almost exclusively labeled from the M1 injection (PMd, SMA, and cingulate motor areas) or cells labeled from the area 2 injection (areas 3a, 3b, 1, and 2).
Injections into the M1 and area 2 grasp zones labeled more comparable numbers of cells in case 09-20. The two populations of labeled cells intermingled in M1, PMv, area 3a, motor areas on the medial wall, and the rostral bank of the intraparietal sulcus (Fig. 9). Cells labeled from the M1 grasp zone injection were distinctly more caudal within the upper bank of the lateral sulcus compared with cells labeled from the injection in the area 2 grasp zone. Other cortical fields included cells almost exclusively labeled from the M1 injection (PMd and the lower bank of the lateral sulcus) or cells labeled from the area 2 injection (areas 3b, 1, and 2).
Third, injections into the M1 grasp and orofacial zones labeled largely segregated cell populations (case 10-29) (Fig. 10). With the exception of some intermingling near the M1 hand/face border, cells labeled from the injection into the M1 grasp zone were medial to cells labeled from the injection into the M1 orofacial zone. Cells labeled in SMA from the injection into the M1 grasp zone were mostly caudal to cells labeled from the injection into the M1 orofacial zone, as expected from the somatotopy of SMA (Gould et al., 1986; Mitz and Wise, 1987). The two populations intermingled more within PMd and PMv. In contrast, the two populations were completely segregated in parietal cortex. Cells labeled from the injection into the M1 grasp zone were distinctly caudal within the upper bank of the lateral sulcus compared with cells labeled from the injection into the M1 orofacial zone. Also, cells labeled in area 2 from the injection into the M1 orofacial zone were lateral to those labeled in parietal cortex from the injection into the M1 grasp zone. Cells labeled in the intraparietal sulcus from the injection into the M1 grasp zone were primarily in its rostral and caudal aspects, whereas the few cells labeled from injection into the M1 orofacial zone were in between those two clusters, possibly in LIP.
Fourth, injections into the area 2 grasp zone and PFG labeled largely segregated cell populations (case 09-20) (Fig. 11). Intermingling between the two populations was limited to rostral aspects of the medial bank of the intraparietal sulcus as well as areas S2/PV.
Fifth, injections into the M1 grasp zone and PFG also labeled two largely segregated cell populations (case 09-20) (Fig. 12). Exceptions were apparent in the medial bank of the intraparietal sulcus, PMv, and S2/PV, where the two populations overlapped. The two populations also intermingled in CMAv, SMA, and the lower bank of the lateral sulcus.
Figure 12.

The distributions of cells labeled from a FB injection into the M1 grasp zone (blue) and a DY injection into area PFG (red). The two cell populations intermingled in the medial bank of the IPS, upper and lower banks of the lateral sulcus, PMv, and the medial wall, but were otherwise spatially segregated. Conventions for cortical borders are the same as in Figure 9.
Summary of grasp zones connections
Variability across cases
The connections of each grasp zone were investigated with two or four injections. The connection patterns revealed for each grasp zone varied somewhat across cases. Contributing factors include the identification of cortical borders in flattened sections of cortex. This may have influenced the characterization of the identity of labeled cells. Cortical areas in and near the vicinity of the intraparietal sulcus and the cingulate sulcus were particularly susceptible to this limitation. However, this caveat was likely not a factor in the broader characterization of cells as belonging to frontal cortex, anterior parietal cortex, or posterior parietal cortex. Differences in injection sizes may have been another contributing factor. Small injections may not have revealed all the expected connections, and large injections may have contaminated adjacent cortical fields. Some of the variations in the two injections in the area 2 grasp zones and the two injections in the PMv grasp zones may be attributed to this limitation. Differences in injection locations within a grasp zone may have also contributed to the variations in the connection patterns. This limitation is perhaps most relevant to the injections in the M1 grasp zones.
M1 grasp zone
Four injections into the M1 grasp zone showed that on average 80% of the connections were with frontal cortex motor regions (Fig. 13A). Most of those connections originated from PMd and PMv on the dorsolateral surface. Relatively caudal aspects of the M1 grasp zone were more densely connected with PMv compared with more rostral aspects of this grasp zone, which were more preferentially connected with PMd. The M1 grasp zone received most of its medial wall connections from SMA and to a lesser extent CMAd. Connections with anterior parietal cortex comprised on average 7% of the total inputs and were almost equally distributed between areas 3a and S2/PV. Approximately 1% of the total inputs were from the insular cortex. PPC contributed on average 12% of the total connections. A large proportion of those connections originated from the medial bank of intraparietal sulcus and the adjacent cortical surface (area 5). VIP consistently contributed connections. Only a small proportion of connections was from area 7b in the upper bank of the lateral sulcus.
Figure 13.
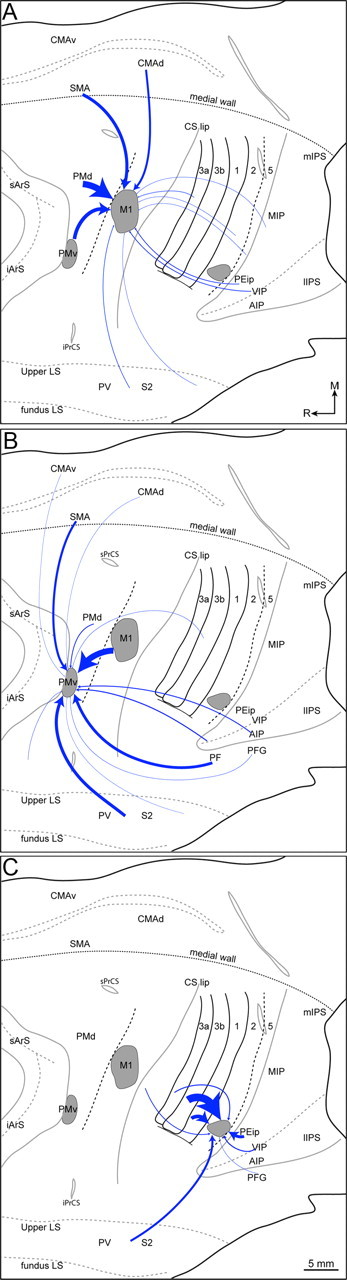
Summary of the main sensory and motor connections for three grasp zones (gray zones) in M1 (A), PMv (B), and area 2 (C). Flattened cortical sections were cropped to focus on frontal and parietal cortex. The thickness of each arrow is proportional to the mean density of the connection and was calculated from the values in Tables 2 and 3. Illustrations are limited to connections that formed at least 1% of the total connections of a given zone. Scale bar: 5 mm (applies to all panels).
PMv grasp zone
Two injections into the PMv grasp zone showed that on average 50% of its connections were with frontal cortex motor regions (Fig. 13B). More than one-half of those connections were with M1. Another large contribution was from SMA. Inputs from PMd, CMAv, and the parietal operculum were minor. On average, 20% of total connections were with anterior parietal cortex, and most originated from areas S2/PV. Small contributions from area 3b and insular cortex were not consistent between cases. On average, 28% of the total connections were with PPC. The largest proportion of these connections originated in PF in the inferior parietal lobe. The remainder of the PPC connections originated primarily from the tip and lateral bank of the intraparietal sulcus (AIP). A small, but consistent contribution was from PFG in the inferior parietal lobe.
Parietal cortex grasp zone
Two injections revealed the connections of the parietal cortex (area 2) grasp zone (Fig. 13C). On average, 72% of the connections were with the somatosensory representations of the hand in the anterior parietal cortex. The densest connections were with area 3b followed by area 1. Relatively less dense connections originated from areas S2/PV and 3a. PPC contributed on average 23% of the total connections, and they originated primarily from VIP, rostral aspects of the medial bank of the IPS, and the adjacent cortical surface (area 5). Connections with the inferior parietal lobe were not consistent between cases. Only 5% of the connections were with the frontal cortex, and they originated primarily from M1 in the rostral bank of the central sulcus from the same mediolateral level as the M1 grasp zone.
Discussion
We studied the organization of the parietal–frontal network that supports grasping in macaque monkeys. Long train electrical stimulation identified grasp zones in M1, PMv, and area 2, which were injected with retrograde tracers to reveal their corticocortical connections. Aligning anatomical connections with neurophysiological maps in flattened sections of cortex aided in the characterization of three distinct, but interrelated, parietal–frontal pathways for grasping.
M1 grasp zone location
Long train electrical stimulation (500 ms) evoked grasping from a zone in M1 that was typically bordered by forearm supination zones. Interspersed stimulation sites evoked concurrent grasping and forearm supination. Similar movements were evoked from this location using the same stimulation parameters (Graziano et al., 2002). Standard microstimulation parameters (60 ms) in our study and others evoked digit and wrist twitches from the same location (Strick and Preston, 1978; Sessle and Wiesendanger, 1982; Godschalk et al., 1995; Qi et al., 2000). Single unit recordings showed that neuronal activity in similar M1 locations is correlated to grasping (Umilta et al., 2007). Thus, converging evidence confirms that our M1 grasp zone overlaps part of the widely accepted M1 hand representation.
M1 grasp zone connections
The M1 grasp zone was primarily connected with frontal cortex motor regions. The functional specialization of the M1 grasp zone for flexing the digits to grasp an object and manipulate it was apparent from its dense local connections within the M1 grasp and forearm supination zones. Clear spatial segregation between the connections of the M1 grasp zone and the connections of the M1 orofacial zone, despite the proximity of the respective injections, further supports the functional specialization of the M1 grasp zone. The distributions of the M1 grasp zone connections among PMd, PMv, SMA, and cingulate motor areas are similar to those reported previously for the hand representations in Old and New World monkeys (Jones et al., 1978; Ghosh et al., 1987; Darian-Smith et al., 1993; Stepniewska et al., 1993; Dum and Strick, 2005).
Direct somatosensory inputs to the M1 grasp zone were limited to minor connections with areas 3a and S2/PV, as reported previously for the M1 hand representation (Jones et al., 1978; Darian-Smith et al., 1993). Connections with PPC were consistently denser and originated primarily from area 5, adjacent medial bank of the IPS, and the fundus of the IPS in the expected locations of the VIP. These inputs are likely an important source of higher order sensory information. Somatosensory and visual responses characterize VIP neurons (Colby et al., 1996). Multiunit activity in area 5 suggests that it is primarily responsive to joint manipulations (Pons et al., 1985; Padberg et al., 2010). Single-unit recordings revealed the involvement of a subpopulation of the neurons in area 5 and the adjacent medial bank of the IPS in forelimb and hand actions (Mountcastle et al., 1975). Subsequent studies correlated neuronal activity recorded in medial aspects of these cortical fields with the forelimb transport phase of reaching (Crammond and Kalaska, 1989; Caminiti et al., 1999), whereas neuronal activity recorded in lateral aspects of the same cortical fields were more closely associated with hand shaping during grasping (Gardner et al., 2007a). Although relating the spatial distributions of the PPC fields that project to the present M1 grasp zone with the previously reported recording results is complicated, a substantial degree of overlap is apparent. Connections with the fundus of the IPS likely relay multisensory information (visual and somatosensory) characteristic of VIP (Colby et al., 1996). Similar connections linking M1 with PPC may have been reported previously (Strick and Kim, 1978; Petrides and Pandya, 1984; Ghosh et al., 1987; Darian-Smith et al., 1993), but the present injections were in a physiologically defined M1 grasp zone, which leaves little doubt about their functional pertinence. We propose that the connections linking the M1 grasp zone with area 5 and the adjacent medial bank and fundus of the IPS form a parietal–frontal pathway involved in grasping. The M1 node of this pathway also receives dense motor inputs from frontal cortex and weak somatosensory inputs from parietal cortex.
PMv grasp zone location
Long train electrical stimulation identified a grasp zone in rostral aspects of PMv. Similar movements were evoked from this location using the same stimulation parameters (Graziano et al., 2002), and a hand representation was identified there with standard stimulation parameters (Godschalk et al., 1995). Neuronal activities recorded in F5, which is the approximate location of the present grasp zone, were correlated with hand and digit shaping during grasping (Rizzolatti et al., 1988; Murata et al., 1997; Raos et al., 2006; Umilta et al., 2007). Deactivation of the same field impaired grasping (Fogassi et al., 2001). Thus, converging evidence shows that our PMv grasp zone overlaps a cortical field involved in hand shaping.
PMv grasp zone connections
The PMv grasp zone was primarily connected with frontal cortex motor regions, albeit to a lesser extent than the M1 grasp zone. Large proportions of the PMv inputs were from the M1 grasp zone and adjacent cortex in the rostral bank of the central sulcus. Reciprocal connections between the PMv and M1 grasp zones are consistent with their functional specializations. The relative distributions of connections among M1, SMA, PMd, and cingulate motor areas are similar to those reported previously for PMv in Old and New World monkeys (Ghosh et al., 1987; Dum and Strick, 2005; Dancause et al., 2006; Stepniewska et al., 2006).
The PMv grasp zone was more densely connected than the M1 grasp zone with PPC. These connections were from rostral aspects of the inferior parietal lobe such as PF, tip of the intraparietal sulcus, and AIP. These connections were therefore largely segregated from the PPC projections to M1, which originated primarily from more medial fields. The strong correlation between neuronal activity in AIP and grasping (Sakata et al., 1995; Murata et al., 2000), and the grasping impairments that ensue from AIP deactivation (Gallese et al., 1994), support the possibility that at least some of the connections revealed here between the PMv grasp zone and the inferior parietal lobe are involved in grasping. Thus, the differential natures of the PPC projections to M1 and PMv grasp zones, emphasized in their respective densities and spatial segregation, suggest two largely distinct parietal–frontal pathways that may be functionally specialized for different aspects of grasping.
Parietal cortex grasp zone location
Long train electrical stimulation identified a small grasp zone on the cortical surface in between the central sulcus and the IPS. In one monkey, receptive field mapping confirmed that this grasp zone overlapped parts of the representations of digits 1 and 2 in area 2. Architectonics and relative locations of the parietal cortex grasp zones were indeed within the accepted boundaries of area 2 (Pons et al., 1985; Lewis et al., 1999; Padberg et al., 2010). Single unit activity related to object contact during grasping has been reported from the approximate location of the present grasp zone (Gardner et al., 2007b). Although reports of movements evoked by electrical microstimulation in parietal cortex have been limited to defense movements from VIP (Cooke et al., 2003) and eye movements from the lateral intraparietal area (Thier and Andersen, 1996), a grasp zone was reported from a similar cortical field in New World monkeys (Gharbawie et al., 2011). Thus, the identification of a grasp zone with electrical stimulation in area 2 of macaque monkeys is completely novel. It remains to be seen whether additional movements can be evoked from other parts of area 2 or whether grasping movements can be evoked from PPC.
Connections of the parietal cortex grasp zone
The parietal cortex grasp zone was primarily connected with the hand representations of areas 3b, 1, and to a lesser extent areas 3a and S2/PV. This connection pattern further supports the likelihood that this grasp zone overlapped area 2 (Pons and Kaas, 1986). Dense connections with PPC originated in cortical fields immediately caudal to the injection and extended as far caudal as VIP. Although these connections involved the same portions of PPC that projected to the M1 grasp zone, the lack of overlap between the cell populations labeled from the M1 and area 2 injections suggests largely segregated PPC projections of the two grasp zones. Connections with frontal cortex overlapped the M1 grasp zone and adjacent cortex in the rostral bank of the central sulcus, which was also a source of dense local connections for the M1 grasp zone. Connections with PMv and motor areas on the medial wall were weak, but intermingled with the origins of the connections with the M1 grasp zone. Thus, the electrical stimulation results from area 2 and the direct connections between the area 2 grasp zone and caudal M1 strongly support the possibility that the area 2 grasp zone is a node in a parietal–frontal pathway for grasping. Dense somatosensory inputs to the area 2 grasp zone reflect the functional specialization of this pathway and likely distinguish its role from the other two parietal–frontal pathways.
Conclusions
We propose that the parietal–frontal network of grasping is comprised of at least three parallel parietal–frontal pathways (Fig. 14): (1) connections linking the medial bank of the IPS and adjacent area 5 with the M1 grasp zone, (2) connections linking AIP, PF, and PFG with the PMv grasp zone, and (3) connections linking the area 2 grasp zone with caudal M1. Differential densities, origins, and terminations of each pathway likely reflect its functional specialization. Strong connections between the M1 and PMv grasp zones, weak connections between the area 2 and M1 grasp zones, and connections of the three grasp zones with overlapping cortical fields facilitate coordination between the three pathways to generate accurate grasping. Thus, the three parietal–frontal pathways and their respective inputs may comprise the parietal–frontal network of grasping in macaque monkeys. Indeed, the activation patterns reported with fMRI in a recent study (Nelissen and Vanduffel, 2011) of monkeys performing a grasping task support this possibility. Our study extends the proposal that multiple parietal–frontal networks control actions (Wise et al., 1997; Luppino et al., 1999) by showing that a specific parietal–frontal network may be composed of multiple parietal–frontal pathways.
Figure 14.

Summary of the parietal–frontal pathways identified for the three grasp zones (gray zones). The flattened cortical section was cropped to focus on frontal and parietal cortex. The thickness of each arrow is proportional to the density of the connections. The PMv grasp zone was densely connected with parietal cortex; connections were primarily with rostral aspects of the lateral bank of the intraparietal sulcus and adjacent cortex in the inferior parietal lobe. The M1 grasp zone was moderately connected with parietal cortex; connections were primarily with the medial bank of the intraparietal sulcus and adjacent area 5. The area 2 grasp zone was sparsely connected with frontal cortex; connections were primarily with caudal aspects of M1 in the rostral bank of the central sulcus.
Footnotes
This work was supported by National Institutes of Health Grants EY2686 (J.H.K.), NS055843 (I.S.), and NS067017. O.A.G. was supported by successive postdoctoral fellowships from the Natural Sciences and Engineering Research Council of Canada and the Canadian Institutes for Health Research. We are grateful to Dr. Nicole Young, Mary Baldwin, Pooja Balaram, and Barbara O'Brien for assistance with intracortical stimulation mapping. We are grateful to Christina Cerkevich for assistance with somatosensory mapping. Laura Trice provided excellent support for histology, and Mary Feurtado was instrumental to preoperative and postoperative animal care.
References
- Andersen RA, Asanuma C, Essick G, Siegel RM. Corticocortical connections of anatomically and physiologically defined subdivisions within the inferior parietal lobule. J Comp Neurol. 1990;296:65–113. doi: 10.1002/cne.902960106. [DOI] [PubMed] [Google Scholar]
- Borra E, Belmalih A, Calzavara R, Gerbella M, Murata A, Rozzi S, Luppino G. Cortical connections of the macaque anterior intraparietal (AIP) area. Cereb Cortex. 2008;18:1094–1111. doi: 10.1093/cercor/bhm146. [DOI] [PubMed] [Google Scholar]
- Bruce K, Grofova I. Notes on a light and electron microscopic double-labeling method combining anterograde tracing with Phaseolus vulgaris leucoagglutinin and retrograde tracing with cholera toxin subunit B. J Neurosci Methods. 1992;45:23–33. doi: 10.1016/0165-0270(92)90040-k. [DOI] [PubMed] [Google Scholar]
- Caminiti R, Genovesio A, Marconi B, Mayer AB, Onorati P, Ferraina S, Mitsuda T, Giannetti S, Squatrito S, Maioli MG, Molinari M. Early coding of reaching: frontal and parietal association connections of parieto-occipital cortex. Eur J Neurosci. 1999;11:3339–3345. doi: 10.1046/j.1460-9568.1999.00801.x. [DOI] [PubMed] [Google Scholar]
- Cavina-Pratesi C, Monaco S, Fattori P, Galletti C, McAdam TD, Quinlan DJ, Goodale MA, Culham JC. Functional magnetic resonance imaging reveals the neural substrates of arm transport and grip formation in reach-to-grasp actions in humans. J Neurosci. 2010;30:10306–10323. doi: 10.1523/JNEUROSCI.2023-10.2010. [DOI] [PMC free article] [PubMed] [Google Scholar]
- Colby CL, Duhamel JR, Goldberg ME. Ventral intraparietal area of the macaque—anatomic location and visual response properties. J Neurophysiol. 1993;69:902–914. doi: 10.1152/jn.1993.69.3.902. [DOI] [PubMed] [Google Scholar]
- Colby CL, Duhamel JR, Goldberg ME. Visual, presaccadic, and cognitive activation of single neurons in monkey lateral intraparietal area. J Neurophysiol. 1996;76:2841–2852. doi: 10.1152/jn.1996.76.5.2841. [DOI] [PubMed] [Google Scholar]
- Cooke DF, Taylor CS, Moore T, Graziano MS. Complex movements evoked by microstimulation of the ventral intraparietal area. Proc Natl Acad Sci U S A. 2003;100:6163–6168. doi: 10.1073/pnas.1031751100. [DOI] [PMC free article] [PubMed] [Google Scholar]
- Crammond DJ, Kalaska JF. Neuronal activity in primate parietal cortex area 5 varies with intended movement direction during an instructed-delay period. Exp Brain Res. 1989;76:458–462. doi: 10.1007/BF00247902. [DOI] [PubMed] [Google Scholar]
- Dancause N, Barbay S, Frost SB, Plautz EJ, Popescu M, Dixon PM, Stowe AM, Friel KM, Nudo RJ. Topographically divergent and convergent connectivity between premotor and primary motor cortex. Cereb Cortex. 2006;16:1057–1068. doi: 10.1093/cercor/bhj049. [DOI] [PubMed] [Google Scholar]
- Darian-Smith C, Darian-Smith I, Burman K, Ratcliffe N. Ipsilateral cortical projections to areas 3a, 3b, and 4 in the macaque monkey. J Comp Neurol. 1993;335:200–213. doi: 10.1002/cne.903350205. [DOI] [PubMed] [Google Scholar]
- Disbrow E, Litinas E, Recanzone GH, Padberg J, Krubitzer L. Cortical connections of the second somatosensory area and the parietal ventral area in macaque monkeys. J Comp Neurol. 2003;462:382–399. doi: 10.1002/cne.10731. [DOI] [PubMed] [Google Scholar]
- Dum RP, Strick PL. The origin of corticospinal projections from the premotor areas in the frontal lobe. J Neurosci. 1991;11:667–689. doi: 10.1523/JNEUROSCI.11-03-00667.1991. [DOI] [PMC free article] [PubMed] [Google Scholar]
- Dum RP, Strick PL. Spinal cord terminations of the medial wall motor areas in macaque monkeys. J Neurosci. 1996;16:6513–6525. doi: 10.1523/JNEUROSCI.16-20-06513.1996. [DOI] [PMC free article] [PubMed] [Google Scholar]
- Dum RP, Strick PL. Frontal lobe inputs to the digit representations of the motor areas on the lateral surface of the hemisphere. J Neurosci. 2005;25:1375–1386. doi: 10.1523/JNEUROSCI.3902-04.2005. [DOI] [PMC free article] [PubMed] [Google Scholar]
- Fogassi L, Luppino G. Motor functions of the parietal lobe. Curr Opin Neurobiol. 2005;15:626–631. doi: 10.1016/j.conb.2005.10.015. [DOI] [PubMed] [Google Scholar]
- Fogassi L, Gallese V, Buccino G, Craighero L, Fadiga L, Rizzolatti G. Cortical mechanism for the visual guidance of hand grasping movements in the monkey: a reversible inactivation study. Brain. 2001;124:571–586. doi: 10.1093/brain/124.3.571. [DOI] [PubMed] [Google Scholar]
- Galea MP, Darian-Smith I. Multiple corticospinal neuron populations in the macaque monkey are specified by their unique cortical origins, spinal terminations, and connections. Cereb Cortex. 1994;4:166–194. doi: 10.1093/cercor/4.2.166. [DOI] [PubMed] [Google Scholar]
- Gallese V, Murata A, Kaseda M, Niki N, Sakata H. Deficit of hand preshaping after muscimol injection in monkey parietal cortex. Neuroreport. 1994;5:1525–1529. doi: 10.1097/00001756-199407000-00029. [DOI] [PubMed] [Google Scholar]
- Gardner EP, Babu KS, Reitzen SD, Ghosh S, Brown AS, Chen J, Hall AL, Herzlinger MD, Kohlenstein JB, Ro JY. Neurophysiology of prehension. I. Posterior parietal cortex and object-oriented hand behaviors. J Neurophysiol. 2007a;97:387–406. doi: 10.1152/jn.00558.2006. [DOI] [PMC free article] [PubMed] [Google Scholar]
- Gardner EP, Ro JY, Babu KS, Ghosh S. Neurophysiology of prehension. II. Response diversity in primary somatosensory (S-I) and motor (M-I) cortices. J Neurophysiol. 2007b;97:1656–1670. doi: 10.1152/jn.01031.2006. [DOI] [PMC free article] [PubMed] [Google Scholar]
- Gentilucci M, Fogassi L, Luppino G, Matelli M, Camarda R, Rizzolatti G. Functional organization of inferior area 6 in the macaque monkey. I. Somatotopy and the control of proximal movements. Exp Brain Res. 1988;71:475–490. doi: 10.1007/BF00248741. [DOI] [PubMed] [Google Scholar]
- Gerbella M, Belmalih A, Borra E, Rozzi S, Luppino G. Cortical connections of the anterior (F5a) subdivision of the macaque ventral premotor area F5. Brain Struct Funct. 2011;216:43–65. doi: 10.1007/s00429-010-0293-6. [DOI] [PubMed] [Google Scholar]
- Gharbawie OA, Stepniewska I, Kaas JH. Cortical connections of functional zones in posterior parietal cortex and frontal cortex motor regions in New World monkeys. Cereb Cortex. 2011 doi: 10.1093/cercor/bhq260. [DOI] [PMC free article] [PubMed] [Google Scholar]
- Ghosh S, Brinkman C, Porter R. A quantitative study of the distribution of neurons projecting to the precentral motor cortex in the monkey (M. fascicularis) J Comp Neurol. 1987;259:424–444. doi: 10.1002/cne.902590309. [DOI] [PubMed] [Google Scholar]
- Godschalk M, Mitz AR, van Duin B, van der Burg H. Somatotopy of monkey premotor cortex examined with microstimulation. Neurosci Res. 1995;23:269–279. doi: 10.1016/0168-0102(95)00950-7. [DOI] [PubMed] [Google Scholar]
- Gould HJ, 3rd, Cusick CG, Pons TP, Kaas JH. The relationship of corpus callosum connections to electrical stimulation maps of motor, supplementary motor, and the frontal eye fields in owl monkeys. J Comp Neurol. 1986;247:297–325. doi: 10.1002/cne.902470303. [DOI] [PubMed] [Google Scholar]
- Graziano MS, Taylor CS, Moore T. Complex movements evoked by microstimulation of precentral cortex. Neuron. 2002;34:841–851. doi: 10.1016/s0896-6273(02)00698-0. [DOI] [PubMed] [Google Scholar]
- Gregoriou GG, Borra E, Matelli M, Luppino G. Architectonic organization of the inferior parietal convexity of the macaque monkey. J Comp Neurol. 2006;496:422–451. doi: 10.1002/cne.20933. [DOI] [PubMed] [Google Scholar]
- Hinkley LB, Krubitzer LA, Padberg J, Disbrow EA. Visual-manual exploration and posterior parietal cortex in humans. J Neurophysiol. 2009;102:3433–3446. doi: 10.1152/jn.90785.2008. [DOI] [PMC free article] [PubMed] [Google Scholar]
- Jeannerod M, Arbib MA, Rizzolatti G, Sakata H. Grasping objects: the cortical mechanisms of visuomotor transformation. Trends Neurosci. 1995;18:314–320. [PubMed] [Google Scholar]
- Johnson PB, Ferraina S, Bianchi L, Caminiti R. Cortical networks for visual reaching: physiological and anatomical organization of frontal and parietal lobe arm regions. Cereb Cortex. 1996;6:102–119. doi: 10.1093/cercor/6.2.102. [DOI] [PubMed] [Google Scholar]
- Jones EG, Coulter JD, Hendry SH. Intracortical connectivity of architectonic fields in the somatic sensory, motor and parietal cortex of monkeys. J Comp Neurol. 1978;181:291–347. doi: 10.1002/cne.901810206. [DOI] [PubMed] [Google Scholar]
- Krubitzer L, Clarey J, Tweedale R, Elston G, Calford M. A redefinition of somatosensory areas in the lateral sulcus of macaque monkeys. J Neurosci. 1995;15:3821–3839. doi: 10.1523/JNEUROSCI.15-05-03821.1995. [DOI] [PMC free article] [PubMed] [Google Scholar]
- Lewis JW, Burton H, Van Ess DC. Anatomical evidence for the posterior boundry of area 2 in the macaque monkey. Somatosens Mot Res. 1999;16:382–390. doi: 10.1080/08990229970438. [DOI] [PubMed] [Google Scholar]
- Luppino G, Murata A, Govoni P, Matelli M. Largely segregated parietofrontal connections linking rostral intraparietal cortex (areas AIP and VIP) and the ventral premotor cortex (areas F5 and F4) Exp Brain Res. 1999;128:181–187. doi: 10.1007/s002210050833. [DOI] [PubMed] [Google Scholar]
- Maunsell JH, van Essen DC. The connections of the middle temporal visual area (MT) and their relationship to a cortical hierarchy in the macaque monkey. J Neurosci. 1983;3:2563–2586. doi: 10.1523/JNEUROSCI.03-12-02563.1983. [DOI] [PMC free article] [PubMed] [Google Scholar]
- Mitz AR, Wise SP. The somatotopic organization of the supplementary motor area: intracortical microstimulation mapping. J Neurosci. 1987;7:1010–1021. doi: 10.1523/JNEUROSCI.07-04-01010.1987. [DOI] [PMC free article] [PubMed] [Google Scholar]
- Mountcastle VB, Lynch JC, Georgopoulos A, Sakata H, Acuna C. Posterior parietal association cortex of the monkey: command functions for operations within extrapersonal space. J Neurophysiol. 1975;38:871–908. doi: 10.1152/jn.1975.38.4.871. [DOI] [PubMed] [Google Scholar]
- Murata A, Fadiga L, Fogassi L, Gallese V, Raos V, Rizzolatti G. Object representation in the ventral premotor cortex (area F5) of the monkey. J Neurophysiol. 1997;78:2226–2230. doi: 10.1152/jn.1997.78.4.2226. [DOI] [PubMed] [Google Scholar]
- Murata A, Gallese V, Luppino G, Kaseda M, Sakata H. Selectivity for the shape, size, and orientation of objects for grasping in neurons of monkey parietal area AIP. J Neurophysiol. 2000;83:2580–2601. doi: 10.1152/jn.2000.83.5.2580. [DOI] [PubMed] [Google Scholar]
- Nelissen K, Vanduffel W. Grasping-related functional magnetic resonance imaging brain responses in the macaque monkey. J Neurosci. 2011;31:8220–8229. doi: 10.1523/JNEUROSCI.0623-11.2011. [DOI] [PMC free article] [PubMed] [Google Scholar]
- Nelson RJ, Kaas JH. Connections of the ventroposterior nucleus of the thalamus with the body surface representations in cortical areas 3b and 1 of the cynomolgus macaque (Macaca fascicularis) J Comp Neurol. 1981;199:29–64. doi: 10.1002/cne.901990104. [DOI] [PubMed] [Google Scholar]
- Padberg J, Recanzone G, Engle J, Cooke D, Goldring A, Krubitzer L. Lesions in posterior parietal area 5 in monkeys result in rapid behavioral and cortical plasticity. J Neurosci. 2010;30:12918–12935. doi: 10.1523/JNEUROSCI.1806-10.2010. [DOI] [PMC free article] [PubMed] [Google Scholar]
- Pandya DN, Seltzer B. Intrinsic connections and architectonics of posterior parietal cortex in the rhesus monkey. J Comp Neurol. 1982;204:196–210. doi: 10.1002/cne.902040208. [DOI] [PubMed] [Google Scholar]
- Petrides M, Pandya DN. Projections to the frontal cortex from the posterior parietal region in the rhesus monkey. J Comp Neurol. 1984;228:105–116. doi: 10.1002/cne.902280110. [DOI] [PubMed] [Google Scholar]
- Pons TP, Kaas JH. Corticocortical connections of area 2 of somatosensory cortex in macaque monkeys: a correlative anatomical and electrophysiological study. J Comp Neurol. 1986;248:313–335. doi: 10.1002/cne.902480303. [DOI] [PubMed] [Google Scholar]
- Pons TP, Garraghty PE, Cusick CG, Kaas JH. The somatotopic organization of area 2 in macaque monkeys. J Comp Neurol. 1985;241:445–466. doi: 10.1002/cne.902410405. [DOI] [PubMed] [Google Scholar]
- Qi HX, Stepniewska I, Kaas JH. Reorganization of primary motor cortex in adult macaque monkeys with long-standing amputations. J Neurophysiol. 2000;84:2133–2147. doi: 10.1152/jn.2000.84.4.2133. [DOI] [PubMed] [Google Scholar]
- Raos V, Umiltá MA, Murata A, Fogassi L, Gallese V. Functional properties of grasping-related neurons in the ventral premotor area F5 of the macaque monkey. J Neurophysiol. 2006;95:709–729. doi: 10.1152/jn.00463.2005. [DOI] [PubMed] [Google Scholar]
- Rizzolatti G, Camarda R, Fogassi L, Gentilucci M, Luppino G, Matelli M. Functional organization of inferior area 6 in the macaque monkey. II. Area F5 and the control of distal movements. Exp Brain Res. 1988;71:491–507. doi: 10.1007/BF00248742. [DOI] [PubMed] [Google Scholar]
- Rozzi S, Calzavara R, Belmalih A, Borra E, Gregoriou GG, Matelli M, Luppino G. Cortical connections of the inferior parietal cortical convexity of the macaque monkey. Cereb Cortex. 2006;16:1389–1417. doi: 10.1093/cercor/bhj076. [DOI] [PubMed] [Google Scholar]
- Rozzi S, Ferrari PF, Bonini L, Rizzolatti G, Fogassi L. Functional organization of inferior parietal lobule convexity in the macaque monkey: electrophysiological characterization of motor, sensory and mirror responses and their correlation with cytoarchitectonic areas. Eur J Neurosci. 2008;28:1569–1588. doi: 10.1111/j.1460-9568.2008.06395.x. [DOI] [PubMed] [Google Scholar]
- Sakata H, Taira M, Murata A, Mine S. Neural mechanisms of visual guidance of hand action in the parietal cortex of the monkey. Cereb Cortex. 1995;5:429–438. doi: 10.1093/cercor/5.5.429. [DOI] [PubMed] [Google Scholar]
- Sessle BJ, Wiesendanger M. Structural and functional definition of the motor cortex the monkey (Macaca fascicularis) J Physiol. 1982;323:245–265. doi: 10.1113/jphysiol.1982.sp014071. [DOI] [PMC free article] [PubMed] [Google Scholar]
- Stepniewska I, Preuss TM, Kaas JH. Architectonics, somatotopic organization, and ipsilateral cortical connections of the primary motor area (M1) of owl monkeys. J Comp Neurol. 1993;330:238–271. doi: 10.1002/cne.903300207. [DOI] [PubMed] [Google Scholar]
- Stepniewska I, Fang PC, Kaas JH. Microstimulation reveals specialized subregions for different complex movements in posterior parietal cortex of prosimian galagos. Proc Natl Acad Sci U S A. 2005;102:4878–4883. doi: 10.1073/pnas.0501048102. [DOI] [PMC free article] [PubMed] [Google Scholar]
- Stepniewska I, Preuss TM, Kaas JH. Ipsilateral cortical connections of dorsal and ventral premotor areas in New World owl monkeys. J Comp Neurol. 2006;495:691–708. doi: 10.1002/cne.20906. [DOI] [PMC free article] [PubMed] [Google Scholar]
- Strick PL, Kim CC. Input to primate motor cortex from posterior parietal cortex (area 5). I. Demonstration by retrograde transport. Brain Res. 1978;157:325–330. doi: 10.1016/0006-8993(78)90035-5. [DOI] [PubMed] [Google Scholar]
- Strick PL, Preston JB. Multiple representations in the primate motor cortex. Brain Res. 1978;154:366–370. doi: 10.1016/0006-8993(78)90707-2. [DOI] [PubMed] [Google Scholar]
- Thier P, Andersen RA. Electrical microstimulation suggests two different forms of representation of head-centered space in the intraparietal sulcus of rhesus monkeys. Proc Natl Acad Sci U S A. 1996;93:4962–4967. doi: 10.1073/pnas.93.10.4962. [DOI] [PMC free article] [PubMed] [Google Scholar]
- Umilta MA, Brochier T, Spinks RL, Lemon RN. Simultaneous recording of macaque premotor and primary motor cortex neuronal populations reveals different functional contributions to visuomotor grasp. J Neurophysiol. 2007;98:488–501. doi: 10.1152/jn.01094.2006. [DOI] [PubMed] [Google Scholar]
- Wise SP, Boussaoud D, Johnson PB, Caminiti R. Premotor and parietal cortex: corticocortical connectivity and combinatorial computations. Annu Rev Neurosci. 1997;20:25–42. doi: 10.1146/annurev.neuro.20.1.25. [DOI] [PubMed] [Google Scholar]