

Abstract
Objective
Low systemic plasma adiponectin concentrations are associated with abnormalities in hepatic glucose and lipoprotein metabolism in obese people. However, the relationship between the delivery of adiponectin to the liver via the portal vein and hepatic glucose and lipoprotein metabolism is not known.
Materials/Methods
We examined the relationship between hepatic substrate metabolism (glucose rate of appearance (Ra) into plasma and hepatic very low density lipoprotein (VLDL)-triglyceride (TG) and apolipoprotein B-100 (apoB-100) secretion rates; determined by using stable isotope-labeled tracer techniques) and portal vein adiponectin concentration in 8 insulin-resistant, extremely obese subjects (body mass index: 65 ± 7 kg/m2).
Results
Portal vein adiponectin concentration was inversely associated with basal glucose Ra (r = −0.820, P = 0.013) and VLDL-TG (r = −0.823, P = 0.012) and VLDL-apoB-100 (r = −0.787, P = 0.020) secretion rates. Very similar correlations were obtained for radial artery adiponectin, as a result of a mirroring relationship between portal and arterial adiponectin concentrations (r = 0.899, P = 0.002) and the absence of significant arteriovenous concentration differences (P = 0.570). Insulin resistance, assessed with the homeostasis model assessment score, was also strongly associated with hepatic glucose and lipid metabolic parameters, as well as with adiponectin concentrations in the portal vein and radial artery.
Conclusions
These results suggest that adiponectin delivery to the liver, whether via the portal or the systemic circulation, may be an important regulator of basal hepatic glucose, VLDL-TG and VLDL-apoB-100 production rates in obese people, possibly through direct effects on the liver or changes in hepatic insulin sensitivity. However, portal vein adiponectin does not appear to be superior to arterial adiponectin as a marker of hepatic metabolic dysregulation. Additional studies are needed to elucidate the mechanism(s) responsible for the strong association we observed between adiponectin and hepatic substrate metabolism.
Keywords: adipokines, liver metabolism, tracers, stable isotopes
INTRODUCTION
Adiponectin is the most abundant secretory protein produced by adipose tissue [1]. Although plasma concentrations of most adipocyte hormones increase with increasing adiposity, adipose tissue adiponectin gene expression and plasma concentration decrease with increased body fat and increase after weight loss [2-8]. Adiponectin gene expression is similar in subcutaneous upper and lower body fat depots [3] but is lower in visceral than in subcutaneous adipose tissue [9, 10]; adiponectin secretion from subcutaneous and especially visceral fat is reduced with increasing adiposity [11].
Low plasma adiponectin concentrations are associated with several obesity-related metabolic abnormalities, including increased fasting plasma glucose, total plasma triglyceride (TG), very low density lipoprotein (VLDL)-TG and VLDL-apolipoprotein B-100 (apoB-100) concentrations [7, 12-15]. These data suggest that adiponectin influences liver metabolism, because basal hepatic glucose and VLDL production are important determinants of plasma glucose and TG concentrations. Moreover, data from studies conducted in animal models and in isolated human hepatocytes demonstrate that adiponectin is directly involved in the regulation of hepatic glucose and lipid metabolism. Adiponectin decreases postabsorptive hepatic glucose output, stimulates hepatic fatty acid oxidation, suppresses the expression of enzymes involved in hepatic gluconeogenesis and lipogenesis, lowers hepatocyte apoB-100 mRNA and inhibits apoB-100 release, and reduces intrahepatic TG content [16-22].
As the majority (~80%) of blood flow to the liver is delivered via the portal vein [23] and adiponectin secretion is lower from visceral than subcutaneous fat [9, 10], it is likely that systemic plasma adiponectin concentrations do not accurately reflect the delivery of adiponectin to the liver. The purpose of the present study was therefore to evaluate the relationship between the delivery of adiponectin to the liver and hepatic glucose and lipoprotein metabolism. Portal vein and radial artery plasma adiponectin concentrations, hepatic glucose production rate, and hepatic VLDL-TG and VLDL-apoB-100 secretion rates were determined in subjects with extreme obesity, who had large amounts of visceral fat. We hypothesized that portal vein adiponectin concentration would be inversely correlated with hepatic glucose and lipoprotein production.
METHODS
Subjects
Eight extremely obese subjects (6 premenopausal women and 2 men, body mass index (BMI): 65 ± 7 kg/m2, weight: 181 ± 22 kg, age: 40 ± 10 years), who were scheduled to undergo gastric bypass surgery at Barnes-Jewish Hospital, St. Louis, MO, participated in this study. Subjects completed a comprehensive medical evaluation that included a detailed history and physical examination, routine blood tests, and a 12-lead electrocardiogram. All subjects had evidence of insulin resistance, based on either a history of type 2 diabetes or high homeostasis model assessment of insulin resistance (HOMA-IR) score, however none were taking diabetes medications at the time of the study. Subjects were excluded if they had any history or evidence of liver disease, other than nonalcoholic fatty liver disease, had fasting hypertriglyceridemia (≤200 mg/dl) or were taking medications known to cause hepatic steatosis or liver damage or to affect carbohydrate or lipid metabolism. All subjects gave their written, informed consent before participating in this study, which was approved by the Human Research Protection Office of Washington University School of Medicine in St. Louis, MO.
Experimental protocol
Each subject completed a 12-h isotope tracer infusion study to assess glucose, VLDL-TG and VLDL-apoB-100 kinetics, two days before gastric bypass surgery. Subjects were admitted to the Clinical Research Unit at Washington University School of Medicine in the evening before the study, and consumed a standard meal between 1900 h and 2000 h. The following morning, after subjects fasted overnight, a catheter was inserted into a forearm vein to administer stable isotopically-labeled tracers. A second catheter was inserted into a contralateral hand vein, which was heated to 55°C with a thermostatically controlled box, to obtain arterialized blood samples. At 0600 h, a bolus of [1,1,2,3,3-2H5]glycerol was injected, and primed, constant infusions of [5,5,5-2H3]leucine, [2,2-2H2]palmitate, and [6,6-2H2]glucose were initiated to determine hepatic VLDL-TG, VLDL-apoB-100, and glucose production rates as described previously [24-26].
Two days after the isotope tracer infusion study was completed, subjects underwent Roux-en-Y gastric bypass surgery. Surgery was performed in the morning, after subjects fasted overnight. During the operation, blood samples were obtained simultaneously from the radial artery and the portal vein before gastric stapling was initiated. No subject was prescribed a weight loss diet before surgery.
Sample analyses
Plasma glucose concentration was measured by using an automated glucose analyzer (Yellow Spring Instruments, Yellow Springs, OH). Plasma VLDL-TG and VLDL-apoB-100 concentrations were measured by using commercially-available enzymatic (Sigma Chemical, St. Louis, MO) and immunoturbidimetric (Wako Chemicals, Richmond, VA) kits, respectively, as previously described [27]. The immunoturbidimetric assay, which is typically used for measuring total plasma apoB-100 concentration, was modified to provide a reliable measure of VLDL-apoB-100 concentration (limit of detection = 0.6 mg/dl; analytical coefficient of variation (CV) = 3.5%). For validation purposes, we compared VLDL-apoB-100 concentration assessed by using the modified immunoturbidimetric assay after ultracentrifugation with the VLDL particle concentration in whole plasma without ultracentrifugation assessed by proton nuclear magnetic resonance spectroscopy (NMR; LipoScience, Raleigh, NC) in 55 subjects (36 women and 19 men; BMI 18.5-44.5 kg/m2), and found excellent agreement between the two procedures (means±SD: 49.5 ± 18.3 nmol VLDL-apoB-100 per liter plasma from immunoturbidimetry vs 50.9 ± 15.6 nmol VLDL particles per liter plasma from NMR spectroscopy, respectively; Pearson’s r = 0.784). Plasma insulin (intra-assay CV = 2.2-2.4%) and adiponectin (intra-assay CV = 1.8-6.2%) concentrations were measured by using radioimmunoassay kits (Linco Research, St. Louis, MO). The adiponectin assay uses 125I-labeled murine adiponectin and a multi-species adiponectin rabbit antiserum to determine the level of adiponectin in plasma by the double antibody / polyethylene glycol (PEG) technique, in conjunction with adiponectin standards prepared by using recombinant human adiponectin. The concentrations of tumor necrosis factor alpha (TNF-α; intra-assay CV = 3.1-8.5%) and interleukin 6 (IL-6; intra-assay CV = 6.9-7.8%) in plasma were measured with high-sensitivity immunoassays (R&D Systems, Minneapolis, MN). The tracer-to-tracee ratios (TTRs) of plasma glucose, glycerol, palmitate and leucine, glycerol and palmitate in VLDL-TG, and leucine in VLDL-apoB-100 were determined by using gas chromatography-mass spectrometry (Agilent Technologies/HP 6890 Series GC System & 5973 Mass Selective Detector, Hewlett-Packard, Palo Alto, CA) as previously described [24-26]. Paired samples from the portal vein and radial artery from all subjects were analyzed in a single run to eliminate inter-assay variability.
Calculations
Glucose rate of appearance (Ra) in plasma was calculated by dividing the glucose tracer infusion rate by the average plasma glucose TTR during physiological and isotopic steady state conditions; basal glucose Ra provides an index of glucose production by the liver [28].
Hepatic VLDL-TG and VLDL-apoB-100 secretion rates were calculated by multiplying VLDL-TG and VLDL-apoB-100 fractional turnover rates (FTRs) by plasma VLDL-TG and VLDL-apoB-100 concentrations. The FTRs of VLDL-TG and VLDL-apoB-100 and the proportion of fatty acids in VLDL-TG that were derived from systemic plasma free fatty acids (FFA) and nonsystemic fatty acids (originating from nonsystemic sources that are not labeled with tracer during the infusion period, including lipolysis of visceral and intrahepatic TG and hepatic de novo lipogenesis) were determined independently, by fitting the glycerol (for VLDL-TG), leucine (for VLDL-apoB-100), and palmitate (for systemic / nonsystemic fatty acids) TTRs in plasma and in VLDL to multicompartmental models that describe the time courses of plasma tracers and their incorporation into VLDL-TG and VLDL-apoB-100 [26, 27, 29]. The model for bolused glycerol tracer features two tracer incorporation pathways: a fast direct pathway and a slower indirect pathway that accounts for tracer incorporation into and recycling from hepatic lipid stores that turn over and contribute labeled glycerol to VLDL-TG production after the glycerol tracer has disappeared from plasma. The models for constantly infused palmitate and leucine tracers feature a single direct incorporation pathway into VLDL-TG and VLDL-apoB-100, respectively, because two tracer incorporation pathways cannot be adequately resolved.
The HOMA-IR score was calculated from fasting plasma glucose and insulin concentrations [30] to provide an estimate of insulin resistance.
Statistical analyses
All data sets were tested for normality according to the Shapiro-Wilk procedure; variables that were not normally distributed were log-transformed for analysis. A two-tailed Student’s t-test for paired samples was used to evaluate differences between portal vein and radial artery plasma adiponectin, insulin, and TNF-α concentrations. Data for IL-6 could not be normalized even after logarithmic transformation, and were therefore analyzed by using Wilcoxon’s signed ranks test. Pearson’s correlation analysis (Spearman’s correlation analysis for IL-6) and stepwise multiple regression analyses were used to examine associations between variables of interest. Descriptive characteristics are presented as means and 95% confidence intervals (medians and quartiles for IL-6). A P-value <0.05 was considered statistically significant.
RESULTS
Plasma substrate concentrations during the isotope tracer infusion study and arterial and portal vein plasma adiponectin, cytokine, and insulin concentrations obtained during surgery are shown in Table 1. Plasma insulin and IL-6 concentrations were more than two-fold greater in the portal vein than in the radial artery, whereas plasma adiponectin and TNF-α concentrations were not different. Adiponectin concentration in the portal vein correlated directly with its concentration in the radial artery (Figure 1).
Table 1.
Metabolic variables in the study subjects
| Radial artery | Portal vein | P-value | |
|---|---|---|---|
| Glucose (mg/dl)† | 103 (82, 130) | --- | --- |
| HOMA-IR score | 11.2 (4.4, 18) | --- | --- |
| VLDL-triglyceride (mmol/L) | 0.44 (0.19, 0.70) | --- | --- |
| VLDL-apolipoprotein B-100 (mg/L) | 27.4 (14.1, 40.8) | --- | --- |
| Insulin (μU/ml)† | 21.8 (10.9, 43.5) | 48.4 (28.9, 81.2) | 0.020 |
| Adiponectin (μg/ml)† | 9.6 (5.5, 16.6) | 9.0 (5.0, 16.1) | 0.570 |
| Interleukin 6 (pg/ml)‡ | 15.7 (10.7, 48.3) | 33.8 (13.5, 56.3) | 0.050 |
| Tumor necrosis factor α (pg/ml) | 1.63 (1.09, 2.17) | 1.70 (1.20, 2.20) | 0.777 |
Data are means and 95% confidence intervals, except for IL-6 for which medians and quartiles are shown.
Logarithmically transformed for analysis with Student’s paired t-test.
Data could not be normalized after logarithmic transformation and hence analysis was done with Wilcoxon’s signed ranks test.
HOMA-IR, homeostasis model assessment of insulin resistance; VLDL, very low density lipoprotein.
Figure 1.

Relationship between adiponectin concentration in the radial artery and portal vein. Data are log-transformed.
Portal vein adiponectin concentration was inversely correlated with basal glucose Ra (Figure 2) and hepatic VLDL-TG and VLDL-apoB-100 secretion rates, and tended to correlate negatively with the proportion of VLDL-TG derived from nonsystemic fatty acids (and accordingly, positively with the proportion of VLDL-TG derived from systemic plasma FFA) (Figure 3). Radial artery adiponectin concentration did not correlate significantly with hepatic VLDL-apoB-100 secretion rate, but was inversely associated with basal glucose Ra, hepatic VLDL-TG secretion rate, and the proportion of VLDL-TG derived from nonsystemic fatty acids (Figures 2 and 3). Neither portal nor arterial concentrations of IL-6 (all P-values ≥ 0.16) and TNF-α (all P-values ≥ 0.40) were significantly associated with hepatic glucose and lipoprotein kinetics.
Figure 2.

Relationship between adiponectin concentration in the radial artery (left) and portal vein (right) and glucose rate of appearance in plasma. Data for adiponectin concentrations are log-transformed.
Figure 3.
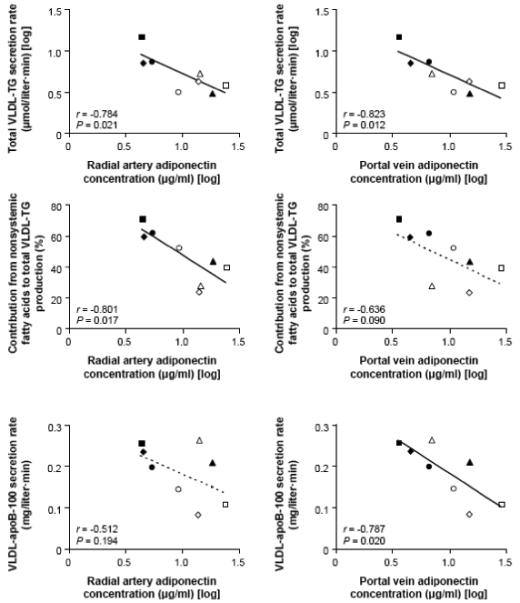
Relationships between adiponectin concentration in the radial artery (left) and portal vein (right) and hepatic VLDL-triglyceride (TG) secretion rate (top), the proportion of VLDL-TG derived from nonsystemic plasma fatty acids (middle), and VLDL-apolipoprotein B-100 (apoB-100) secretion rate (bottom). Data for adiponectin concentrations and VLDL-TG secretion rate are log-transformed.
Portal and arterial adiponectin concentrations correlated negatively with the HOMA-IR score (r = −0.833, P = 0.010 for portal adiponectin; and r = −0.966, P < 0.001 for arterial adiponectin). In addition, HOMA-IR correlated directly with basal glucose Ra (r = 0.775, P = 0.024), total VLDL-TG secretion rate (r = 0.817, P = 0.013), and the proportion of VLDL-TG derived from nonsystemic fatty acids (r = 0.848, P = 0.008), but not with VLDL-apoB-100 secretion rate (r = 0.446, P = 0.268).
Multivariate stepwise regression analyses were performed separately with portal and arterial plasma adiponectin concentrations as predictors, which also included sex, age, BMI, HOMA-IR score, and portal and arterial plasma insulin concentrations among the independent variables. In the model with portal vein adiponectin, adiponectin concentration was the only significant independent determinant of basal glucose Ra, hepatic VLDL-TG secretion rate, and hepatic VLDL-apoB-100 secretion rate, whereas in the model with arterial plasma adiponectin, adiponectin concentration was not an independent determinant of hepatic glucose and lipoprotein kinetics (Table 2).
Table 2.
Predictors of hepatic glucose and lipid kinetics in multiple linear regression analyses
| Dependent variable | Model with arterial adiponectin | Model with portal adiponectin | ||
|---|---|---|---|---|
| Predictors | Estimates | Predictors | Estimates | |
| Basal glucose rate of appearance | HOMA-IR score |
R2 = 60.1% F = 9.0 P = 0.024 |
Portal adiponectin† |
R2 = 67.3% F = 12.3 P = 0.013 |
| VLDL-triglyceride secretion rate† | HOMA-IR score |
R2 = 66.8%, F = 12.1 P = 0.013 |
Portal adiponectin† |
R2 = 67.7% F = 12.6 P = 0.012 |
| Proportion of VLDL-triglyceride from nonsystemic fatty acids |
HOMA-IR score |
R2 = 72.0% F = 15.4 P = 0.008 |
HOMA-IR score |
R2 = 72.0% F = 15.4 P = 0.008 |
| VLDL-apolipoprotein B-100 secretion rate | None | --- | Portal adiponectin† |
R2 = 61.9% F = 9.8 P = 0.020 |
Logarithmically transformed for analysis. Beside portal or arterial adiponectin concentration, the regression models also included sex, age, body mass index, HOMA score, and portal and arterial plasma insulin concentrations among the independent variables.
HOMA-IR, homeostasis model assessment of insulin resistance; VLDL, very low density lipoprotein.
DISCUSSION
Adiponectin concentration is reduced in obesity and is inversely associated with insulin resistance, glucose intolerance, ectopic fat deposition, and dyslipidemia [13]. These abnormalities are reversible by adiponectin treatment in animals, implying that this adipokine is causally linked to the metabolic complications of obesity [16-22]. We hypothesized that adiponectin concentration in the portal vein influences hepatic glucose and lipoprotein metabolism, because the portal vein is responsible for the majority of blood flow to the liver [23] and adiponectin expression in visceral fat, which drains into the portal vein, is lower than adiponectin expression in abdominal subcutaneous fat [9, 10]. The results from the present study demonstrate that portal vein adiponectin concentration is inversely associated with hepatic glucose production and VLDL-TG and VLDL-apoB-100 secretion rates in extremely obese subjects, who presumably have large amounts of visceral fat. However, we also found arterial adiponectin concentration was inversely associated with hepatic glucose production, VLDL-TG secretion and the contribution of nonsystemic fatty acids to total VLDL-TG production. These findings suggest that adiponectin delivery to the liver, derived from both visceral and subcutaneous adipose tissue, is involved in the regulation of hepatic glucose and lipoprotein metabolism in obese people.
Adiponectin acts on the liver by binding to two cell surface receptors, AdipoR1 and AdipoR2 [31]; each isoform likely mediates different metabolic actions of the adipokine on hepatic glucose and lipid metabolism. Binding to AdipoR1 activates AMP-activated protein kinase and leads to suppression of gluconeogenesis and hepatic glucose production, whereas binding to AdipoR2 activates peroxisome proliferator-activated receptor-α signaling pathways and leads to stimulation of hepatic fatty acid oxidation and reduction of intrahepatic TG content [32]. Both receptors have been identified in human liver [33], although information regarding receptor density and distribution is lacking. Therefore, these pathways represent potential mechanisms for direct effects of adiponectin on the liver, which could explain the strong correlations we found between portal vein and radial artery adiponectin and metabolic function.
We found that portal vein and radial arterial adiponectin concentration correlated negatively with basal glucose Ra, an index of glucose production by the liver, consistent with the observations that adiponectin suppresses the expression of gluconeogenic genes, reduces postabsorptive hepatic glucose output and lowers fasting blood glucose concentrations in animals [16-18]. These effects are likely mediated by activation of AMP kinase in the liver [32] resulting in sensitization to the effects of insulin in the basal state, i.e., at sub-physiological plasma insulin concentrations [16]. Previous studies in human subjects with nonalcoholic fatty liver disease [34] and type 2 diabetes [35] have demonstrated a similar inverse relationship between systemic adiponectin concentration and hepatic glucose production assessed by using the euglycemic-hyperinsulinemic clamp procedure.
Adiponectin concentration in the portal vein was negatively associated with the secretion of VLDL-TG and VLDL-apoB-100 (which is an index of the number of VLDL particles secreted) by the liver, whereas adiponectin concentration in the radial artery correlated inversely with the secretion of VLDL-TG and with the relative contribution of nonsystemic fatty acids (i.e., fatty acids derived from lipolysis of visceral and intrahepatic TG stores and de novo lipogenesis) to total VLDL-TG production. Portal venous adiponectin concentration tended to correlate with the relative contribution of nonsystemic fatty acids to total VLDL-TG production, whereas arterial adiponectin concentration did not significantly correlate with VLDL-apoB-100 secretion, possibly because of outlying data in one subject. Adiponectin lowers hepatic apoB-100 mRNA levels in transgenic animals [21], inhibits the release of apoB-100 from human hepatocytes [20], stimulates hepatic fatty acid oxidation, suppresses the expression of lipogenic genes, and reduces intrahepatic triglyceride content [19, 22, 32]. These data, in conjunction with the results from our study, suggest that adiponectin decreases the secretion of VLDL particles and reduces intrahepatic fatty acid availability for VLDL-TG synthesis, particularly from non-systemic sources of fatty acids. Our findings provide a metabolic explanation for the presence of low adiponectin and increased VLDL-TG and VLDL-apoB-100 concentrations in obese people [12-14]. However, our data are not consistent with the results from two earlier studies, which reported no significant associations between systemic adiponectin concentration and VLDL-TG and VLDL-apoB-100 secretion rates, and found positive correlations between adiponectin concentration and both VLDL-TG and VLDL-apoB-100 fractional catabolic rates [36, 37]. The reason(s) for the differences between our study and previous reports is not clear, but could be due to differences in participant BMI and sex, which influences adiponectin concentrations [2, 38, 39] and VLDL-TG and VLDL-apoB-100 kinetics [40, 41].
Portal and arterial adiponectin concentrations were not different in our study subjects, and we previously found no portal venous-radial arterial differences in the relative amounts of circulating adiponectin complexes (i.e., low- and high-molecular weight), which have different biological activity [42]. Furthermore, we found a strong correlation between the concentrations of adiponectin in the portal vein and radial artery, with a slope of 0.85. Therefore, it is possible that the stronger numerical correlation we observed between portal than arterial adiponectin concentration and metabolic kinetics could be due to random variability in our small group of subjects. Nonetheless, our data suggest that the contribution of visceral fat to portal vein adiponectin is small compared with adiponectin derived from subcutaneous fat, which is released into the systemic circulation and delivered to the portal vein through the splanchnic system, analogous to the relative contributions of FFA derived from visceral and subcutaneous adipose tissue lipolysis to portal vein FFA [23, 43]. Consistent with this notion, data from a study conducted in 783 subjects found that subcutaneous rather than visceral adipose tissue determined plasma adiponectin concentration [44].
Our study has several important limitations. First, adiponectin concentrations and endogenous substrate kinetics were determined almost 2 days apart. However, short-term intraindividual variability in fasting plasma adiponectin concentration [45] and basal lipid kinetics [24, 46] is moderately low, ranging from ~10% to ~15%. Second, arterial and portal venous blood samples were obtained while subjects were under general anesthesia, which could have affected plasma adiponectin concentrations. However, even if there were such a surgery-induced effect, this would likely manifest as a leftward or rightward shift rather than a change in slope of the observed relationships. Third, our subjects were extremely obese (BMI > 50 kg/m2) with large amounts of visceral fat, so our results might not apply to lean people or those with class I and II obesity. Fourth, although our study demonstrated a strong correlation between both portal vein and radial artery adiponectin concentrations and hepatic substrate metabolism, we cannot determine whether this is simply an association or a causal relationship. Finally, our data cannot reliably distinguish the effects of adiponectin from HOMA-IR, which is primarily a marker of hepatic insulin sensitivity [47], on our metabolic outcome measures. We found strong correlations between HOMA-IR and both hepatic glucose and lipoprotein kinetics, and an inter-correlation among HOMA-IR and adiponectin concentrations in the portal vein and radial artery. The independent importance of each factor by using standard statistical adjustments (i.e. multiple regression analyses) cannot be determined in our small group of subjects. Accordingly, we cannot determine whether the observed relationships between adiponectin and hepatic metabolic variables resulted from direct effects of adiponectin on the liver or were due to adiponectin-induced changes in hepatic insulin sensitivity.
In summary, the results from the present study support the notion that hepatic delivery of adiponectin, derived from both visceral and subcutaneous fat depots, is involved in the regulation of basal hepatic glucose, VLDL-TG and VLDL-apoB-100 production rates in obese people, possibly through direct effects on the liver or changes in hepatic insulin sensitivity. Additional studies are needed to determine whether this association represents a true cause-and-effect relationship.
ACKNOWLEDGEMENTS
The authors thank Donna Marin, Jennifer McCrea, Freida Custodio, Jennifer Shew and Dr. Adewole Okunade for technical assistance, and the nursing staff of the Clinical Research Unit for their help in performing the studies, and the study subjects for their participation.
FUNDING
This study was supported by National Institutes of Health grants DK 37948, DK 56341 (Nutrition Obesity Research Center), RR024992 (Clinical and Translational Science Award), and RR-00954 (Biomedical Mass Spectrometry Resource).
ABBREVIATIONS
- ApoB-100
apolipoprotein B-100
- BMI
body mass index
- FFA
free fatty acids
- FTR
fractional turnover rate
- HOMA-IR
homeostasis model assessment of insulin resistance
- NMR
nuclear magnetic resonance
- Ra
rate of appearance
- TG
triglyceride
- TTR
tracer-to-tracee ratio
- VLDL
very low density lipoprotein
Footnotes
Publisher's Disclaimer: This is a PDF file of an unedited manuscript that has been accepted for publication. As a service to our customers we are providing this early version of the manuscript. The manuscript will undergo copyediting, typesetting, and review of the resulting proof before it is published in its final citable form. Please note that during the production process errors may be discovered which could affect the content, and all legal disclaimers that apply to the journal pertain.
DISCLOSURE
The authors have no conflicts of interest.
REFERENCES
- 1.Maeda K, Okubo K, Shimomura I, et al. cDNA cloning and expression of a novel adipose specific collagen-like factor, apM1 (AdiPose Most abundant Gene transcript 1) Biochem Biophys Res Commun. 1996;221(2):286–289. doi: 10.1006/bbrc.1996.0587. [DOI] [PubMed] [Google Scholar]
- 2.Arita Y, Kihara S, Ouchi N, et al. Paradoxical decrease of an adipose-specific protein, adiponectin, in obesity. Biochem Biophys Res Commun. 1999;257(1):79–83. doi: 10.1006/bbrc.1999.0255. [DOI] [PubMed] [Google Scholar]
- 3.Coughlin CC, Finck BN, Eagon JC, et al. Effect of marked weight loss on adiponectin gene expression and plasma concentrations. Obesity (Silver Spring) 2007;15(3):640–645. doi: 10.1038/oby.2007.556. [DOI] [PubMed] [Google Scholar]
- 4.Yang WS, Lee WJ, Funahashi T, et al. Weight reduction increases plasma levels of an adipose-derived anti-inflammatory protein, adiponectin. J Clin Endocrinol Metab. 2001;86(8):3815–3819. doi: 10.1210/jcem.86.8.7741. [DOI] [PubMed] [Google Scholar]
- 5.Liu YM, Lacorte JM, Viguerie N, et al. Adiponectin gene expression in subcutaneous adipose tissue of obese women in response to short-term very low calorie diet and refeeding. J Clin Endocrinol Metab. 2003;88(12):5881–5886. doi: 10.1210/jc.2003-030886. [DOI] [PubMed] [Google Scholar]
- 6.Bullo M, Salas-Salvado J, Garcia-Lorda P. Adiponectin expression and adipose tissue lipolytic activity in lean and obese women. Obes Surg. 2005;15(3):382–386. doi: 10.1381/0960892053576776. [DOI] [PubMed] [Google Scholar]
- 7.Jurimae J, Jurimae T, Ring-Dimitriou S, et al. Plasma adiponectin and insulin sensitivity in overweight and normal-weight middle-aged premenopausal women. Metabolism. 2009;58(5):638–643. doi: 10.1016/j.metabol.2008.12.009. [DOI] [PubMed] [Google Scholar]
- 8.Ashley DT, O’Sullivan EP, Davenport C, et al. Similar to adiponectin, serum levels of osteoprotegerin are associated with obesity in healthy subjects. Metabolism. 2010 doi: 10.1016/j.metabol.2010.10.001. In press: doi:10.1016/j.metabol.2010.1010.1001. [DOI] [PubMed] [Google Scholar]
- 9.Lihn AS, Bruun JM, He G, et al. Lower expression of adiponectin mRNA in visceral adipose tissue in lean and obese subjects. Mol Cell Endocrinol. 2004;219(1-2):9–15. doi: 10.1016/j.mce.2004.03.002. [DOI] [PubMed] [Google Scholar]
- 10.Samaras K, Botelho NK, Chisholm DJ, et al. Subcutaneous and visceral adipose tissue gene expression of serum adipokines that predict type 2 diabetes. Obesity (Silver Spring) 2010;18(5):884–889. doi: 10.1038/oby.2009.443. [DOI] [PubMed] [Google Scholar]
- 11.Fain JN, Madan AK, Hiler ML, et al. Comparison of the release of adipokines by adipose tissue, adipose tissue matrix, and adipocytes from visceral and subcutaneous abdominal adipose tissues of obese humans. Endocrinology. 2004;145(5):2273–2282. doi: 10.1210/en.2003-1336. [DOI] [PubMed] [Google Scholar]
- 12.Chan DC, Watts GF, Ng TW, et al. Adiponectin and other adipocytokines as predictors of markers of triglyceride-rich lipoprotein metabolism. Clin Chem. 2005;51(3):578–585. doi: 10.1373/clinchem.2004.045120. [DOI] [PubMed] [Google Scholar]
- 13.Havel PJ. Update on adipocyte hormones: regulation of energy balance and carbohydrate/lipid metabolism. Diabetes. 2004;53(Suppl 1):S143–151. doi: 10.2337/diabetes.53.2007.s143. [DOI] [PubMed] [Google Scholar]
- 14.Chan DC, Barrett PH, Ooi EM, et al. Very low density lipoprotein metabolism and plasma adiponectin as predictors of high-density lipoprotein apolipoprotein A-I kinetics in obese and nonobese men. J Clin Endocrinol Metab. 2009;94(3):989–997. doi: 10.1210/jc.2008-1457. [DOI] [PubMed] [Google Scholar]
- 15.Vanhala MJ, Kumpula LS, Soininen P, et al. High serum adiponectin is associated with favorable lipoprotein subclass profile in 6.4-year follow-up. Eur J Endocrinol. 2011 doi: 10.1530/EJE-10-1065. In press: doi: 10.1530/EJE-1510-1065. [DOI] [PubMed] [Google Scholar]
- 16.Berg AH, Combs TP, Du X, et al. The adipocyte-secreted protein Acrp30 enhances hepatic insulin action. Nat Med. 2001;7(8):947–953. doi: 10.1038/90992. [DOI] [PubMed] [Google Scholar]
- 17.Combs TP, Berg AH, Obici S, et al. Endogenous glucose production is inhibited by the adipose-derived protein Acrp30. J Clin Invest. 2001;108(12):1875–1881. doi: 10.1172/JCI14120. [DOI] [PMC free article] [PubMed] [Google Scholar]
- 18.Yamauchi T, Kamon J, Minokoshi Y, et al. Adiponectin stimulates glucose utilization and fatty-acid oxidation by activating AMP-activated protein kinase. Nat Med. 2002;8(11):1288–1295. doi: 10.1038/nm788. [DOI] [PubMed] [Google Scholar]
- 19.Yamauchi T, Kamon J, Waki H, et al. The fat-derived hormone adiponectin reverses insulin resistance associated with both lipoatrophy and obesity. Nat Med. 2001;7(8):941–946. doi: 10.1038/90984. [DOI] [PubMed] [Google Scholar]
- 20.Neumeier M, Sigruener A, Eggenhofer E, et al. High molecular weight adiponectin reduces apolipoprotein B and E release in human hepatocytes. Biochem Biophys Res Commun. 2007;352(2):543–548. doi: 10.1016/j.bbrc.2006.11.058. [DOI] [PubMed] [Google Scholar]
- 21.Qiao L, Zou C, van der Westhuyzen DR, et al. Adiponectin reduces plasma triglyceride by increasing VLDL triglyceride catabolism. Diabetes. 2008;57(7):1824–1833. doi: 10.2337/db07-0435. [DOI] [PMC free article] [PubMed] [Google Scholar]
- 22.Asterholm IW, Scherer PE. Enhanced metabolic flexibility associated with elevated adiponectin levels. Am J Pathol. 2010;176(3):1364–1376. doi: 10.2353/ajpath.2010.090647. [DOI] [PMC free article] [PubMed] [Google Scholar]
- 23.Klein S. The case of visceral fat: argument for the defense. J Clin Invest. 2004;113(11):1530–1532. doi: 10.1172/JCI22028. [DOI] [PMC free article] [PubMed] [Google Scholar]
- 24.Magkos F, Patterson BW, Mittendorfer B. Reproducibility of stable isotope labeled tracer measures of VLDL-triglyceride and VLDL-apolipoprotein B-100 kinetics. J Lipid Res. doi: 10.1194/jlr.D600048-JLR200. in press. [DOI] [PubMed] [Google Scholar]
- 25.Klein S, Mittendorfer B, Eagon JC, et al. Gastric bypass surgery improves metabolic and hepatic abnormalities associated with nonalcoholic fatty liver disease. Gastroenterology. 2006;130(6):1564–1572. doi: 10.1053/j.gastro.2006.01.042. [DOI] [PubMed] [Google Scholar]
- 26.Patterson BW, Mittendorfer B, Elias N, et al. Use of stable isotopically labeled tracers to measure very low density lipoprotein-triglyceride turnover. J Lipid Res. 2002;43(2):223–233. [PubMed] [Google Scholar]
- 27.Magkos F, Patterson BW, Mittendorfer B. Reproducibility of stable isotope labeled tracer measures of VLDL-triglyceride and VLDL-apolipoprotein B-100 kinetics. J Lipid Res. 2007;48(5):1204–1211. doi: 10.1194/jlr.D600048-JLR200. [DOI] [PubMed] [Google Scholar]
- 28.Steele R. Influences of glucose loading and of injected insulin on hepatic glucose output. Ann N Y Acad Sci. 1959;82:420–430. doi: 10.1111/j.1749-6632.1959.tb44923.x. [DOI] [PubMed] [Google Scholar]
- 29.Mittendorfer B, Patterson BW, Klein S. Effect of weight loss on VLDL-triglyceride and apoB-100 kinetics in women with abdominal obesity. Am J Physiol Endocrinol Metab. 2003;284(3):E549–556. doi: 10.1152/ajpendo.00379.2002. [DOI] [PubMed] [Google Scholar]
- 30.Matthews DR, Hosker JP, Rudenski AS, et al. Homeostasis model assessment: insulin resistance and beta-cell function from fasting plasma glucose and insulin concentrations in man. Diabetologia. 1985;28(7):412–419. doi: 10.1007/BF00280883. [DOI] [PubMed] [Google Scholar]
- 31.Yamauchi T, Kamon J, Ito Y, et al. Cloning of adiponectin receptors that mediate antidiabetic metabolic effects. Nature. 2003;423(6941):762–769. doi: 10.1038/nature01705. Erratum in: Nature 2004;2431(7012):1123. [DOI] [PubMed] [Google Scholar]
- 32.Yamauchi T, Nio Y, Maki T, et al. Targeted disruption of AdipoR1 and AdipoR2 causes abrogation of adiponectin binding and metabolic actions. Nat Med. 2007;13(3):332–339. doi: 10.1038/nm1557. [DOI] [PubMed] [Google Scholar]
- 33.Kaser S, Moschen A, Cayon A, et al. Adiponectin and its receptors in non-alcoholic steatohepatitis. Gut. 2005;54(1):117–121. doi: 10.1136/gut.2003.037010. [DOI] [PMC free article] [PubMed] [Google Scholar]
- 34.Bugianesi E, Pagotto U, Manini R, et al. Plasma adiponectin in nonalcoholic fatty liver is related to hepatic insulin resistance and hepatic fat content, not to liver disease severity. J Clin Endocrinol Metab. 2005;90(6):3498–3504. doi: 10.1210/jc.2004-2240. [DOI] [PubMed] [Google Scholar]
- 35.Bajaj M, Suraamornkul S, Piper P, et al. Decreased plasma adiponectin concentrations are closely related to hepatic fat content and hepatic insulin resistance in pioglitazone-treated type 2 diabetic patients. J Clin Endocrinol Metab. 2004;89(1):200–206. doi: 10.1210/jc.2003-031315. [DOI] [PubMed] [Google Scholar]
- 36.Ng TW, Watts GF, Farvid MS, et al. Adipocytokines and VLDL metabolism: independent regulatory effects of adiponectin, insulin resistance, and fat compartments on VLDL apolipoprotein B-100 kinetics? Diabetes. 2005;54(3):795–802. doi: 10.2337/diabetes.54.3.795. [DOI] [PubMed] [Google Scholar]
- 37.Adiels M, Taskinen MR, Packard C, et al. Overproduction of large VLDL particles is driven by increased liver fat content in man. Diabetologia. 2006;49(4):755–765. doi: 10.1007/s00125-005-0125-z. [DOI] [PubMed] [Google Scholar]
- 38.Smith J, Al-Amri M, Sniderman A, et al. Leptin and adiponectin in relation to body fat percentage, waist to hip ratio and the apoB/apoA1 ratio in Asian Indian and Caucasian men and women. Nutr Metab (Lond) 2006;3:18. doi: 10.1186/1743-7075-3-18. [DOI] [PMC free article] [PubMed] [Google Scholar]
- 39.Vilarrasa N, Vendrell J, Maravall J, et al. Distribution and determinants of adiponectin, resistin and ghrelin in a randomly selected healthy population. Clin Endocrinol (Oxf) 2005;63(3):329–335. doi: 10.1111/j.1365-2265.2005.02346.x. [DOI] [PubMed] [Google Scholar]
- 40.Magkos F, Patterson BW, Mohammed BS, et al. Women produce fewer but triglyceride-richer very low-density lipoproteins than men. J Clin Endocrinol Metab. 2007;92(4):1311–1318. doi: 10.1210/jc.2006-2215. [DOI] [PubMed] [Google Scholar]
- 41.Mittendorfer B, Patterson BW, Klein S. Effect of sex and obesity on basal VLDL-triacylglycerol kinetics. Am J Clin Nutr. 2003;77(3):573–579. doi: 10.1093/ajcn/77.3.573. [DOI] [PubMed] [Google Scholar]
- 42.Fontana L, Eagon JC, Trujillo ME, et al. Visceral fat adipokine secretion is associated with systemic inflammation in obese humans. Diabetes. 2007;56(4):1010–1013. doi: 10.2337/db06-1656. [DOI] [PubMed] [Google Scholar]
- 43.Nielsen S, Guo Z, Johnson CM, et al. Splanchnic lipolysis in human obesity. J Clin Invest. 2004;113(11):1582–1588. doi: 10.1172/JCI21047. [DOI] [PMC free article] [PubMed] [Google Scholar]
- 44.Frederiksen L, Nielsen TL, Wraae K, et al. Subcutaneous rather than visceral adipose tissue is associated with adiponectin levels and insulin resistance in young men. J Clin Endocrinol Metab. 2009;94(10):4010–4015. doi: 10.1210/jc.2009-0980. [DOI] [PubMed] [Google Scholar]
- 45.Shand B, Elder P, Scott R, et al. Biovariability of plasma adiponectin. Clin Chem Lab Med. 2006;44(10):1264–1268. doi: 10.1515/CCLM.2006.227. [DOI] [PubMed] [Google Scholar]
- 46.Magkos F, Fabbrini E, Korenblat K, et al. Reproducibility of glucose, fatty acid and VLDL kinetics and multi-organ insulin sensitivity in obese subjects with non-alcoholic fatty liver disease. Int J Obes (Lond) 2010 doi: 10.1038/ijo.2010.265. In press. [DOI] [PMC free article] [PubMed] [Google Scholar]
- 47.Tripathy D, Almgren P, Tuomi T, et al. Contribution of insulin-stimulated glucose uptake and basal hepatic insulin sensitivity to surrogate measures of insulin sensitivity. Diabetes Care. 2004;27(9):2204–2210. doi: 10.2337/diacare.27.9.2204. [DOI] [PubMed] [Google Scholar]