

Abstract
We present a strategy to identify developmental/differentiation and plasma membrane marker genes of the most primitive human Mesenchymal Stem Cells (hMSCs). Using sensitive and quantitative TaqMan Low Density Arrays (TLDA) methodology, we compared the expression of 381 genes in human Embryonic Stem Cells (hESCs), hESC-derived MSCs (hES-MSCs), and hMSCs. Analysis of differentiation genes indicated that hES-MSCs express the sarcomeric muscle lineage in addition to the classical mesenchymal lineages, suggesting they are more primitive than hMSCs. Transcript analysis of membrane antigens suggests that IL1R1low, BMPR1Blow, FLT4low, LRRC32low, and CD34 may be good candidates for the detection and isolation of the most primitive hMSCs. The expression in hMSCs of cytokine genes, such as IL6, IL8, or FLT3LG, without expression of the corresponding receptor, suggests a role for these cytokines in the paracrine control of stem cell niches. Our database may be shared with other laboratories in order to explore the considerable clinical potential of hES-MSCs, which appear to represent an intermediate developmental stage between hESCs and hMSCs.
1. Introduction
A major challenge in developmental biology is to decipher gene expression controlling stemness and differentiation networks. A more practical goal is to identify among these genes those encoding membrane antigens such as receptors, which could be used as markers to track or select stem cells from the earliest pluripotent cells to the latest adult progenitor cells. In this study, we analyzed gene expression in pluripotent human Embryonic Stem Cell lines (hESCs), in human multipotent bone marrow Mesenchymal Stem Cells (hMSCs), and in hESC-derived MSCs (hES-MSCs). It is well known that hMSCs constitute a heterogeneous population that may include a subset of more primitive cells [1–3]. Although many antibodies directed at cell membrane antigens have been used to select specific hMSC populations [4–6], there is no cogent evidence that some of these antibodies may select for a more primitive population with enlarged differentiation potential and robust self-renewal capacity. Even in the mouse, where such a primitive population has been recently characterized by the expression of the cytoskeletal protein nestin [7], separation according to membrane phenotype is not yet feasible.
In a previous study [8], we observed that a 24 h pretreatment of Stro1+/GlycoA− or CD45−/GlycoA− hMSCs with a monoclonal antibody blocking the human type I interferon-alpha (IFNα) receptor, or with a polyclonal anti-IFNα antibody, resulted in a marked increase in the number of very large colonies (Colony-forming Units-fibroblasts containing more than 3000 cells). Interestingly, these activated High Proliferative Potential-Quiescent hMSCs (HPP-Q hMSCs) expressed SSEA-3 and -4 at a higher level than non-pretreated cells, suggesting that HPP-Q hMSCs constituted a more primitive cell population than nontreated cells.
A more direct way to characterize the most primitive hMSCs would be to select them from hESCs induced to differentiate into hMSCs, using various procedures that we and others have implemented [9–13]. In the present work, we have studied hESC-derived MSCs (hES-MSCs) assuming that these cells might represent a more primitive hMSC population. We compared the expression profiles of differentiation genes and genes encoding cytokine and adhesion molecules and their receptors in the three populations hESCs, hES-MSCs and hMSCs, focusing on the genes that are differentially detected in hES-MSCs, and hMSCs. Our data confirmed previous results on hMSC gene expression [14–20]. Moreover, the comparison of hES-MSCs with hMSCs has revealed subtle and significant variations in the expression of genes that may help characterize the more primitive hMSCs.
Our team and other investigators have shown that primitive hematopoietic stem cells or early keratinocytes which self-renew without differentiation, express low levels of receptors and respond to low concentrations of cytokines [21–29]. In contrast, the same cytokines at high concentrations frequently induce differentiation. We address in this study the question of whether some Receptorlow cells might represent within hES-MSCs the most primitive hMSC population with a greater mesodermal potential.
hMSCs are not only the stem cells for skeletal connective-tissue (osteoblasts, chondrocytes, and adipocytes), but are also important components of stem cell niches [1, 7, 30–32]. Here we have studied the expression by hMSCs of transcripts for cytokines and extracellular matrix (ECM) components in the absence of their receptors, in keeping with the paracrine regulation of hematopoietic stem cells. We have also studied the possibility that hMSCs themselves express receptors to respond to cytokines produced by other cells of the stem cell niche.
The identification of marker genes expressed at low levels in primitive stem cells requires the application of highly sensitive and reliable molecular techniques. We chose a TaqMan Low Density Array (TLDA) to identify the differentially expressed genes. TaqMan assays are based on PCR, resulting in an increase of detectable reporter fluorescence in each cycle. This reliable technique, associated with statistical analyses, allows the identification of biological markers, which could have been overlooked by less sensitive techniques such as microarrays.
Finally, we propose to share with other laboratories our database to promote better understanding of the considerable clinical potential of hESCs, hES-MSCs, and hMSCs (see list of genes available in supplementary material available on line at doi:10.4061/2011/368192).
2. Materials and Methods
2.1. Cell Lines and Culture Conditions
This research adheres to the guidelines established by the National Academy of Sciences, USA, the French Bioethics Laws, and the Agence Française de Sécurité Sanitaire des Produits de Santé (AFSSAPS).
2.1.1. Human Embryonic Stem Cell Lines (hESCs)
Pluripotent Human Embryonic Stem cell lines (hESCs), hES2 and hES3, were provided by ES Cell International (ESI, Singapore and Australia). hESCs were cultured according to the supplier's instructions. Briefly, hES2, and hES3 were amplified in an undifferentiated state on Murine Embryonic Fibroblast (MEF) feeders on tissue culture plates precoated with 0.1% gelatin (Sigma). Culture medium (KO-SR) consisted of 80% knockout Dulbecco's Modified Eagle's Medium (KO-DMEM) (Invitrogen), 20% KO Serum Replacement (KO-SR, Invitrogen), 1 mM L-glutamine (Invitrogen), 0.1 mM β-mercaptoethanol (Sigma), 1% (v/v) Non-Essential Amino Acids (NEAA), and 4 ng/mL human basic Fibroblast Growth Factor (bFGF) (Preprotech). The medium was renewed every day.
hESC colonies were replated every 6 to 7 days by mass culture passaging (Geron protocol) summarized as follows: hESC cultures were washed once with PBS and treated with 1 mg/mL collagenase IV. Colonies were scraped into clumps and replated with a 1 to 6–8 amplification rate.
MEF were prepared as described elsewhere [33] and used at the cell density of 6.3 × 10⁴ cells/cm2. Briefly, MEF were treated by Mitomycin C and maintained in high glucose DMEM supplemented with 10% (v/v) selected fetal calf serum.
2.1.2. Human Mesenchymal Stem Cells Derived from Human Embryonic Stem Cells (hES-MSCs)
Two different cell lines were used. The first one, MSC-P51R (hES-MSC1), generously provided by Olivier et al. [10] was obtained from hESC H1 [34] spontaneously differentiated in D10 medium and 7.5% of CO2. After 1 to 3 passages, the cultures became morphologically homogeneous. The second line, hES-MSC2, derived from hES2 in our laboratory, was obtained from Embryoid Bodies (EBs) obtained after 36 days of culture in EB medium [33]. EBs were cut, plated in 6-well plates (Falcon) previously coated with purified human fibrinogen (2 mg/mL, 1 mL/well) for 30 min at 37°C and further maintained in culture on fibrinogen in EB medium during 4 weeks. After dissociation by trypsin, cells were centrifuged, counted, and plated at 1.104cells/cm2 in six-well tissue culture plates previously coated with gelatin 0.1% in hMSC medium (see bone marrow cell isolation section).
2.1.3. Human Bone Marrow Mesenchymal Stem Cells (hMSCs)
Human Mesenchymal Stem Cells (hMSC1 and hMSC2) were obtained during orthopedic surgery after informed consent of the donors. Briefly, mononuclear cells, recovered after Ficoll density gradient centrifugation were plated at 6.103 cells/cm2 in six-well tissue culture plates (Falcon, Becton Dickinson) or in 75 cm2 tissue culture flasks (Falcon). The volume of culture medium was modified according to cell density. hMSC medium consisted in αMEM without nucleotides (Invitrogen) and without antibiotics, but supplemented with 10% selected Hyclone serum (Perbio Science) and 2 mM glutamine (Invitrogen). Cells were allowed to adhere for 48 h at 37°C and 5% CO2. Wells were then washed twice and the remaining adherent cells were further cultured in the same medium. Cells were cultured with medium renewal twice a week for 14 days and every 6 to 7 days after the first passage, reaching no more than 70–80% confluency. hMSCs were replated as follows: hMSCs were washed twice in PBS, treated for 5 to 10 min by trypsin/EDTA (Boehringer, Ingelheim, Germany), centrifuged, counted and replated. All cultures were incubated in a HeraCell (Heraeus) incubator at 37°C in an atmosphere containing 5% CO2 and 95% humidity.
2.2. Differentiation Potentials and Immunophenotypic Studies Are Described in Supplementary Material Data and in Previous Work [8, 10, 14, 17]
See Supplementary Material and Methods, table, and figure.
2.3. RNA Isolation and Gene Expression Analysis by Quantitative Real-Time PCR (qRT-PCR)
2.3.1. cDNA Preparation
hESCs, hES-MSCs, and hMSCs were harvested using buffer RLT lysis buffer (Qiagen) following the manufacturer's protocol. Total RNA was prepared according to standard protocols and RNA samples were then stored at −80°C. Five micrograms of RNA were treated by DNase RNase-free (Ambion) to avoid genomic DNA contamination in subsequent RT-PCR. One microgram of total RNA was reverse-transcribed in a 20 μL final reaction volume using the High Capacity cDNA Reverse Transcription Kit with RNase inhibitor (Applied Biosystems) following the manufacturer's instructions.
2.3.2. Quantitative PCR Reaction
Quantitative PCR reactions were performed using ABI Prism 7900 HT sequence detection system (Applied Biosystems). Microfluidic Taqman arrays were designed to measure the expression of 381 genes. Briefly, 300 ng of cDNA were used per sample-loading port, each allowing 48 q-PCR reactions following the manufacturer's instructions (10 min 94.5°C followed by 40 cycles of 30 sec at 97°C and 1 min at 59.7°C). GAPDH was used to normalize gene expression levels for further analysis of q-PCR experiments with the relative quantification method [35].
2.3.3. Quantitative PCR Experiment Analysis
Analysis was performed with biological duplicates. Relative Quantification (RQ) values were calculated for each gene according to the publication of Vandesompele's group [36] with the control group (hESCs) as reference and an arbitrary threshold at 35 cycles. In order to minimize variations between cell lines, we analyzed data in biological groups as follows: hES2 and hES3 for the hESC group; hES-MSC1 and hES-MSC2 for the hES-MSC group; two samples of human bone marrow MSCs derived from different patients for the hMSC group. Results shown are the average in each biological group and are expressed as means ± SD. Data were also analyzed with StatMiner 4.1 software (Integromix, Madrid, Spain) and a P value was computed using a moderated t-test to measure the significance associated with each RQ value. Variations were considered statistically significant when the P value was < 0.05. Hierarchical clustering was obtained using StatMiner software and Pearson's test on the 381 genes tested.
Q-PCR data are usually represented as relative quantifications (RQ = 2−ΔΔCt ). The ΔCt values depend on the expression level of the chosen reference genes. In this study we used a modified ΔCt calculation according to Weksberg et al. [37], which takes into account the variations of the ΔCt from one tissue sample to the other. Briefly, for a given sample A, the ΔCt is calculated by subtracting the reference gene value (Ct (REF)) from the Ct value of the gene of Interest X (Ct (X) A): ΔCt(X)A = Ct(X)A − Ct(REF)A. The Normalized Ct (NCt) is calculated in 2 steps as follows: we first calculate the variation of the reference gene in sample A (VCt (REF) A) as: VCt (REF) A = Ct (REF) A − Mean Ct (REF) all samples. Then we calculate the Normalized Ct for the gene of interest X in sample A (NCt (X) A): NCt (X) A = Ct (X) A – VCt (REF) A. Neuroectodermic, endodermic, mesodermic, chondrocytic, and osteoblastic differentiation genes are represented in Figure 1 with the 2−NCt method. Chosen cutoff value for 2−NCt was 3.10−11, that is, above threshold value for any transcript included in this study.
Figure 1.
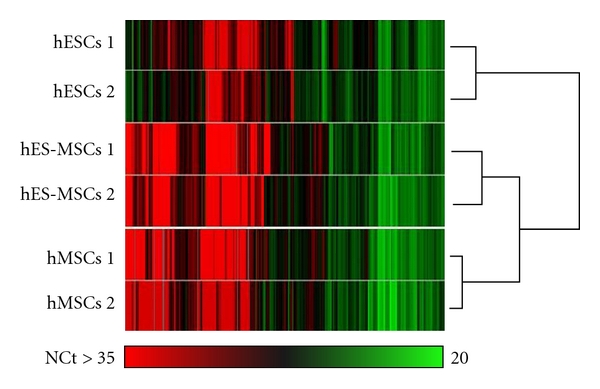
Hierarchical clustering of normalized Ct of 380 genes on hESCs, hES-MSCs, or hMSCs using individual samples and genes. Genes are classified using StatMiner Software and the Pearson test.
3. Results and Discussion
We studied the transcription level of genes representative of extracellular matrix components, cytokine families and their receptors, and other differentiation genes in three cell populations: hESCs, hES-MSCs, and hMSCs. The Ct values are normalized Ct (NCt) (see Materials and Methods). All NCt values are given in Tables 1.
3.1. Transcriptomic Hierarchical Clustering
We investigated the expression of transcripts characterizing differentiation pathways. As shown in Figure 1 for all 381 transcripts studied, hES-MSCs and hMSCs clustered in one main group while hESCs clustered into another. This hierarchical clustering analysis indicated that hES-MSCs were more closely related to hMSCs than to hESCs.
3.2. Differentiation Markers
We compared the expression level of specific embryonal lineage transcripts in the 3 populations of hESCs, hES-MSCs, and hMSCs. Results are shown on Figures 2(a) and 2(b). We found that hES-MSCs and hMSCs, as compared to hESCs, expressed significantly (P < 0.05) less neuroectodermic (NRCAM, NEUROD1, ASCL1, PAX6, GFAP, and NEFH) (Figure 1(a)) and endodermic (CDH1, ONECUT1, HNFA4, AFP, TTR, FOXA1, FOXA2, ALB, and TCF1) (Figure 1(b)) markers.
Figure 2.
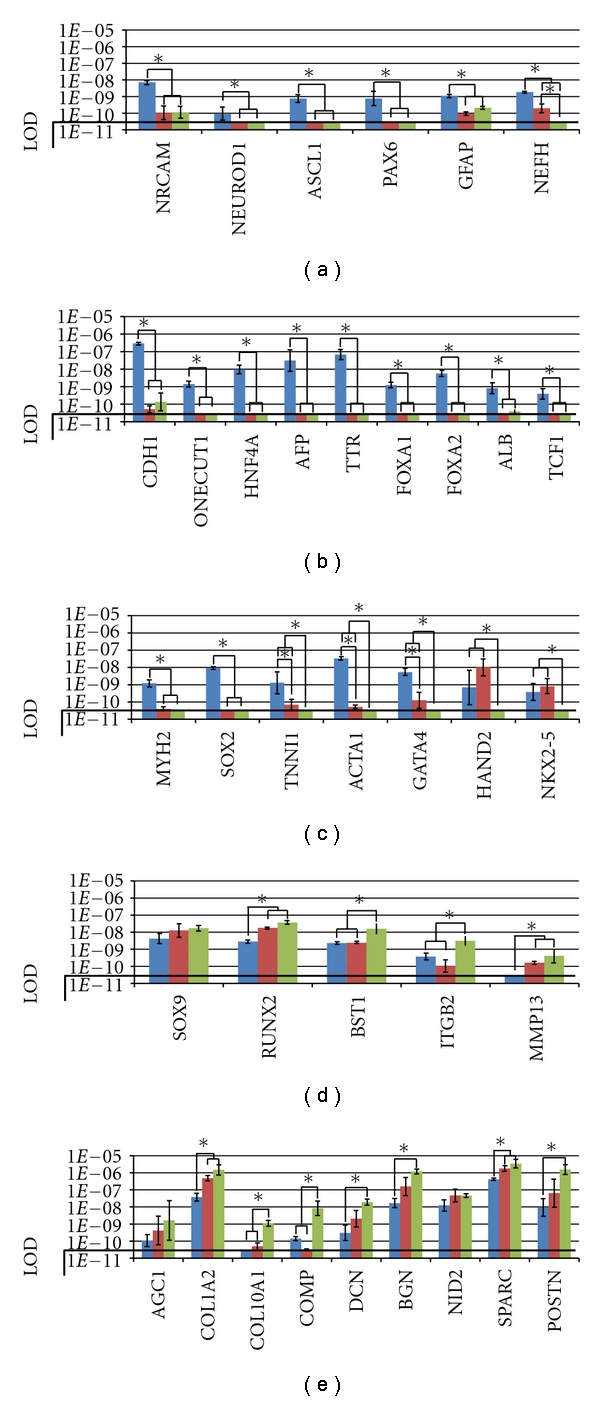
Differentiation gene expression levels in hESC (blue), hES-MSC (Red), or hMSC (green) populations. The differentiation genes are classified as follow: (a) neuroectodermic genes; (b) endodermic genes; (c) mesodermic genes; (d) and (e) mesenchymal genes including transcription factors, cell adhesion molecules, and protease genes (d) and Extra-cellular matrix genes (e). y-axis values correspond to 2−NCt as described in Material and Methods. The black line represents the limit of detection (LOD: > 35 Ct). Asterisks (*) indicate significant expression variation with P < 0.05.
We also observed progressive and significant decrease from hESCs to hES-MSCs and an absence of detection in hMSCs of the mesodermal sarcomeric (skeletal and cardiac) muscle genes MYH2, SOX2, TNNI1, ACTA1, GATA4, HAND2 and NKX2.5. SOX2 was the only gene which was not significantly expressed in hES-MSCs. In contrast HAND2, and NKX2.5 had a maximal expression in hES-MSCs. (Figure 1(c)). These results confirm the mesodermal commitment and the more primitive state of hES-MSCs compared to hMSCs [9, 10, 38–40]. Our data validate previous works reporting that rare hMSC subpopulations can generate skeletal muscle cells in addition to mesenchymal and vascular smooth muscle cells [1]. This is also the case for the embryonic C3H10T1/2 line, taken as surrogate for MSCs in many studies [41–43].
Finally, from hESCs to hMSCs, we found a progressive increase in the expression level of mesenchymal genes implicated in chondrogenesis and/or osteogenesis (the transcription factors SOX9 and RUNX2, the cell adhesion molecules BST1 and ITGB2, the protease MMP13, and the extra-cellular matrix components AGC1, COL1A2, COL10A1, COMP, DCN, BGN, NID2, SPARC, and POSTN) (Figures 1(d) and 1(e)). For most of these transcripts the progressive increase was significant indicating again that hES-MSCs are more primitive than hMSCs as they are less expressing mesenchymal differentiation markers.
These results confirm that hES-MSCs represent a more primitive mesenchymal population than hMSCs [9, 10, 38–40], indicating that the lineage priming [17] of hES-MSCs includes the sarcomeric muscle lineage in addition to the classical mesenchymal lineages.
Flow cytometry and differentiation studies on the 3 populations are provided in supplementaary material to confirm other published results on hES-MSCs and to validate our transcriptomic studies.
3.3. Cytokines and Receptors
3.3.1. TGF-β Superfamily
Many genes related to the TGF-β superfamily (15 genes evaluated) were detected at relatively high levels in all three cell populations.
TGF-β1 was the cytokine with the highest level of expression in the TGF-β superfamily, with NCt of 27.6 (hESCs), 22.8 (hES-MSCs), and 21.0 (hMSCs). TGF-β2 and INHBA encoding the Activin monomer, were also highly expressed (Tables 1). We have previously demonstrated that TGF-β1 at physiological concentrations, below 1 ng/mL, prevents differentiation during self-renewal of both adult and embryonic stem cells [21, 23, 28, 44].
As expected, TGFBR1 and TGFBR2 were both well and stably expressed in the three populations (Tables 1).
BMP7 was not detected in hES-MSCs and hMSCs, but was highly expressed in hESCs (NCt = 26.2) (Tables 1).
BMPR1B, a BMP receptor Type I, was well expressed in hESCs (NCt = 29.4), 3-fold less in hES-MSCs (NCt = 31.2) and not detected in hMSCs (Figure 3(a)). Comparison of our data on hES-MSCs versus hMSCs suggests that BMPR1Blow cells should be further investigated to select the more primitive hMSC subpopulation. BMPR1B has indeed been used to characterize MIAMI cells (Marrow Isolated Adult Multilineage Inducible cells) that present a larger proliferation and differentiation potential than that of the hMSCs used in the present study [45].
Figure 3.

Transcriptomic expression analyses of potential markers for primitive hMSC selection. Relative gene expression of hESC-derived hMSC (hES-MSC) or hMSC populations compared to hESC calibrator group. Messenger RNA levels were determined using QRT-PCR, and relative quantification (RQ) values were calculated by the 2−ΔΔCt method with GAPDH as internal control and an arbitrary threshold at 35 cycles. Asterisks (*) indicate significant expression variation with P value < 0.05. As compared to hESC calibrator group, arrows pointing downwards (↓) indicate gene extinction (>35 Ct) and arrows pointing upwards (↑) indicate gene appearance (<35 Ct).
Latent TGF-beta plays an important role in stem cell regulation. It is a major component of the stem cell niche and is present throughout the ECM. Latent TGF-beta represents a source of active TGF-β, which can be released via various proteolytic activities when required by neighboring stem cells [23]. LRRC32 (also known as GARP for Glycoprotein A Repetitions Predominant) is a latent TGF-beta receptor located at the cell membrane [46]. This molecule was detected in hESCs and hES-MSCs and was upregulated in hMSCs (Tables 1 and Figure 3(b)), which raises the possibility that an hMSC subpopulation similar to hES-MSCs, might be selected according to its low expression of LRRC32.
3.3.2. Interleukin Family
IL6 was expressed in hESCs (NCt = 32.8) and hES-MSCs (NCt = 31.3). This expression was upregulated 76 times in hMSCs (NCt = 26.6) (Figure 3(c)). This IL6 upregulation was associated with the mentioned above upregulation of TGF-β1, a cytokine reported as inducing IL6 [47]. Interestingly, the IL6R gene was slightly but stably expressed in all samples tested (NCt = 30) (Table, 1). The IL6 transducer signal gene, IL6ST, encoding for a gp130 protein, was also upregulated with an NCt = 25.6 for hESCs, 23.4 for hES-MSCs and 22.5 for hMSCs.
IL1R1 (Figure 3(d)) was up-regulated in hES-MSCs and hMSCs (12 and 50 fold up-regulation, resp.) as compared to hESCs (NCt = 30.8), which raises the possibility that an hMSC subpopulation might be selected according to its low expression of IL1R1.
IL8 was expressed in the three populations, but IL8 receptors were detected in none. This suggests that IL8 expression could control a paracrine mechanism in stem cell niches.
Finally, an IL1 pathway inhibitor, IL1R2, was expressed at low level (NCt = 33) only in hMSCs, suggesting the presence of a negative feedback loop to control IL1 expression level in these cells. IL1R2 is a molecular decoy that traps interleukin 1 but does not initiate subsequent signaling, suppressing therefore the inflammatory response in some autoimmune diseases [48].
3.3.3. Tumor Necrosis Factor (TNF) Family
TNF-alpha was expressed at low levels in hESCs and hES-MSCs (NCt = 33.7 and 32.7 resp.; Tables 1), but not in hMSCs.
The five TNF family receptors studied were expressed in all three cell populations. TNFRSF1A (unlike TNFRSF1B) was detected at relatively high levels in hESCs and hES-MSCs, and both TNF receptors were up-regulated, about 5-fold, in hMSCs. TNFRSF5 encoding the CD40 antigen was detected at a relatively high level in the three cell populations. TNFRSF11A was downregulated and TNFRSF11B was up-regulated in both hES-MSCs and hMSCs as compared to hESCs. The upregulation of TNFRSF11B/OPG in hMSCs may be related to the osteogenic lineage priming of the cells, since this gene is a reliable osteoblastic marker.
These results suggest that hMSCs are responsive to TNF produced by nearby cells as they express TNF receptors but not the TNF ligand itself. The TNF promoter has been recently described to be silenced by methylation in hMSCs, an observation which partially confirms our results [20].
3.3.4. Pituitary Hormone Family
PTHR1 was down-regulated 20 times in hES-MSCs (NCt = 31.5) and not detected in hMSCs as compared to hESCs (NCt = 27.2) (Figure 3(e)). This gene codes for the pituitary hormone receptor able to interact with many other pathways such as TGF-β [49] and Wnt [50]. PTHR1 expression is consistently increased in hMSCs differentiating into osteoblasts and chondrocytes [17, 51]. As already suggested above for other receptors, an hMSC subpopulation, similar to hES-MSCs, might be selected according to its low expression of PTHR1.
3.3.5. VEGF Receptor—FLT Receptors
FLT1/VEGFR1 was well expressed by hESCs but significantly down-regulated in both hES-MSCs and hMSCs. FLT3/CD135 was detected at a low level in hESCs, but not in hES-MSCs and hMSCs. However, we detected the FLT3 ligand, FLT3LG, at a relatively high level in all three cell populations. Since hMSCs represent a major component of the hematopoietic stem cell niche, they could provide FLT3 ligand for early hematopoietic stem cells which are strongly activated by this cytokine.
FLT4/VEGFR3 is the only gene of this family that we found to be significantly down-regulated in hMSCs compared to hES-MSCs (Figure 3(f)). Indeed, this gene was well expressed in hESCs (NCt = 28.9), but down-regulated about 26 times in hES-MSCs and undetectable in hMSCs. As already suggested above for other receptors, this receptor might be a potential candidate to select a more primitive hMSC subpopulation.
3.3.6. PDGF
PDGFA was expressed at high levels in all three cell populations (Tables 1). PDGFB was highly down-regulated, about 400-fold (Figure 3(g)) in hES-MSCs as compared to hESCs (NCt = 25.3) and was undetectable in hMSCs. PDGF-B promotes differentiation of hMSCs [52]. This differentiation could be induced by PDGF-B produced by neighboring cells of the niche.
3.3.7. Wnt Pathway
We tested 23 genes from the Wnt family: 8 Wnt cytokines, 3 Frizzled (FZD) receptors, and 12 coregulators. The products of these genes form an important signaling pathway involved in many cellular processes such as differentiation control. All these 23 genes were expressed in one or more of the three populations.
Most WNT genes were expressed at a low level in hESCs and down-regulated (WNT1, WNT10B, WNT16) or not detected (WNT3A and WNT4) in hES-MSCs and hMSCs. In contrast, WNT5A and WNT5B were detected at a higher level in hESCs and up-regulated in hES-MSCs and hMSCs.
FZD genes and coreceptor LRP6 were detected at a relatively high level in the three cell populations.
Wnt pathway inhibitors DKK1, and especially SFRP4, were up-regulated in hMSCs (Figure 3(h)). SFRP4 was up-regulated 150 times in hMSCs (NCt = 25.4) as compared to hESCs (NCt = 32.6) and hES-MSCs (NCt = 31.5). SFRP4 acts by binding Wnt molecules in the extracellular space, thus inducing Wnt pathway inhibition and it has been described as an angiogenesis inhibitor [53].
Finally, WISP1 and WISP2 are downstream genes of the WNT signaling pathway both involved in osteogenesis. As compared to hESCs, WISP1 (NCt = 32) and WISP2 (NCt > 35) were both strongly up-regulated in hES-MSCs and hMSCs (Tables 1). As shown in Figure 3(i), WISP2 was not detected in hESCs and was up-regulated 13 times in hES-MSCs (NCt = 30.8) and 950 times in hMSCs (NCt = 24.8). This gene is up-regulated during bone formation, especially under Wnt3a stimulation [54].
3.4. CD34
CD34 (Figure 3(j)) is the most common antigen used as a marker to select human hematopoietic stem cells [55]. We observed that the CD34 gene was significantly expressed by hESCs, down-regulated 8 times but still significantly expressed by hES-MSCs and not detected in hMSCs. As suggested for some receptors with a low expression in hESC-MSCs and no expression in hMSCs, this antigen could therefore be used to enrich more primitive hMSCs. Such suggestion is in agreement with studies using anti-CD34 antibodies to select hMSC progenitors from adult bone marrow [56, 57] or, more recently, from hES-MSCs [9].
4. Conclusions
Sensitive and quantitative comparisons of developmental gene expression in hESCs, hES-MSCs, and hMSCs provide a wealth of information to better characterize the phenotypes and developmental controls of the most primitive hMSCs.
Our transcriptomic study validates other observations suggesting that hES-MSCs constitute a more primitive population than hMSCs. In particular we observe a greater expression of mesodermal genes including sarcomeric muscle genes in hES-MSCs. This validates previous observations that primitive hMSCs, such as MAPC, could differentiate towards sarcomeric muscle cells [18].
Our data suggest different ways by which hMSCs could interact with stem cells of various niches. IL-8, PDGFA and FLT3 ligand, but not their receptors, are well expressed by hMSCs, suggesting a paracrine action in niches such as the hematopoietic one. FLT3 Ligand gene expression is not surprising in the hematopoietic niche, as it plays a major role in the self-renewal of primitive hematopoietic stem cells. Latent TGF-β is present throughout the ECM of stem cell niches. This molecule can interfere with the leucine-rich repeat-containing protein 32 receptor (LRRC32) expressed by hMSCs and can thus release active TGF-β peptides locally.
Gene expression comparisons in the three populations allow the identification of 5 membrane receptors that are potential markers enriched in the most primitive hMSCs. In agreement with different studies on receptorlow stem cell selection [21–29], our results suggest that primitive hMSCs might be IL1R1low, BMPR-1Blow, PTHR1low, FLT4low, and LRRC32low. We also indicated that these cells could be CD34+, as recently validated [9].
hMSCs are a mixture of rare primitive stem cells with a majority of late progenitors. For this reason, transcriptomic studies of primitive hMSCs would be inaccurate if total hMSCs were used. Moreover, it would be extremely difficult to validate all the gene expression data of a transcriptomic study using the single cell experiments necessary to characterize the most primitive adult stem cells. In this study, our comparison of sensitive and quantitative gene expression in the three cell populations validates previous observations, some of which have been difficult to reproduce, on primitive hMSCs. Furthermore this methodology could pinpoint genes of interest encoding proteins not yet characterized and be fruitfully applied to other type of adult stem cells.
Supplementary Material
Supplementary list of genes: in order to share with other laboratories our database of results on hESCs, hES-MSCs, and hMSCs, we added the list of tested genes, for each, including the following information: Gene Symbol; Gene Name; TaqMan assay number and NCBI RefSeq accession number of the respective TaqMan assay.
Acknowledgments
R. Barbet and I. Peiffer contributed equally to this work. This work was supported by the Centre National de la Recherche Scientifique (CNRS), by a FP6 European Integrated Project “Genostem” (no. 503161) and by a grant of the Association pour le Développement de la Recherche en Reproduction Humaine (ADRRH) from Pr. René Frydman. R. Barbet received a fellowship from CNRS (509723). I. Peiffer received an ADRRH fellowship. The authors thank Dr. Mary Osborne-Pellegrin and Dr James Hutchins for their editing work. This work has benefited from the facilities and expertise of the QPCR platform of IMAGIF (Centre de Recherche de Gif - https://www.imagif.cnrs.fr/).
References
- 1.Charbord P. Bone marrow mesenchymal stem cells: historical overview and concepts. Human Gene Therapy. 2010;21(9):1045–1056. doi: 10.1089/hum.2010.115. [DOI] [PMC free article] [PubMed] [Google Scholar]
- 2.Short B, Brouard N, Occhiodoro-Scott T, Ramakrishnan A, Simmons PJ. Mesenchymal stem cells. Archives of Medical Research. 2003;34(6):565–571. doi: 10.1016/j.arcmed.2003.09.007. [DOI] [PubMed] [Google Scholar]
- 3.Pittenger MF, Mackay AM, Beck SC, et al. Multilineage potential of adult human mesenchymal stem cells. Science. 1999;284(5411):143–147. doi: 10.1126/science.284.5411.143. [DOI] [PubMed] [Google Scholar]
- 4.Pontikoglou C, Delorme B, Charbord P. Human bone marrow native mesenchymal stem cells. Regenerative Medicine. 2008;3(5):731–741. doi: 10.2217/17460751.3.5.731. [DOI] [PubMed] [Google Scholar]
- 5.Deschaseaux F, Gindraux F, Saadi R, Obert L, Chalmers D, Herve P. Direct selection of human bone marrow mesenchymal stem cells using an anti-CD49a antibody reveals their CD45med,low phenotype. British Journal of Haematology. 2003;122(3):506–517. doi: 10.1046/j.1365-2141.2003.04469.x. [DOI] [PubMed] [Google Scholar]
- 6.Lagar’kova MA, Lyakisheva AV, Filonenko ES, et al. Characteristics of human bone marrow mesenchymal stem cells isolated by immunomagnetic selection. Bulletin of Experimental Biology and Medicine. 2006;141(1):112–116. doi: 10.1007/s10517-006-0108-1. [DOI] [PubMed] [Google Scholar]
- 7.Méndez-Ferrer S, Michurina TV, Ferraro F, et al. Mesenchymal and haematopoietic stem cells form a unique bone marrow niche. Nature. 2010;466(7308):829–834. doi: 10.1038/nature09262. [DOI] [PMC free article] [PubMed] [Google Scholar]
- 8.Peiffer I, Eid P, Barbet R, et al. A sub-population of high proliferative potential-quiescent human mesenchymal stem cells is under the reversible control of interferon alpha/beta. Leukemia. 2007;21(4):714–724. doi: 10.1038/sj.leu.2404589. [DOI] [PubMed] [Google Scholar]
- 9.Kopher RA, Penchev VR, Islam MS, Hill KL, Khosla S, Kaufman DS. Human embryonic stem cell-derived CD34(+) cells function as MSC progenitor cells. Bone. 2010;47(4):718–728. doi: 10.1016/j.bone.2010.06.020. [DOI] [PMC free article] [PubMed] [Google Scholar]
- 10.Olivier EN, Rybicki AC, Bouhassira EE. Differentiation of human embryonic stem cells into bipotent mesenchymal stem cells. Stem Cells. 2006;24(8):1914–1922. doi: 10.1634/stemcells.2005-0648. [DOI] [PubMed] [Google Scholar]
- 11.Stavropoulos ME, Mengarelli I, Barberi T. Current Protocols in Stem Cell Biology. chapter 1, unit 1F 8. New York, NY, USA: John Wiley & Sons; 2009. Differentiation of multipotent mesenchymal precursors and skeletal myoblasts from human embryonic stem cells. [DOI] [PubMed] [Google Scholar]
- 12.Mahmood A, Harkness L, Schrøder HD, Abdallah BM, Kassem M. Enhanced differentiation of human embryonic stem cells to mesenchymal progenitors by inhibition of TGF-beta/activin/nodal signaling using SB-431542. Journal of Bone and Mineral Research. 2010;25(6):1216–1233. doi: 10.1002/jbmr.34. [DOI] [PubMed] [Google Scholar]
- 13.Barberi T, Willis LM, Socci ND, Studer L. Derivation of multipotent mesenchymal precursors from human embryonic stem cells. PLoS Medicine. 2005;2(6):p. e161. doi: 10.1371/journal.pmed.0020161. [DOI] [PMC free article] [PubMed] [Google Scholar]
- 14.Delorme B, Ringe J, Gallay N, et al. Specific plasma membrane protein phenotype of culture-amplified and native human bone marrow mesenchymal stem cells. Blood. 2008;111(5):2631–2635. doi: 10.1182/blood-2007-07-099622. [DOI] [PubMed] [Google Scholar]
- 15.Kaps C, Hoffmann A, Zilberman Y, et al. Distinct roles of BMP receptors type IA and IB in osteo-/chondrogenic differentiation in mesenchymal progenitors (C3H10T1/2) BioFactors. 2004;20(2):71–84. doi: 10.1002/biof.5520200202. [DOI] [PubMed] [Google Scholar]
- 16.Lavery K, Swain P, Falb D, Alaoui-Ismaili MH. BMP-2/4 and BMP-6/7 differentially utilize cell surface receptors to induce osteoblastic differentiation of human bone marrow-derived mesenchymal stem cells. Journal of Biological Chemistry. 2008;283(30):20948–20958. doi: 10.1074/jbc.M800850200. [DOI] [PMC free article] [PubMed] [Google Scholar]
- 17.Delorme B, Ringe J, Pontikoglou C, et al. Specific lineage-priming of bone marrow mesenchymal stem cells provides the molecular framework for their plasticity. Stem Cells. 2009;27(5):1142–1151. doi: 10.1002/stem.34. [DOI] [PubMed] [Google Scholar]
- 18.Ulloa-Montoya F, Kidder BL, Pauwelyn KA, et al. Comparative transcriptome analysis of embryonic and adult stem cells with extended and limited differentiation capacity. Genome Biology. 2007;8(8):p. R163. doi: 10.1186/gb-2007-8-8-r163. [DOI] [PMC free article] [PubMed] [Google Scholar]
- 19.Greco SJ, Rameshwar P. Enhancing effect of IL-1alpha on neurogenesis from adult human mesenchymal stem cells: implication for inflammatory mediators in regenerative medicine. Journal of Immunology. 2007;179(5):3342–3350. doi: 10.4049/jimmunol.179.5.3342. [DOI] [PubMed] [Google Scholar]
- 20.van den Berk LC, Jansen BJ, Siebers-Vermeulen KG, et al. Mesenchymal stem cells respond to TNF but do not produce TNF. Journal of Leukocyte Biology. 2010;87(2):283–289. doi: 10.1189/jlb.0709467. [DOI] [PubMed] [Google Scholar]
- 21.Batard P, Monier MN, Fortunel N, et al. TGF-(beta)1 maintains hematopoietic immaturity by a reversible negative control of cell cycle and induces CD34 antigen up-modulation. Journal of Cell Science. 2000;113(3):383–390. doi: 10.1242/jcs.113.3.383. [DOI] [PubMed] [Google Scholar]
- 22.Fortunel N, Hatzfeld J, Kisselev S, et al. Release from quiescence of primitive human hematopoietic stem/progenitor cells by blocking their cell-surface TGF-beta type II receptor in a short-term in vitro assay. Stem Cells. 2000;18(2):102–111. doi: 10.1634/stemcells.18-2-102. [DOI] [PubMed] [Google Scholar]
- 23.Fortunel NO, Hatzfeld A, Hatzfeld JA. Transforming growth factor-beta: pleiotropic role in the regulation of hematopoiesis. Blood. 2000;96(6):2022–2036. [PubMed] [Google Scholar]
- 24.Sansilvestri P, Cardoso AA, Batard P, et al. Early CD34(high) cells can be separated into KIT(high) cells in which transforming growth factor-beta (TGF-beta) downmodulates c-kit and KIT(low) cells in which anti-TGF-beta upmodulates c-kit. Blood. 1995;86(5):1729–1735. [PubMed] [Google Scholar]
- 25.Gunji Y, Nakamura M, Osawa H, et al. Human primitive hematopoietic progenitor cells are more enriched in KIT(low) cells than in KIT(high) cells. Blood. 1993;82(11):3283–3289. [PubMed] [Google Scholar]
- 26.Kawashima I, Zanjani ED, Almaida-Porada G, Flake AW, Zeng H, Ogawa M. CD34+ human marrow cells that express low levels of Kit protein are enriched for long-term marrow-engrafting cells. Blood. 1996;87(10):4136–4142. [PubMed] [Google Scholar]
- 27.Xiao M, Oppenlander BK, Plunkett JM, Dooley DC. Expression of Flt3 and c-kit during growth and maturation of human CD34+CD38- cells. Experimental Hematology. 1999;27(5):916–927. doi: 10.1016/s0301-472x(99)00020-x. [DOI] [PubMed] [Google Scholar]
- 28.Fortunel NO, Hatzfeld JA, Rosemary PA, et al. Long-term expansion of human functional epidermal precursor cells: promotion of extensive amplification by low TGF-beta1 concentrations. Journal of Cell Science. 2003;116(19):4043–4052. doi: 10.1242/jcs.00702. [DOI] [PubMed] [Google Scholar]
- 29.Li A, Simmons PJ, Kaur P. Identification and isolation of candidate human keratinocyte stem cells based on cell surface phenotype. Proceedings of the National Academy of Sciences of the United States of America. 1998;95(7):3902–3907. doi: 10.1073/pnas.95.7.3902. [DOI] [PMC free article] [PubMed] [Google Scholar]
- 30.Bianco P, Robey PG, Saggio I, Riminucci M. “Mesenchymal” stem cells in human bone marrow (Skeletal Stem Cells): a critical discussion of their nature, identity, and significance in incurable skeletal disease. Human Gene Therapy. 2010;21(9):1057–1066. doi: 10.1089/hum.2010.136. [DOI] [PMC free article] [PubMed] [Google Scholar]
- 31.Dexter TM, Allen TD, Scott D, Teich NM. Isolation and characterisation of a bipotential haematopoietic cell line. Nature. 1979;277(5696):471–474. doi: 10.1038/277471a0. [DOI] [PubMed] [Google Scholar]
- 32.Moore MA, Sheridan AP, Allen TD, Dexter TM. Prolonged hematopoiesis in a primate bone marrow culture system: characteristics of stem cell production and the hematopoietic microenvironment. Blood. 1979;54(4):775–793. [PubMed] [Google Scholar]
- 33.Peiffer I, Belhomme D, Barbet R, et al. Simultaneous differentiation of endothelial and trophoblastic cells derived from human embryonic stem cells. Stem Cells and Development. 2007;16(3):393–401. doi: 10.1089/scd.2006.0013. [DOI] [PubMed] [Google Scholar]
- 34.Thomson JA, Itskovitz-Eldor J, Shapiro SS, et al. Embryonic stem cell lines derived from human blastocysts. Science. 1998;282(5391):1145–1147. doi: 10.1126/science.282.5391.1145. [DOI] [PubMed] [Google Scholar]
- 35.Livak KJ, Schmittgen TD. Analysis of relative gene expression data using real-time quantitative PCR and the 2(-Delta Delta C(T)) method. Methods. 2001;25(4):402–408. doi: 10.1006/meth.2001.1262. [DOI] [PubMed] [Google Scholar]
- 36.Willems E, Leyns L, Vandesompele J. Standardization of real-time PCR gene expression data from independent biological replicates. Analytical Biochemistry. 2008;379(1):127–129. doi: 10.1016/j.ab.2008.04.036. [DOI] [PubMed] [Google Scholar]
- 37.Weksberg R, Hughes S, Moldovan L, Bassett AS, Chow EW, Squire JA. A method for accurate detection of genomic microdeletions using real-time quantitative PCR. BMC Genomics. 2005;6:p. 180. doi: 10.1186/1471-2164-6-180. [DOI] [PMC free article] [PubMed] [Google Scholar]
- 38.Arpornmaeklong P, Brown SE, Wang Z, Krebsbach PH. Phenotypic characterization, osteoblastic differentiation, and bone regeneration capacity of human embryonic stem cell-derived mesenchymal stem cells. Stem Cells and Development. 2009;18(7):955–968. doi: 10.1089/scd.2008.0310. [DOI] [PMC free article] [PubMed] [Google Scholar]
- 39.Hwang NS, Varghese S, Lee HJ, et al. In vivo commitment and functional tissue regeneration using human embryonic stem cell-derived mesenchymal cells. Proceedings of the National Academy of Sciences of the United States of America. 2008;105(52):20641–20646. doi: 10.1073/pnas.0809680106. [DOI] [PMC free article] [PubMed] [Google Scholar]
- 40.Brown SE, Tong W, Krebsbach PH. The derivation of mesenchymal stem cells from human embryonic stem cells. Cells Tissues Organs. 2008;189(1–4):256–260. doi: 10.1159/000151746. [DOI] [PMC free article] [PubMed] [Google Scholar]
- 41.Djouad F, Bony C, Canovas F, et al. Transcriptomic analysis identifies foxo3a as a novel transcription factor regulating mesenchymal stem cell chrondrogenic differentiation. Cloning and Stem Cells. 2009;11(3):407–416. doi: 10.1089/clo.2009.0013. [DOI] [PubMed] [Google Scholar]
- 42.Zhao L, Li G, Chan KM, Wang Y, Tang PF. Comparison of multipotent differentiation potentials of murine primary bone marrow stromal cells and mesenchymal stem cell line C3H10T1/2. Calcified Tissue International. 2009;84(1):56–64. doi: 10.1007/s00223-008-9189-3. [DOI] [PubMed] [Google Scholar]
- 43.Aziz A, Miyake T, Engleka KA, Epstein JA, McDermott JC. Menin expression modulates mesenchymal cell commitment to the myogenic and osteogenic lineages. Developmental Biology. 2009;332(1):116–130. doi: 10.1016/j.ydbio.2009.05.555. [DOI] [PubMed] [Google Scholar]
- 44.Peiffer I, Barbet R, Zhou YP, et al. Use of xenofree matrices and molecularly-defined media to control human embryonic stem cell pluripotency: effect of low physiological TGF-beta concentrations. Stem Cells and Development. 2008;17(3):519–533. doi: 10.1089/scd.2007.0279. [DOI] [PubMed] [Google Scholar]
- 45.D’Ippolito G, Diabira S, Howard GA, Menei P, Roos BA, Schiller PC. Marrow-isolated adult multilineage inducible (MIAMI) cells, a unique population of postnatal young and old human cells with extensive expansion and differentiation potential. Journal of Cell Science. 2004;117(14):2971–2981. doi: 10.1242/jcs.01103. [DOI] [PubMed] [Google Scholar]
- 46.Stockis J, Colau D, Coulie PG, Lucas S. Membrane protein GARP is a receptor for latent TGF-beta on the surface of activated human treg. European Journal of Immunology. 2009;39(12):3315–3322. doi: 10.1002/eji.200939684. [DOI] [PubMed] [Google Scholar]
- 47.Gautam SC, Noth CJ, Niewenhuis LM, Janakiraman N, Kim JS, Chopp M. Transforming growth factor beta-1 (TGF-beta 1) potentiates IL1 alpha-induced IL6 mRNA and cytokine protein production in a human astrocytoma cell line. Oncology Research. 1993;5(10-11):423–432. [PubMed] [Google Scholar]
- 48.Vambutas A, DeVoti J, Goldofsky E, Gordon M, Lesser M, Bonagura V. Alternate splicing of interleukin-1 receptor type II (IL1R2) in vitro correlates with clinical glucocorticoid responsiveness in patients with AIED. PLoS ONE. 2009;4(4):p. e5293. doi: 10.1371/journal.pone.0005293. [DOI] [PMC free article] [PubMed] [Google Scholar]
- 49.Qiu T, Wu X, Zhang F, Clemens TL, Wan M, Cao X. TGF-beta type II receptor phosphorylates PTH receptor to integrate bone remodelling signalling. Nature Cell Biology. 2010;12(3):224–234. doi: 10.1038/ncb2022. [DOI] [PMC free article] [PubMed] [Google Scholar]
- 50.Romero G, Sneddon WB, Yang Y, Wheeler D, Blair HC, Friedman PA. Parathyroid hormone receptor directly interacts with dishevelled to regulate beta-catenin signaling and osteoclastogenesis. Journal of Biological Chemistry. 2010;285(19):14756–14763. doi: 10.1074/jbc.M110.102970. [DOI] [PMC free article] [PubMed] [Google Scholar]
- 51.Weiss S, Hennig T, Bock R, Steck E, Richter W. Impact of growth factors and PTHrP on early and late chondrogenic differentiation of human mesenchymal stem cells. Journal of Cellular Physiology. 2010;223(1):84–93. doi: 10.1002/jcp.22013. [DOI] [PubMed] [Google Scholar]
- 52.Nedeau AE, Bauer RJ, Gallagher K, Chen H, Liu ZJ, Velazquez OC. A CXCL5- and bFGF-dependent effect of PDGF-B-activated fibroblasts in promoting trafficking and differentiation of bone marrow-derived mesenchymal stem cells. Experimental Cell Research. 2008;314(11-12):2176–2186. doi: 10.1016/j.yexcr.2008.04.007. [DOI] [PMC free article] [PubMed] [Google Scholar]
- 53.Muley A, Majumder S, Kolluru GK, et al. Secreted frizzled-related protein 4: an angiogenesis inhibitor. American Journal of Pathology. 2010;176(3):1505–1516. doi: 10.2353/ajpath.2010.090465. [DOI] [PMC free article] [PubMed] [Google Scholar]
- 54.Si W, Kang Q, Luu HH, et al. CCN1/Cyr61 is regulated by the canonical Wnt signal and plays an important role in Wnt3A-induced osteoblast differentiation of mesenchymal stem cells. Molecular and Cellular Biology. 2006;26(8):2955–2964. doi: 10.1128/MCB.26.8.2955-2964.2006. [DOI] [PMC free article] [PubMed] [Google Scholar]
- 55.Baines P, Mayani H, Bains M, Fisher J, Hoy T, Jacobs A. Enrichment of CD34 (My10)-postitive myeloid and erythroid progenitors from human marrow and their growth in cultures supplemented with recombinant human granulocyte-macrophage colony-stimulating factor. Experimental Hematology. 1988;16(9):785–789. [PubMed] [Google Scholar]
- 56.Kaiser S, Hackanson B, Follo M, et al. BM cells giving rise to MSC in culture have a heterogeneous CD34 and CD45 phenotype. Cytotherapy. 2007;9(5):439–450. doi: 10.1080/14653240701358445. [DOI] [PubMed] [Google Scholar]
- 57.Simmons PJ, Torok-Storb B. CD34 expression by stromal precursors in normal human adult bone marrow. Blood. 1991;78(11):2848–2853. [PubMed] [Google Scholar]
Associated Data
This section collects any data citations, data availability statements, or supplementary materials included in this article.
Supplementary Materials
Supplementary list of genes: in order to share with other laboratories our database of results on hESCs, hES-MSCs, and hMSCs, we added the list of tested genes, for each, including the following information: Gene Symbol; Gene Name; TaqMan assay number and NCBI RefSeq accession number of the respective TaqMan assay.