

Abstract
Objective
This study explores whether the relationship between lower socioeconomic status and insulin resistance in adolescents is mediated by both physiological and psychological factors associated with increased cardiometabolic risk
Study design
School-based longitudinal cohort study of 1222 healthy, non-Hispanic black and white teens. Parent education (PE), youth-specific Cook-Medley hostility scale, waist circumference, height, weight, pubertal status, and fasting plasma insulin (FPI) were measured and FPI reassessed 1 year later. Regression analyses utilizing bootstrapping (n = 2000) were used to estimate the direct and indirect effects of PE on FPI and assess the role of hostility and adiposity while adjusting for covariates.
Results
Lower PE predicted higher FPI (B = −1.52, P = .003), as did hostility (B = .19, P = .002) and adiposity (waist circumference B = .44, P < .001, BMI B = .98, P < .001). The effect of PE on FPI was mediated by both hostility and adiposity. When adiposity and hostility were accounted for, the effect of PE on FPI decreased by 32% (B = −1.04, P = .04); the total indirect estimate was −.485 (95% CI, −.652, −.041). Hostility accounted for 36% of the meditational effect.
Conclusions
Lower PE influences insulin resistance through adiposity and hostility. Thus, interventions to reduce health disparities associated with insulin resistance should consider both physiological and psychological approaches.
Disparities in cardiovascular disease (CVD), the leading cause of death in the United States, are well established and a major population health concern. Lower education is consistently associated with increased cardiovascular risk in adult populations.1 In addition, reports have demonstrated that childhood socioeconomic status (SES), often measured by parental educational attainment, have a persistent effect on CVD risk independent of adult educational attainment.2 Although these disparities are well documented, little is known about the mechanisms underlying their pervasive effects or the developmental origins of such disparities.
Investigators have suggested that metabolic syndrome, a clustering of cardiovascular risk factors, is a possible pathway through which socioeconomic inequalities influence adult CVD risk and the development of socioeconomic gradients in CVD.3 A number of studies have linked SES, particularly educational attainment, to metabolic syndrome in adults.4,5 Because this syndrome is associated with insulin resistance, studying disparities in insulin resistance early in life may elucidate the processes underlying development of disparities in adult CVD. Recent studies that demonstrated an association between lower parent education and higher insulin resistance in children and adolescents lend support to the hypothesis that insulin resistance may be a mediator in the relationships between lower SES and increased risk for CVD.6–8
Insulin resistance is influenced by both physiological and psychological factors, many of which are associated with lower SES. For example, adiposity is strongly associated with increased insulin resistance in adolescence, independent of sex, age, and race/ethnicity.9,10 Specifically, obesity is more prevalent among lower SES youth,11 and educational disparities in insulin resistance are particularly pronounced among obese adolescents and young adults.8 With regard to psychological factors, negative emotions also appear to influence cardiovascular risk12 and may explain disparities in insulin resistance among youth.
Hostility is a noteworthy candidate as a psychological mediator of socioeconomic disparities in insulin resistance in adolescence. Over the past two decades, multiple studies have shown relationships between hostility and CVD among adults.13,14 Several studies of adults find an inverse relationship between education and hostility15–17 and suggest that hostility is related to several parameters of glucose metabolism.18 In addition, lower family SES has been associated with greater hostility and increased cardiovascular reactivity in non-Hispanic blacks.19 Furthermore, hostility has been associated with coronary calcification, a subclinical measure of CVD, in young healthy adults,20,21 and there is evidence to suggest that the association between hostility and cardiovascular disease is stronger in younger individuals.22 However, studies to assess the relationships between SES, hostility, and insulin resistance in adolescence are lacking.
The objective of this prospective cohort study is to determine whether adiposity, a physiological factor, and hostility, a psychological factor, represent mechanisms underlying the association between lower SES and insulin resistance in adolescents. Few investigations provide a direct statistical test of mediation,23 and none, to our knowledge, have simultaneously assessed both physiological and psychological potential mediators of socioeconomic disparities in CVD risk.
Methods
Data were obtained from 1222 non-Hispanic black and white participants in Phase 1 the Princeton School District Study, a longitudinal cohort study situated in the Princeton City School District in Cincinnati, Ohio, which began in the 2001 to 2002 school year and included 4 annual waves of data collection in Phase 1.26 Study visits, including a questionnaire, physical exam, and a blood draw from participants occurred in the morning after a minimum 10-hour overnight fast. Parental consent and student assent or consent for those 18 years of age or older were obtained. For those participants who became 18 years of age between waves, consent was reobtained at the next follow-up visit. This study was approved by the institutional review board of the participating hospital and university.
Hostility was assessed at Waves 3 and 4. Thus, inclusion criteria for the present study were (1) completed the physical exam, blood draw, and questionnaire in Waves 3 to 4, (2) parent provided information on parent education, and (3) non-Hispanic black or white. The latter inclusion criterion was applied because the school district's population was 47.3 % non-Hispanic white and 47.2% non-Hispanic black. Of the 1715 non-Hispanic black and white participants seen at Wave 3 to 4, 1222 (71%) met inclusion criteria and comprise the study sample. The sample was 44.8% non-Hispanic black, 51.6% female. Mean (SD) age at baseline was 16.0 (2.0) years, with a range of 11.9 to 20.9 years. Only 1 subject was prepubertal and 73% (n = 892) were pubertal. Because the assessment of hostility began in Wave 3, for the purposes of the current report, data from this wave will be referred to as “baseline” and data from Wave 4 will be referred to as “follow up”.
Measures
Parental education was used to assess SES. One parent provided information on educational attainment for themselves and their current spouse/partner. For analyses, these categories were further condensed into four groups—less than or equal to high school, some college or technical/vocational training beyond high school, college graduate, and professional training beyond college. The highest education level that was reported was used in analyses. We chose to include those with less than a high school degree and those with a high school degree in the same group because very few subjects (n = 48) had parent(s) with less than a high school education. To make sure we were not masking important differences by including these groups in a single category, we assessed if differences in hostility, waist circumference, body mass index (BMI), or insulin existed between those without a high school educated parent and those from families with the highest level of parent education was high school/GED. None were found.
The 23-item adolescent version of the Cook-Medley Hostility (Ho) Index was administered.24 This scale has high internal consistency reliability and has been shown to be valid in a racially and ethnically diverse sample of adolescents.24,25 In this sample, Cronbach α = 0.80. Scores can range from 23 to 92, with higher scores indicating greater hostility.
A fiberglass tape crossing over the umbilicus and the superior iliac crests was used to measure waist circumference as an index of central obesity. The mean of two measurements made at the end of a normal expiration was used in analyses. BMI (kg/m2) was calculated from height and weight; the measurement of these variables has been described previously.26 For participants under age 20 years, obesity was defined as a BMI-for-age ≥95%, based on the sex-specific 2000 Centers for Disease Control growth chart reference standard or BMI ≥30; overweight was defined as a BMI-for-age between the 85% to the <95% and normal weight as a BMI-for-age <85%. For participants over 20 years age [n = 3 (0.2%) at baseline and n = 42 (3.4%) at follow-up], obesity was defined as a BMI ≥30 and overweight as BMI ≥25 but <30.
Euglycemic clamps are the gold standard for measurement of insulin sensitivity but are not practical for a large epidemiological study. Therefore, insulin resistance was assessed by fasting plasma insulin (FPI). Multiple studies support use of FPI as a surrogate marker.27 FPI was measured by radioimmunoassay using an anti-insulin serum raised in guinea pigs, 125I-labeled insulin as a standard, and a double antibody method to separate bound from free tracer.28 The sensitivity is 2 pM, with intra-assay and interassay CVs of 5% and 8%, respectively.
Demographic covariates were provided through the school administrative data. These included date of birth (used to determine age), parent-reported race/ethnicity, and sex. Pubertal status (prepubertal, pubertal, and postpubertal) was assessed, according to a validated protocol using sex steroid hormone levels, history of menarche for girls and physical exam data on axillary hair for boys.28
Statistical Analyses
Analyses were performed using SPSS for Windows v15 (SPSS Inc., Chicago, Illinois). Sex, race/ethnicity, and parental education differences were tested with χ2 tests for categorical variables and Mann-Whitney U or Kruskal Wallis tests for continuous variables because these were not normally distributed. Correlational analyses were performed using Spear-man ρ for the same reason.
We sought to understand whether hostility and/or adiposity mediate the association between parental education and insulin resistance in adolescents. Conceptually, (Figure 1, A; available at www.jpeds.com), a mediator (M) lies on the casual pathway between an independent variable (X) and an outcome (Y). The effect of X on Y when M is not considered is termed the “total effect.” When M is considered, the portion of the effect of X on Y which is accounted for by M is termed the “indirect effect.” Once the indirect effect(s) are accounted for, the remaining effect of X on Y is termed the “direct effect.” If M accounts for only part of the total effect of X on Y, the mediation effect is “partial” as opposed to “complete.” In complete mediation, the entire effect of X on Y is accounted for by M.
Figure 1.
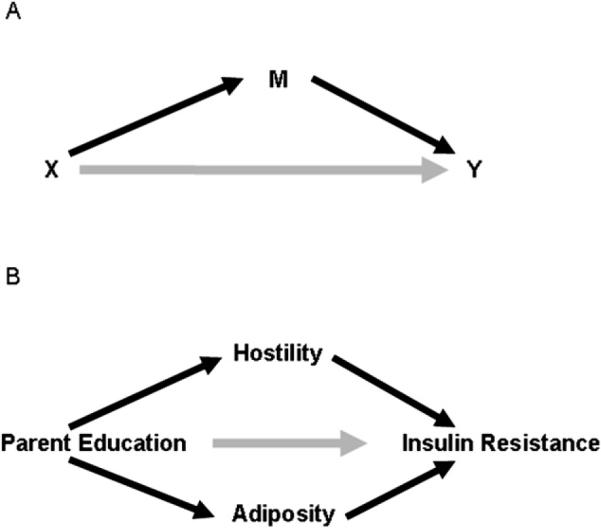
Mediational Model. A, Presents the general mediational model. B, Presents the hypothetical mediational model tested in this study.
In our hypothesized mediational model (Figure 1, B; available at www.jpeds.com), because parent education was finalized before the Princeton School District Study and we follow participants prospectively, there is a longitudinal time sequence of parent education (X) leading to baseline adiposity/hostility (M), which, in turn, led to follow-up FPI (Y). This time sequencing enables us to build a stronger case for causal inference than the use of mediational models with cross-sectional data allows. The model in Figure 1, B was tested using regression analyses with bootstrapping, a non-parametric resampling procedure that is useful when assumptions of normality cannot be met, as was the case here. We evaluated 2000 bootstrapped samples using an SPSS Macro for assessing multiple mediators.29 Colinearity of baseline waist circumference and BMI (r = 0.93, P < .001) precluded inclusion of both measures of adiposity in a single model. Therefore, models were run separately for waist circumference and BMI. We assessed BMI as a general measure of adiposity rather than BMI z score or BMI-for-age because some participants were more than 20 years of age at baseline and thus could not be classified relative to the CDC BMI growth reference. Baseline covariates considered in analyses were age, FPI, pubertal status, sex, and race. Length of follow-up was also included as a covariate in all models.
Results
Table I provides a description of these factors in this study sample. There were no sex differences in parent education, weight status, or BMI (Table I). With regard to racial disparities, black youth came from less well-educated households, were more likely to be overweight or obese, and had higher hostility, insulin, and BMI. White boys had higher waist circumference than black boys (P < .001), but there were no racial differences in waist circumference among girls, nor were there racial differences in pubertal stage for either sex.
Table I.
Description of the study sample
| Total (n = 1222) |
Male (n = 591) |
Female (n = 631) |
White (n = 676) |
Black (n = 546) |
||||||||
|---|---|---|---|---|---|---|---|---|---|---|---|---|
| n | % | n | % | n | % | P* | n | % | n | % | P* | |
| Parent Education | .46 | <.001 | ||||||||||
| ≤High school | 268 | 21.9 | 140 | 23.7 | 128 | 20.3 | 116 | 17.2 | 152 | 27.8 | ||
| >High school, <College | 349 | 28.6 | 160 | 27.1 | 189 | 30.0 | 147 | 21.7 | 202 | 37.0 | ||
| College degree | 348 | 28.5 | 169 | 28.6 | 179 | 28.4 | 213 | 31.5 | 135 | 24.7 | ||
| Prof training | 257 | 21.0 | 122 | 20.6 | 135 | 21.4 | 200 | 29.6 | 57 | 10.4 | ||
| Pubertal stage at baseline | <.001 | .24 | ||||||||||
| Prepubertal | 1 | 0.1 | 1 | 0.1 | 0 | 0 | 0 | 0 | 1 | 0.2 | ||
| Peripubertal | 329 | 26.9 | 206 | 34.9 | 123 | 19.5 | 192 | 28.6 | 137 | 25.1 | ||
| Postpubertal | 892 | 73.0 | 384 | 65.0 | 508 | 80.5 | 484 | 71.6 | 408 | 74.7 | ||
| Weight status at baseline | .31 | <.001 | ||||||||||
| Normal Weight | 753 | 61.6 | 373 | 63.1 | 380 | 60.2 | 455 | 67.3 | 298 | 54.6 | ||
| Overweight | 228 | 18.6 | 111 | 18.8 | 117 | 18.5 | 117 | 17.3 | 111 | 20.3 | ||
| Obese | 241 | 19.7 | 107 | 18.1 | 134 | 21.2 | 104 | 15.4 | 137 | 25.1 | ||
| Follow-up weight status | .39 | <.001 | ||||||||||
| Normal Weight | 733 | 60.0 | 358 | 60.6 | 375 | 59.4 | 442 | 65.4 | 298 | 53.3 | ||
| Overweight | 241 | 19.7 | 122 | 20.6 | 119 | 18.9 | 133 | 19.7 | 108 | 19.8 | ||
| Obese | 248 | 20.3 | 111 | 18.8 | 137 | 21.7 | 101 | 14.9 | 147 | 26.9 | ||
| Mean | SD | Med† | Mean | SD | Med† | Mean | SD | Med† | P* | Mean | SD | Med† | Mean | SD | Med† | P* | |
|---|---|---|---|---|---|---|---|---|---|---|---|---|---|---|---|---|---|
| Hostility | |||||||||||||||||
| Baseline | 52.2 | 8.3 | 52.0 | 53.3 | 7.8 | 53.0 | 51.1 | 8.5 | 52.0 | <.001 | 50.8 | 8.3 | 51.0 | 53.8 | 7.9 | 53.8 | <.001 |
| Follow-up | 51.6 | 8.4 | 52.0 | 52.6 | 8.4 | 53.0 | 50.7 | 8.4 | 51.0 | <.001 | 50.6 | 8.1 | 50.1 | 52.9 | 8.6 | 53.0 | <.001 |
| Insulin (mIU/L) | |||||||||||||||||
| Baseline | 18.8 | 17.9 | 13.8 | 17.8 | 19.6 | 12.1 | 19.8 | 16.0 | 15.2 | <.001 | 16.9 | 17.0 | 12.6 | 21.3 | 18.6 | 15.5 | <.001 |
| Follow-up | 20.2 | 20.3 | 14.67 | 19.2 | 20.2 | 13.2 | 21.1 | 20.3 | 15.5 | <.001 | 17.6 | 17.1 | 12.9 | 23.4 | 23.2 | 16.8 | <.001 |
| BMI | |||||||||||||||||
| Baseline | 24.5 | 6.2 | 22.9 | 24.1 | 5.6 | 22.7 | 24.9 | 6.7 | 23.0 | .18 | 23.6 | 5.3 | 22.4 | 25.6 | 7.0 | 23.5 | <.001 |
| Follow-up | 25.0 | 6.4 | 23.4 | 24.8 | 5.8 | 23.4 | 25.3 | 6.8 | 23.4 | .56 | 24.1 | 5.4 | 22.8 | 26.2 | 7.2 | 24.1 | <.001 |
| Waist circumference (cm) | |||||||||||||||||
| Baseline | 82.7 | 14.7 | 79.1 | 82.1 | 14.9 | 77.7 | 83.3 | 14.6 | 80.0 | .04 | 82.7 | 13.6 | 80.0 | 82.8 | 16.1 | 78.1 | .08 |
| Follow-up | 84.4 | 15.0 | 80.5 | 80.8 | 15.2 | 79.8 | 84.9 | 15.0 | 81.2 | .07 | 82.8 | 13.8 | 80.8 | 84.6 | 16.6 | 79.5 | .18 |
χ2 (categorical variable) or Mann-Whitney U (continuous variable) test.
Median.
The first step in assessing mediation was to determine the association of parent education to the potential mediators (hostility, BMI, and waist circumference) and to the dependent variable (FPI at follow-up). Results of these analyses are shown in Table II. Parent education was associated with both mediators and the dependent variable. Second, for mediation to be present, the mediators must be associated with dependent variable. Baseline hostility and the 2 measures of adiposity were associated with follow-up FPI (Spearman ρ =0.13, P < .001 for hostility: Spearman ρ =0.42,P <.01 for both waist circumference and BMI). Interestingly, hostility was not correlated with waist circumference (Spearman ρ =0.07, P = .07) but was associated with BMI (Spearman ρ = 0.12, P =.005).
Table II.
Association of parent education to hostility, adiposity, and insulin among 1222 adolescents in the PSD Study
| Parent education |
|||||||||||||
|---|---|---|---|---|---|---|---|---|---|---|---|---|---|
| ≤HS (n = 268) |
>HS, <College (n = 349) |
College (n = 348) |
Professional degree (n = 257) |
||||||||||
| Mean | SD | Median | Mean | SD | Median | Mean | SD | Median | Mean | SD | Median | P | |
| Hostility | 54.0 | 8.1 | 54.0 | 52.9 | 8.1 | 53.0 | 51.5 | 8.3 | 52.0 | 50.0 | 8.1 | 50.0 | <.001 |
| BMI | 24.9 | 6.6 | 23.0 | 25.8 | 7.4 | 23.5 | 24.0 | 5.4 | 22.8 | 22.9 | 4.4 | 21.8 | <.001 |
| Waist circumference (cm) | 83.4 | 16.2 | 79.1 | 85.0 | 16.8 | 81.0 | 82.1 | 13.4 | 78.6 | 82.7 | 14.8 | 78.2 | .016 |
| Insulin (mIU/L) | |||||||||||||
| Baseline | 24.0 | 26.3 | 16.1 | 20.9 | 17.3 | 15.7 | 16.1 | 11.8 | 12.5 | 14.3 | 11.9 | 10.9 | <.001 |
| Follow-up | 25.0 | 26.5 | 16.8 | 23.2 | 22.7 | 17.3 | 17.0 | 12.9 | 13.8 | 15.3 | 15.0 | 11.7 | <.001 |
HS, high school.
Regression Analyses to Assess Mediation
Figure 2, B (total and direct effects) and Table III (indirect effects) present results of the multivariable regression models to test for mediation. The relationships demonstrated in bivariate analyses remained significant in the multivariable models. Parent education was inversely related to both mediators. Higher parent education was associated with lower adiposity and lower hostility. Furthermore, hostility and adiposity were directly associated with FPI, with higher hostility and higher adiposity at baseline predicting higher FPI at follow-up. Both adiposity and hostility partially mediated the effect of parent education on FPI. These mediators together accounted for 31.9% of the effect of parent education on FPI regardless of which measure of adiposity was tested. Although the mediational effect of adiposity was stronger than that of hostility, hostility accounted for more than one third (36%) of the indirect effect. Overall, the regression models accounted for 30% of the variance in follow-up fasting insulin levels.
Figure 2.
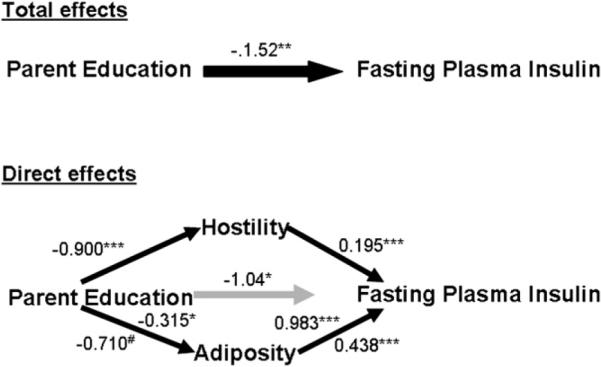
Parameter estimates of the effect of parent education on fasting plasma insulin in 1222 adolescents in the Princeton School District Study followed for 1 year. Results for BMI are reported above the path line and results for waist circumference below the path line. Analyses adjusted for sex, race/ethnicity, time to follow-up, baseline age, baseline pubertal status, and baseline fasting plasma insulin. *0.01 < P ≤ .05. ** .001 < P < .01. ***P < .001. #P = .052.
Table III.
Results of bootstrapping analyses for indirect effects of parent education on fasting plasma insulin
| Waist circumference model |
BMI model |
|||
|---|---|---|---|---|
| Indirect effect estimate | 95% CIs | Indirect effect estimate | 95% CIs | |
| Parent education indirect effect | −0.485 | −0.856, −0.186 | −0.485 | −0.861, −0.201 |
| Hostility mediated | −0.174 | −0.354, −.063 | −0.176 | −0.370, −0.075 |
| Adiposity mediated | −0.311 | −.652, −.041 | −0.309 | −0.630, −0.053, |
| Proportion of parent education indirect effect accounted for by hostility | 35.9 | 36.3 | ||
| Model adj R2 | 0.302 | 0.294 | ||
Model adjusts for age, pubertal status, sex, race, time to follow-up, and baseline FPI.
Discussion
This prospective cohort study of non-Hispanic black and white adolescents demonstrates that independent of race, the relationship between lower parent education and greater insulin resistance may be partially explained by both increased adiposity and higher hostility. Together, these factors account for approximately one third of the effect of lower parent education on insulin resistance. Remarkably, despite the very strong relationship between adiposity and insulin resistance, the effect of hostility on fasting plasma insulin was substantial.
This study focused on hostility because reports in adults have identified hostility as a CVD risk factor.13,14 Interest in this psychological trait grew out of research on Type A behavior pattern, which demonstrated that hostility, often measured by the Cook-Medley Hostility scale, was the pathologic component of this personality type.21 Among adults, research suggests that hostility is higher in men, racial/ethnic minorities in the United States, and lower socioeconomic status groups.14,15,30 We found that hostility was higher among African American youth, a finding mirrored in studies of young adults.15
Few studies have attempted to explore if and how the relationships between hostility and CVD risk demonstrated in adults relate to childhood and adolescent precursors of CVD. Such studies are critical given that hostility is a malleable trait, not one that develops early in life and remains static.31 Furthermore, the effect of hostility on CVD risk in adults appears to be associated with physiologic rather than behavioral risks,32 findings that imply that hostility may affect physiologic regulation early in the life course. Raikkonen et al33 demonstrated that hostility predicted metabolic risk factor clustering, including insulin resistance and adiposity among 134 children and adolescents. Hostility scores measured during late adolescence and early adulthood have also been shown to predict dyslipidemia and a higher body mass index 21 to 23 years later.34 Our findings support a role for this psychological factor in the development and persistence of insulin resistance and, potentially, type 2 diabetes. Several theoretical models have been proposed for how hostility influences disease risk, including stress models that posit that lower SES leads to increased adversity and resultant neuroendocrine stress,35,36 and health behavior models, which suggest that increased hostility is associated with more risky behaviors.35 Further research is needed to determine if these models explain the associations demonstrated in this study.
Several limitations of the current undertaking are noteworthy. First, our measures of adiposity were limited to BMI and waist circumference, neither of which measure fat mass or its distribution directly. Nonetheless, both measures are well correlated with adiposity measures in adolescents, with correlations in the range of 0.7 to 0.9.37 Furthermore, the close consistency of findings across these distinct anthropometric measures suggest they are reflecting fat mass rather than other aspects of body composition. Second, our measure of socioeconomic status, a complex trait, was based solely on parental education of the more educated parent and did not account for other domains of SES such as household income, occupational prestige, or wealth/assets. We chose to focus on education as it has been linked with other psychological health-related psychological traits in adolescence.38 Third, we do not have information on behavioral risks, although data suggest that hostility has direct effects independent of health behaviors.35 Fourth, because adolescent who are in the process of developing diabetes will have compromised β cell secretory ability resulting in low or normal plasma insulin values, these analyses will not differentiate such prediabetic adolescents from adolescents with normal insulin sensitivity. Finally, the follow-up period used for these analyses was relatively short, and 1 year may not have provided sufficient time for the full impact of hostility to be reflected in insulin sensitivity.
These limitations are offset by several strengths. The data are derived from a large community-based biracial cohort with broad socioeconomic variation and excellent follow-up. The prospective study design appropriately separates the psychological and physiological risk factors from the health outcome of interest and strengthens causal inference, which underlies meditational hypotheses. We provided a formal test of the mediation hypothesis using newer statistical techniques. Most importantly, the Preacher and Hayes macro overcomes the substantial limitations of other formal tests of mediation, such as the Sobel test, which do not delineate confidence intervals around the indirect effect estimates. Further, to our knowledge, this is the first study to assess a role for hostility in the developmental pathway from educational disparities to physiologic risk. Previous reports have linked childhood SES to adult hostility levels30 and shown that hostility explains the effect of lower education on allostatic load, a multisystem measure of physiologic risk.39 However, no prior study has linked these two lines of research.
This study identified a mediating role for hostility, a psychological factor, and adiposity, a physiologic factor, in the relationship between parent education and insulin resistance. These observations contribute to an emerging understanding of how social disadvantage may influence disease risk at the individual level. Our data suggest that this translation of social factors into greater health risks works through variety of mechanisms related to both mind and body.35
These findings also have implications for weight management and obesity prevention programs for adolescents. Our findings imply that such programs, which are important preventive interventions to reduce adult cardiometabolic health disparities, may benefit from incorporating psychological approaches. Further, these data suggest that weight management programs should carefully consider the psychological impact of their programs, as interventions which inadvertently increase hostility, potentially through conflict around food, could be detrimental to long-term health, even in the face of weight loss.
Acknowledgments
Supported by NIH grants HD41527, DK59183, and M01RR 08084. S.D. is a consultant to Abbott and Schering-Plough.
Glossary
- BMI
Body mass index
- CVD
Cardiovascular disease
- FPI
Fasting plasma insulin
- SES
Socioeconomic status
Footnotes
The other authors declare no conflicts of interest.
References
- 1.Kaplan GA, Keil JE. Socioeconomic factors and cardiovascular disease: a review of the literature. Circulation. 1993;88:1973–98. doi: 10.1161/01.cir.88.4.1973. [DOI] [PubMed] [Google Scholar]
- 2.Brunner E, Shipley MJ, Blane D, Smith GD, Marmot MG. When does cardiovascular risk start? Past and present socioeconomic circumstances and risk factors in adulthood. J Epidemiol Community Health. 1999;53:757–64. doi: 10.1136/jech.53.12.757. [DOI] [PMC free article] [PubMed] [Google Scholar]
- 3.Brunner EJ, Marmot MG, Nanchahal K, Shipley MJ, Stansfeld SA, Juneja M, et al. Social inequality in coronary risk: central obesity and the metabolic syndrome. Evidence from the Whitehall II study. Diabetologia. 1997;40:1341–9. doi: 10.1007/s001250050830. [DOI] [PubMed] [Google Scholar]
- 4.Wamala SP, Lynch J, Horsten M, Mittleman MA, Schenck-Gustafsson K, Orth-Gomer K. Education and the metabolic syndrome in women. Diabetes Care. 1999;22:1999–2003. doi: 10.2337/diacare.22.12.1999. [DOI] [PubMed] [Google Scholar]
- 5.Silventoinen K, Pankow J, Jousilahti P, Hu G, Tuomilehto J. Educational inequalities in the metabolic syndrome and coronary heart disease among middle-aged men and women. Int J Epidemiol. 2005;34:327–34. doi: 10.1093/ije/dyi007. [DOI] [PubMed] [Google Scholar]
- 6.Lawlor DA, Harro M, Wedderkopp N, Andersen LB, Sardinha LB, Riddoch CJ, et al. Association of socioeconomic position with insulin resistance among children from Denmark, Estonia, and Portugal: cross sectional study. BMJ. 2005;331:183. doi: 10.1136/bmj.331.7510.183. [DOI] [PMC free article] [PubMed] [Google Scholar]
- 7.Goodman E, McEwen BS, Huang B, Dolan LM, Adler NE. Social inequalities in biomarkers of cardiovascular risk in adolescence. Psychosom Med. 2005;6:9–15. doi: 10.1097/01.psy.0000149254.36133.1a. [DOI] [PubMed] [Google Scholar]
- 8.Goodman E, Daniels SR, Dolan LM. Socioeconomic disparities in insulin resistance: results from the Princeton School District Study. Psychosom Med. 2007;69:61–7. doi: 10.1097/01.psy.0000249732.96753.8f. [DOI] [PubMed] [Google Scholar]
- 9.Lee JM, Okumura MJ, Davis MM, Herman WH, Gurney JG. Prevalence and determinants of insulin resistance among US adolescents: a population-based study. Diabetes Care. 2006;29:2427–32. doi: 10.2337/dc06-0709. [DOI] [PubMed] [Google Scholar]
- 10.Lee S, Bacha F, Gungor N, Arslanian SA. Waist circumference is an independent predictor of insulin resistance in black and white youths. J Pediatr. 2006;148:188–94. doi: 10.1016/j.jpeds.2005.10.001. [DOI] [PubMed] [Google Scholar]
- 11.Goodman E. The role of socioeconomic status gradients in explaining differences in US adolescents' health. Am J Public Health. 1999;89:1522–8. doi: 10.2105/ajph.89.10.1522. [DOI] [PMC free article] [PubMed] [Google Scholar]
- 12.Gallo LC, Matthews KA. Understanding the association between socioeconomic status and physical health: do negative emotions play a role? Psychol Bull. 2003;129:10–51. doi: 10.1037/0033-2909.129.1.10. [DOI] [PubMed] [Google Scholar]
- 13.Bunde J, Suls J. A quantitative analysis of the relationship between the Cook-Medley Hostility Scale and traditional coronary artery disease risk factors. Health Psychol. 2006;25:493–500. doi: 10.1037/0278-6133.25.4.493. [DOI] [PubMed] [Google Scholar]
- 14.Barefoot JC, Peterson BL, Dahlstrom WG, Siegler IC, Anderson NB, Williams RB., Jr. Hostility patterns and health implications: correlates of Cook-Medley Hostility Scale scores in a national survey. Health Psychol. 1991;10:18–24. doi: 10.1037//0278-6133.10.1.18. [DOI] [PubMed] [Google Scholar]
- 15.Scherwitz L, Perkins L, Chesney M, Hughes G. Cook-Medley Hostility scale and subsets: relationship to demographic and psychosocial characteristics in young adults in the CARDIA study. Psychosom Med. 1991;53:36–49. doi: 10.1097/00006842-199101000-00004. [DOI] [PubMed] [Google Scholar]
- 16.Lynch JW, Kaplan GA, Salonen JT. Why do poor people behave poorly? Variation in adult health behaviours and psychosocial characteristics by stages of the socioeconomic lifecourse. Soc Sci Med. 1997;44:809–19. doi: 10.1016/s0277-9536(96)00191-8. [DOI] [PubMed] [Google Scholar]
- 17.Schrijvers CT, Bosma H, Mackenbach JP. Hostility and the educational gradient in health: the mediating role of health-related behaviours. Eur J Public Health. 2002;12:110–6. doi: 10.1093/eurpub/12.2.110. [DOI] [PubMed] [Google Scholar]
- 18.Surwit RS, Williams RB, Siegler IC, Lane JD, Helms M, Applegate KL, et al. Hostility, race, and glucose metabolism in nondiabetic individuals. Diabetes Care. 2002;25:835–9. doi: 10.2337/diacare.25.5.835. [DOI] [PubMed] [Google Scholar]
- 19.Gump BB, Matthews KA, Raikkonen K. Modeling relationships among socioeconomic status, hostility, cardiovascular reactivity, and left ventricular mass in African American and White children. Health Psychol. 1999;18:140–50. doi: 10.1037//0278-6133.18.2.140. [DOI] [PubMed] [Google Scholar]
- 20.Iribarren C, Sidney S, Bild DE, Liu K, Markovitz JH, Roseman JM, et al. Association of hostility with coronary artery calcification in young adults: the CARDIA study: Coronary Artery Risk Development in Young Adults. JAMA. 2000;283:2546–51. doi: 10.1001/jama.283.19.2546. [DOI] [PubMed] [Google Scholar]
- 21.Hemingway H, Marmot M. Evidence based cardiology: psychosocial factors in the aetiology and prognosis of coronary heart disease: systematic review of prospective cohort studies. BMJ. 1999;318:1460–7. doi: 10.1136/bmj.318.7196.1460. [DOI] [PMC free article] [PubMed] [Google Scholar]
- 22.Miller TQ, Smith TW, Turner CW, Guijarro ML, Hallet AJ. A meta-analytic review of research on hostility and physical health. Psychol Bull. 1996;119:322–48. doi: 10.1037/0033-2909.119.2.322. [DOI] [PubMed] [Google Scholar]
- 23.Baron RM, Kenny DA. The moderator-mediator variable distinction in social psychological research: conceptual, strategic, and statistical considerations. J Personality Social Psychol. 1986;51:1173–82. doi: 10.1037//0022-3514.51.6.1173. [DOI] [PubMed] [Google Scholar]
- 24.Liehr P, Meininger JC, Mueller WH, Chan W, Frazier L, Reyes LR. Psychometric testing of the adolescent version of the Cook-Medley hostility scale. Issues Compr Pediatr Nurs. 2000;23:103–16. doi: 10.1080/01460860050121420. [DOI] [PubMed] [Google Scholar]
- 25.Woodall KL, Matthews KA. Familial environment associated with type A behaviors and psychophysiological responses to stress in children. Health Psychol. 1989;8:403–26. doi: 10.1037//0278-6133.8.4.403. [DOI] [PubMed] [Google Scholar]
- 26.Goodman E, Adler NE, Daniels SR, Morrison JA, Slap GB, Dolan LM. Impact of objective and subjective social status on obesity in a biracial cohort of adolescents. Obes Res. 2003;11:1018–26. doi: 10.1038/oby.2003.140. [DOI] [PubMed] [Google Scholar]
- 27.Gungor N, Saad R, Janosky J, Arslanian S. Validation of surrogate estimates of insulin sensitivity and insulin secretion in children and adolescents. J Pediatr. 2004;144:47–55. doi: 10.1016/j.jpeds.2003.09.045. [DOI] [PubMed] [Google Scholar]
- 28.Dolan LM, Bean J, D'Alessio D, Cohen RM, Morrison JA, Goodman E, Daniels SR, et al. Frequency of abnormal carbohydrate metabolism and diabetes in a population-based screening of adolescents. J Pediatr. 2005;146:751–8. doi: 10.1016/j.jpeds.2005.01.045. [DOI] [PubMed] [Google Scholar]
- 29.Preacher K, Hayes A. Asymptotic and resampling strategies for assessing and comparing indirect effects in multiple mediator models. Behav Res Methods. 2008;40:879–91. doi: 10.3758/brm.40.3.879. [DOI] [PubMed] [Google Scholar]
- 30.Lynch JW, Kaplan GA, Salonen JT. Why do poor people behave poorly? Variation in adult health behaviours and psychosocial characteristics by stages of the socioeconomic lifecourse. Soc Sci Med. 1997;44:809–19. doi: 10.1016/s0277-9536(96)00191-8. [DOI] [PubMed] [Google Scholar]
- 31.Woodall KL, Matthews KA. Changes in and stability of hostile characteristics: results from a 4-year longitudinal study of children. J Pers Soc Psychol. 1993;64:491–9. doi: 10.1037//0022-3514.64.3.491. [DOI] [PubMed] [Google Scholar]
- 32.Knox SS, Weidner G, Adelman A, Stoney CM, Ellison RC. Hostility and physiological risk in the National Heart, Lung, and Blood Institute Family Heart Study. Arch Intern Med. 2004;164:2442–8. doi: 10.1001/archinte.164.22.2442. [DOI] [PubMed] [Google Scholar]
- 33.Raikkonen K, Matthews KA, Salomon K. Hostility predicts metabolic syndrome risk factors in children and adolescents. Health Psychol. 2003;22:279–86. doi: 10.1037/0278-6133.22.3.279. [DOI] [PubMed] [Google Scholar]
- 34.Siegler IC, Peterson BL, Barefoot JC, Williams RB. Hostility during late adolescence predicts coronary risk factors at mid-life. Am J Epidemiol. 1992;136:146–54. doi: 10.1093/oxfordjournals.aje.a116481. [DOI] [PubMed] [Google Scholar]
- 35.Williams RB. Invited Commentary: Socioeconomic status, hostility, and health behaviors: does it matter which comes first? Am J Epidemiol. 2003;158:743–6. doi: 10.1093/aje/kwg205. [DOI] [PubMed] [Google Scholar]
- 36.McEwen BS. From Molecules to mind: stress, individual differences, and the social environment. Ann NY Acad Sci. 2001;935:42–9. [PubMed] [Google Scholar]
- 37.Mei Z, Grummer-Strawn LM, Pietrobelli A, Goulding A, Goran MI, Dietz WH. Validity of body mass index compared with other body-composition screening indexes for the assessment of body fatness in children and adolescents. Am J Clin Nutr. 2002;75:978–85. doi: 10.1093/ajcn/75.6.978. [DOI] [PubMed] [Google Scholar]
- 38.Finkelstein DM, Kubzansky LD, Capitman J, Goodman E. Socioeconomic differences in adolescent stress: the role of psychological resources. J Adolesc Health. 2007;40:127–34. doi: 10.1016/j.jadohealth.2006.10.006. [DOI] [PMC free article] [PubMed] [Google Scholar]
- 39.Kubzansky LD, Kawachi I, Sparrow D. Socioeconomic status, hostility, and risk factor clustering in the Normative Aging Study: any help from the concept of allostatic load? Ann Behav Med. 1999;21:330–8. doi: 10.1007/BF02895966. [DOI] [PubMed] [Google Scholar]