

Abstract
BACKGROUND AND PURPOSE
The substituted benzamide, metoclopramide, is a dopamine receptor antagonist and is widely prescribed in the symptomatic treatment of nausea and vomiting, although it can cause adverse motor and non-motor side effects. The effects of metoclopramide on brain metabolism have not been investigated to date.
EXPERIMENTAL APPROACH
To determine the effects of metoclopramide on brain function, cerebral perfusion changes after a single oral dose were assessed in healthy volunteers using magnetic resonance imaging (MRI) techniques. Arterial spin labelling (ASL) perfusion MRI was used to measure cerebral blood flow before and after metoclopramide. Blood haemodynamics in the vertebral and internal carotid arteries were evaluated using phase-contrast MRI.
KEY RESULTS
Metoclopramide altered haemodynamics in the carotid arteries and the cerebral perfusion. Perfusion increased bilaterally in the putamen, consistent with antagonism of dopamine D2 receptors by metoclopramide and possibly related to its motor side effects. In contrast, reduced perfusion was observed in the insular cortices and anterior temporal lobes. In addition, functional connectivity between the insular cortex and the dorsolateral prefrontal cortex was decreased. These cortical changes affecting neural circuits between high-order association areas may underlie certain neuropsychiatric conditions occasionally reported after metoclopramide administration.
CONCLUSIONS AND IMPLICATIONS
The present results show the sensitivity of ASL to detect small changes in regional blood flow, closely related to brain function, after a single pharmacological challenge, highlighting the potential of this technique for human pharmacological studies.
LINKED ARTICLES
This article is part of a themed section on Imaging. To view the other articles in this section visit http://dx.doi.org/10.1111/bph.2011.163.issue-8BJP has previously published an Imaging in Pharmacology themed section, edited by A Davenport and C Daly. To view this section visit http://dx.doi.org/10.1111/bph.2010.159.issue-4
Keywords: metoclopramide, antipsychotic, cerebral perfusion, basal ganglia metabolism, insula, arterial spin labelling, functional connectivity
Introduction
Metoclopramide is a substituted benzamide derivative, widely used as an anti-emetic and gastrointestinal prokinetic agent, prescribed for patients in all age ranges, from children to the elderly (Pasricha et al., 2006). As other benzamide compounds, metoclopramide antagonizes the dopamine D2 receptor (receptor nomenclature follows Alexander et al., 2009) with a dissociation constant (Ki) between 16 nM (using [3H]raclopride; Seeman, 2010) and 40–70 nM (using [3H]domperidone; Rzezniczak et al., 1982; Martres et al., 1985), acting both peripherally and in the CNS, as it readily penetrates the blood brain barrier (Liu et al., 2009). Because of its antagonism of dopamine D2 receptors, metoclopramide was initially used as a antipsychotic treatment (Stanley et al., 1980) although it was quickly superseded by other first-generation antipsychotics like haloperidol which, with a Ki of 0.74 nM (Seeman, 2010), were more potent therapeutic agents.
The anti-emetic and prokinetic properties of metoclopramide are based partly on its antidopaminergic action at the vomiting centre and partly on its antagonistic effects on the 5-hydroxytryptamine (5-HT) receptor, 5-HT3[Ki value of 224 nM; (Hoyer, 1990)], as well as its 5-HT4 receptor agonist actions [Ki value of 500–1000 nM; (Yoshikawa et al., 1998)]. As such, however, its current and wide therapeutic use has been frequently associated with adverse side effects ranging from movement disorders like parkinsonism or tardive dyskinesia (Miller and Jankovic, 1989) to mood disorders and other neuropsychiatric symptoms (Shearer et al., 1984; Weddington and Banner, 1986; Kluge et al., 2007).
With the recent advent of neuroimaging techniques, changes in brain metabolism, reflecting changes in neuronal activity after drug administration, can be visualized at increasingly higher resolution, thus providing a valuable insight into the drug effects on brain function. Studies of exposure to other dopamine D2 receptor antagonists in psychiatric patients and healthy subjects have revealed areas of increased activity mainly in the basal ganglia and decreased cortical activity, although the sites of cortical decrease varied among studies and drugs (Wik et al., 1989; Holcomb et al., 1996; Lahti et al., 2003; 2005;). However, to the best of our knowledge, the effects of metoclopramide on brain metabolism have not been investigated to date.
Several perfusion imaging techniques have been used to assess human cerebral physiology, such as positron emission tomography (PET), single photon computed tomography (SPECT), contrast-enhanced computed tomography and dynamic susceptibility contrast magnetic resonance imaging (DSC-MRI). In contrast to these techniques, arterial spin labelling (ASL) is a completely non-invasive alternative for perfusion measurements (Detre et al., 1992; Williams et al., 1992). The ASL technique is capable of quantifying cerebral blood flow (CBF) in well-characterized physiological units of mL·100 g−1·min−1, directly analogous to exogenous tracer methods using ionizing radiation with PET. A close coupling between CBF and metabolism allows regional brain function to be assessed through measurements of cerebral perfusion (Buxton and Frank, 1997; Raichle, 1998). ASL perfusion MRI has been successfully used to identify changes in baseline function associated with development, aging, phenotypes such as Alzheimer's disease and genotype. ASL is also well suited for examining metabolic changes induced by pharmacological agents (Kofke et al., 2007; MacIntosh et al., 2008; O'Gorman et al., 2008; Detre et al., 2009).
In the current study, ASL perfusion MRI was used to assess the pharmacological response of the brain to a single 10 mg oral dose of metoclopramide in young healthy volunteers. CBF was measured before and after metoclopramide intake in a placebo-controlled paradigm. Results of previous research using other dopamine antagonists allowed us to predict CBF increases in the basal ganglia. Identifying the brain regions affected by the drug can yield some light on the underlying mechanisms of metoclopramide action and may be relevant to the study of the drug adverse side effects.
Methods
Subjects
Eighteen healthy volunteers (10 women), 23.9 ± 4.2 years of age (mean age ± SD), participated in the study, approved by the Ethics Research Committee of the University of Navarra, after signing a written informed consent. The volunteers had no past or present history of neurological or psychiatric disorder. Other exclusion criteria were: known hypersensitivity to metoclopramide, current use of prescription drugs or recreational drugs, any characteristic that would prevent the subject from getting into the MRI scanner and pregnancy.
Experimental protocol
Each subject received an oral dose (10 mg) of metoclopramide (PrimperanR, from Sanofi-Aventis, Paris, France) and a placebo (containing wheat amylum; from Nafarco, Navarra, Spain), in two different days at least 1 week apart. The order of the experiments was counterbalanced across subjects, in single blind fashion. In each day, the subject was scanned twice: the first session (baseline) prior to taking any medication and the second session, 1 h after medication intake. The 1-h time was selected because metoclopramide peak plasma concentrations occur at about 1 to 2 h after a single oral dose (Fass et al., 2009). Blood pressure was measured in the left upper arm with the subject in a sitting position, prior to entering the scanner. Adverse side effects were registered from spontaneous reports and inquiries carried out after the MRI examinations.
The MRI studies were performed on a 3T Trio TIM (Siemens AG, Erlangen, Germany) using a receive-only, eight-channel head array coil and the body transmit coil. During each scanning session a 3D time-of-flight MR angiogram was acquired to position the phase contrast imaging sequence.
Volumetric blood flow rate through the internal carotid and vertebral arteries (ICAs and VAs) was measured by phase-contrast MRI (PC MRI) using a 2D gradient-echo sequence equipped with bipolar gradients for phase contrast velocity mapping. The slice was chosen perpendicular to the carotid and vertebral arteries, based on the angiogram previously acquired. The maximum encoding velocity was set to 50 cm·s−1. If aliasing was detected, the sequence was repeated with an encoding velocity of 100 cm·s−1.
Next resting perfusion was measured using a pseudo-continuous arterial spin labelling (PCASL) technique (Dai et al., 2008) with a single-shot echo-planar imaging readout. The PCASL pulse duration was 1600 ms and the post-labelling delay was 1500 ms. Identical G waveforms were used for label and control acquisitions (Wong, 2007; Wu et al., 2007). The inversion plane was offset 8 cm from the centre of the field of view in the head-foot direction, so that it was located at the base of the cerebellum to achieve good labelling efficiency. Fifty label/control pairs were acquired in a scan time of 6.8 min.
Following the perfusion scan, anatomical images were acquired with a T1 magnetization prepared rapid gradient echo sequence. A detailed description of the imaging parameters for all the scanning sequences is given in Appendix S1.
Data analysis
Haemodynamic data
Measurements were done in right and left ICAs and VAs. First the vessel lumen was manually segmented from the thresholded complex difference images obtained using the phase-contrast imaging sequence. The vessel cross-sectional area was calculated by adding the pixels within the segmented region of interest (ROI). Mean blood velocity was obtained by averaging the scaled phase difference values in the corresponding ROI. Volumetric blood flow rate was computed as the product of these two parameters. Total blood flow entering the brain was obtained by adding volumetric flow rates from these four arteries.
The effects of metoclopramide on the haemodynamic parameters were tested using two-way repeated measures anova (RM-anova), using as interaction factors, treatment (placebo, metoclopramide) and session (baseline, post-medication). For any significant main effect and treatment by session interaction, post hoc paired t-tests were carried out. Specifically, within treatment changes were assessed by pair-wise comparison of post-medication and baseline values. Between treatment changes were tested by pair-wise comparison of the metoclopramide and placebo effects, evaluated as the mean change from baseline for each treatment in each subject.
Perfusion data
The perfusion data analysis was carried out using custom scripts in Matlab (The Mathworks Inc.) and SPM5 (Wellcome Department of Imaging Neuroscience). The first label and control pair was discarded because the signal had not reached the steady state. Each subject's images were realigned to the first image and coregistered to the anatomical dataset, before subtraction of label and control. A total of 49 perfusion images were obtained.
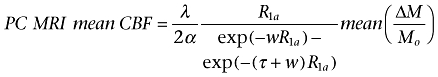
The labelling efficiency was estimated using the approach proposed by Aslan et al. (Aslan et al., 2010). The T1 weighted anatomical image was segmented to extract maps of grey and white matter and CSF. The total intracranial grey and white matter mass was computed from the grey and white matter volumes calculated from the segmented images, multiplied by brain tissue density (= 1.05 g·mL−1). The PC MRI derived mean CBF was computed as the total blood flow entering the brain divided by the intracranial grey and white matter mass. Labelling efficiency was estimated by solving equation 1, based on a single compartment ASL perfusion model as described in (Wang et al., 2005):
 |
[1] |
Where ΔM is the signal difference between label and control images, Mo is the signal intensity of the control image, λ (= 0.9 mL·g−1) is the blood/tissue water partition coefficient, R1a (= 0.67 s−1) is the longitudinal relaxation rate of blood (Wang et al., 2002), τ(= 1.6 s) is the duration of the labelling pulse, w (= 1.5 s) is the post-labelling delay and α is the labelling efficiency, which is the only unknown. The labelling efficiency was estimated separately for each subject in each session. Subsequently, individual CBF maps were computed from the mean perfusion weighted image using Equation 1, applied to each voxel, and the estimated α. In three different subjects, one of the four datasets acquired per subject yielded an estimated α larger than one. These values were not used for CBF calculations; instead, they were replaced by the mean estimated α of the other three acquisitions. Because of the observed variability in absolute CBF maps (see Results), whole-brain mean CBF was computed and CBF maps were converted to relative CBF (rCBF) by adjusting the global CBF to a fixed value of 50 mL·100 g−1·min−1. This normalization was carried out to reduce the effect of global absolute CBF variability between scans in the subsequent group comparisons.
The anatomical images were normalized to the Montreal Neurological Institute standard template brain and the resulting normalization parameters were used to compute normalized CBF maps that were spatially smoothed using an 8 mm full-width at half-maximum isotropic Gaussian kernel.
Cerebral blood flow and rCBF were measured in the basal ganglia (caudate, putamen and globus pallidus) and thalamus in regions of interests that comprised the full extent of each structure as defined by the masks in the WFU pick atlas toolbox. Differences in estimated labelling efficiency, whole brain mean CBF and regional absolute and relative CBF were assessed using two-way RM-anova with factors treatment (placebo, metoclopramide) and session (baseline, post-medication). For any significant main effect and treatment by session interaction, post hoc paired t-tests were carried out.
Voxel-wise statistical analysis of the CBF and rCBF data was performed using SPM5. In a first step, a two-way RM-anova was set up using a 2 × 2 factorial design with two levels per factor: treatment (metoclopramide, placebo) and session (baseline, post-medication). The model included the main effect of each factor and the interaction term treatment by session. In this analysis, a relative threshold of 0.3 was applied to exclude white matter voxels. Examination of the interaction reflects the statistically significant differential effects of metoclopramide versus placebo intake while factoring out effects due to session alone. The results of this analysis revealed a significant interaction between these two factors, using a voxel-wise level of significance of P < 0.005, uncorrected for multiple comparisons, and a cluster size threshold of 20. Thus, post hoc comparisons were realized using paired t-tests to evaluate within treatment and between treatment changes. The voxel-wise significance level for the exploratory whole-brain volume post hoc tests was set at a voxel P-value < 0.005, uncorrected, and an extent threshold of 200. In the evaluation of perfusion increases induced by metoclopramide (post hoc comparison metoclopramide minus baseline), activity in a priori ROIs in the basal ganglia was considered significant after correction for multiple comparisons using the false discovery rate (FDR) (Genovese et al., 2002) in a small volume of interest. The volume of interest comprised the full extent of each structure as defined in the WFU pick atlas toolbox. In the evaluation of perfusion decreases (post hoc comparison baseline minus metoclopramide) there were no a priori hypotheses, so a cluster-corrected threshold of P < 0.05 was used. This corrected threshold was determined using a non-stationarity correction toolbox (Hayasaka et al., 2004). Anatomical labelling was performed using the SPM Anatomy toolbox (Eickhoff et al., 2005).
Reproducibility of baseline measurements
Reproducibility of PCASL baseline measurements was assessed by computing within-subject coefficients of variation (wsCV) of the variable whole-brain mean CBF. The following calculations were made: (i) for each subject separately the CV of the two baseline measurements was computed as the ratio of the two measurements SD to their mean; (ii) the individual CVs were squared; (iii) their mean was computed; and (iv) the square root of this mean was calculated.
Functional connectivity
Resting state functional connectivity analysis was used to examine correlations in slow spontaneous fluctuations in the CBF time series. These fluctuations are hypothesized to reflect underlying oscillations in neural activity synchronized within and across brain regions. Although this methodology has been primarily used to analyse the blood oxygen level-dependent MRI signal (Rogers et al., 2007), it has been demonstrated that CBF-based functional connectivity mapping is also possible (Chuang et al., 2008). One of the techniques used to study functional connectivity consists in computing correlations between the CBF signal time series in a seed region and the rest of the brain. Thus, regions of synchronous CBF fluctuations are detected and identified as functionally connected regions.
The functional connectivity analysis presented here was carried out using the Functional Connectivity toolbox (http://web.mit.edu/swg/software.htm). Four brain regions were selected as seeds: the left and right putamen, where perfusion was found to increase after metoclopramide intake, and the left and right insular cortex [Brodmann area (BA) 13] where perfusion was decreased after metoclopramide intake (see Results). The normalized CBF maps were parcellated into 84 ROIs using the BAs defined from the Talairach daemon atlas and two subcortical ROIs covering the left and right putamen, respectively.
Several sources of spurious variance were removed from the data by linear regression: realignment parameters, global CBF signal and averaged CBF signal in the ventricular and white matter ROIs, to reduce the non-neuronal contributions to CBF fluctuations (Fox et al., 2005). The CBF time series from each ROI was filtered with a band-pass filter (0.004 < f < 0.08 Hz). Seed to ROI connectivity was estimated by calculation of Pearson's correlation coefficient. The r-values were converted to z-scores using Fisher's z transform. Differences in functional connectivity between the baseline and metoclopramide sessions were assessed by two-sample t-tests. Results were considered significant using a threshold of P < 0.05 after FDR correction for multiple comparisons.
Results
Side effects
All adverse events were mild. Two out of 18 subjects reported dizziness after metoclopramide intake. No adverse events were reported after placebo intake.
Haemodynamic data
Haemodynamic parameters measured for each treatment (placebo and metoclopramide) in the baseline and post-medication sessions are given in Table 1. For technical reasons blood pressure data were only available for 12 subjects. Cross-sectional area, mean blood velocity and mean volumetric flow rate for ICAs and VAs are in agreement with previously published results (Cebral et al., 2008). Statistical analysis of the haemodynamic data revealed that mean blood velocity in the right and left ICAs was significantly reduced after metoclopramide intake with respect to baseline. When compared to placebo, this effect was also significant. There were significant main effects of treatment in the right VA mean blood velocity, right VA blood flow and total VA blood flow; however, post hoc tests showed no significant within or between treatment changes, thus these effects were probably due to the variability in the measurements performed in two different days. Likewise, there was a significant main effect of treatment in the total blood flow entering the brain; however, no significant within or between treatment changes were found. No other significant main effects or interactions were detected in the haemodynamic parameters.
Table 1.
Haemodynamic data. All parameters are given as mean ± SD (n = 18)
| Baseline1 | Placebo | Baseline2 | Metoclopramide | Two-factoranovaF(1,17)/P | Post hoc tests T/P (two tails) | |
|---|---|---|---|---|---|---|
| Diastolic blood pressure (mg Hg) | 70.00 ± 7.07 | 70.75 ± 7.16 | 65.83 ± 9.73 | 65.83 ± 9.00 | ||
| Systolic blood pressure (mg Hg) | 118.33 ± 14.03 | 114.00 ± 11.45 | 112.50 ± 16.02 | 111.25 ± 13.50 | ||
| Right ICA mean blood velocity (cm·s−1) | 26.28 ± 3.64 | 27.10 ± 4.40 | 26.14 ± 5.06 | 24.34 ± 4.85 | 4.955/0.040a | 2.765/0.013c |
| 9.822/0.006b | 3.134/0.006d | |||||
| Left ICA mean blood velocity (cm·s−1) | 26.10 ± 4.51 | 26.57 ± 4.38 | 25.81 ± 5.10 | 24.25 ± 5.20 | 4.858/0.042b | 2.161/0.045c |
| 2.204/0.042d | ||||||
| Right ICA area (mm2) | 17.71 ± 3.19 | 17.18 ± 3.43 | 17.34 ± 2.58 | 17.74 ± 2.52 | ||
| Left ICA area (mm2) | 17.56 ± 3.01 | 17.68 ± 3.31 | 17.39 ± 2.37 | 17.71 ± 2.75 | ||
| Right ICA blood flow (mL·min−1) | 276.71 ± 49.52 | 273.91 ± 43.67 | 268.50 ± 51.47 | 256.14 ± 50.36 | ||
| Left ICA blood flow (mL·min−1) | 272.72 ± 12.89 | 278.11 ± 11.72 | 264.91 ± 9.14 | 253.44 ± 11.85 | ||
| Total ICA blood flow (mL·min−1) | 549.43 ± 87.96 | 552.02 ± 77.77 | 533.41 ± 74.88 | 509.57 ± 89.31 | ||
| Right VA mean blood velocity (cm·s−1) | 16.17 ± 3.22 | 15.49 ± 3.57 | 14.29 ± 3.83 | 14.59 ± 3.57 | 5.855/0.027a | |
| Left VA mean blood velocity (cm s−1) | 16.69 ± 3.49 | 16.03 ± 2.63 | 15.31 ± 4.00 | 15.31 ± 3.04 | ||
| Right VA area (mm2) | 9.56 ± 3.29 | 9.61 ± 3.51 | 9.46 ± 3.36 | 9.39 ± 3.06 | ||
| Left VA area (mm2) | 10.10 ± 2.90 | 10.03 ± 2.45 | 9.75 ± 2.15 | 9.92 ± 2.98 | ||
| Right VA blood flow (mL·min−1) | 96.10 ± 39.81 | 93.94 ± 42.18 | 83.93 ± 38.19 | 85.00 ± 35.81 | 6.868/0.018a | |
| Left VA blood flow (mL·min−1) | 103.37 ± 44.32 | 97.51 ± 31.77 | 91.72 ± 37.43 | 93.35 ± 40.37 | ||
| Total VA blood flow (mL·min−1) | 199.48 ± 49.54 | 191.45 ± 47.71 | 175.65 ± 54.47 | 178.35 ± 51.27 | 5.913/0.026a | |
| Total blood flow (mL·min−1) | 748.91 ± 89.78 | 743.46 ± 78.57 | 709.06 ± 96.83 | 687.92 ± 96.47 | 5.403/0.033a |
Baseline measurements taken 1 h prior to placebo intake.
Baseline measurements taken 1 h prior to metoclopramide intake.
Main effect of treatment.
Interaction treatment by session.
Within treatment effect: metoclopramide versus baseline.
Between treatments effect: metoclopramide change versus placebo change.
ICA, internal carotid artery; VA, vertebral artery.
Perfusion data
Estimated labelling efficiency
Labelling efficiency was estimated separately for each subject in each session. Group mean values for each scanning session were: baseline placebo = 0.81 ± 0.08, placebo = 0.78 ± 0.05, baseline metoclopramide = 0.79 ± 0.08, metoclopramide = 0.78 ± 0.10, expressed as mean ± SD. There were no significant differences in labelling efficiency between sessions. The obtained mean estimated labelling efficiency was 0.79 ± 0.07. This value is in agreement with values previously reported for PCASL (Wu et al., 2007; Dai et al., 2008).
Reproducibility of baseline measurements
The wsCV of the PCASL whole-brain mean CBF measurements was 9.1%. This value is lower than previously reported values on the precision of CASL measurements performed 1 week apart (Floyd et al., 2003). This result is in agreement with recent work showing decreased variability of PCASL data with respect to CASL (Gevers et al., 2009).
Cerebral blood flow quantification
The group averaged whole-brain mean CBF values for each scanning session were: baseline placebo = 59.42 ± 8.06, placebo = 58.88 ± 6.36, baseline metoclopramide = 57.57 ± 8.07, metoclopramide = 56.11 ± 8.24. All values are given as mL·100 g−1·min−1 and expressed as mean ± SD. These results are within the range of resting whole-brain mean CBF values reported in the literature (Wong et al., 1998; Ye et al., 2000; Wang et al., 2005).
Metoclopramide effects on perfusion
Figure 1 shows the group mean absolute CBF maps measured before (left panel) and after (right panel) metoclopramide intake. It can be observed that metoclopramide induced perfusion increases in the striatum and thalamus and perfusion decreases in the insular cortex and anterior temporal lobe. These results were confirmed by the statistical analysis.
Figure 1.

Group mean absolute cerebral blood flow maps acquired before (left panel) and after (right panel) metoclopramide intake. The colour scale represents cerebral blood flow values from 0 to 90 in units of mL·100 g−1·min−1.
The ROI analysis showed that relative CBF was increased by metoclopramide bilaterally in the putamen, globus pallidus and thalamus, with no change in the caudate (see Figure 2 and Table 2). The relative CBF increases in these regions were statistically significant when compared with baseline and also when compared with placebo.
Figure 2.
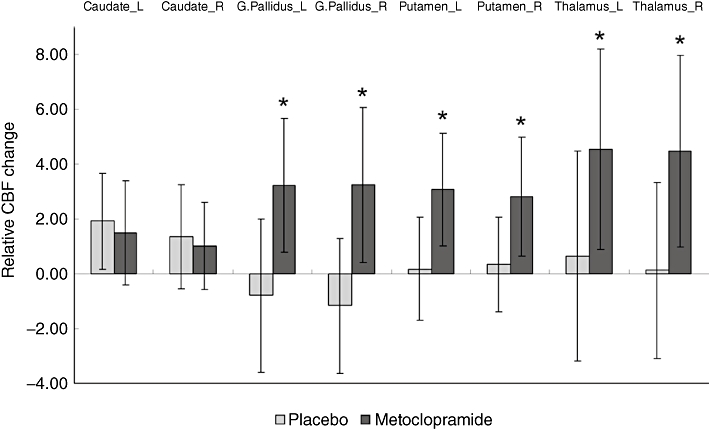
Relative cerebral blood flow (CBF) change between baseline and post-medication (calculated as post-medication CBF minus baseline CBF) in predefined regions of interest (ROIs) located in the caudate, putamen, globus pallidus and thalamus. Each ROI comprised the full extent of the structure. Values are the mean of 18 subjects. Error bars represent the SD. *Indicates significant differences between metoclopramide changes and placebo changes (P < 0.05). Absolute CBF values were converted to relative CBF by adjusting the global CBF to a fixed value of 50 mL·100 g−1·min−1. L, left; R, right.
Table 2.
Relative CBF data, measured in basal ganglia and thalamic regions of interest
| Baseline1 | Placebo | Baseline2 | Metoclopramide | Two factoranovaF(1,17)/P | Post hoc tests T/P (one tail) | |
|---|---|---|---|---|---|---|
| L Caudate | 31.79 ± 5.23 | 33.72 ± 5.74 | 32.23 ± 5.93 | 33.73 ± 5.32 | ||
| R Caudate | 32.76 ± 5.61 | 34.13 ± 4.76 | 33.87 ± 5.78 | 34.90 ± 5.55 | ||
| L G. Pallidus | 38.97 ± 4.59 | 38.18 ± 5.41 | 37.68 ± 4.72 | 40.91 ± 4.02 | 4.577/0.047b | 2.786/0.006c |
| 2.139/0.023d | ||||||
| R G. Pallidus | 40.42 ± 3.99 | 39.26 ± 4.15 | 38.45 ± 5.29 | 41.70 ± 3.98 | 5.603/0.030b | 2.443/0.013c |
| 2.367/0.015d | ||||||
| L Putamen | 44.43 ± 3.93 | 44.61 ± 4.34 | 43.35 ± 5.08 | 46.44 ± 4.53 | 8.037/0.011a | 3.188/0.003c |
| 3.981/0.062b | 1.995/0.031d | |||||
| R Putamen | 44.26 ± 3.56 | 44.61 ± 3.90 | 43.46 ± 4.69 | 46.28 ± 3.89 | 5.305/0.034a | 2.753/0.007c |
| 3.959/0.063b | 1.990/0.031d | |||||
| L Thalamus | 43.05 ± 5.94 | 43.71 ± 7.64 | 41.81 ± 6.83 | 46.35 ± 5.44 | 4.886/0.041a | 2.631/0.009c |
| R Thalamus | 44.91 ± 5.98 | 45.04 ± 7.46 | 41.76 ± 7.81 | 46.24 ± 5.04 | 4.439/0.050a | 2.719/0.007c |
| 1.902/0.004d |
All parameters are given as mean ± SD (n = 18). Absolute CBF values were converted to relative CBF by adjusting the global CBF to a fixed value of 50 mL·100 g−1·min−1.
Baseline measurements taken prior to placebo intake.
Baseline measurements taken prior to metoclopramide intake.
Main effect of session.
Interaction treatment by session.
Within treatment effect: metoclopramide versus baseline.
Between treatments effect: metoclopramide change versus placebo change.
CBF, cerebral blood flow; L, left; R, right.
The exploratory, whole brain, voxel-wise statistical analysis of the relative CBF data by means of a two-way RM-anova revealed a significant treatment by session interaction in the brain regions listed on Table S1. The post hoc comparison between rCBF maps acquired before and after placebo intake yielded no significant clusters.
The post hoc comparison between rCBF maps acquired before and after metoclopramide revealed metoclopramide induced rCBF increases in two clusters located in the basal ganglia, with local maxima in the putamen and globus pallidus (see Figure 3A and Table 3a). Comparing the metoclopramide effect with the placebo effect, two clusters of increased perfusion were found in the same areas although with a smaller cluster size (Table S1).
Figure 3.
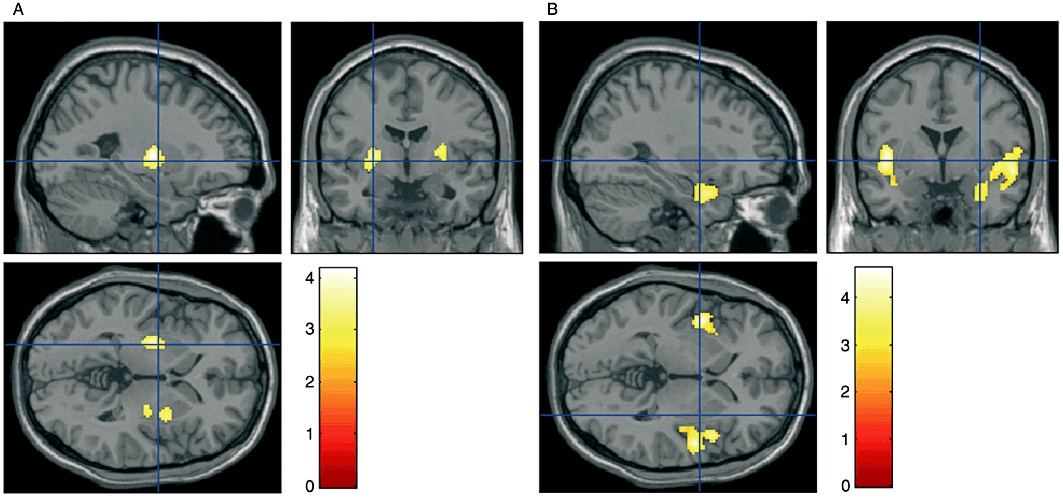
Clusters of significant relative cerebral blood flow (CBF) change induced by metoclopramide, superimposed on anatomical T1-weighted images: (A) rCBF increases (voxel false discovery rate P-value < 0.05, small volume correction); (B) rCBF decreases (cluster-corrected P < 0.05). The colour scale represents statistical significance (T) values.
Table 3.
Metoclopramide effects on cerebral perfusion: (a) CBF increases (voxel level P-value < 0.05, FDR corrected using a small volume correction); (b) CBF decreases (corrected cluster P-value < 0.05)
| (a)Perfusion increases | |||||||||
|---|---|---|---|---|---|---|---|---|---|
| Left hemisphere | Right hemisphere | ||||||||
| Cluster size | Region (BA) | MNI coordinates x, y, z | T | P_FDR | Cluster size | Region (BA) | MNI coordinates x, y, z | T | P_FDR |
| 257 | Putamen | −26, −8, 6 | 4.18 | 0.008 | 317 | Putamen | 28, 2, 6 | 3.59 | 0.018 |
| Putamen | −30, −8, −2 | 3.68 | 0.008 | Putamen | 30, 2, 2 | 3.53 | 0.018 | ||
| Globus pallidus | −24, −10, 4 | 3.83 | 0.021 | Globus pallidus | 26, −10, 4 | 3.11 | 0.029 | ||
| (b)Perfusion decreases | |||||||||
|---|---|---|---|---|---|---|---|---|---|
| Left hemisphere | Right hemisphere | ||||||||
| Cluster size | Region (BA) | MNI coordinates x, y, z | T | Cluster size | Region (BA) | MNI coordinates x, y, z | T | ||
| 517 | Insula (13) | −44, 2, 4 | 4.58 | 1749 | Superior temporal gyrus (41) | 52, −4, −6 | 4.64 | ||
| Fusiform gyrus (20) | −40, −4, −20 | 3.13 | Insula (13) | 46, 10, −2 | 4.14 | ||||
| Insula (13) | −34, 14, 0 | 2.72 | Insula (13) | 42, −2, −4 | 4.08 | ||||
| Temporal pole (38) | 32, 10, −24 | 3.71 | |||||||
| Temporal pole (38) | 44, 20, −22 | 3.45 | |||||||
| Rolandic operculum (43) | 60, 0, 8 | 3.31 | |||||||
| Superior temporal gyrus (38) | 46, 4, −22 | 3.29 | |||||||
| Middle temporal gyrus (21) | 64, −14, −10 | 2.97 | |||||||
| Medial temporal pole (38) | 44, 18, −36 | 2.85 | |||||||
Local maxima more than 4 mm apart are shown in MNI coordinates (in mm).
CBF, cerebral blood flow; BA: Brodmann area; FDR, false discovery rate; MNI, Montreal Neurological Institute.
Metoclopramide-induced rCBF decreases were found in two clusters located in the insulae, extending to the anterior temporal lobes. The left cluster maxima were located in mid and posterior insula and fusiform gyrus. The right cluster also had maxima located in mid and posterior insula. Other maxima were in the superior temporal gyrus (TE 1.2, auditory cortex), the temporal pole and the rolandic operculum (OP4, SII) (see Figure 3B and Table 3b). When compared with placebo, clusters of decreased perfusion were also found in the insulae. In this case, the clusters did not extend to the temporal lobes and the cluster size was also reduced (Table S1).
The ROI and voxel-wise comparisons using the absolute CBF data showed similar perfusion changes, but did not reach statistical significance.
Functional connectivity
Changes in functional connectivity between the baseline and metoclopramide sessions were examined using four seed regions: left and right putamen and left and right insular cortex. A significant decrease in functional connectivity was found between the left insular cortex (BA 13) and the right dorsolateral prefrontal cortex (DLPFC) (BA 9), after metoclopramide intake. The extent of the ROIs is shown in Figure 4A. Figure 4B and C show pre-processed CBF time courses for the seed region and the DLPFC node. Figure 4D and E show scatter plots of CBF values. These data, shown for a single subject, reflect that the correlation between seed and node present during baseline (B, D) decreased after metoclopramide intake (C, E). No other significant changes were found.
Figure 4.
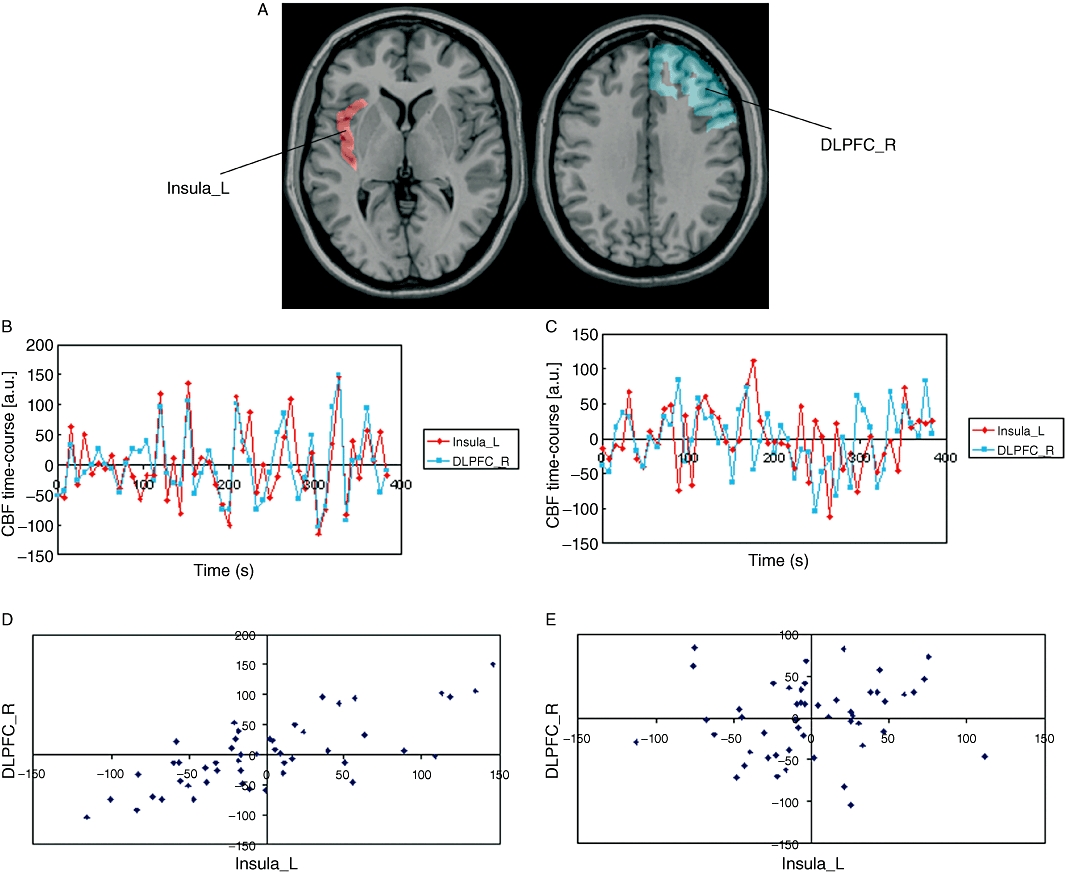
Functional connectivity results. (A) Seed region (left insular cortex) shown in red and node [right dorsolateral prefrontal cortex (DLPFC)] where connectivity with the seed decreased after metoclopramide intake. (B, C) Pre-processed cerebral blood flow (CBF) time course for the seed region (left insula, in red) and node (right DLPFC, in blue) before (B) and after (C) metoclopramide intake. (D, E) Scatter plots of CBF values before (D) and after (E) metoclopramide. CBF in the seed is shown in the x-axis, CBF in the DLPFC node is shown in the y-axis. Data shown are for a single subject. L, left; R, right.
Discussion and conclusions
The results of this study showed that a single 10-mg oral dose of metoclopramide altered cerebral perfusion and functional connectivity in a group of young healthy subjects. To the best of our knowledge this is the first study that evaluates the effects of metoclopramide on human brain function. It is worth noting that the usual therapeutic dose range of metoclopramide as prokinetic and anti-emetic agent is 10–20 mg three times a day (Pasricha et al., 2006).
Metoclopramide effects on haemodynamics
Measurement of haemodynamic parameters in the four major arteries supplying the brain showed a significant decrease in blood velocity in the ICAs after metoclopramide intake, without a significant change in vessel area. We did not observe significant changes in blood pressure, although previous studies using a 20-mg oral dose (MacDonald, 1991) or an intravenous administration of the drug (Blanco et al., 1996) did report significant decreases in peripheral blood pressure. Studies on the circulatory effects of dopamine in animals during normal oxygenation have shown an increase in cardiac output and carotid flow after dopamine infusion (Feltes et al., 1987). Thus, metoclopramide could be interfering with the inotropic effect of dopamine mediated by adrenoreceptor activation.
Metoclopramide effects on cerebral perfusion
Perfusion increases
In the present study, the acute administration of metoclopramide induced bilateral CBF increases in the putamen, lateral globus pallidus and thalamus. The CBF increases in the putamen are consistent with the reported increased metabolism in the dorsolateral striatum following administration of other first-generation antipsychotics, both in control subjects (Bartlett et al., 1994) and psychiatric patients (Wik et al., 1989; Lahti et al., 2003; 2005;), measured using PET with fluorodeoxyglucose or 15O water. The dorsolateral striatum, comprising the dorsolateral regions of the caudate nucleus and most of the putamen, is the brain area richest in dopamine D2 receptors, and also the area first and most affected by the dopaminergic deficit produced in Parkinson's disease (PD) (Gibb and Lees, 1991). Previous studies using PET have demonstrated dopamine D2 receptor blockade at the receptors in the human dorsolateral striatum after administration of different antipsychotics (Farde et al., 1986). Furthermore, increased perfusion of dorsolateral striatum after metoclopramide intake is consistent with the opposite metabolic change reported after administration of either dopamine agonists like apomorphine or dopamine releasing agents like amphetamine (Kozlowski and Marshall, 1980). Thus, our results suggest that metabolic increases in the dorsolateral striatum are common to dopamine D2 receptor antagonists, like haloperidol and metoclopramide, regardless of their antipsychotic potency. Therefore, these changes are unlikely to mediate the antipsychotic effect of these compounds, which rather seems to be associated to their action in the ventral striatum (Lahti et al., 2003). In contrast, dopamine D2 receptor blockade at dorsolateral striatal regions, specifically related with sensorimotor functions (Lehericy et al., 2005) could be associated to the motor side effects of these drugs (Lahti et al., 2003).
Increases in CBF due to dopamine D2 receptor blockade by metoclopramide or other first-generation antipsychotics also parallel the effects observed after pathological or experimental dopaminergic denervation. Thus, studies of PD patients using SPECT (Hsu et al., 2007), PET (Eckert et al., 2007) and ASL (Ma et al., 2010) have reported hyperperfusion in the dorsal striatum and thalamus. A study using DSC-MRI has also reported higher perfusion in the more affected side of the basal ganglia in hemi-Parkinsonian patients (Brusa et al., 2002). Similarly, studies on 1-methyl-4-phenyl-l,2,3,6-tetrahydropyridine (MPTP)-induced hemi-Parkinsonian monkeys reported increased metabolism in the putamen and lateral globus pallidus of the lesioned versus the unlesioned side (Palombo et al., 1990).
Activation of dopamine D2 receptors in the striatum leads to inhibition of the D2 receptor-containing medium spiny neurons (Mercuri et al., 1985). Thus, the perfusion increase in the dorsolateral striatum produced by dopamine D2 receptor blockade after metoclopramide administration is likely to be due to the enhanced activity of the disinhibited dopamine D2 receptor-expressing striatal neurons. The activation of the lateral globus pallidus, however, is not a direct result of D2 receptor antagonism as, according to the current models of the basal ganglia circuits, medium spiny neurons containing D2 receptors, are inhibiting the lateral globus pallidus. This finding nevertheless is consistent with the results reported in some of the above mentioned studies (Palombo et al., 1990; Eckert et al., 2007; Hsu et al., 2007). Electrical stimulation of the putamen in control monkeys leads to a short inhibition of the lateral globus pallidus followed by long-duration excitation (Kita et al., 2006). While the short inhibition plausibly reflects the direct projection from the putamen nucleus, the long excitation seems to arise from subthalamic projections to the lateral globus pallidus after multiple pathways (Kita et al., 2006). Therefore, one possible explanation for the increased perfusion observed in the present study could be a state of global activation of the lateral globus pallidus as a result of overall excitation through pathways other than the direct striatopallidal projections.
In relation to the thalamic hyperperfusion, it is possible that the increase in perfusion observed in the lateral globus pallidus may in turn lead to an increased activation of the thalamus, via an increased inhibition of the subthalamic nucleus and subsequent decrease in the activation of both the medial globus pallidus and substantia nigra reticulata. Thalamic perfusion increases have also been observed in the lesioned side of MPTP-induced hemi-Parkinsonian monkeys (Palombo et al., 1990) and after haloperidol administration in patients with schizophrenia (Holcomb et al., 1996).
Perfusion decreases
Metoclopramide decreased CBF bilaterally in the insular cortex and anterior temporal lobe. Perfusion decreases in these two regions have also been observed in patients with schizophrenia after treatment with haloperidol (Lahti et al., 2003; 2005;) and in SPECT studies of PD patients (Kikuchi et al., 2001; Hsu et al., 2007). In the latter, perfusion in the insula was negatively correlated with Unified Parkinson's Disease Rating Scale motor scores. Together, these data strongly suggest that the dopaminergic denervation occurring in PD or after pharmacological dopamine D2 receptor blockade specifically alters extrastriatal circuits comprising the insular cortex and the temporal pole, which are reciprocally connected.
Dopamine D2 receptors are present in layer V of all cortical areas, but their distribution shows a rostrocaudal gradient, with the highest concentration in the prefrontal cortex in rodents and primates, and similarly in humans (Lidow et al., 1991; Goldman-Rakic et al., 1992; Gaspar et al., 1995). In the rat, the highest concentration of dopamine D2 receptor mRNA was observed in medial prefrontal, cingular and insular cortices (Gaspar et al., 1995), providing the basis for a preferential action of D2 receptor antagonists on these cortices. In the primate prefrontal cortex dopamine D2 receptors are localized in layer V, both in pyramidal neurons and in certain subpopulations of GABAergic interneurons which are known to potently modulate the pyramidal neurons (de Almeida and Mengod, 2010). Thus, it can be hypothesized that the blockade of dopamine D2 receptors, while directly disinhibiting the pyramidal neurons, would also disinhibit the potent GABAergic interneurons, increasing the local inhibition on the pyramidal cells and leading to decreased cortical activity. The same rationale with the opposite action has been postulated for the cortical hyperfunction observed after administration of N-methyl-D-aspartic acid receptor antagonists, acting both on pyramidal and wide-arbor and chandelier interneurons, where the induced excitation of pyramidal cells is due to decreased activity of GABA interneurons (Pratt et al., 2008).
Recent neuroimaging studies have provided evidence of the involvement of the insular cortex in neuropsychiatric conditions such as mood disorders and schizophrenia, among others (Nagai et al., 2007). Interestingly, a brief exposure to metoclopramide in a case report resulted in panic disorder, agoraphobia and major depression, effects that were attributed to dopamine D2 receptor blockade (Anfinson, 2002). Other psychiatric conditions like agitated depression, dysphoria, depressed mood and generalized anxiety disorder have also been reported following metoclopramide administration (Shearer et al., 1984; Weddington and Banner, 1986; Kluge et al., 2007). In parallel, cognitive executive deficits and depression are the most prominent non-motor impairments in PD patients (Weintraub et al., 2003; Zgaljardic et al., 2006). Together, these data indicate that the insular cortex may represent a key neural substrate underlying psychiatric conditions that may appear after metoclopramide therapeutic administration, or concomitantly to PD.
The clusters of hypoperfusion occupied mostly the mid and posterior portions of the insular cortex. The mid insula appears to be a polymodal integrative zone where primary interoceptive information is integrated with emotionally salient activity, additionally modulated by the ventral striatum (Craig, 2009). In addition, the left anterior insula and adjacent frontal cortex is also part of an ‘executive-control network’ wherein the right DLPFC acts as a key node (Seeley et al., 2007). In our study, a decrease in functional connectivity was detected between the left insular cortex and the right DLPFC after metoclopramide administration, supporting the hypothesis that the two areas are being affected by blockade of dopamine D2 receptors and that their reciprocal connections-interactions are being disrupted (Augustine, 1996).
ASL perfusion MRI as an assay of CNS pharmacological activity
In this study, ASL perfusion MRI was successfully used to assess and quantify perfusion changes induced by metoclopramide intake. The ASL method allowed comparisons by ROI in areas where perfusion changes had been hypothesized and also exploratory whole brain voxel-wise analysis. This study confirms the utility of ASL in the assessment of pharmacological challenges in the CNS.
It is known that the variability of ASL measurements increases when repeated measurements are performed over longer periods of time (e.g. weeks) with respect to the variability of measurements performed over periods of several hours (Floyd et al., 2003). The reproducibility of baseline measurements obtained in this study is in the range of values previously reported. The effect of this variability in the results was reduced by measuring the baseline twice, once for each study day (placebo and metoclopramide). This facilitated the within treatment comparisons (i.e. comparison of the treatment effect with its corresponding baseline). However, there was a lack of statistical power in the two-way RM-anova that combined the data from all four acquisitions (baseline, placebo; baseline, metoclopramide). This was resolved by comparison of relative CBF data, where the effect of global changes was reduced by adjusting the global CBF to a fixed value.
The use of phase contrast MRI together with ASL has two advantages, first it allows individual measurements of labelling efficiency and the assessment of efficiency changes between physiological states (Aslan et al., 2010) and second, it permits evaluation of haemodynamics in the large vessels supplying blood flow to the brain and regional cerebral perfusion in the same scan session. The quantification of haemodynamic parameters can complement the information of CBF measurements.
The dopamine D2 receptor antagonist metoclopramide caused an increase in perfusion in the basal ganglia and thalamus and perfusion decreases in the insular cortex and temporal lobe, 1 h after the drug administration. These results provide functional evidence of a relatively fast response to antipsychotic therapy, supporting previous pharmacological studies (Agid et al., 2006). These measurements of early brain perfusion response to dopamine receptor blockade in humans show the potential of ASL for pharmacological studies and open up the possibility of using ASL techniques in the early diagnosis of PD.
Acknowledgments
We thank Dr Philip Seeman for helpful discussion and critical reading of the manuscript. This work was supported by the Spanish Ministry of Science and Innovation (grant number SAF2008-00678). M. Aznárez-Sanado was supported by a grant from the Navarra Government Education Department.
Glossary
Abbreviations
- ASL
arterial spin labelling
- BA
Brodmann area
- BOLD
blood oxygen level-dependent
- CBF
cerebral blood flow
- DLPFC
dorsolateral prefrontal cortex
- DSC-MRI
dynamic susceptibility contrast magnetic resonance imaging
- EPI
echo-planar imaging
- FDR
false discovery rate
- GRE
gradient-echo
- ICA
internal carotid artery
- Ki
dissociation constant
- MRI
magnetic resonance imaging
- PCASL
pseudo-continuous arterial spin labelling
- PC
MRI, phase-contrast magnetic resonance imaging
- PD
Parkinson's disease
- PET
positron emission tomography
- RM-anova
repeated measures anova
- SD
standard deviation
- ROI
region of interest
- rCBF
relative cerebral blood flow
- SPECT
single photon computed tomography
- VA
vertebral artery
- wsCV
within-subject coefficient of variation
Conflict of interest
The authors declare no conflict of interest.
Supporting information
Teaching Materials; Figs 1–4 as PowerPoint slide.
Additional Supporting Information may be found in the online version of this article:
Table S1 Metoclopramide effects on cerebral perfusion (P < 0.005 uncorrected, T > 2.65, k > 20): (a) positive interaction treatment by session (perfusion increases); (b) negative interaction (perfusion decreases). Local maxima are shown in Montreal Neurological Institute coordinates (in mm). BA, Brodmann area.
Appendix S1 Technical details of the magnetic resonance imaging protocol.
Please note: Wiley-Blackwell are not responsible for the content or functionality of any supporting materials supplied by the authors. Any queries (other than missing material) should be directed to the corresponding author for the article.
References
- Agid O, Seeman P, Kapur S. The ‘delayed onset’ of antipsychotic action – an idea whose time has come and gone. J Psychiatry Neurosci. 2006;31:93–100. [PMC free article] [PubMed] [Google Scholar]
- Alexander SPH, Mathie A, Peters JA. Guide to Receptors and Channels (GRAC), 4th edition. Br J Pharmacol. 2009;158(Suppl. 1):S1–S254. doi: 10.1111/j.1476-5381.2009.00499.x. [DOI] [PMC free article] [PubMed] [Google Scholar]
- de Almeida J, Mengod G. D2 and D4 dopamine receptor mRNA distribution in pyramidal neurons and GABAergic subpopulations in monkey prefrontal cortex: implications for schizophrenia treatment. Neuroscience. 2010;170:1133–1139. doi: 10.1016/j.neuroscience.2010.08.025. [DOI] [PubMed] [Google Scholar]
- Anfinson TJ. Akathisia, panic, agoraphobia, and major depression following brief exposure to metoclopramide. Psychopharmacol Bull. 2002;36:82–93. [PubMed] [Google Scholar]
- Aslan S, Xu F, Wang PL, Uh J, Yezhuvath US, van Osch M, et al. Estimation of labeling efficiency in pseudocontinuous arterial spin labeling. Magn Reson Med. 2010;63:765–771. doi: 10.1002/mrm.22245. [DOI] [PMC free article] [PubMed] [Google Scholar]
- Augustine JR. Circuitry and functional aspects of the insular lobe in primates including humans. Brain Res Brain Res Rev. 1996;22:229–244. doi: 10.1016/s0165-0173(96)00011-2. [DOI] [PubMed] [Google Scholar]
- Bartlett EJ, Brodie JD, Simkowitz P, Dewey SL, Rusinek H, Wolf AP, et al. Effects of haloperidol challenge on regional cerebral glucose utilization in normal human subjects. Am J Psychiatry. 1994;151:681–686. doi: 10.1176/ajp.151.5.681. [DOI] [PubMed] [Google Scholar]
- Blanco M, Jelambi I, Perez G, Gomez J, Franco T, Hurtado N, et al. The effect of intravenous metoclopramide on blood pressure in normotensive and hypertensive subjects. Int J Clin Pharmacol Ther. 1996;34:390–392. [PubMed] [Google Scholar]
- Brusa L, Bassi A, Pierantozzi M, Gaudiello SFF, Floris R, Stanzione P. Perfusion-weighted dynamic susceptibility (DSC) MRI: basal ganglia hemodynamic changes after apomorphine in Parkinson's disease. Neurol Sci. 2002;23(Suppl. 2):S61–S62. doi: 10.1007/s100720200070. [DOI] [PubMed] [Google Scholar]
- Buxton RB, Frank LR. A model for the coupling between cerebral blood flow and oxygen metabolism during neural stimulation. J Cereb Blood Flow Metab. 1997;17:64–72. doi: 10.1097/00004647-199701000-00009. [DOI] [PubMed] [Google Scholar]
- Cebral JR, Castro MA, Putman CM, Alperin N. Flow-area relationship in internal carotid and vertebral arteries. Physiol Meas. 2008;29:585–594. doi: 10.1088/0967-3334/29/5/005. [DOI] [PMC free article] [PubMed] [Google Scholar]
- Chuang KH, van Gelderen P, Merkle H, Bodurka J, Ikonomidou VN, Koretsky AP, et al. Mapping resting-state functional connectivity using perfusion MRI. Neuroimage. 2008;40:1595–1605. doi: 10.1016/j.neuroimage.2008.01.006. [DOI] [PMC free article] [PubMed] [Google Scholar]
- Craig AD. How do you feel – now? The anterior insula and human awareness. Nat Rev Neurosci. 2009;10:59–70. doi: 10.1038/nrn2555. [DOI] [PubMed] [Google Scholar]
- Dai W, Garcia D, de Bazelaire C, Alsop DC. Continuous flow-driven inversion for arterial spin labeling using pulsed radio frequency and gradient fields. Magn Reson Med. 2008;60:1488–1497. doi: 10.1002/mrm.21790. [DOI] [PMC free article] [PubMed] [Google Scholar]
- Detre JA, Leigh JS, Williams DS, Koretsky AP. Perfusion imaging. Magn Reson Med. 1992;23:37–45. doi: 10.1002/mrm.1910230106. [DOI] [PubMed] [Google Scholar]
- Detre JA, Wang J, Wang Z, Rao H. Arterial spin-labeled perfusion MRI in basic and clinical neuroscience. Curr Opin Neurol. 2009;22:348–355. doi: 10.1097/WCO.0b013e32832d9505. [DOI] [PubMed] [Google Scholar]
- Eckert T, Tang C, Eidelberg D. Assessment of the progression of Parkinson's disease: a metabolic network approach. Lancet Neurol. 2007;6:926–932. doi: 10.1016/S1474-4422(07)70245-4. [DOI] [PMC free article] [PubMed] [Google Scholar]
- Eickhoff SB, Stephan KE, Mohlberg H, Grefkes C, Fink GR, Amunts K, et al. A new SPM toolbox for combining probabilistic cytoarchitectonic maps and functional imaging data. Neuroimage. 2005;25:1325–1335. doi: 10.1016/j.neuroimage.2004.12.034. [DOI] [PubMed] [Google Scholar]
- Farde L, Hall H, Ehrin E, Sedvall G. Quantitative analysis of D2 dopamine receptor binding in the living human brain by PET. Science. 1986;231:258–261. doi: 10.1126/science.2867601. [DOI] [PubMed] [Google Scholar]
- Fass R, Pieniaszek HJ, Thompson JR. Pharmacokinetic comparison of orally-disintegrating metoclopramide with conventional metoclopramide tablet formulation in healthy volunteers. Aliment Pharmacol Ther. 2009;30:301–306. doi: 10.1111/j.1365-2036.2009.04045.x. [DOI] [PubMed] [Google Scholar]
- Feltes TF, Hansen TN, Martin CG, Leblanc AL, Smith S, Giesler ME. The effects of dopamine infusion on regional blood flow in newborn lambs. Pediatr Res. 1987;21:131–136. doi: 10.1203/00006450-198702000-00005. [DOI] [PubMed] [Google Scholar]
- Floyd TF, Ratcliffe SJ, Wang J, Resch B, Detre JA. Precision of the CASL-perfusion MRI technique for the measurement of cerebral blood flow in whole brain and vascular territories. J Magn Reson Imaging. 2003;18:649–655. doi: 10.1002/jmri.10416. [DOI] [PubMed] [Google Scholar]
- Fox MD, Snyder AZ, Vincent JL, Corbetta M, Van Essen DC, Raichle ME. The human brain is intrinsically organized into dynamic, anticorrelated functional networks. Proc Natl Acad Sci U S A. 2005;102:9673–9678. doi: 10.1073/pnas.0504136102. [DOI] [PMC free article] [PubMed] [Google Scholar]
- Gaspar P, Bloch B, Le Moine C. D1 and D2 receptor gene expression in the rat frontal cortex: cellular localization in different classes of efferent neurons. Eur J Neurosci. 1995;7:1050–1063. doi: 10.1111/j.1460-9568.1995.tb01092.x. [DOI] [PubMed] [Google Scholar]
- Genovese CR, Lazar NA, Nichols T. Thresholding of statistical maps in functional neuroimaging using the false discovery rate. Neuroimage. 2002;15:870–878. doi: 10.1006/nimg.2001.1037. [DOI] [PubMed] [Google Scholar]
- Gevers S, van Osch MJ, Hendrikse J, Bokkers RP, Kies DA, Teeuwisse WM, et al. Multicenter reproducibility of continuous, pulsed and pseudo-continuous arterial spin labeling; can we use general reference values of cerebral blood flow? Proc Intl Soc Mag Reson Med. 2009;17:626. Honolulu. [Google Scholar]
- Gibb WR, Lees AJ. Anatomy, pigmentation, ventral and dorsal subpopulations of the substantia nigra, and differential cell death in Parkinson's disease. J Neurol Neurosurg Psychiatry. 1991;54:388–396. doi: 10.1136/jnnp.54.5.388. [DOI] [PMC free article] [PubMed] [Google Scholar]
- Goldman-Rakic PS, Lidow MS, Smiley JF, Williams MS. The anatomy of dopamine in monkey and human prefrontal cortex. J Neural Transm Suppl. 1992;36:163–177. doi: 10.1007/978-3-7091-9211-5_8. [DOI] [PubMed] [Google Scholar]
- Hayasaka S, Phan KL, Liberzon I, Worsley KJ, Nichols TE. Nonstationary cluster-size inference with random field and permutation methods. Neuroimage. 2004;22:676–687. doi: 10.1016/j.neuroimage.2004.01.041. [DOI] [PubMed] [Google Scholar]
- Holcomb HH, Cascella NG, Thaker GK, Medoff DR, Dannals RF, Tamminga CA. Functional sites of neuroleptic drug action in the human brain: PET/FDG studies with and without haloperidol. Am J Psychiatry. 1996;153:41–49. doi: 10.1176/ajp.153.1.41. [DOI] [PubMed] [Google Scholar]
- Hoyer D. Serotonin 5-HT3, 5-HT4, and 5-HT-M receptors. Neuropsychopharmacology. 1990;3:371–383. [PubMed] [Google Scholar]
- Hsu JL, Jung TP, Hsu CY, Hsu WC, Chen YK, Duann JR, et al. Regional CBF changes in Parkinson's disease: a correlation with motor dysfunction. Eur J Nucl Med Mol Imaging. 2007;34:1458–1466. doi: 10.1007/s00259-006-0360-7. [DOI] [PubMed] [Google Scholar]
- Kikuchi A, Takeda A, Kimpara T, Nakagawa M, Kawashima R, Sugiura M, et al. Hypoperfusion in the supplementary motor area, dorsolateral prefrontal cortex and insular cortex in Parkinson's disease. J Neurol Sci. 2001;193:29–36. doi: 10.1016/s0022-510x(01)00641-4. [DOI] [PubMed] [Google Scholar]
- Kita H, Chiken S, Tachibana Y, Nambu A. Origins of GABA(A) and GABA(B) receptor-mediated responses of globus pallidus induced after stimulation of the putamen in the monkey. J Neurosci. 2006;26:6554–6562. doi: 10.1523/JNEUROSCI.1543-06.2006. [DOI] [PMC free article] [PubMed] [Google Scholar]
- Kluge M, Schussler P, Steiger A. Persistent generalized anxiety after brief exposure to the dopamine antagonist metoclopramide. Psychiatry Clin Neurosci. 2007;61:193–195. doi: 10.1111/j.1440-1819.2007.01637.x. [DOI] [PubMed] [Google Scholar]
- Kofke WA, Blissitt PA, Rao H, Wang J, Addya K, Detre J. Remifentanil-induced cerebral blood flow effects in normal humans: dose and ApoE genotype. Anesth Analg. 2007;105:167–175. doi: 10.1213/01.ane.0000266490.64814.ff. [DOI] [PubMed] [Google Scholar]
- Kozlowski MR, Marshall JF. Plasticity of [14C]2-deoxy-D-glucose incorporation into neostriatum and related structures in response to dopamine neuron damage and apomorphine replacement. Brain Res. 1980;197:167–183. doi: 10.1016/0006-8993(80)90442-4. [DOI] [PubMed] [Google Scholar]
- Lahti AC, Holcomb HH, Weiler MA, Medoff DR, Tamminga CA. Functional effects of antipsychotic drugs: comparing clozapine with haloperidol. Biol Psychiatry. 2003;53:601–608. doi: 10.1016/s0006-3223(02)01602-5. [DOI] [PubMed] [Google Scholar]
- Lahti AC, Weiler MA, Medoff DR, Tamminga CA, Holcomb HH. Functional effects of single dose first- and second-generation antipsychotic administration in subjects with schizophrenia. Psychiatry Res. 2005;139:19–30. doi: 10.1016/j.pscychresns.2005.02.006. [DOI] [PubMed] [Google Scholar]
- Lehericy S, Benali H, Van de Moortele PF, Pelegrini-Issac M, Waechter T, Ugurbil K, et al. Distinct basal ganglia territories are engaged in early and advanced motor sequence learning. Proc Natl Acad Sci U S A. 2005;102:12566–12571. doi: 10.1073/pnas.0502762102. [DOI] [PMC free article] [PubMed] [Google Scholar]
- Lidow MS, Goldman-Rakic PS, Gallager DW, Rakic P. Distribution of dopaminergic receptors in the primate cerebral cortex: quantitative autoradiographic analysis using [3H]raclopride, [3H]spiperone and [3H]SCH23390. Neuroscience. 1991;40:657–671. doi: 10.1016/0306-4522(91)90003-7. [DOI] [PubMed] [Google Scholar]
- Liu X, Van Natta K, Yeo H, Vilenski O, Weller PE, Worboys PD, et al. Unbound drug concentration in brain homogenate and cerebral spinal fluid at steady state as a surrogate for unbound concentration in brain interstitial fluid. Drug Metab Dispos. 2009;37:787–793. doi: 10.1124/dmd.108.024125. [DOI] [PubMed] [Google Scholar]
- Ma Y, Huang C, Dyke JP, Pan H, Alsop D, Feigin A, et al. Parkinson's disease spatial covariance pattern: noninvasive quantification with perfusion MRI. J Cereb Blood Flow Metab. 2010;30:505–509. doi: 10.1038/jcbfm.2009.256. [DOI] [PMC free article] [PubMed] [Google Scholar]
- MacDonald TM. Metoclopramide, domperidone and dopamine in man: actions and interactions. Eur J Clin Pharmacol. 1991;40:225–230. doi: 10.1007/BF00315200. [DOI] [PubMed] [Google Scholar]
- MacIntosh BJ, Pattinson KT, Gallichan D, Ahmad I, Miller KL, Feinberg DA, et al. Measuring the effects of remifentanil on cerebral blood flow and arterial arrival time using 3D GRASE MRI with pulsed arterial spin labelling. J Cereb Blood Flow Metab. 2008;28:1514–1522. doi: 10.1038/jcbfm.2008.46. [DOI] [PubMed] [Google Scholar]
- Martres MP, Sales N, Bouthenet ML, Schwartz JC. Localisation and pharmacological characterisation of D-2 dopamine receptors in rat cerebral neocortex and cerebellum using [125I]iodosulpride. Eur J Pharmacol. 1985;118:211–219. doi: 10.1016/0014-2999(85)90131-1. [DOI] [PubMed] [Google Scholar]
- Mercuri N, Bernardi G, Calabresi P, Cotugno A, Levi G, Stanzione P. Dopamine decreases cell excitability in rat striatal neurons by pre- and postsynaptic mechanisms. Brain Res. 1985;358:110–121. doi: 10.1016/0006-8993(85)90954-0. [DOI] [PubMed] [Google Scholar]
- Miller LG, Jankovic J. Metoclopramide-induced movement disorders. Clinical findings with a review of the literature. Arch Intern Med. 1989;149:2486–2492. doi: 10.1001/archinte.149.11.2486. [DOI] [PubMed] [Google Scholar]
- Nagai M, Kishi K, Kato S. Insular cortex and neuropsychiatric disorders: a review of recent literature. Eur Psychiatry. 2007;22:387–394. doi: 10.1016/j.eurpsy.2007.02.006. [DOI] [PubMed] [Google Scholar]
- O'Gorman RL, Mehta MA, Asherson P, Zelaya FO, Brookes KJ, Toone BK, et al. Increased cerebral perfusion in adult attention deficit hyperactivity disorder is normalised by stimulant treatment: a non-invasive MRI pilot study. Neuroimage. 2008;42:36–41. doi: 10.1016/j.neuroimage.2008.04.169. [DOI] [PubMed] [Google Scholar]
- Palombo E, Porrino LJ, Bankiewicz KS, Crane AM, Sokoloff L, Kopin IJ. Local cerebral glucose utilization in monkeys with hemiparkinsonism induced by intracarotid infusion of the neurotoxin MPTP. J Neurosci. 1990;10:860–869. doi: 10.1523/JNEUROSCI.10-03-00860.1990. [DOI] [PMC free article] [PubMed] [Google Scholar]
- Pasricha PJ, Pehlivanov N, Sugumar A, Jankovic J. Drug Insight: from disturbed motility to disordered movement – a review of the clinical benefits and medicolegal risks of metoclopramide. Nat Clin Pract Gastroenterol Hepatol. 2006;3:138–148. doi: 10.1038/ncpgasthep0442. [DOI] [PubMed] [Google Scholar]
- Pratt JA, Winchester C, Egerton A, Cochran SM, Morris BJ. Modelling prefrontal cortex deficits in schizophrenia: implications for treatment. Br J Pharmacol. 2008;153(Suppl. 1):S465–S470. doi: 10.1038/bjp.2008.24. [DOI] [PMC free article] [PubMed] [Google Scholar]
- Raichle ME. Behind the scenes of functional brain imaging: a historical and physiological perspective. Proc Natl Acad Sci U S A. 1998;95:765–772. doi: 10.1073/pnas.95.3.765. [DOI] [PMC free article] [PubMed] [Google Scholar]
- Rogers BP, Morgan VL, Newton AT, Gore JC. Assessing functional connectivity in the human brain by fMRI. Magn Reson Imaging. 2007;25:1347–1357. doi: 10.1016/j.mri.2007.03.007. [DOI] [PMC free article] [PubMed] [Google Scholar]
- Rzezniczak HW, Gundlach AL, Beart PM. Labelling of high (D-2 receptor) and low affinity sites by [3H]domperidone in homogenates of the corpus striatum of the rat. Neurosci Lett. 1982;30:63–68. doi: 10.1016/0304-3940(82)90013-1. [DOI] [PubMed] [Google Scholar]
- Seeley WW, Menon V, Schatzberg AF, Keller J, Glover GH, Kenna H, et al. Dissociable intrinsic connectivity networks for salience processing and executive control. J Neurosci. 2007;27:2349–2356. doi: 10.1523/JNEUROSCI.5587-06.2007. [DOI] [PMC free article] [PubMed] [Google Scholar]
- Seeman P. All roads to schizophrenia lead to dopamine supersensitivity and elevated dopamine D2 receptors. CNS Neurosci Ther. 2010 doi: 10.1111/j.1755-5949.2010.00162.x. [Epub ahead of print] [DOI] [PMC free article] [PubMed] [Google Scholar]
- Shearer RM, Bownes IT, Curran P. Tardive akathisia and agitated depression during metoclopramide therapy. Acta Psychiatr Scand. 1984;70:428–431. doi: 10.1111/j.1600-0447.1984.tb01230.x. [DOI] [PubMed] [Google Scholar]
- Stanley M, Lautin A, Rotrosen J, Gershon S, Kleinberg D. Metoclopramide: antipsychotic efficacy of a drug lacking potency in receptor models. Psychopharmacology (Berl) 1980;71:219–225. doi: 10.1007/BF00433055. [DOI] [PubMed] [Google Scholar]
- Wang J, Alsop DC, Li L, Listerud J, Gonzalez-At JB, Schnall MD, et al. Comparison of quantitative perfusion imaging using arterial spin labeling at 1.5 and 4.0 Tesla. Magn Reson Med. 2002;48:242–254. doi: 10.1002/mrm.10211. [DOI] [PubMed] [Google Scholar]
- Wang J, Zhang Y, Wolf RL, Roc AC, Alsop DC, Detre JA. Amplitude modulated continuous arterial spin labeling perfusion MR with single coil at 3.0 Tesla. Radiology. 2005;235:218–228. doi: 10.1148/radiol.2351031663. [DOI] [PubMed] [Google Scholar]
- Weddington WW, Jr, Banner A. Organic affective syndrome associated with metoclopramide: case report. J Clin Psychiatry. 1986;47:208–209. [PubMed] [Google Scholar]
- Weintraub D, Moberg PJ, Duda JE, Katz IR, Stern MB. Recognition and treatment of depression in Parkinson's disease. J Geriatr Psychiatry Neurol. 2003;16:178–183. doi: 10.1177/0891988703256053. [DOI] [PubMed] [Google Scholar]
- Wik G, Wiesel FA, Sjogren I, Blomqvist G, Greitz T, Stone-Elander S. Effects of sulpiride and chlorpromazine on regional cerebral glucose metabolism in schizophrenic patients as determined by positron emission tomography. Psychopharmacology (Berl) 1989;97:309–318. doi: 10.1007/BF00439443. [DOI] [PubMed] [Google Scholar]
- Williams DS, Detre JA, Leigh JS, Koretsky AP. Magnetic resonance imaging of perfusion using spin inversion of arterial water. Proc Natl Acad Sci U S A. 1992;89:212–216. doi: 10.1073/pnas.89.1.212. [erratum appears in Proc Natl Acad Sci U S A 1992 May 1;89(9):4220] [DOI] [PMC free article] [PubMed] [Google Scholar]
- Wong EC. Vessel-encoded arterial spin-labeling using pseudocontinuous tagging. Magn Reson Med. 2007;58:1086–1091. doi: 10.1002/mrm.21293. [DOI] [PubMed] [Google Scholar]
- Wong EC, Buxton RB, Frank LR. Quantitative imaging of perfusion using a single subtraction (QUIPSS and QUIPSS II) Magn Reson Med. 1998;39:702–708. doi: 10.1002/mrm.1910390506. [DOI] [PubMed] [Google Scholar]
- Wu WC, Fernandez-Seara M, Detre JA, Wehrli FW, Wang J. A theoretical and experimental investigation of the tagging efficiency of pseudocontinuous arterial spin labeling. Magn Reson Med. 2007;58:1020–1027. doi: 10.1002/mrm.21403. [DOI] [PubMed] [Google Scholar]
- Ye FQ, Berman KF, Ellmore T, Esposito G, van Horn JD, Yang Y, et al. H(2)(15)O PET validation of steady-state arterial spin tagging cerebral blood flow measurements in humans. Magn Reson Med. 2000;44:450–456. doi: 10.1002/1522-2594(200009)44:3<450::aid-mrm16>3.0.co;2-0. [DOI] [PubMed] [Google Scholar]
- Yoshikawa T, Yoshida N, Mine Y, Hosoki K. Affinity of mosapride citrate, a new gastroprokinetic agent, for 5-HT4 receptors in guinea pig ileum. Jpn J Pharmacol. 1998;77:53–59. doi: 10.1254/jjp.77.53. [DOI] [PubMed] [Google Scholar]
- Zgaljardic DJ, Borod JC, Foldi NS, Mattis PJ, Gordon MF, Feigin A, et al. An examination of executive dysfunction associated with frontostriatal circuitry in Parkinson's disease. J Clin Exp Neuropsychol. 2006;28:1127–1144. doi: 10.1080/13803390500246910. [DOI] [PMC free article] [PubMed] [Google Scholar]
Associated Data
This section collects any data citations, data availability statements, or supplementary materials included in this article.