Abstract
A high resolution radiographic method for soft tissues in the small joints of the hand would aid in the study and treatment of Rheumatoid Arthritis (RA) and Osteoarthritis (OA), which often attacks these joints. Of particular interest would be imaging with <100 μm resolution the joint cartilage, whose integrity is a main indicator of disease. Differential phase-contrast or refraction based X-ray imaging (DPC) with Talbot grating interferometers could provide such a method, since it enhances soft tissue contrast and it can be implemented with conventional X-ray tubes. A numerical joint phantom was first developed to assess the angular sensitivity and spectrum needed for a hand DPC system. The model predicts that due to quite similar refraction indexes for joint soft tissues, the refraction effects are very small, requiring high angular resolution. To compare our model to experiment we built a high resolution bench-top interferometer using 10 μm period gratings, a W anode tube and a CCD based detector. Imaging experiments on animal cartilage and on a human finger support the model predictions. For instance, the estimated difference between the index of refraction of cartilage and water is of only several percent at ~25 keV mean energy, comparable to that between the linear attenuation coefficients. The potential advantage of DPC imaging comes thus mainly from the edge enhancement at the soft tissue interfaces. Experiments using a cadaveric human finger are also qualitatively consistent with the joint model, showing that refraction contrast is dominated by tendon embedded in muscle, with the cartilage layer difficult to observe in our conditions. Nevertheless, the model predicts that a DPC radiographic system for the small hand joints of the hand could be feasible using a low energy quasi-monochromatic source, such as a K-edge filtered Rh or Mo tube, in conjunction with a ~2 m long ‘symmetric’ interferometer operated in a high Talbot order.
1. Introduction
High resolution imaging of joint soft tissues would greatly aid in the diagnosis and treatment monitoring of arthropathies such as Rheumatoid Arthritis (RA) and Osteoarthritis (OA). RA often initially attacks the small joints of the hand and foot and is characterized by joint swelling, stiffness, and pain. OA is another widespread disease that affects cartilage and periarticular soft tissues of aging people and it is a major cause of disability worldwide. Cartilage degeneration is a major feature of OA and RA but is apparent only indirectly in conventional radiography as a reduction in joint space in the late stages of disease.
The imaging modalities commonly applied to joint pathologies include X-ray radiography and computed tomography (CT), magnetic resonance imaging (MRI), ultrasound (US) and nuclear medicine (NM) (see e.g. Mikkel et al 2008, Hayashi et al 2011 for recent overviews). Conventional radiography images bone tissue with high contrast and high spatial resolution, but soft tissues are indistinct. X-ray CT provides better soft tissue contrast but spatial resolution is worse than in radiography and patient dose is higher. MRI methods offer better discrimination of soft tissues than CT, but the spatial resolution is often insufficient to image fine details around the joints. High-frequency ultrasound methods can image subtle abnormalities in small joint structures, but require operator expertise and can be time intensive. All in all, no currently available imaging modality is ideal for diagnosing and monitoring joint pathology. An improved X-ray radiographic method capable of imaging periarticular soft tissues and cartilage in the small joints of the hand with <100 μm resolution and at relatively low dose could help to detect destructive effects of RA and OA before they are evident in conventional radiography.
X-ray differential phase-contrast or refraction based imaging (DPC) has the potential to become such a method. Differential phase-contrast imaging uses the refraction of X-rays transmitted through an object, rather than their attenuation (see e.g. Zhou and Brahme 2008 and Keyriläinen et al 2010 for recent reviews). The interaction of an X-ray wave passing through an object is described through a complex index of refraction, N=1−δ−iβ where the imaginary part β describes the attenuation of the wave and the real part δ the phase change:
| (1) |
with λ the wavelength and the integral taken along the wave propagation direction, (z). For X-ray energies far from atomic absorption edges δ is proportional to the electron density, δ~re λ2/2π ne, with re the classical electron radius. The imaginary part β is related to the X-ray attenuation cross section σa, β=λ/4π nAσa, with nA the density of atoms. The phase change ΔΦ leads to refraction of the X-rays through an angle (Zhou and Brahme 2008 and references therein):
| (2) |
Thus, the potential advantage of refraction for medical imaging comes thus from sensitivity to gradients in line integrated density rather than to X-ray attenuation, which is often poorly differentiated in soft tissues. Since for a homogenous object the gradient of the line integrated density is largest near the boundary, refraction has a contrast enhancing effect on edges which can improve the detection of soft tissues. A second contrast mechanism also exists due to ultra-small angle scatter (USAXS) occurring on microscopic density gradients, leading to an angular broadening of X-ray beams passing through objects with microscopic inhomogeneities. Synchrotron experiments have shown for instance that the USAXS scatter occurring in micro-structured tissue such as cartilage, tendon, ligament or muscle can produce a volume contrast enhancing effect (Keyriläinen et al 2010, Momose et al 2006, Momose et al 2008, Muehleman et al 2006, Yuasa et al 2008, Suhonen et al 2007, Li et al 2009).
Another potential advantage of DPC for soft tissue imaging is that δ decreases much slower with X-ray energy than β (1/E2, as compared to 1/E4). Theoretically this allows obtaining refraction contrast in a wide energy range with the potential for reducing the patient dose by imaging at energies where soft tissue has minimal energy absorption (Zhou and Brahme 2008, Lewis 2004).
The basic principle behind all X-ray DPC imaging methods consists of angularly filtering the transmitted X-rays and then converting angular beam deviations from refraction into an intensity pattern on a conventional imaging detector. Since for hard X-rays the refraction angles are in the micro-radian range, the angular filtering uses X-ray optics such as crystal Bragg reflectors or micro-periodic gratings. To date, most research on medical applications of refraction based X-ray imaging has been done at synchrotrons using crystal optics and quasi-coherent illumination with parallel monochromatic beams (‘diffraction enhanced’ -DEI, or ‘analyzer based’ imaging - ABI) (Zhou and Brahme 2008, Keyriläinen et al 2010, and references therein). The results confirm the potential of this technique for high resolution imaging of joint soft tissues at x-ray energies up to several tens of keV (Muehleman et al 2006, Li et al 2009, Coan et al 2010). The synchrotron experiments demonstrate also that soft tissue contrast obtains in both DPC computed tomography and in plain, refraction enhanced radiography. For instance, refraction enhanced radiography and tomosynthesis of a human finger joint has been demonstrated by Shimao et al 2008 using 36 keV synchrotron X-rays and a ‘dark-field’ crystal optics technique. The refraction enhanced images with few tens of μm resolution reveal soft tissues that are otherwise invisible in conventional radiographs, such as cartilage, tendon, and the connective tissue in the joint capsule. Similar results have been obtained for knee joints using 51 keV synchrotron X-rays (Muehleman et al 2006, Li et al 2009).
Despite its attractiveness for medical imaging, X-ray DPC has not yet been implemented in a clinical setting. The main reason is that the crystal optics is inefficient (less than a hundredth of a %) in the use of the polychromatic x-ray beams produced by medical X-ray tubes, which themselves are at best ~1% efficient. While there are efforts to apply the crystal method using narrow Kα line emission from conventional X-ray tubes (Muehleman et al 2009) or to develop table-top synchrotrons (Bech et al 2009a), another method that enables efficient DPC imaging with polychromatic X-ray tubes has been demonstrated in recent years. This method, called shearing or Talbot interferometry, uses micro-periodic absorption and transmission gratings in a Talbot-Lau interferometer setup to make a μ-radian resolution, extended area angular filter (Pfeiffer et al 2006, Momose et al 2006, Pfeiffer et al 2008, Donath et al 2010). The Talbot gratings are made by lithographic methods in thin Si wafers. The most challenging to fabricate are the absorption gratings, made by filling with gold the gaps in a Si or photoresist grid (David et al 2007, Reznikova et al 2008). Few-μm period Au gratings can currently be made with up to ~100 μm thickness, which is sufficient for operation up to a few tens of keV. The typical grating sizes are typically several cm in diameter.
A useful capability of the Talbot method is also that it can separate the attenuation, refraction and USAXS components in the radiographic image. This is done for instance using a ‘phase-scanning’ technique, in which one of the gratings is scanned in steps of a fraction of its period and the quasi-sinusoidal intensity modulation in each detector pixel used to separate the three image components (Pfeiffer et al 2006, 2008). A similar technique uses Moiré fringe scanning (Momose et al 2006). These techniques require however multiple (at least three) exposures of the object to achieve this decomposition.
The Talbot grating method has previously demonstrated the potential for soft tissue imaging with conventional X-ray tubes, including the recent demonstration of DPC computed tomography (DPC-CT) of a fetus hand (Bech at al 2009b, Donath et al 2010). The soft tissue contrast achieved using the Talbot method and conventional X-ray tubes is however lower than with the crystal method, generally requiring the application of a phase-scanning technique for the refraction enhancements to become evident (Bech et al 2009b, Donath et al 2010, Momose et al 2008).
Our paper investigates the feasibility of a Talbot DPC radiography system for the small joints of the hand, of interest for clinical research in RA and OA. The appeal of plain DPC radiography rather than computed tomography comes from the potential for lower dose, lower cost, simplicity, and ease of clinical implementation. The Talbot method has several characteristics that make it attractive for a hand joint DPC radiographic system:
It works with extended focal spot, polychromatic X-ray tubes
It provides high spatial resolution
X-ray energies below few tens of keV are sufficient to penetrate the thin finger joints
The several cm field of view with current Talbot gratings is sufficient for the small joints of the hand
The hand can be immobilized without discomfort for several seconds, permitting the longer exposure times needed for DPC imaging
As concerns practical constraints, for clinical DPC radiography it would be desirable to obtain refraction contrast in a single exposure rather than using phase-scanning with multiple exposures. Further on, from the point of view of efficient utilization of the X-ray source it would be desirable to use a spectrally broad source such as a W anode tube.
To study the feasibility of a Talbot system for the hand we developed a numerical model of joint soft tissue DPC imaging, which served to optimize the characteristics of the grating interferometer. The model was then tested on animal and human joint tissue samples using a bench-top interferometer with a W anode tube and the results were used to guide the conceptual design of a clinical system.
The paper is structured as follows. Section 2 describes the hand joint model and the optimization of the Talbot setup, Section 3 presents experimental data obtained with the test interferometer, and Section 4 discusses the results and describes the proposed path towards a clinical DPC system.
2. Numerical study of Talbot interferometry for the small joints of the hand
The Talbot-Lau interferometer is based on the Talbot effect, which produces fine fringe patterns with a micron period grating illuminated by an X-ray beam. The patterns form at periodic intervals along the beam called Talbot distances, dT=m g12/8λ, where λ is the wavelength, g1 is the grating period, and m=1,3, 5… is the order of the pattern (Pfeiffer et al 2006, Momose et al 2006). The grating producing the fringes is called ‘beam-splitter’ and is typically a π-shift phase (transmission) grating, for which the period of the Talbot pattern is g1/2 (Fig. 1). When a refractive object is introduced in the beam the Talbot pattern is distorted (shifted). The fringe shifts are then converted into intensity changes using an absorption ‘analyzer’ grating, placed at the Talbot distance and having period equal to that of the Talbot pattern. Since hard X-rays are refracted by μ-radian angles, to achieve angular sensitivity in this range g1 must be of a few μm and the Talbot distance of the order of a meter. Lastly, to make the setup work with an extended spot X-ray source, the source area is divided into an array of quasi-coherent micro-sources by placing near the source an absorption grating having openings of width s0≤g0/2 and period g0=g2·L/D. This choice of period ensures that the Talbot patterns from each micro-source overlap at the analyzer (Pfeiffer et al 2006, Momose et al 2006). To maximize the angular sensitivity the distance R between the object and the beam-splitter must be kept at a minimum (Donath et al 2009).
Fig. 1.
Talbot-Lau grating interferometer with conventional source.
The main characteristics of the interferometer are the angular width or resolution, W~g2/D, which determines its angular sensitivity or resolving power S=1/W, and the mean energy <E> and width of the region of good fringe contrast, which define its spectral response. Mean energies for grating interferometers are typically in the 15–30 keV range, with spectral widths on the order of <E>/m and with fringe contrast of a few tens of % when operated with conventional X-ray tubes (Pfeiffer et al 2006, Momose et al 2006, Weitkamp et al 2006, Donath et al 2009). The optical transmission of the Talbot interferometer is high compared to crystal DEI systems, of the order of ~20%. The photon flux reduction caused by the absorption gratings makes nevertheless necessary using longer exposure time than with conventional X-ray imaging. The attractiveness of the Talbot method for soft tissue imaging comes thus from its capability to efficiently use polychromatic and spatially extended X-ray sources, such as the high power rotating anode tubes used in medical imaging.
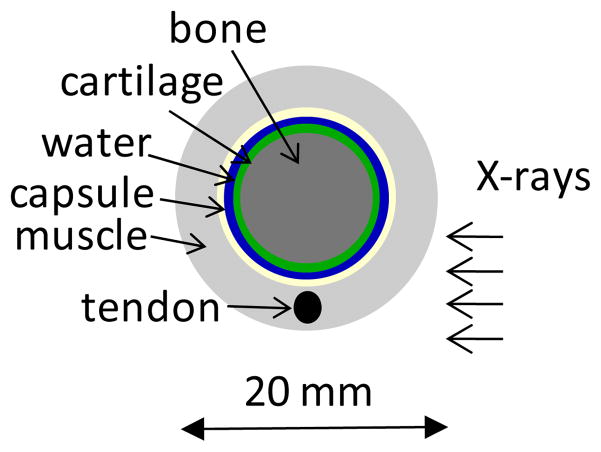
The first step in our study was to estimate the interferometer angular sensitivity and mean energy required for DPC imaging of the small hand joints. To this end we constructed a simple numerical model or phantom of a finger joint and used it to compute attenuation and DPC contrast at different energies. The model follows that in Anderson et al 2008 and consists of cylindrical layers of materials simulating bone, cartilage, synovial fluid, connective tissue of the joint capsule, tendon, and skeletal muscle (Fig. 2). The layer dimensions were chosen to approximate the anatomy of the human proximal interphalangeal joint, with cartilage and synovial space thickness of 0.6 mm and with joint capsule thickness of 0.3 mm. The bone, cartilage, synovial fluid and the joint capsule were modeled as concentric layers, while the tendon was modeled as a 2.5 mm diameter rod embedded in muscle.
Fig. 2.
Layout of numerical phantom of human finger joint.
To compute attenuation and refraction images we used the XWFP code developed in the synchrotron community in conjunction with the XOP database (Weitkamp 2004, Sanchez del Rio and Dejus 1998). XWFP computes the X-ray wave propagation, including absorption, refraction and diffraction, through objects such as rods, spheres, and cavities, and through optical elements such as phase and absorption gratings. Its accuracy has been validated in synchrotron experiments. The XOP database allows computing δ and β for materials of arbitrary composition, by specifying the mass fraction for each element and the mass density of the compound.
To compute δ and β for joint soft tissues we used the composition and density of body tissues from the compilation by Woodard and White 1986. Cartilage was modeled for instance as a mixture of 9.6% H, 9.9% C, 2.2% N, 74.4% O, 0.5% Na, 2.2% P, 0.9% S, and 0.3% Cl, with a density of 1.1 g/cm3 (percentages by mass). The joint capsule and the tendon were modeled assuming the composition and density of connective tissue, while the synovial fluid was modeled as water. This approximation is supported by our experiments, as further shown. We tried also modeling the joint tissues using interaction coefficients for plastic materials as was done in Anderson et al 2008 (e.g., using the polycarbonate coefficients for cartilage); this assumption lead however to a substantial overestimate of the refraction angles as compared to experiment.
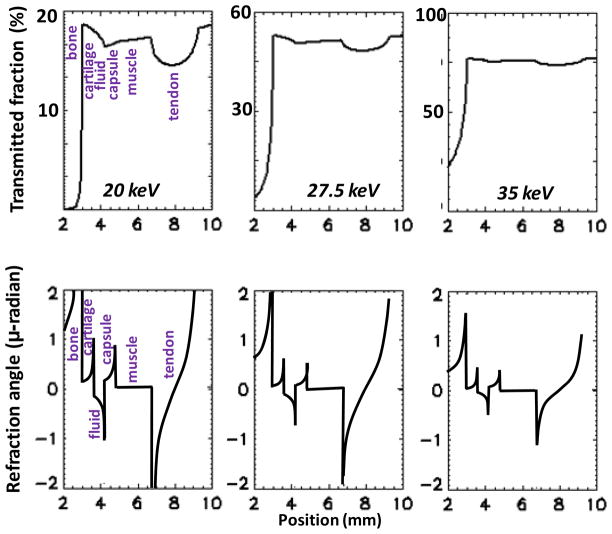
The transmitted intensity profiles and the refraction angle profiles computed with XWFP assuming a parallel monochromatic beam are presented in Fig. 3, for three X-ray energies. As expected, the transmitted intensity profiles show that the attenuation contrast for soft tissue is low and also decreases rapidly with energy. In particular, the interface between the cartilage and the joint fluid is invisible in the attenuation profiles. On the other hand, the relative variation or contrast in the refraction angle is much stronger, with the cartilage, fluid and capsule layers clearly differentiated, in particular near the edges. In addition, the decrease in refraction contrast with increasing photon energy is slower than for the attenuation contrast. These basic effects constitute the reason why DPC is of interest for medical imaging.
Fig. 3.
XWFP computation of transmitted intensity (top) and of refraction angles (bottom) through the finger joint phantom, at increasing photon energies.
At the same time however, our model predicts that while the refraction angle contrast from soft tissues can be substantial, the absolute values of the refraction angles are very small. For instance, the refraction angles at the cartilage/fluid interface are ≤1 μ-radian at 20 keV, decreasing to ≤0.5 μ-radian at 27.5 keV, and to ≤0.3 μ-radian at 35 keV. The latter values are consistent with the synchrotron results, which estimate refraction angles from the finger joint in the ≤0.4 μ-radian range at E~36 keV (Shimao et al 2008). The reason for the very small refraction angles is the similarity of the X-ray refraction index for joint soft tissues. For instance, at 25 keV the predicted difference between the index of refraction of cartilage and that of water is of only ~5%, comparable to the difference in the linear coefficients of attenuation.
In conclusion, our calculations indicate that it is critical to achieve the highest possible angular sensitivity in the hand DPC system. The angular sensitivity S=1/W of the Talbot interferometer is proportional to m·g/λ, with g the Talbot period, m the Talbot order, and λ the X-ray wavelength (Donath et al 2009). Thus, the first way to increase the angular sensitivity is to increase the Talbot period. However, this rapidly increases the interferometer length, since the Talbot distance increases as the square of the period. Alternately, one can increase the Talbot order m. However, since the width of the spectral region of high contrast decreases as 1/m, this approach is also constrained when using a spectrally broad X-ray source such as a W anode tube. In addition, there are various Talbot magnifications, MT=(L+D)/L possible for a given interferometer length, L+D.
As such, an optimal choice must be made for the interferometer length, the grating periods, the Talbot magnification, and the Talbot order. The interferometer length is limited by technological considerations and by the photon flux possible with a medical X-ray tube to L+D≤2 m approximately, while from the geometry point of view the angular sensitivity is maximized in a ‘symmetric’ Talbot setup, having L=D (MT=2) and gratings of equal period g=g0=g1=g2 (Donath et al 2009). In addition, detailed calculations show that the third Talbot order offers an optimal compromise between interferometer contrast and angular sensitivity when using a broad W anode spectrum. With the above choices the optimal Talbot period is in the 7–10 μm range for mean energies in the 20–30 keV range, which is readily feasible with present grating technology. The only drawback of the symmetric setup is that the object magnification is M~2, instead of M~1 as typically used for medical radiography, which mandates using a smaller spot X-ray tube. For instance, to achieve 60 μm object resolution with a 70 μm pixel detector, the source spot size must be 100 μm. This is nevertheless feasible with high power rotating anode tubes.
To assess the mean energy optimal for a hand DPC system working with a W tube we used spectrally resolved calculations with the joint model. Refraction enhanced images averaged over the tube spectrum were generated as follows. First, spectrally resolved or monochromatic images were computed with the XWFP code using the numerical joint phantom as object and assuming monochromatic plane wave illumination. The monochromatic images were computed at 70 energy points spaced by 0.5 keV, spanning the interval 10 keV to 45 keV. Spectrally averaged refraction enhanced images were then obtained by weighting these spectrally resolved images with the power spectrum of a W anode tube filtered with 1 mm Al and operated at 25, 35, or 45 kVp (mean energies of ~19 keV, ~23.5 keV, and ~28 keV respectively). We assumed a symmetrical interferometer of 1.8 m length operated in the third Talbot order and having analyzer and source grating thickness of 55 μm. The interferometer period and phase grating thickness were adjusted to match the 1.8 m interferometer length at each mean energy. The fringe contrast was computed assuming a source grating having with openings of width s0=g0/2, or 50% duty factor. As discussed in Weitkamp et al 2006, the width s0 controls the geometrical broadening of the Talbot pattern, which in turn affects the interferometer contrast. The object to beam-splitter distance was R=6 cm and the X-ray source spot and detector pixel sizes were 100 μm. As shown by Donath et al 2009, for object to beam-splitter distances R much smaller than the beam-splitter to analyzer distance D (R/D~0.065 in our simulation), the phase gradient change due to the fan-angle of the system is also very small. To simulate photon noise we assumed an average fluence of 103 X-rays per pixel and a constant quantum efficiency of 20%. This fluence corresponds approximately to that produced at a distance of 2 m by a W anode tube operated at a few tens of kV and at several tens of mA·s.
The computed images are presented in Fig. 4. The top row shows the attenuation image for each energy obtained by removing the gratings from the beam. The middle row shows the ‘raw’ refraction enhanced image obtained with the analyzer positioned at mid-period of the Talbot pattern. As observed by Zhu et al 2010 and also illustrated in §3.1, this choice maximizes the refraction contrast enhancement in the raw radiographic image. Lastly, the bottom row shows the phase gradient, or ‘pure refraction’ image, in which the intensity is proportional to the refraction angle (Pfeiffer et al 2006, 2008). The phase gradient image was obtained by numerically simulating an eight step phase-scan and by applying the Fourier analysis technique described in Pfeiffer et al 2008 to the computed images.
Fig. 4.
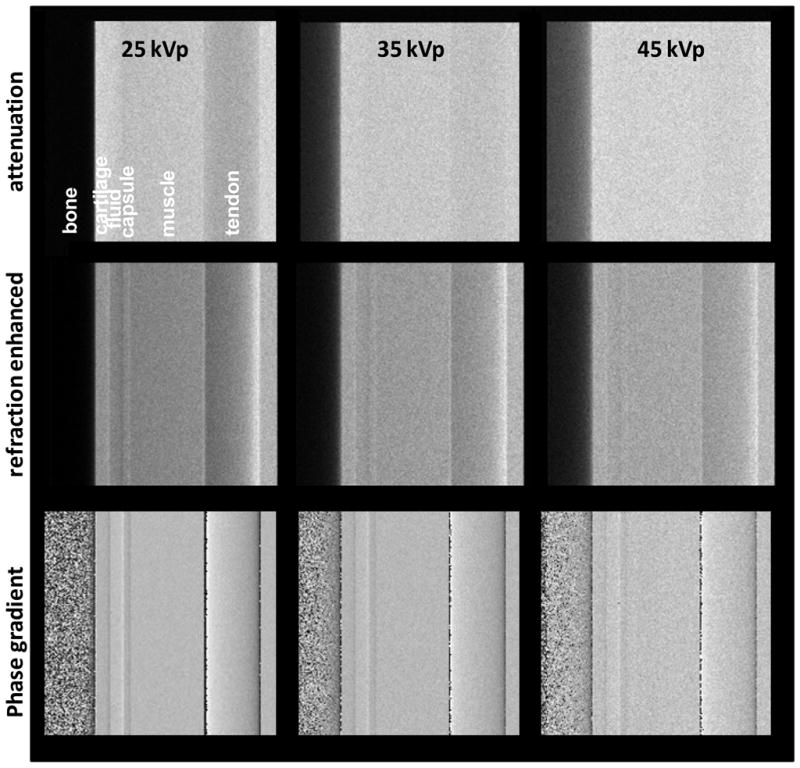
Computed attenuation, refraction enhanced, and phase gradient images of finger joint phantom, with W tube spectra at increasing voltage.
Fig. 4 shows that with the exception of the tendon at lowest energy, the attenuation images exhibit little contrast for joint soft tissues. At the same time, the phase gradient images make evident, mainly through edge enhancement, the layers of cartilage, fluid, and joint capsule. The refraction angle contrast decreases however with increasing tube voltage. In addition, the raw refraction enhanced simulated radiographs show soft tissue contrast only at low tube voltage. Lastly, the model predicts that the soft tissue refraction contrast in the hand joint should be dominated by tendon embedded in muscle, with only faint contrast due to cartilage in contact with synovial fluid.
Thus, a first conclusion from our modeling is that low photon energies (<E> around 20 keV) are better suited for DPC imaging of hand joint soft tissues, in particular if it is desired to obtain refraction enhanced radiographs in a single exposure rather than phase gradient images in a multiple exposure phase-scan. Although the use of low photon energies increases the fraction of absorbed radiation (e.g., from ~60% at 25 keV to ~80% at 20 keV), the extremities can tolerate larger doses of radiation. For instance, the effective dose weighting factor for hand soft tissues is of the order 1%.
A second conclusion is that the refraction contrast expected from the small hand joints with a W tube is rather faint. There are two main reasons for this. First, due to the small difference in refraction index for joint soft tissues, the refraction angles represent only a small fraction of the angular width possible with a Talbot interferometer of practical length. Secondly, since to achieve high angular sensitivity the interferometer must be operated in a high Talbot order, the spectrally averaged interferometer contrast is reduced by the broad X-ray spectrum of the W anode tube (Pfeiffer et al 2006).
3. Experimental results
3.1. Test interferometer
To compare our model to experiment and to test the performance of a grating interferometer for DPC imaging of joint soft tissues we built a test bench-top interferometer using the symmetric setup (L=D, MT=2) and gratings of period g0=g1=g2=10 μm. The source and analyzer gratings had 55 μm thick gold bars with 50% duty factor and were made by MicroWorks Inc., Germany using X-ray lithography. The phase grating had 23 μm thick Si bars for 18 keV design energy and was manufactured in-house using UV lithography. A Ni phase grating for 30 keV design energy was also tested. The grating active area was 6×2 cm2, divided into three 2×2 cm sectors. The gratings had periodic bridges along the bars that strengthen their mechanical structure (Fig. 5). For operation at <E>~20 keV the interferometer length was 0.83 m in the first Talbot order and 2.5 m in the third order. The angular width in the third order is thus 8 μ-radian. For comparison, typical crystal DEI systems have angular widths of ≤ 3 μ-radian (Suhonen et al 2007).
Fig. 5.
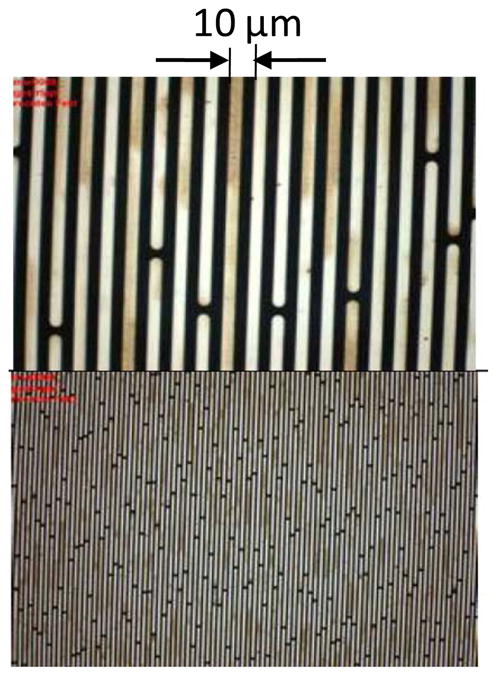
Microscope image of 10 μm period gold grating at two magnifications.
The X-ray source was a 1 mA, 60 μm spot W anode tube made by Oxford Instruments Inc. and operating at up to 60 kVp. The test objects were placed at a few cm behind the phase grating, for an object magnification M~MT=2. The detector was a high resolution, high sensitivity (25 μm pixel, with up to 4×4 binning) scintillator/CCD X-ray camera model XR-4S, made by DALSA Inc. The photons below ~10 keV were suppressed by a 0.5 mm Si filter and by the two 0.25 mm thick Si wafers supporting the source and the analyzer gratings. The predicted interferometer contrast in the third order is shown as a function of energy in Fig. 6, together with the computed spectrum of a filtered W anode tube at 25 kVp and at 40 kVp. The contrast was computed with the XWFP code assuming the manufacturer parameters for the 10 μm period gratings. The contrast curve includes the geometrical broadening of the Talbot pattern by the finite source grating openings (s0=5 μm), computed as in Weitkamp et al 2006 by convolving the pattern at the analyzer with a Gaussian of width s0. As seen, there is good spectral overlap at low kVp, but it decreases with increasing voltage.
Fig. 6.
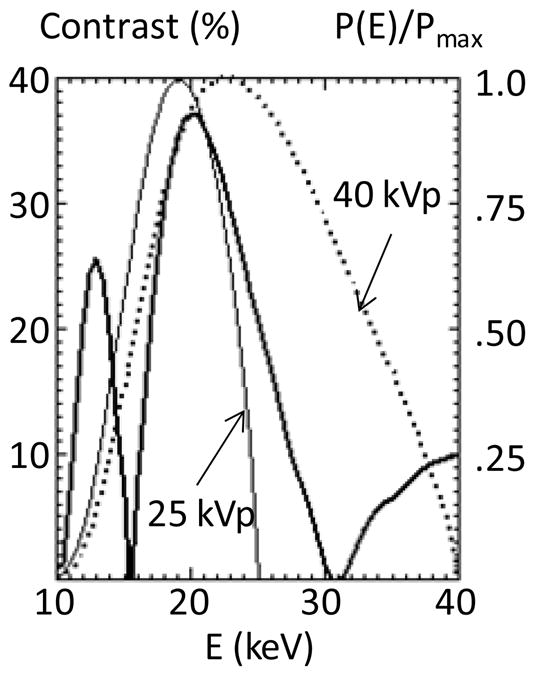
XWFP computed contrast for the test interferometer in the m=3 order, as a function of energy; also shown the normalized spectrum of a W tube computed with XOP for 25 and 40 kVp, assuming 1 mm Si filtering.
To operate the interferometer in high Talbot orders the setup was built on a 3.5 m long, rigid aluminum beam of 10×10 cm cross section. Despite the long optical path the alignment was stable over long periods of time, showing that symmetrical Talbot interferometers with length of a few meters are practically feasible.
The spectrally averaged contrast was measured using Moiré patterns obtained by rotating the analyzer by a fraction of a degree. An image of Moiré fringes measured with the interferometer in the first order and at tube voltage of 25 kV is shown in Fig. 7a, together with a line profile through the image. As seen, high contrast around 35% obtains in these conditions, indicating good grating uniformity and stable optical alignment. The measured contrast as a function as tube voltage is shown in Fig. 7b for m=1 and m=3, together with the contrast computed with XWFP for m=1, 3, and 5. The decrease in contrast with tube voltage is due to the decreasing overlap between the X-ray spectrum and the region of high fringe contrast, as illustrated in Fig. 6, and to the analyzer and source gratings becoming increasingly transparent to energetic X-rays. In addition, Fig. 7b shows that the contrast in the third order is reduced by only a small fraction with respect to that in the first order. The contrast in the fifth Talbot order could not be measured due to the too large interferometer length required. However, the XWFP calculations indicate that the contrast would significantly decrease for m=5, due both to the narrowing of the spectral region of high contrast and to changes in the Talbot pattern away from the central contrast peak. A reduced contrast when working in the fifth order with a W tube is indicated also by the experiments of Donath et al 2010 who measured 8% contrast at 40 kVp. Our results thus suggest that a symmetric setup in the third order offers an optimal combination of interferometer contrast and angular resolution when working with a W anode tube.
Fig. 7.
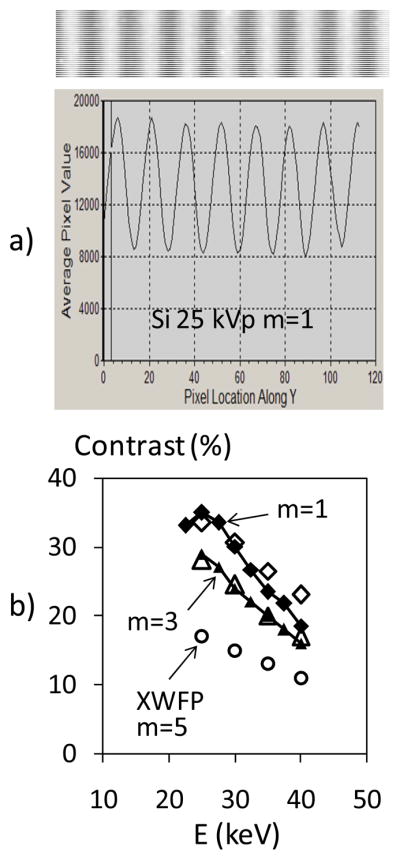
a) Image and profile of Moiré fringes at 25 kVp, m=1.
b) Measured interferometer contrast as a function of W tube voltage, for m=1 and m=3; also shown XWFP computed contrast for m=1,3, and 5.
To test the angular sensitivity of our system we used a ‘pure phase’ object consisting of a rectangular beryllium sheet of 0.5×6 mm cross section and 25 mm long, viewed at an angle of 45° (Fig. 8). The edges of the foil act as constant deflection prisms which refract the X-rays at an angle of ~5 μ-radians for mean energy of ~20 keV. The images in Fig. 8 show that although the Be sheet is almost invisible in transmission, its edges appear with strong contrast in the phase gradient image. The experimental refraction angle agrees with the expected value. In addition, as illustrated in the third panel of Fig. 8, for refraction angles of several μ-radian the interferometer is sensitive enough to produce substantial refraction contrast also in the raw images, without the need for the phase-scanning. The refraction enhanced image was obtained at an interferometer setting in the middle of the quasi-linear portion of the phase-scan curve, shown in the rightmost panel of Fig. 8. As discussed by Zhu et al 2010, at this setting the interferometer is the most sensitive to changes in refraction angle, similar to a crystal ABI system tuned to mid-height of the rocking curve (Suhonen et al 2007).
Fig. 8.
Attenuation, phase-gradient, and refraction enhanced images of Be sheet at 45°, obtained in the first Talbot order with <E>~20 keV. The last panel shows the intensity variation in a pixel during the phase-scan, indicating the point of maximum sensitivity for which the refraction enhanced image was obtained.
3.2. Animal tissue experiments
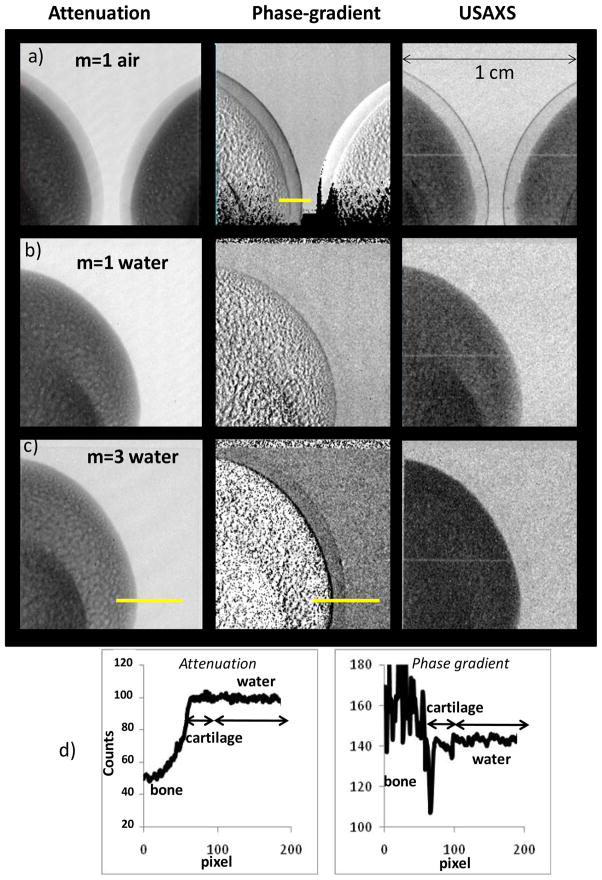
To compare our joint tissue model to experiment we used fresh pig leg bones of a size comparable to a human finger bone (~12 mm) and having similar cartilage thicknesses. To simulate the contrast between cartilage and joint fluid the bone was immersed in a 15 mm thick flat container filled with water. Attenuation, phase-gradient and USAXS images were obtained using 8 steps of 2 μm, exposure time of 10 s per image, and 2×2 binned pixels of 50 μm (Fig. 9). Background phase gradient images were obtained using a phase-scan with the bone removed from the container.
Fig. 9.
Attenuation, phase-gradient and USAXS images of pig leg bone in air (a) and in water (b, c), obtained using the low energy Si phase grating in the first (a, b) and the third Talbot order (c). The field of view at the object is 1×1 cm. Fig. 9d shows intensity profiles through the attenuation and phase gradient images in Fig. 9c. The regions used to measure the intensity profiles are marked by yellow lines.
Fig. 9a shows the image of two bones obtained in the m=1 Talbot order and without water in the tank. The direction of refraction angle measurement (perpendicular to the grating bars) is horizontal. As seen, with air as surrounding medium the cartilage is visible in all images, including the attenuation one. The phase-gradient and USAXS images exhibit strong contrast at the cartilage/air interface (see also Fig. 10a). The situation changes however dramatically when the bone is immersed in water (Fig. 9b). The attenuation contrast becomes unobservable while the phase-gradient image shows only very faint cartilage enhancement.
Fig. 10.
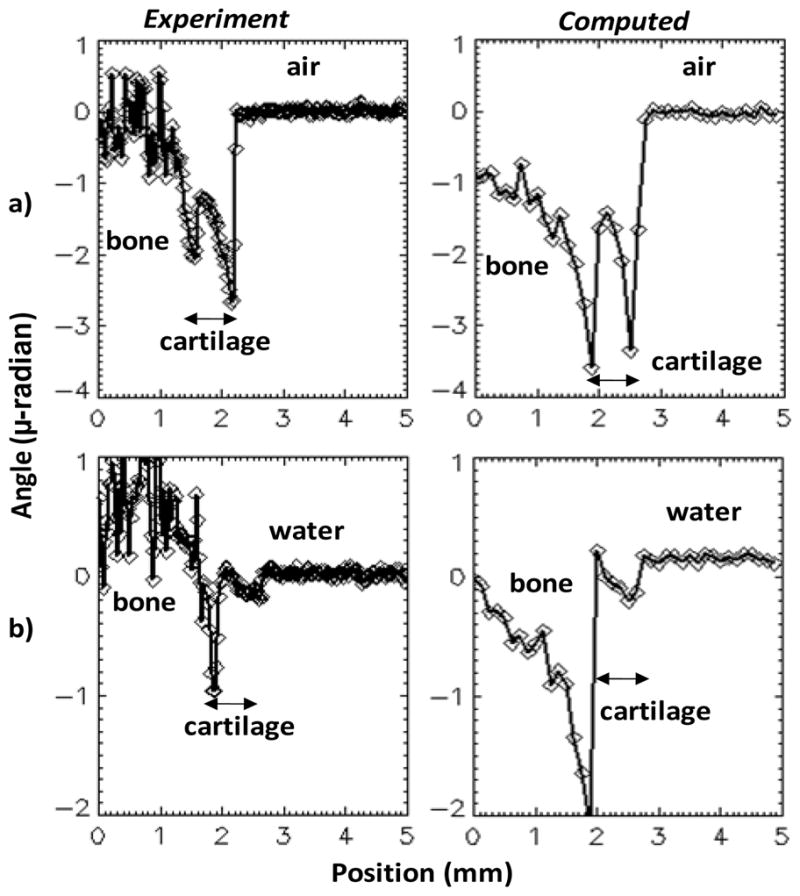
Experimental and computed refraction angles for pig bone with cartilage, in air (a) and in water (b). The experimental values are obtained using the region marked by yellow lines in Fig. 9a and 9c. The computed values include also simulated photon noise.
Fig. 9c shows images obtained with the interferometer operated in the third Talbot order. Due to the low photon flux at 2.5 m distance the tube voltage had to be increased to 40kVp (<E>~26 keV) and several images were averaged at each step of the phase-scan to obtain sufficient signal-to-noise ratio. The 40 kVp, m=3 operation also reduced the interferometer contrast to only ~15%, as shown in Fig. 7b.
Nevertheless, despite less than optimal experimental conditions, the high angular sensitivity achieved in the third Talbot order made the cartilage clearly visible in the phase-gradient image. Faint cartilage contrast appears also in the USAXS image. Intensity profiles through the attenuation and phase gradient images in Fig. 9c are shown in Fig. 9d. The attenuation contrast is below the detection limit, while the refraction contrast reaches ~25% of the mean intensity at the bone/cartilage interface, and ~3.5% at the cartilage/fluid interface. The refraction contrast appears mainly as edge enhancement at the cartilage/bone and at the cartilage/water interfaces. The gradual decrease in contrast when going from the bottom to the top of the phase-gradient image is due to the changing curvature of the cartilage layer with respect to the direction of refraction angle measurement. The refraction contrast in the raw radiographic images was in all cases very faint.
To test our joint soft tissue model we compared the measured and computed refraction angles from the pig bone, in air and in water. Profiles through the measured and computed phase gradient images are shown in Fig. 10 in units of refraction angle α(x,y)=g2/dTφ(x,y), with φ(x,y) the phase gradient values (Weitkamp et al 2006). The cartilage was modeled as a 0.7 mm thick layer of 12 mm diameter and phase-gradient images simulated assuming the 40 kVp W tube spectrum and the characteristics of our X-ray tube and CCD detector.
The results in Fig. 10 indicate that our model predicts fairly well the refraction image for cartilage in both air and in water, with computed refraction angle at the cartilage/fluid interface being about 1.25 times the experimental value in air and about 1.35 times the experimental value in water. The angles at the bone/cartilage interface are less well reproduced, which is to be expected since our model did not include the strong small-angle scattering occurring in the bone (Muehleman et al 2006, De Felici et al 2007).
The above comparison thus supports the method of index of refraction calculation using the soft tissues composition in Woodard and White 1986. In particular, assuming that the pig cartilage composition is similar to the human one, the results with water as medium confirm that for X-rays of around 25 keV mean energy the index of refraction of cartilage differs by only several percent from that of water.
As concerns the USAXS images, it is notable that the bone USAXS contrast in Fig. 9 is comparable to that due to attenuation. This is consistent with the strong bone scattering observed over a broad angular range (≤100 μ-radian) in synchrotron and laboratory experiments and attributed to the hierarchical bone micro-structure, with strong density gradients on spatial scales from a few μm to tens of μm (De Felici et al 2007). Another interesting effect is the change in small scale structure or ‘graininess’ of the bone USAXS image when going from m=1 to m=3, as further discussed in §4.2.
Lastly, since the real ‘contrast agent’ for cartilage inside the joint is synovial fluid and not water, we verified that the refraction contrast between cartilage and water is similar to that between cartilage and synovial fluid. Refraction images of a bone immersed in water and in synovial fluid obtained from a joint therapy patient are shown in Fig. 11; the data indicates that within the sensitivity of our measurement, the index of refraction of synovial fluid and water are similar.
Fig. 11.
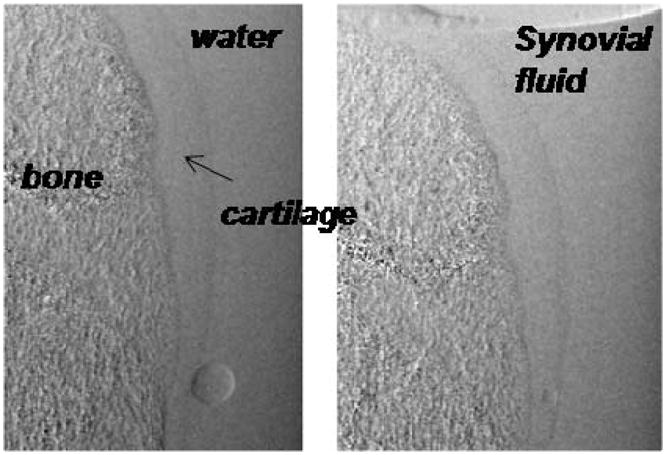
Phase gradient images of bone with cartilage immersed in water and immersed in synovial fluid. Small air bubbles are also evident.
In conclusion, the animal tissue experiments support our joint soft tissue model and confirm that the refraction index difference between cartilage and joint fluid is quite small. In addition, our experimental results demonstrate that a symmetric Talbot interferometer of around 2 m length can measure refraction angles in the range of a few tenth of μ-radian, which approaches the capability of crystal optics ABI systems.
3.3. Human tissue experiments
In a last set of experiments we explored imaging of soft tissues in a human finger joint. A cadaver frozen finger was obtained at QMM Inc from an anatomic gift foundation in accordance with the required procedure. The finger was thawed and placed in a 20 mm thick tank filled with water and imaged using the interferometer in the third Talbot order, the 60 μm spot size mini-focus W anode tube at 40 kV, and the CCD camera with 2×2 binning (50 μm pixels) and 10s integration time. As above, due to the low photon flux at 2.5 m it was necessary to average several images at each phase-scan step to achieve reasonable photon statistics.
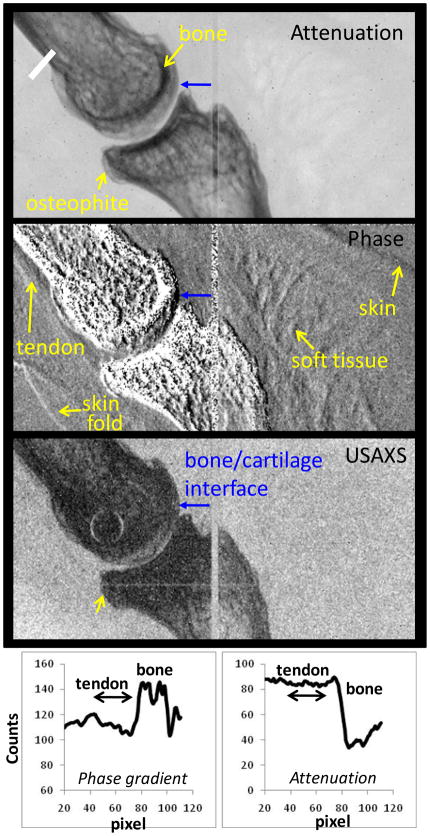
Attenuation, phase-gradient, and USAXS images of a distal interphalangeal finger joint obtained using 16 phase-steps are presented in Fig. 12. The direction of refraction angle measurement is horizontal as above. The field of view at the finger is 1×2 cm and the magnification M~1.9. As seen, the attenuation image shows only the bone tissue, with a gap between the bones of a fraction of mm. The finger is affected by osteoarthritis as indicated by osteophytes (Heberden’s nodes) in the attenuation radiograph.
Fig. 12.
Attenuation, phase gradient and USAXS images of human finger obtained with mini-focus W anode tube at 40 kV/1mA. Also shown phase gradient and attenuation intensity profiles measured across the tendon (along the white line at top left).
The phase-gradient image shows improved contrast for some soft tissues: at the upper right and at the lower left corners skin in contact with water, and in the interior of the finger a flexor tendon in proximity to the bone and soft tissue structures. Profiles through the attenuation and phase gradient images of the tendon are shown at the bottom of Fig. 12, indicating refraction contrast of around 10 and attenuation contrast of less than a few %. The prominence of the tendon contrast in the refraction based image is consistent with the predictions of our model in Fig. 4. Also consistent with the model is the substantial refraction contrast at bone/cartilage interface, marked by a blue arrow in Fig. 12. This improves the definition of the bone boundary in both the phase gradient and the USAXS images as compared to the attenuation image. Nevertheless, the interface between the cartilage and the synovial fluid, or other soft tissues in the joint, was not visible in our experiment.
To verify that this result is not due to the limited photon statistics achievable with the low power minifocus tube, we repeated the experiments using a high power rotating anode W tube having 0.3 mm focal spot. The tube was operated at the minimum voltage of 40 kV and at the maximum current of 63 mA, with an exposure time of 6 s per image. A single image at each phase step was sufficient for good photon statistics. Due to the large focal spot the spatial resolution was however lower, around 170 μm. To verify that the interferometer in the rotating anode setup can still measure cartilage, we imaged in the same conditions a small pig leg bone immersed in water, similar to Fig. 9.
The attenuation, phase-gradient, and USAXS images of a proximal interphalangeal finger joint are presented in Fig. 13. The phase gradient image shows again that tendon dominates soft tissue contrast in the interior of the finger. Nevertheless, even with improved photon statistics, the expected contrast enhancement at the cartilage/joint fluid interface (estimated position marked by solid blue arrow) was still not apparent. At the same time the phase gradient image of the pig bone shows the cartilage/fluid interface, albeit with lower contrast than in Fig. 9 likely due to lower spatial resolution.
Fig. 13.

Attenuation, phase gradient and USAXS images of human finger obtained with rotating W anode tube at 40 kV/63 mA.
4. Discussion
4.1. Improvement of the Talbot setup towards clinical DPC radiography of the hand
The animal tissue experiments demonstrated that our Talbot system is sensitive enough to image with high spatial resolution a thin cartilage layer in contact with synovial fluid, even though the estimated refraction angles are only of a fraction of a μ-radian and even though the experimental conditions were suboptimal (only 15% interferometer contrast at 40 kVp and high thermal noise in the non-cooled CCD detector).
The question thus arises why the experiments on the human finger, performed in the similar conditions, showed only tendon and not cartilage. There is the possibility that the pig leg cartilage has higher index of refraction than the human finger one. The overlap of soft tissues in the finger radiograph could also play a role. However, a more likely possibility is to our estimate that the synovial fluid in our finger sample has been squeezed out of the joint space. The critical role played by the fluid layer in enabling to image the cartilage is illustrated in Fig. 14, which shows a calculation with our model of the phase gradient image a finger joint, with and without fluid between the cartilage and the joint capsule. The parameters of the calculation simulate our m=3 interferometer operated with the minifocus tube at 40 kVp. As seen, the cartilage edge, which is barely detectable even with the fluid layer in place, becomes practically invisible in its absence.
Fig. 14.
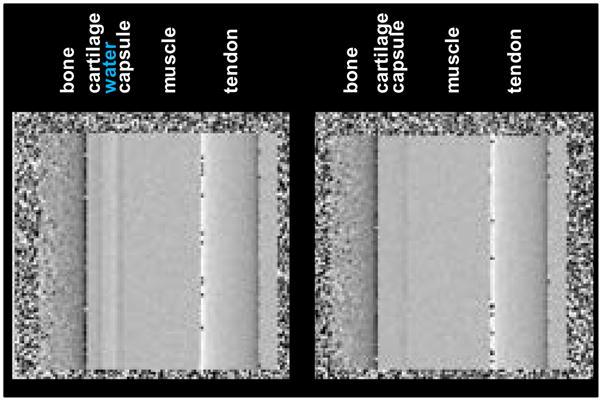
Computed phase gradient image of finger joint with and without fluid between the cartilage and the joint capsule.
Our computational and experimental results thus suggest that to make a hand joint DPC radiographic system that will enable obtaining soft tissue images similar to those demonstrated at the synchrotron, the sensitivity of the Talbot interferometer must be substantially improved over that achieved in our experiments. A possible path towards this improvement is as follows:
Decrease the mean interferometer energy. Since the refraction angles scale approximately as 1/E2, the joint tissue refraction would increase by a factor of about 1.6 when going from <E>~25 keV as in Fig. 12, to <E>~20 keV for instance.
Use a quasi-monochromatic X-ray spectrum in high Talbot order. As above discussed, for a symmetric interferometer of fixed length the angular resolution can be further increased only by increasing the Talbot order. However, since the region of high contrast gets narrower as m is increased, a solution to simultaneously achieving good contrast and angular sensitivity in a high Talbot order is to use a quasi-monochromatic spectrum, such as that emitted by a Mo or Rh anode tube, filtered with a Mo or Rh absorber and operated at a few tens of kV. Fig. 15 shows for instance the spectrum of a Rh anode tube at 40 kVp, filtered with 25 μm Rh and 1 mm Al, superimposed on the contrast of a symmetric interferometer of 1.8 m length using 6 μm period gratings in the 7th Talbot order. The source grating duty cycle is 33%, the Au source and analyzer gratings are 55 μm thick and the Si phase grating is 26 μm thick. The spectrum is dominated by the strong Rh K-α line at 20 keV, which matches closely the peak of the contrast curve in the 7th order. A similarly good match can be produced for the Mo K-α line at 17.5 keV.
Decrease the source grating duty cycle. As shown in Weitkamp et al 2006, the interferometer contrast improves with decreasing source grating opening width s0, due to the decrease in geometrical broadening of the Talbot pattern. For instance, in the symmetric Talbot setup reducing the duty cycle s0/g0 from 50% to 33% would increase the contrast by over 50%, while decreasing the interferometer transmission by only 35%.
Decrease the detector pixel size. The soft tissue refraction contrast appears primarily as edge enhancement. Thus, as discussed by Momose et al 2008, using a smaller pixel detector is another step towards increasing the sensitivity of the Talbot method.
Fig. 15.
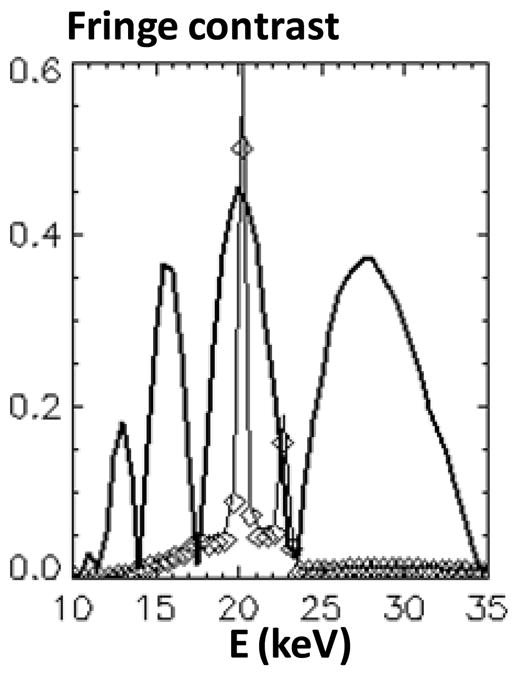
Spectrum of Rh anode tube at 40 kVp filtered with 25 μm Rh and 1 mm Al, together with the fringe contrast for a 1.8 m, 6 μm period, m=7 interferometer.
Our calculations indicate that including all these changes would lead to substantially improved refraction contrast. For instance, Fig. 16 shows the computed attenuation, refraction enhanced, and phase gradient images of the joint phantom assuming the above Rh Kα interferometer at 40 kVp, a detector pixel of 50 μm, a source spot size of 100 μm, and the same photon fluence at the detector as in Fig. 4. As seen, the phase gradient image and in particular the raw refraction enhanced image, have substantially improved contrast compared to those in Fig. 4.
Fig. 16.
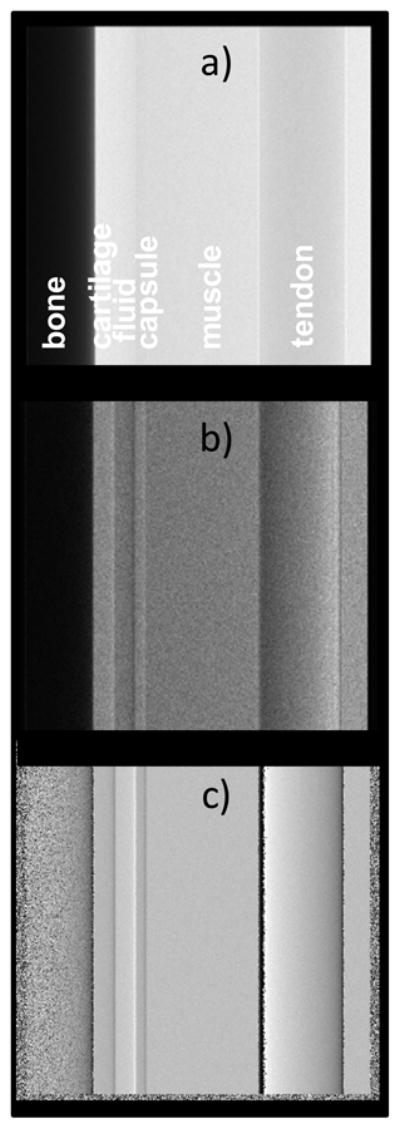
Computed images of joint phantom assuming the quasi-monochromatic Rh K-α spectrum; a) Attenuation, b) Refraction enhanced, c) Phase gradient.
In conclusion, an optimized Talbot system working with quasi-monochromatic Rh-K or Mo-K spectra could enable obtaining improved phase gradient images and possibly also single exposure, refraction enhanced radiographs. Using a single exposure could also compensate for the dose increase due to the use of low energy Rh or Mo spectra. In addition, eliminating the phase-scan would be a major practical advantage.
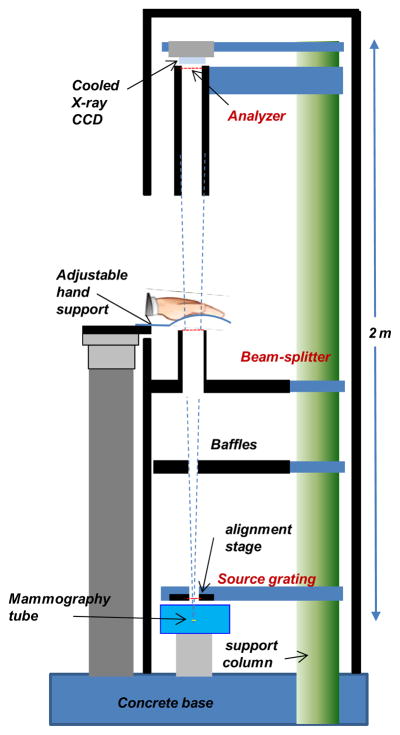
A conceptual design for such a system is depicted in Fig. 17. The system uses the above interferometer setup and a rotating anode mammographic Rh or Mo anode tube with 100 μm spot, such as the Varian RAD71SP. The detector could be a low-noise cooled scintillator/CCD camera, a photon counting detector such as the Medipix (Plackett et al 2010), or one of the recently developed deep depletion/direct detection CCDs, which can have >10% quantum efficiency for E<20 keV, pixel size ≤25 μm and near photon counting performance with long integration times. The estimated hand exposure with such a system would be comparable to that in a mammographic system; however, the effective dose to the hand would be much lower, since extremities are much less sensitive to radiation than glandular tissue.
Fig. 17.
Conceptual design of the Talbot DPC radiographic system for the hand.
4.2. Diagnostic potential of USAXS imaging
A by-product of the phase-scanning procedure is the USAXS scatter image. The decomposition into attenuation, refraction and USAXS images with the Talbot method is similar to the ‘Multiple Image Radiography’ (MIR) with ABI method discussed by Muehleman et al 2006, that showed capability to distinguish tissue with organized micro-structure such as tendon, from tissue with non organized micro-structure, such as fat. While our experiments do not show soft tissue USAXS contrast, the above data confirms that bone has a strong USAXS signature. In addition, an interesting effect of the multi-scale bone micro-structure could be the change in the bone USAXS image, when going from m=1 to m=3 in Fig. 9. While for m=1 the USAXS bone image has essentially the same appearance as the attenuation image, in the m=3 case the USAXS image has more uniform contrast and smaller scale graininess. Since the change in Talbot order is associated with a change in the angular width of the interferometer, this effect might be explained by different scattering scales being involved in the m=3 and m=1 images. The scattering scales dscatt can be estimated from the relation between the scattering angle θ and the angular width of the interferometer, dscatt~ λ/W, pointing to dscatt ~2 μm for m=1, and 6 μm for m=3 respectively (<λ>~0.5 Å).
The finger image in Fig. 12 also suggests possible diagnostic value for USAXS. For instance, while in the attenuation image the osteophyte marked by the arrow is more transparent to X-rays than the bone, in the USAXS image it appears nearly as opaque as the bone, possibly indicating scattering on incipient micro-calcifications (Fuerst et al 2009). It was also recently shown that USAXS imaging with the Talbot method is sensitive to the local angle and degree of orientation of the bone micro-structure (Torben et al 2010).
At the same, we note that the strong bone USAXS scattering can make difficult to measure soft tissue refraction in views in which soft tissues overlap with the bone, since it reduces the contrast of the Talbot pattern. This is especially the case at low X-ray energies, where bone is also strongly absorbing. Thus, the proposed Rh K-α or Mo K-α DPC system would mainly image soft tissues using views tangential to the bone.
Conclusions
Our work suggests that making a high resolution DPC radiographic system for the hand may be difficult but not impossible. The difficulty arises primarily from the smallness of the refraction angles from soft tissues in the hand joints. Our calculations indicate nevertheless that by optimizing the Talbot setup, the tube spectrum and the detector it may possible to achieve angular sensitivity and contrast that compete with those of crystal DEI systems. A main finding is also that a low energy, quasi-monochromatic spectrum such as produced by Rh or Mo tubes could be a better choice for hand DPC radiography than a broad W spectrum, albeit at the price of an increased fraction of absorbed radiation. Nevertheless, if high resolution Talbot radiography at the Rh or Mo K-α wavelength can be demonstrated, other medical applications would become of interest, such as for instance refraction enhanced mammography.
Acknowledgments
We thank Dr. T. Weitkamp from ESRF for kindly sharing the XWFP code and the DALSA company for loaning the CCD camera. The present work was partly supported by NIH grant 1R43AR59436-1.
References
- Anderson AE, Ellis BJ, Peters CL, Weiss JA. Cartilage Thickness: Factors Influencing Multi detector CT Measurements in a Phantom Study. Radiology. 2008;246:133. doi: 10.1148/radiol.2461062192. [DOI] [PMC free article] [PubMed] [Google Scholar]
- Arfelli F, Rigon L, Menk RH. Microbubbles as x-ray scattering contrast agents using analyzer-based imaging. Phys Med Biol. 2010;55:1643–1658. doi: 10.1088/0031-9155/55/6/008. [DOI] [PubMed] [Google Scholar]
- Bech M, Bunk O, David C, Ruth R, Rifkin J, Loewen R, Feidenhans R, Pfeiffer F. Hard X-ray phase-contrast imaging with the Compact Light Source based on inverse Compton X-rays. J Synchrotron Rad. 2009a;16:43–47. doi: 10.1107/S090904950803464X. [DOI] [PMC free article] [PubMed] [Google Scholar]
- Bech MH, Jensen TH, Feidenhans R, Bunk O, David C, Pfeiffer F. Soft-tissue phase-contrast tomography with an x-ray tube source. Phys Med Biol. 2009b;54:2747–2753. doi: 10.1088/0031-9155/54/9/010. [DOI] [PubMed] [Google Scholar]
- Coan P, Bamberg F, Diemoz PC, Bravin A, Kirsten T, et al. Characterization of Osteoarthritic and Normal Human Patella Cartilage by Computed Tomography X-ray Phase-Contrast Imaging. Investigative Radiology. 2010;45:437. doi: 10.1097/RLI.0b013e3181e193bd. [DOI] [PubMed] [Google Scholar]
- David C, Bruder J, Rohbeck T, Grunzweig C, Kottler C, Diaz A, Bunk O, Pfeiffer F. Fabrication of diffraction gratings for hard X-ray phase contrast imaging. Microelectronic Engineering. 2007;84:1172–1177. [Google Scholar]
- Donath T, Chabior M, Pfeiffer F. Inverse geometry for grating-based x-ray phase-contrast imaging. J Appl Phys. 2009;106:054703. doi: 10.1118/1.3553408. [DOI] [PubMed] [Google Scholar]
- Donath T, Pfeiffer F, Bunk O, Grünzweig C, Eckhard H, Popescu S, Peter V, David C. Toward Clinical X-ray Phase-Contrast CT-Demonstration of Enhanced Soft-Tissue Contrast in Human Specimen. Investigative Radiology. 2010;45:445. doi: 10.1097/RLI.0b013e3181e21866. [DOI] [PubMed] [Google Scholar]
- De Felici M, Felici R, Ferrer C, Bravin A, Tartari A, Gambaccini M. Monte Carlo assessment of peak-to-valley dose ratio for MRT. Nuclear Instruments and Methods in Physics Research A. 2007;580:489–492. [Google Scholar]
- Fuerst M, Bertrand J, Lammers L, Dreier R, Echtermeyer F, Nitschke Y, Rutsch F, Schåäfer FK, Niggemeyer O, Steinhagen J, Lohmann CH, Pap T, Rüther W. Calcification of articular cartilage in human osteoarthritis. Arthritis Rheum. 2009;60:2694–703. doi: 10.1002/art.24774. [DOI] [PubMed] [Google Scholar]
- Hayashi D, Guermazi A, Hunter DJ. Osteoarthritis year 2010 in review: imaging. Osteoarthritis Cartilage. 2011;19:354–60. doi: 10.1016/j.joca.2011.02.003. [DOI] [PubMed] [Google Scholar]
- Keyriläinen J, Bravin A, Fernández M, Tenhunen M, Virkkunen P, Suortti P. Phase-contrast X-ray imaging of breast. Acta Radiologica. 2010;8:866. doi: 10.3109/02841851.2010.504742. [DOI] [PubMed] [Google Scholar]
- Lewis RA. Medical phase contrast x-ray imaging: current status and future prospects. Phys Med Biol. 2004;49:3573–3583. doi: 10.1088/0031-9155/49/16/005. [DOI] [PubMed] [Google Scholar]
- Li J, Zhong Z, Connor D, Mollenhauer J, Muehleman C. Phase-sensitive X-ray imaging of synovial joints. Osteoarthritis and Cartilage. 2009;17:1193. doi: 10.1016/j.joca.2009.03.005. [DOI] [PMC free article] [PubMed] [Google Scholar]
- Mikkel Ø, Susanne JP, Uffe MD. Imaging in rheumatoid arthritis – status and recent advances for magnetic resonance imaging, ultrasonography, computed tomography and conventional radiography. Best Practice & Research Clinical rheumatology. 2008;22:1019–1044. doi: 10.1016/j.berh.2008.09.014. [DOI] [PubMed] [Google Scholar]
- Momose A, Yashiro W, Takeda Y, Suzuki Y, Hattori T. Phase Tomography by X-ray Talbot Interferometry for Biological Imaging. Japanese Journal of Applied Physics. 2006;45:5254–5262. [Google Scholar]
- Momose A, Yashiro W, Takeda Y. Sensitivity of X-ray Phase Imaging Based on Talbot Interferometry. Japanese Journal of Applied Physics. 2008;47:8077–8080. [Google Scholar]
- Muehleman C, Li J, Zhong Z, Brankov JG, Wernick MN. Multiple-image radiography for human soft tissue. J Anat. 2006;208:115. doi: 10.1111/j.1469-7580.2006.00502.x. [DOI] [PMC free article] [PubMed] [Google Scholar]
- Muehleman C, Li J, Connor D, Parham C, Pisano E, Zhong Z. Diffraction-enhanced imaging of musculoskeletal tissues using a conventional x-ray tube. Acad Radiol. 2009:918–23. doi: 10.1016/j.acra.2009.04.006. [DOI] [PMC free article] [PubMed] [Google Scholar]
- Pfeiffer F, Weitkamp T, Bunk O, David C. Phase retrieval and differential phase-contrast imaging with low-brilliance X-ray sources. Nature Physics. 2006;2:258. [Google Scholar]
- Pfeiffer F, Bech M, Bunk O, Kraft P, Eikenberry EF, Bronnimann Ch, Grunzweig C, David C. Hard-X-ray dark-field imaging using a grating interferometer. Nature Materials. 2008;7:134. doi: 10.1038/nmat2096. [DOI] [PubMed] [Google Scholar]
- Plackett R, Ballabriga R, Campbell M, Llopart X, Tick T, Tlustos L, Turecek D, Vähänen S, Wong W. Current Status of the Medipix2, Timepix, Medipix3 and Timepix2 Pixel Readout Chips. 19th International Workshop on Vertex Detectors - VERTEX 2010; June 06 – 11; Loch Lomond, Scotland, UK. 2010. [Google Scholar]
- Reznikova E, Mohr J, Boerner M, Nazmov V, Jakobs P-J. Soft X-ray lithography of high aspect ratio SU8 submicron structures. Microsyst Technol. 2008;14:1683–1688. [Google Scholar]
- Sanchez del Rio M, Dejus RJ. XOP: recent developments. In: Macrander AT, editor. Proc SPIE Crystal and Multilayer Optics. Vol. 3448. 1998. pp. 340–345. [Google Scholar]
- Shimao D, Kunisada T, Sugiyama H, Ando M. Shift-and-add tomosynthesis of a finger joint by X-ray dark-field imaging: Difference due to tomographic angle. European Journal of Radiology. 2008;68:S27–S31. doi: 10.1016/j.ejrad.2008.04.037. [DOI] [PubMed] [Google Scholar]
- Stein AF, Ilavsky J, Kopace R, Bennett EE, Wen H. Selective imaging of nano-particle contrast agents by a single-shot x-ray diffraction technique. OPTICS EXPRESS. 2010;18:13171. doi: 10.1364/OE.18.013271. [DOI] [PMC free article] [PubMed] [Google Scholar]
- Suhonen H, Fernandez M, Bravin A, Keyrilainen J, Suorttia P. Refraction and scattering of X-rays in analyzer based imaging. J Synchrotron Rad. 2007;14:512–521. doi: 10.1107/S0909049507044664. [DOI] [PubMed] [Google Scholar]
- Torben H, Jensen TH, Bech M, Bunk O, Donath T, David C, Feidenhans R, Pfeiffer F. Directional x-ray dark-field imaging. Phys Med Biol. 2010;55:3317–3313. doi: 10.1088/0031-9155/55/12/004. [DOI] [PubMed] [Google Scholar]
- Weitkamp T. XWFP: An X-ray wavefront propagation software package for the IDL computer language. In: del Rio Manuel Sanchez., editor. Proc SPIE Advances in Computational Methods for X-Ray and Neutron Optics. Vol. 5536. 2004. p. 181. [Google Scholar]
- Weitkamp T, David C, Kottler C, Bunk O, Pfeiffer F. Tomography with grating interferometers at low-brilliance sources. In: Bonse U, editor. Proc SPIE Developments in X-Ray Tomography V. Vol. 6318. 2006. pp. 6318–28. [Google Scholar]
- Woodard HQ, White DR. The composition of body tissues. The British Journal of Radiology. 1986;59:1209–1219. doi: 10.1259/0007-1285-59-708-1209. [DOI] [PubMed] [Google Scholar]
- Yuasa T, Hashimoto E, Maksimenko A, Sugiyama H, Arai Y, Shimao D, Ichihara S, Ando M. Highly sensitive detection of the soft tissues based on refraction contrast by in-plane diffraction-enhanced imaging CT. Nuclear Instruments and Methods in Physics Research A. 2008;591:546. [Google Scholar]
- Zhou S-A, Brahme A. Development of phase-contrast X-ray imaging techniques and potential medical application. Physica Medica. 2008;24:129. doi: 10.1016/j.ejmp.2008.05.006. [DOI] [PubMed] [Google Scholar]
- Zhu P, Zhang K, Wang Z, Liu Y, Liu X, Wu Z, McDonald SA, Marone F, Stampanonice M. Low-dose, simple, and fast grating-based X-ray phase-contrast imaging. Proc Natl Acad Sci. 2010;107:13576–13581. doi: 10.1073/pnas.1003198107. [DOI] [PMC free article] [PubMed] [Google Scholar]


