Abstract
Background
Virulence acquisition and loss is a dynamic adaptation of pathogens to thrive in changing milieus. We investigated the mechanisms of virulence loss at the whole genome level using Babesia bovis as a model apicomplexan in which genetically related attenuated parasites can be reliably derived from virulent parental strains in the natural host. We expected virulence loss to be accompanied by consistent changes at the gene level, and that such changes would be shared among attenuated parasites of diverse geographic and genetic background.
Results
Surprisingly, while single nucleotide polymorphisms in 14 genes distinguished all attenuated parasites from their virulent parental strains, all non-synonymous changes resulted in no deleterious amino acid modification that could consistently be associated with attenuation (or virulence) in this hemoparasite. Interestingly, however, attenuation significantly reduced the overall population's genome diversity with 81% of base pairs shared among attenuated strains, compared to only 60% of base pairs common among virulent parental parasites. There were significantly fewer genes that were unique to their geographical origins among the attenuated parasites, resulting in a simplified population structure among the attenuated strains.
Conclusions
This simplified structure includes reduced diversity of the variant erythrocyte surface 1 (ves) multigene family repertoire among attenuated parasites when compared to virulent parental strains, possibly suggesting that overall variance in large protein families such as Variant Erythrocyte Surface Antigens has a critical role in expression of the virulence phenotype. In addition, the results suggest that virulence (or attenuation) mechanisms may not be shared among all populations of parasites at the gene level, but instead may reflect expansion or contraction of the population structure in response to shifting milieus.
Background
Pathogens adapt to maintain selective advantage in their environments. As few environments are themselves stable, pathogen adaptation is a dynamic and continuous process. This principle applies to virulence in which acquisition and loss of virulence is dynamic within a pathogen population, varying with host genetics, host immune status at the individual and population levels, and transmission efficiency. These shifts can be achieved through sexual reproduction where novel recombinations often lead to genome diversity [1]. However, for many multi-stage pathogens, this cannot occur during haploid life stages, and thus, they depend on mutations at the genome level or adopt phenotypic variation as a result of non-mutational mechanisms. Mutations associated with virulence (or attenuation) are frequently documented in eubacteria [2-4] and viruses [5,6]. However, there is a significant gap in our knowledge of virulence-associated gene mutations in protozoa, including pathogens which have a major impact on global public and animal health. With increased emphasis on development and delivery of attenuated vaccines for hemoparasites such as Babesia, Theileria, and Plasmodium spp. [7-9], the ability to predictably and stably attenuate these pathogens would be a significant step toward vaccine implementation.
In this study, we investigated a natural host-apicomplexan pathogen interaction, infection of cattle with Babesia bovis, to investigate virulence loss at the genome level using multiple strains of diverse geographical origin and genetic background. Virulent B. bovis infection results in a clinical syndrome characterized by severe hemolytic anemia, hyperthermia, and a syndrome of neurovirulence clinically and pathophysiologically similar to cerebral malaria [10]. However, through serial in vivo passages of virulent B. bovis in a splenectomized host, the virulence phenotype is gradually lost, and an attenuated B. bovis derivative is obtained. Animals infected with the attenuated derivative do not exhibit neurovirulence, do not require treatment, and are protected upon virulent parental challenge [11]. Reliable derivation of attenuated parasites is the basis for production of B. bovis live vaccine in Babesia endemic countries such as Australia, Israel and Argentina [9,12,13]. Furthermore, attenuated vaccine generated from strains isolated in Australia confer cross protection in cattle in Africa, Latin America and Southeast Asia [11,13], suggesting that immunogens are shared between geographically divergent strains.
In this report, we took advantage of the babesial attenuation procedure to compare coding regions across the complete genomes of distinct B. bovis strain pairs with distinguishable virulence and attenuation phenotypes in the natural host. With one virulent B. bovis genome sequence already published [14], we subsequently sequenced its attenuated derivative and two additional geographically distinct strain pairs using pyrosequencing technology. The results of a comprehensive genome analysis among all three virulent/attenuated strain pairs (six strains) are presented and discussed in the context of dynamic virulence acquisition and loss.
Methods
Three B. bovis virulent and attenuated strain pairs were used in this study. T2Bo_vir is a strain previously isolated in Texas, USA and its genome sequence has been published [14]. T2Bo_att is the attenuated derivative of T2Bo_vir. L17_vir is a virulent field isolate that originated from an infected animal in Salta province, Northwest Argentina. L17_att is the attenuated derivative of L17_vir. T_vir, also referred to as E61, is a virulent isolate that originated from an infected animal in North Queensland, Australia. T_att, also referred to as F100, is the attenuated derivative of T_vir. For comparative analysis, the fully sequenced T2Bo_vir is used as the reference and all the strains used are designated as "test" strains.
Attenuation of virulent B. bovis strains
Attenuation of the T strain (T_att) was achieved through 28 in vivo rapid passages from its original virulent parent, T_vir as previous described [11]. The subsequent attenuated T strain, T_att, was used as a vaccine in Australia between 1991 and 1993 [15].
The L17_att and T2Bo_att strains were also attenuated by rapid passage as described [11] and were evaluated after 24 and 29 in vivo passages, respectively. Before the attenuation procedure, T2Bo_vir and L17_vir strains were passed through non-infected Rhipicephalus microplus ticks to obtain stabilates. Liquid nitrogen preserved stabilates of L17_vir or T2Bo_vir were used to inoculate the first splenectomized calves with 1.2 × 10⁸ parasitized erythrocytes after which the infected blood was collected in heparin (5-10 IU/ml) five days post-infection and transferred intravenously to a second splenectomized calf. Subsequent passages were identical with blood collected and transferred with an average of 5 ± 1 day interval.
Evaluation of attenuated derivatives
Evaluation of the T_att strain has been described [15]. To assess the attenuation of L17_att and T2Bo_att B. bovis strains, 16-month old Holstein steers were subcutaneously inoculated with 107 parasitized erythrocytes of each strain. Briefly, age-matched steers raised in tick-free areas and sero-negative for B. bovis were inoculated with each putatively attenuated strain. The average normal body temperature and hematocrit of each steer were established during three consecutive days immediately before the initiation of the experiment. Daily assessment of the same parameters, as well as parasitemia was carried out between days 6 and 18 after inoculation. Steers were treated any time that hyperthermia > 41.0°C was observed during three consecutive days, hematocrit was < 15%, parasitemia > 0.5%, and/or neurological signs were observed. All animals infected with virulent B. bovis strains (T2Bo and L17) required treatment while those infected with the attenuated derivatives did not (Table 1), confirming the successful attenuation of the virulent L17 and T2Bo strains.
Table 1.
In vivo evaluation of Babesia bovis attenuation
| Inoculated strain | T2Bo_vir | T2Bo_att | L17_vir | L17_att |
|---|---|---|---|---|
| # of animals | 12 | 18 | 12 | 18 |
| Average age of animal (mth) | 16.5 | 15.5 | 17 | 16 |
| # of animals requiring treatment* | 12/12 | 0/18 | 12/12 | 0/18 |
* treatment criteria include one of the following. Hyperthermia > 41°C for 3 consecutive days, percent parasitemia > 0.5%, hematocrit < 15% and neurological signs such as ataxia, excess salivation, head pressing, lateral head torsion and recumbency w/. fully extended head. Vir, virulent phenotype; att, attenuated phenotype; T2Bo, Tex strain; L17, Argentina strain.
Short term in vitro propagation of B. bovis and genomic DNA extraction
T2Bo_vir or _att and L17_vir or _att strains from splenectomized calves were used to establish short term continuous in vitro propagation (< 30 days of culture) as described previously [16,17]. Parasitized erythrocytes of each strain were frozen in liquid nitrogen, cryopreserved with 10% polyvinylpyrolidone (PVP) and stored in liquid nitrogen until use.
T_vir was made from pooled blood from 10 animals from a property called 'Reedy Beds' Tharingowa via Townsville in far North Queensland. This Australian virulent strain was passaged twice in splenectomized calves to generate enough parasitized erythrocytes for gDNA extraction. Short term in vitro culturing was not performed for this strain.
Genomic DNA of B. bovis infected erythrocytes was obtained as previously described [18]. Southern dot blot hybridization was carried on test strain gDNA to ensure that all samples contained < 10% bovine host gDNA contamination (data not shown) prior to pyrosequencing.
Pyrosequencing
The B. bovis gDNA for T2Bo_vir was completely sequenced by a classical method (Sanger shotgun) and contains two small assembly gaps and one physical gap [14]. B. bovis gDNA for the remaining five strains was submitted to the 454 pyrosequencing facility (http://www.454.com) for shotgun sequencing (see Additional file 1, table s1). Briefly, genomic DNA was randomly fragmented into small 300 to 800 bp fragments. Adapters were ligated to the generated fragments, thus creating a library of DNA fragments. These fragments were immobilized onto DNA capture beads and individually sequenced on a PicoTiterPlate device. The average read lengths of T_att, T_vir, L17_att, L17_vir and T2Bo_att were 101 bp, 251 bp, 215 bp, 250 bp and 386 bp, respectively. The generated sequences were then assembled into a number of unordered and unoriented contigs using the GS De Novo Assembler Software resulting in a consensus sequence. For more information on pyrosequencing and the assembly tool, please visit http://www.454.com/applications.
Comparative genomic analyses
Comparative genomics analysis was performed on all six strains using the T2Bo_vir strain as the reference strain and the remaining strains as test strains. Blastn [19] was used to assign contigs to chromosome scaffolds (chromosomes 1-4, apicoplastic, mitochondrial) based on the topmost hits. Ordering and orientation of the contigs in the draft assemblies was achieved by mapping along the T2Bo_vir reference genome. Scaffolded contigs were visualized for manual inspection using the Mauve software package [20,21].
Inter-strain genome comparisons involving two or more genomes from either within or across the virulent and attenuated groups were carried out using the Mauve tool. These genome alignments also served to visualize and quantify the overall quality of the individual draft assemblies for the test strains. A combination of Unix bash and Perl scripts were written to compute genome- and gene-wide coverage of the individual draft assemblies relative to the reference, and to calculate various other measures that relate to the distribution of assembly gaps and the impact of repetitive content (e.g., ves genes) on assembly. These scripts were written specifically for these genomes and will be made freely available upon request.
SNP identification and gene analysis
Consistent polymorphisms within the gene segments of the chromosomes that differentiate the parental virulent from the derived attenuated strains in all three regional pairs were identified. Available sequence analysis programs were used whenever possible, and custom scripts and programs were implemented to automate the pipeline. The steps of the analysis are as follows (also see Figure 1).
Figure 1.
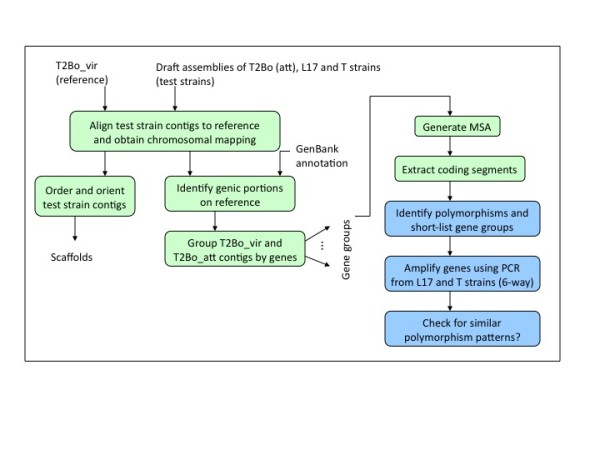
Flowchart for comparative gen-centric (genic) analysis. Green boxes indicate computational steps and blue boxes denote steps that require manual intervention.
Initially, gene boundaries were marked along the T2Bo_vir contigs using available GenBank annotation. Subsequently, the subset of T2Bo_att contigs that mapped to the genic portions of T2Bo_vir were identified and isolated. The coordinates for this mapping information were determined using MUMmer program [22]. This subset was further sub-divided into gene groups (≤ e value of 10-5 as an arbitrary cutoff for gene determination), where contigs mapping to the same gene were binned together. Long contigs mapping to multiple genes, although from different parts, were made as part of each of the corresponding gene groups. After binning, a multiple sequence alignment (MSA) was generated separately for each group using the CAP3 fragment assembly tool [23]. Note that using an MSA would restrict the similarity detection process to full-length sequence at the nucleotide level. This highly sensitive strategy was used deliberately as a means to flag the slightest of differences between the two forms of T2Bo. Automated scripts were written to trim the MSAs of their leading and trailing gaps, following which intronic portions were excised, retaining only the coding segments. Output of MSAs was then manually examined by visual inspection using an alignment program (MacVector, vers.11.1). Two types of polymorphic events were identified during the search process - base substitutions such as single nucleotide polymorphisms (SNPs) and sequence gaps. The latter event could have arisen due to true insertions/deletions (indels) or simply lack of sequence data. A list of candidate genes resulting from the two-way (T2Bo_vir and _att only) comparison was generated for further evaluations. MSA of these genes were subsequently generated for the remaining two strain pairs. Genes that were commonly found to be different between all strain pairs were then selected for re-sequencing.
Separately, SNPs and indels in the different test strains relative to the reference were identified by comparing each of the test strains against the reference using the MUMmer tool and its default parameters and a customized-written script (freely available for download upon request).
Re-sequencing and analysis
Gene specific primers were generated and synthesized (http://idtdna.com) for re-sequencing of the final candidate genes. PCR amplicons of genomic DNA from T2Bo virulent and attenuated strains were used in the comparison to confirm SNPs or indels that were identified in silico between this strain pair. If polymorphisms were detected from this comparison, genomic DNA from L17 and T strain pairs were then used for re-sequencing to determine if the observed polymorphisms were also found in the other strains; thereby making the process into a 6-way comparison. High fidelity Taq (Invitrogen) was used in all re-sequencing to minimize PCR-generated errors. Amplicons were cloned into pCR4.1TOPO (Invitrogen) and multiple clones per PCR were sequenced (WSU Sequencing Core Facility). Sequence analysis was performed using MacVector vers.11.1. All putative protein-coding sequences were included in the analysis except for ves1 gene family (n = 119), BBOV_I002740 and BBOV_IV029790 which encode for variant erythrocyte surface antigens, a 200 kDa antigen and a hypothetical protein, respectively. Repetitive sequences within these genes prohibited accurate alignments for comparison.
Results
Pyrosequencing achieved high genomic coverage of all strains
Pyrosequencing was utilized to sequence the genomes of the test strains. Resulting contigs for each test strain were partitioned based on the sequences (gene groups) from the reference T2Bo_vir strain. This process resulted in a total of 3,671 gene groups in the test strains. The total number of contigs (by chromosome) was the highest for T_vir while T2Bo_att had the lowest number of contigs (Additional file 1, table s2). Overall, the assemblies corresponding to the attenuated strains were of a better quality than the virulent strains of L17 and T, with longer contigs and N50 contig lengths (see Table 2). Genomic and gene coverages of all the five draft assemblies over the T2Bo_vir reference were computed (Table 3). The genomic coverages were high: 93% for T2Bo_att, 90% for L17_vir and _att, 84% for T_vir and 89% for T_att. Importantly, the coverages of the draft assemblies on the gene portion compared to the T2Bo_vir reference were also equally high: of the approximately 4.2 Mbp (52%) of the T2Bo_vir genome that are coding sequences, the contigs of the test strains covered 85% to 88% in the T strains, 90% in the L17 strains and to 93% in the T2Bo_att strain.
Table 2.
Assembly statistics of the five Babesia bovis genomes in comparison to the reference T2Bo_vir
| T2Bo_Vir. | T2Bo_Att. | L17_Vir. | L17_Att. | T_Vir. | T_Att. | |
|---|---|---|---|---|---|---|
| Number of contigs | 14 | 1,397 | 6,520 | 1,168 | 9,449 | 4,049 |
| N50 contig length (bp) | 1,797,577 | 113,852 | 5,452 | 87,856 | 4,772 | 43,696 |
| Longest contig (bp) | 2,593,320 | 366,332 | 358,771 | 288,976 | 64,333 | 298,977 |
| Total contig length (bp) | 8,146,795 | 8,155,482 | 9,099,385 | 7,892,637 | 9,387,722 | 8,020,682 |
T2Bo, Babesia bovis Texas strain; L17, B. bovis Argentinian strain; T, B. bovis Australian strain; vir, virulent; att, attenuated.
Table 3.
Genomic and genic coverages of the five Babesia bovis draft assemblies over the reference T2Bo_vir
| A. Genome-wide coverage | |||
|---|---|---|---|
| Strain | % base coverage by contigs | Total gap length (bp) | Number of gaps |
| T2Bo_att | 93.33% | 545,969 | 277 |
| L17_vir | 90.59% | 769,743 | 1,095 |
| L17_att | 90.53% | 774,280 | 480 |
| T_vir | 84.45% | 1,271,819 | 1,765 |
| T_att | 89.26% | 878,389 | 803 |
| B. Genic coverage | |||
| Strain | % base coverage by contigs | Gap length in genes (bp) | |
| T2Bo_att | 93.00% | 299,288 | |
| L17_vir | 89.79% | 436,406 | |
| L17_att | 89.60% | 444,495 | |
| T_vir | 84.63% | 656,517 | |
| T_att | 88.37% | 496,798 | |
T2Bo, Babesia bovis Texas strain; L17, B. bovis Argentinian strain; T, B. bovis Australian strain; att, attenuated; vir, virulent.
Individual chromosomal coverages were also calculated. Chromosome 4, the largest of all the chromosomes (2.59 Mbp), had the highest genomic coverage among nuclear chromosomes, with each test strain covering on average 94% of the reference strain. In contrast, chromosome 1, the smallest of the nuclear chromosomes (1.19 Mbp), had the lowest coverage with an average of 80% (data not shown) among the test strains. Gene coverage of each test strain by chromosome and the two organelles was also investigated (Table 4). Similar coverage scenarios were obtained with the highest gene coverage for chromosome 4 and lowest for chromosome 1. There was 100% coverage of the mitochondrial genomes for all strains while ~92% coverage of the apicoplast genomes was achieved (Table 4). The overall gene coverage of the T strains (Australian strains) is the lowest while T2Bo_att is the highest. It is important to note that the positioning of the contigs in the test strains was achieved by mapping them along the reference strain, as paired-end sequencing was not done. Therefore, there is not sufficient information in the assembly to fully reconstruct or detect the presence of re-arrangement/recombination events between these strains.
Table 4.
Genic coverage by chromosome of the five Babesia bovis strains over the reference T2Bo_vir
| T2Bo_att | L17_att | T_att | L17_vir | T_vir | (Average % coverage) | |
|---|---|---|---|---|---|---|
| Chr. 1 | 82.22% | 79.17% | 77.82% | 77.98% | 74.22% | 78.28% |
| Chr. 2 | 92.74% | 89.73% | 86.85% | 89.34% | 84.14% | 88.56% |
| Chr. 3 | 94.80% | 90.63% | 89.44% | 91.23% | 84.33% | 90.01% |
| Chr. 4 | 96.30% | 93.23% | 93.13% | 94.06% | 89.94% | 93.33% |
| Mitochondria | 100.00% | 100.00% | 100.00% | 100.00% | 96.93% | 99.39% |
| Apicoplast | 93.91% | 91.04% | 91.97% | 90.70% | 90.60% | 91.64% |
T2Bo, Babesia bovis Texas strain; L17, B. bovis Argentinian strain; T, B. bovis Australian strain; att, attenuated; vir, virulent.
Sequence divergence decreases with attenuation
Chromosomal alignments of all virulent or attenuated strains were plotted to investigate the degree of similarity within each group (virulent vs. attenuated). Figure 2 illustrates the consensus alignments of the virulent and attenuated strains on each chromosome. Chromosome 4 and 1 are the most conserved and divergent chromosomes of all B. bovis virulent strains at the nucleotide level, respectively (Figure 2A). Each gap represents genomic regions that are missing in at least one of the strains, while the colored blocks denote conserved sections that are present in all virulent strains. In contrast to the virulent strains, the attenuated strains contain fewer gaps in each of the four chromosomes, suggesting a higher degree of sequence conservation among all the attenuated strains (Figure 2B). As observed in the virulent strain comparison, sequences on chromosome 4 are the most conserved among attenuated strains while the larger gap lengths in chromosome 1 illustrate the potential diversity of this chromosome among the three attenuated B. bovis strains. Figures 3 and 4 are individual virulent genome alignments by chromosome with T2Bo_vir reference, illustrating that the gaps as a result to missing sequences are different in locations for both L17_vir and T_vir as compared with the reference strain. Notably, the overall similarity at the nucleotide level (coding and non-coding) among the attenuated strains was observed to be considerably higher (81%) than among the virulent strains (60%) (Figure 5). This analysis also illustrates that the number of strain-specific ("unique") sequences decreases with attenuation.
Figure 2.
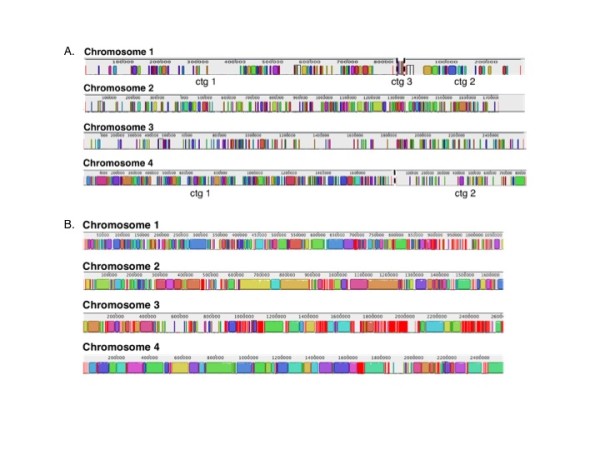
Global chromosomal consensus alignments between all virulent (A) and attenuated (B) strains of T2Bo, L17 and T virulent. Chromosomes are not drawn to scale. Color blocks represents individual assembled contigs. Gaps on chromosomes represent sequences that are missing in at least one of the strains in the corresponding group. Smaller contigs (ctg) on chromosome 1 (n = 5) are omitted for the virulent strain alignments.
Figure 3.
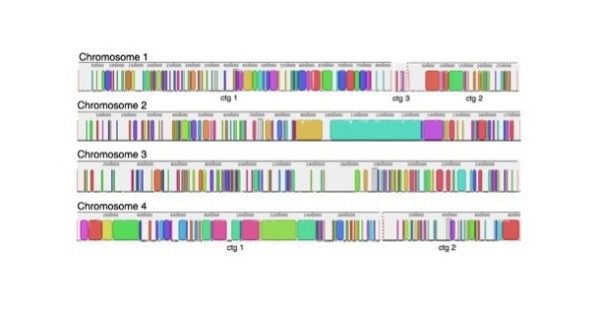
Chromosomal alignments between the reference virulent strain, T2Bo_vir and L17_vir. Chromosomes are not drawn to scale. Color blocks represents individual assembled contigs. Gaps on chromosomes represent sequences that are missing in at least one of the strains in the corresponding group. Smaller contigs (ctg) on chromosome 1 (n = 5) are omitted for the virulent strain alignments.
Figure 4.
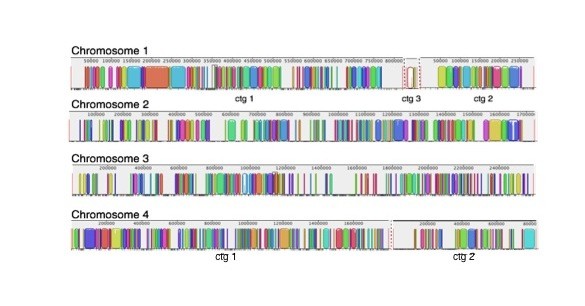
Chromosomal alignments between reference virulent strain, T2Bo_vir and T_vir. Chromosomes are not drawn to scale. Color blocks represents individual assembled contigs. Gaps on chromosomes represent sequences that are missing in at least one of the strains in the corresponding group. Smaller contigs (ctg) on chromosome 1 (n = 5) are omitted for the virulent strain alignments.
Figure 5.
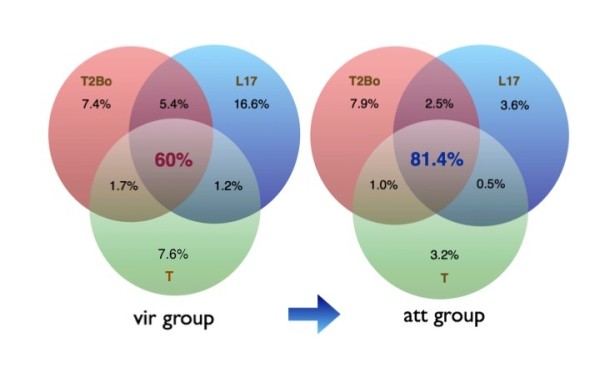
Whole genome comparison between all three strains. Pink, blue and green regions are strain-specific sequences of T2Bo, L17 and T strains, respectively. Overlapping area in the center of each Venn diagram represents nucleotide sequences (coding and non-coding) that are shared among all virulent or attenuated strains. Areas shaded in pink, blue and green are strain-specific nucleotide sequences found in T2Bo, L17 and T strains, respectively. Both Venn diagrams are not drawn to scale.
To further investigate the contents of the unique portions of these genomes, genomic contig sequences specific to each strain among the three virulent (or three attenuated) group of genomes were first identified. Such sequences were labeled as "strain-specific" and are shown to occupy the pink, blue and green regions of the Venn diagrams (Figure 5). The number of bases covered by strain-specific sequences (genic and non-genic) is decreased by 35% in the virulent group when compared to the attenuated group (3.64 Mbp to 1.28 Mbp). In order to identify genes that are represented within the strain-specific contigs of the genomes, these sequences were blasted (using blastx) against the NCBI GenBank NR database and alignment hits that spanned more than 100 amino acids and an e-value score ≤ 0.05, were reported. This filtering process reduced the total strain-specific contig sizes to 1.41 Mbp in the virulent group, and 597 Kbp in the attenuated group (data not shown). The strain-specific coding sequences were further partitioned into ves and non-ves genes. Interestingly, 70% of virulent strain-specific gene bases were ves-associated (Figure 6). The remaining non-ves strain-specific sequences encoded mostly genes for hypothetical genes (> 60%) and for, but not limited to, translation and membrane proteins (Figure 7). Among all the virulent strain-specific ves genes (n = 372), 45% are retained in the attenuated strains, which translates into 97% of the strain-specific ves in the attenuated strains that are retained from the virulent population (Figure 6B). Only 3% of all strain-specific ves genes are found exclusively in attenuated strains (Figure 6B). In comparison to 45% of virulent strain-specific ves that are retained in the attenuated population, only 3% of strain-specific non-ves genes from the virulent group are carried over to the attenuated strains (Figure 6B). Energy production-related genes are among those present in the attenuated strain-specific non-ves genes that are not detected in the virulent group (Figure 7). The ves: non-ves ratio of roughly 2:1 for the virulent group changed with attenuation to approximately 6:1, consistent with great reduction of non-ves diversity generated through attenuation.
Figure 6.
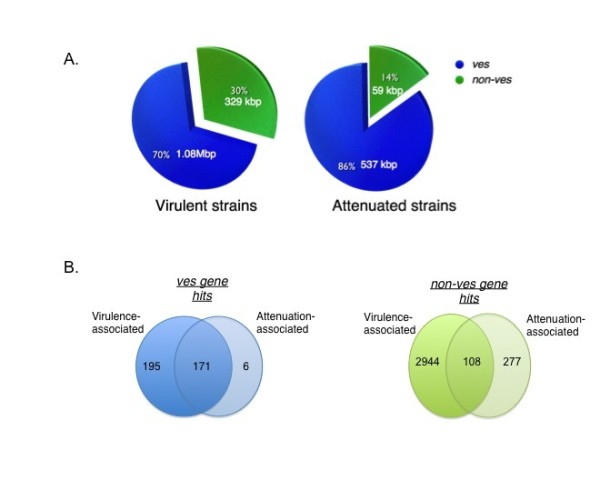
Distribution of strain-specific sequences between virulent and attenuated groups. Strain-specific sequences can be classified into ves (blue) and non-ves (green) gene families and (B) total number of strain-specific ves and non-ves gene hits in the virulent and attenuated groups.
Figure 7.
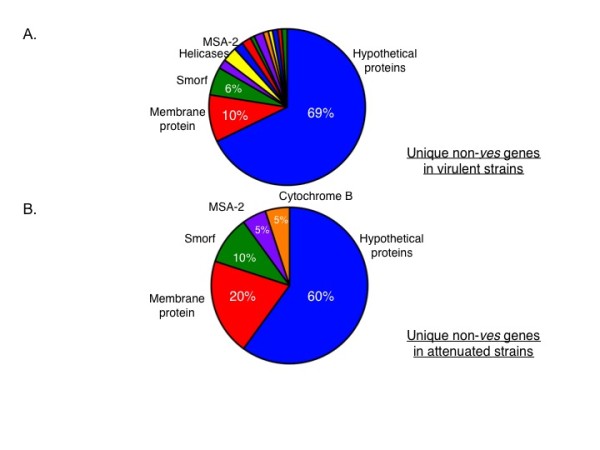
Functional assignments of strain-specific non-ves genes in the virulent (A) and attenuated (B) populations. Colored sections within each pie represent different gene families and only those > 5% of the total are labeled.
Single nucleotide polymorphism (SNP) analysis was conducted between the reference, T2Bo_vir strain and each of the five test strains at the genome level. As shown in Figure 8, transitions (purine to purine) were more commonly detected than transversions (purine to pyrimidine). Within the transversion subgroups, both T strains have a higher number of transversions than the T2Bo_att and L17 strain pairs. A similar pattern was observed when insertion and deletion (indel) analysis was performed (Figure 9). While it was observed that chromosome 3 consistently contains a greater number of SNPs and indels than chromosomes 1, 2 and 4 in all the test strains (Figure 7) when these numbers were normalized to the number of genes in each chromosome or the size of the chromosomes, the disproportionate higher incidence of SNPs and indels observed on chromosome 3 is no longer present (data not shown).
Figure 8.
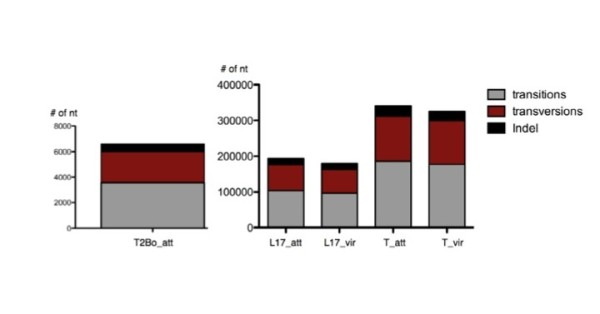
Distribution of transversions (crimson), transitions (grey), insertions and deletions (Indel) (black) in the five Babesia bovis genomes as compared to the reference strain.
Figure 9.
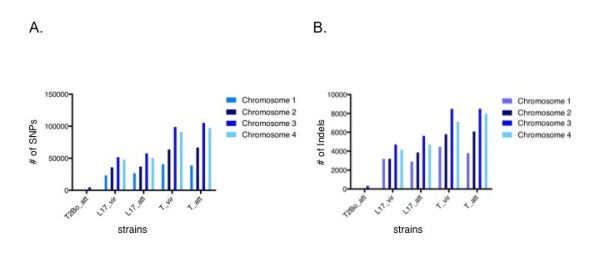
Total number of single nucleotide polymorphisms (SNPs) (A) and insertions and deletions (Indel) and (B) by chromosome of all test strains in comparison to the reference, T2Bo_vir.
No common gene differences are shared among all virulent or attenuated strain pairs
In order to identify common gene differences between all virulent and all attenuated strains, MSA was performed initially between T2Bo_vir reference and T2Bo_att to generate a list of genes with either nucleotide differences or simply the absence of any MSA output between this parent-offspring pair. A total of 226 genes were identified for further investigation (data not shown). Members of this gene list were used to generate MSA between L17_vir and L17_att and T_vir and T_att. A second gene list comprising gene differences shared among the three strain pairs resulted (Additional file 1, table s3). Out of these 14 genes, half of these have annotational information while the remaining genes encode for hypothetical proteins. However, re-sequencing of all 14 genes showed that although common polymorphisms were found between all attenuated/virulent strain pairs, these polymorphisms were insignificant in the translated products using SIFT [24].
Discussion
The ability to predictably attenuate B. bovis by multiple passages through splenectomized cattle has been used in Babesia endemic regions to produce the only available vaccine that can protect animals from severe clinical disease [11,25]. The attenuated parasites are infectious but do not cause clinical disease requiring treatment. A similar loss of virulence has been reported in related organisms such as Theileria, Toxoplasma and Plasmodium [26-28]. We took advantage of this attenuation model system to perform whole genome comparison of three different B. bovis virulent parent and attenuated daughter strain pairs. Our initial focus was to identify gene changes shared among all attenuated strains in an effort to determine if there was a common pathway to attenuation.
Pyrosequencing technology [29] enabled us to achieve high genome coverage for all the B. bovis test strains (n = 5), with the highest coverage for T2Bo_att, followed by L17 and T strains (Table 3). The quality of the assembly varied from strain to strain. Most notably the N50 contig length was considerably less for the virulent strains (L17_vir and T_vir) than their attenuated counterparts (L17_att and T_att) (Table 2), indicating that the assembly for the virulent forms of these two strains was more fragmented despite the higher depth used in sequencing the virulent parasites (see Additional file 1, table s1). This result is most likely a manifestation of the high level of sequence diversity among the virulent population - i.e., reads emerging from a diverse population are less likely to collapse into long contigs during assembly. Despite the difficulties in assembly encountered in virulent strains, the study was not negatively impacted since genomic coverage of these strains was still substantially high (> 84%) when aligned over the T2Bo_vir reference genome.
Comparison of shared sequences between the three strain pairs showed that there are more shared sequences between the North and South American strains (L17 and T2Bo) (Figure 5). This suggests that L17 and T2Bo are genetically more closely related to each other than to the Australian T strain. More SNPs were identified in both T strains when the orthologues were compared to those in L17 and T2Bo. Many of these SNPs, nonetheless, were synonymous changes. However, this observation suggests that the codon usage is similar between L17 and T2Bo. The greater level of T strain sequence diversity compared to the reference strain may contribute to increased difficulty in recognizing orthologues to the reference genes using our stringent gene identification criteria, subsequently resulting in more and larger sequence gaps.
When genomic- and genic-wide coverages by chromosome (Table 3) in all strains were computed, irrespective of the quality of the coverage, chromosomes 1 and 4 consistently had the poorest and best coverage, respectively. A noticeable difference between these two chromosomes is the distribution of variant erythrocyte surface 1 (ves) gene family members. The ves gene family is the largest gene family in the B. bovis (T2Bo strain) genome and contains multiple repeat sequences [10,14]. Chromosome 1 has the highest number of known ves, with at least 42 of the 119 total ves in the genome, representing ~16% of the total gene content of chromosome 1. By contrast, only ~3% of the total gene content of chromosome 4 is comprised of ves. Since pyrosequencing is not typically suited to repetitive regions [30], this could explain the lower gene coverage observed in the assembly of chromosome 1 when compared to chromosome 4 (Table 4). To validate this hypothesis, we mapped all the ves locations in the two chromosomes onto the contigs and investigated if they were located within the gap regions. First, we observed that a high percentage (> 84%) of the ves gene bases fall into assembly gaps consistently across all chromosomes, reflecting the high complexity inherent in sequencing the ves gene family. Next, we compared the distribution of the assembly gaps to ves and non-ves regions in chromosome 1 and 4. Analysis showed that 46% of the gaps in chromosome 1 are attributable to ves genes while the remaining 54% include non-ves genes, intergenic and intronic regions. In contrast, only 21% of the gaps in chromosome 4 are attributable to ves (data not shown). These data support our conclusion that the poor coverage of chromosome 1 in the virulent strains as compared to chromosome 4 is due to the clustering of ves.
The total number of strain-specific sequences in each virulent strain is greater than that of the attenuated strains (Figure 5), explaining in part why there are more gaps in the consensus chromosomal alignments among the virulent strains (Figure 2A). Approximately 60% of the sequences are shared among all virulent strains and 81% among the attenuated strains. This is not a simple artifact of comparing sequences obtained by different techniques, as comparison of the L17_vir and T_vir strains, both of which were pyrosequenced, resulted in the same significant gap differences when compared to the attenuated strains. This reduced diversity in strain-specific sequences may be attributed to a change in population structure during the attenuation process, resulting in a simplified or more uniform attenuated population. Evidence of a similar phenomenon has been reported in Theileria and Plasmodium [28,31]. However, our study is the first demonstration of the change in population structure at the whole genome level. Among the strain-specific gene sequences, ves predominates in both the virulent and attenuated strains (Figure 6A). Interestingly, 97% of the total strain-specific attenuation-associated ves genes are also present in at least one virulent strain (Figure 6B), suggesting that the attenuation process did not select either or against a specific repertoire or for a unique repertoire of variant genes. Due to their polymorphic nature and repetitive sequences as well as a physical gap of approximately 150 kbp containing ves genes in chromosome 1 of the T2Bo_vir genome sequence, members of this gene family were not individually analyzed in our study. Nonetheless, results from the analysis of the strain-specific ves gene sequences between virulent and attenuated strains imply that there is likely considerable overlap of the known ves repertoire between the virulent parent and its attenuated derivative. This may account for the ability of the attenuated parasites to protect against clinical disease caused by virulent strains after only one infection cycle. In contrast, multiple clinical infections are typically required to generate clinical immune protection against P. falciparum infection [32,33], possibly reflecting the more diverse repertoire of variant genes such as var (encoding PfEMP1) among virulent isolates [34].
Analysis of non-ves1 strain-specific gene sequences between virulent and attenuated strains also showed a significant decrease in the number of strain-specific sequences as a result of attenuation. Approximately 60% of these strain-specific non-ves sequences are of unknown function while the remainder in both virulent and attenuated groups includes membrane proteins, merozoite surface antigen-2 and small open reading frames (smorfs) (Figure 7). Non-ves strain-specific sequences in virulent strains also include genes not found in the attenuated non-ves unique sequences group. This suggests that some genes uniquely present in the virulent strains are selected against during the attenuation process, while others are enriched.
There were few non-synonymous differences between coding sequences in all three strain pairs which might account for the shared phenotypic characteristics of virulence or attenuation as all non-synonymous changes resulted in tolerated translated products. This may imply that virulence may be multigenic, involving more than one gene in different strains and depending on the strain, may involve different genes, all belonging to the same pathway. Attenuation may also result from selection of a subpopulation whose virulence factors fail to reach a threshold expression level for virulence, such a mechanism has been reported by Colinet et al. [35] for Leptopilina boulardi, a parasitic wasp of Drosophila melanogaster.
Our comparative data indicate that ves gene members are repeatedly the dominant strain-specific sequences for each strain. Ves is 70% and 86% of the total strain-specific sequences in the virulent and attenuated groups, respectively. As attenuation was achieved, however, the number of the strain-specific ves sequence decreased. An attractive hypothesis based on the observation of population-based ves gene complexity is that virulence is associated with a unique repertoire of VESA proteins expressed on the infected erythrocyte surface. This is consistent with the mechanism used to generate attenuation. Rapid passage of parasites in cattle without a spleen may result in selection of a non-cytoadherent population that would normally be cleared in spleen intact animals, while cytoadherent parasitized erythrocytes sequester in tissue capillaries. Thus, the small percentage loss of certain ves genes may be responsible for the phenotypic difference between the virulent and attenuated strain pairs. However, an equally plausible hypothesis of attenuation mechanism can be due to the reduction of strain-specific non-ves genes. The reduction of approximately half of all strain-specific non-ves genes post-attenuation is remarkable. Lastly, phenotypic changes exhibited in the infected host may be controlled at the transcriptional or protein level. While non-synonymous polymorphisms were predicted to result in tolerated changes, synonymous single nucleotide polymorphisms differentiating virulent and attenuated parasites in all three strain pairs were also found among the 14 genes. It is plausible that synonymous nucleotide changes may play a role in virulence phenotype, although the mechanism of such is currently unknown.
Conclusions
In summary, this study surveyed and compared genomes of three genetically related B. bovis strain pairs of diverse geographical background and with distinct differences in the ability to cause severe clinical disease (virulence). Common virulence factor(s) at the gene level were not consistently found among all virulent B. bovis strains or their attenuated derivatives. However, the virulent parasite population gene pool was significantly more complex than in attenuated B. bovis parasites. Gene complexity was a result of diversity in both a multi-copy variant gene family and multiple single copy genes. Thus, while there were no common genes consistently associated with attenuation or virulence in these related strain pairs, the distinct and reproducible phenotype of the attenuated derivatives in infected animals may be a result of contraction of virulence-associated genes of varying function during the passage of parasites in the natural host. Virulence mechanisms may also be associated with differences at the transcriptional or protein level, including the ves repertoire, or variations in intergenic or intronic regions [31]. For instance, Iyer et al. recently showed that increased expression of a rhoptry protein in a rodent malaria, P. yoelii (py235), resulted in the invasion of a wider range of erythrocytes and thus, greater virulence [36]. Alternatively, virulence may be achieved by various means such as epigenetic factors, all of which contribute to the overall phenotype exhibited in infected host [37,38].
The complete genomic sequences for the five test strains are available at http://www.eecs.wsu.edu/~ananth/WSU_B-bovis_RawData.
Authors' contributions
All authors read and approved the final manuscript. AOTL contributed to the design, data analyses and drafting of the manuscript while AK contributed to data analyses and drafting of the manuscript. MJP contributed to the generation of the re-sequencing data. MK contributed to the analysis of the in silico data. IE and MBF were responsible for the generation and validation of two virulent and attenuated strain pairs (L17 and T2Bo). RB and TIF generated and validated the virulent and attenuated T strain pair. GHP and TFM contributed to the design of the experiments and preparation of the manuscript.
Supplementary Material
Table s1 Sequencing related information for the Babesia bovis strains. Additional sequencing information showing the coverages of the six B. bovis genomes. Each genome coverage is calculated relative to the size of the T2Bo_vir genome as the reference, which is 8.3 Mbp. Table s2. Contig distribution by chromosome of the three Babesia bovis strain pairs. This table illustrates the total number of assembled contigs of each genome and their chromosomal distributions of the six B. bovis strains. Table s3. List of candidate genes for re-sequencing. Candidate genes that required re-sequencing after comparative gene analysis among all six B. bovis strains was completed.
Contributor Information
Audrey OT Lau, Email: laua@vetmed.wsu.edu.
Ananth Kalyanaraman, Email: ananth@eecs.wsu.edu.
Ignacio Echaide, Email: iechaide@fibertel.com.ar.
Guy H Palmer, Email: gpalmer@vetmed.wsu.edu.
Russell Bock, Email: russell.Bock@dpi.qld.gov.au.
Monica J Pedroni, Email: mpedroni@vetmed.wsu.edu.
Meenakshi Rameshkumar, Email: meena.rameshkumar@wsu.edu.
Mariano B Ferreira, Email: mferreira@fibertel.com.ar.
Taryn I Fletcher, Email: tarynfletcher@hotmail.com.
Terry F McElwain, Email: tfm@vetmed.wsu.edu.
Acknowledgements
We thank Ms. Xiaoya Cheng of Washington State University for performing Southern blot analysis on all genomic DNA samples prior to sequencing and Dr. Kelly Brayton for input on the manuscript. This work is partially funded by the Wellcome Trust GRO075800M (GHP, TFM, AOTL, IE, MBF), USDA-ARS Specific Cooperative Agreement #58-5348-7-528 (TFM), Washington State University, College of Veterinary Medicine intramural grant (AOTL), TCP INTA EEA Rafaela-Asociación Cooperadora 426100 (IE) and National Science Foundation #IIS 0916463 (AK).
References
- Taylor HM, Kyes SA, Newbold CI. Var gene diversity in Plasmodium falciparum is generated by frequent recombination events. Mol Biochem Parasitol. 2000;110(2):391–397. doi: 10.1016/S0166-6851(00)00286-3. [DOI] [PubMed] [Google Scholar]
- Rosenberg SM. Mutation for survival. Curr Opin Genet Dev. 1997;7(6):829–834. doi: 10.1016/S0959-437X(97)80047-0. [DOI] [PubMed] [Google Scholar]
- Taddei F, Matic I, Godelle B, Radman M. To be a mutator, or how pathogenic and commensal bacteria can evolve rapidly. Trends Microbiol. 1997;5(11):427–428. doi: 10.1016/S0966-842X(97)01157-8. discussion 428-429. [DOI] [PubMed] [Google Scholar]
- Taddei F, Radman M, Maynard-Smith J, Toupance B, Gouyon PH, Godelle B. Role of mutator alleles in adaptive evolution. Nature. 1997;387(6634):700–702. doi: 10.1038/42696. [DOI] [PubMed] [Google Scholar]
- Ping J, Dankar SK, Forbes NE, Keleta L, Zhou Y, Tyler S, Brown EG. PB2 and HA Mutations are Major Determinants of Host Range and Virulence in Mouse-Adapted Influenza A Virus. J Virol. [DOI] [PMC free article] [PubMed]
- Engel AR, Rumyantsev AA, Maximova OA, Speicher JM, Heiss B, Murphy BR, Pletnev AG. The neurovirulence and neuroinvasiveness of chimeric tick-borne encephalitis/dengue virus can be attenuated by introducing defined mutations into the envelope and NS5 protein genes and the 3' non-coding region of the genome. Virology. pp. 243–252. [DOI] [PMC free article] [PubMed]
- Darghouth MA. Review on the experience with live attenuated vaccines against tropical theileriosis in Tunisia: considerations for the present and implications for the future. Vaccine. 2008;26(Suppl 6):G4–G10. doi: 10.1016/j.vaccine.2008.09.065. [DOI] [PubMed] [Google Scholar]
- Druilhe P, Barnwell JW. Pre-erythrocytic stage malaria vaccines: time for a change in path. Curr Opin Microbiol. 2007;10(4):371–378. doi: 10.1016/j.mib.2007.07.009. [DOI] [PubMed] [Google Scholar]
- Florin-Christensen M, Schnittger L, Dominguez M, Mesplet M, Rodriguez A, Ferreri L, Asenzo G, Wilkowsky S, Farber M, Echaide I. et al. Search for Babesia bovis vaccine candidates. Parassitologia. 2007;49(Suppl 1):9–12. [PubMed] [Google Scholar]
- Allred DR. Antigenic variation in Babesia bovis: how similar is it to that in Plasmodium falciparum? Ann Trop Med Parasitol. 1998;92(4):461–472. doi: 10.1080/00034989859438. [DOI] [PubMed] [Google Scholar]
- Shkap V, de Vos AJ, Zweygarth E, Jongejan F. Attenuated vaccines for tropical theileriosis, babesiosis and heartwater: the continuing necessity. Trends Parasitol. 2007;23(9):420–426. doi: 10.1016/j.pt.2007.07.003. [DOI] [PubMed] [Google Scholar]
- Shkap V, Leibovitz B, Krigel Y, Hammerschlag J, Marcovics A, Fish L, Molad T, Savitsky I, Mazuz M. Vaccination of older Bos taurus bulls against bovine babesiosis. Vet Parasitol. 2005;129(3-4):235–242. doi: 10.1016/j.vetpar.2005.01.013. [DOI] [PubMed] [Google Scholar]
- Bock RE, de Vos AJ. Immunity following use of Australian tick fever vaccine: a review of the evidence. Aust Vet J. 2001;79(12):832–839. doi: 10.1111/j.1751-0813.2001.tb10931.x. [DOI] [PubMed] [Google Scholar]
- Brayton KA, Lau AO, Herndon DR, Hannick L, Kappmeyer LS, Berens SJ, Bidwell SL, Brown WC, Crabtree J, Fadrosh D. et al. Genome sequence of Babesia bovis and comparative analysis of apicomplexan hemoprotozoa. PLoS Pathog. 2007;3(10):1401–1413. doi: 10.1371/journal.ppat.0030148. [DOI] [PMC free article] [PubMed] [Google Scholar]
- Bock RE, de Vos AJ, Lew A, Kingston TG, Fraser IR. Studies on failure of T strain live Babesia bovis vaccine. Aust Vet J. 1995;72(8):296–300. doi: 10.1111/j.1751-0813.1995.tb03558.x. [DOI] [PubMed] [Google Scholar]
- Levy MG, Ristic M. Babesia bovis: continuous cultivation in a microaerophilous stationary phase culture. Science. 1980;207(4436):1218–1220. doi: 10.1126/science.7355284. [DOI] [PubMed] [Google Scholar]
- Hines SA, McElwain TF, Buening GM, Palmer GH. Molecular characterization of Babesia bovis merozoite surface proteins bearing epitopes immunodominant in protected cattle. Mol Biochem Parasitol. 1989;37(1):1–9. doi: 10.1016/0166-6851(89)90096-0. [DOI] [PubMed] [Google Scholar]
- Lau AO, Cereceres K, Palmer GH, Fretwell DL, Pedroni MJ, Mosqueda J, McElwain TF. Genotypic diversity of merozoite surface antigen 1 of Babesia bovis within an endemic population. Mol Biochem Parasitol. 2010;172(2):107–112. doi: 10.1016/j.molbiopara.2010.03.017. [DOI] [PMC free article] [PubMed] [Google Scholar]
- Altschul SF, Gish W, Miller W, Myers EW, Lipman DJ. Basic local alignment search tool. J Mol Biol. 1990;215(3):403–410. doi: 10.1016/S0022-2836(05)80360-2. [DOI] [PubMed] [Google Scholar]
- Rissman AI, Mau B, Biehl BS, Darling AE, Glasner JD, Perna NT. Reordering contigs of draft genomes using the Mauve aligner. Bioinformatics. 2009;25(16):2071–2073. doi: 10.1093/bioinformatics/btp356. [DOI] [PMC free article] [PubMed] [Google Scholar]
- Darling AC, Mau B, Blattner FR, Perna NT. Mauve: multiple alignment of conserved genomic sequence with rearrangements. Genome Res. 2004;14(7):1394–1403. doi: 10.1101/gr.2289704. [DOI] [PMC free article] [PubMed] [Google Scholar]
- Delcher AL, Phillippy A, Carlton J, Salzberg SL. Fast algorithms for large-scale genome alignment and comparison. Nucleic Acids Res. 2002;30(11):2478–2483. doi: 10.1093/nar/30.11.2478. [DOI] [PMC free article] [PubMed] [Google Scholar]
- Huang X, Madan A. CAP3: A DNA sequence assembly program. Genome Res. 1999;9(9):868–877. doi: 10.1101/gr.9.9.868. [DOI] [PMC free article] [PubMed] [Google Scholar]
- Ng PC, Henikoff S. Predicting deleterious amino acid substitutions. Genome Res. 2001;11(5):863–874. doi: 10.1101/gr.176601. [DOI] [PMC free article] [PubMed] [Google Scholar]
- Mangold AJ, Vanzini VR, Echaide IE, de Echaide ST, Volpogni MM, Guglielmone AA. Viability after thawing and dilution of simultaneously cryopreserved vaccinal Babesia bovis and Babesia bigemina strains cultured in vitro. Vet Parasitol. 1996;61(3-4):345–348. doi: 10.1016/0304-4017(95)00839-X. [DOI] [PubMed] [Google Scholar]
- Somerville RP, Littlebury P, Pipano E, Brown CG, Shkap V, Adamson RE, Oliver RA, Glass EJ, Hall FR. Phenotypic and genotypic alterations associated with the attenuation of a Theileria annulata vaccine cell line from Turkey. Vaccine. 1998;16(6):569–575. doi: 10.1016/S0264-410X(97)84509-4. [DOI] [PubMed] [Google Scholar]
- Yano K, Nakabayashi T. Attenuation of the virulent RH strain of Toxoplasma gondii by passages in mice immunized with Toxoplasma lysate antigens. Biken J. 1986;29(2):31–37. [PubMed] [Google Scholar]
- Schmidt LH, Fradkin R, Sesler C, Squires W, Zeyen P. Attenuation of the virulence of the M strain of Plasmodium cynomolgi during prolonged multiplication in splenectomized rhesus monkeys. Am J Trop Med Hyg. 1987;37(3):460–490. doi: 10.4269/ajtmh.1987.37.460. [DOI] [PubMed] [Google Scholar]
- Van Schaik W, Top J, Riley DR, Boekhorst J, Vrijenhoek JE, Schapendonk CM, Hendrickx AP, Nijman IJ, Bonten MJ, Tettelin H, Pyrosequencing-based comparative genome analysis of the nosocomial pathogen Enterococcus faecium and identification of a large transferable pathogenicity island. BMC Genomics. p. 239. [DOI] [PMC free article] [PubMed]
- Tauch A, Schneider J, Szczepanowski R, Tilker A, Viehoever P, Gartemann KH, Arnold W, Blom J, Brinkrolf K, Brune I. et al. Ultrafast pyrosequencing of Corynebacterium kroppenstedtii DSM44385 revealed insights into the physiology of a lipophilic corynebacterium that lacks mycolic acids. J Biotechnol. 2008;136(1-2):22–30. doi: 10.1016/j.jbiotec.2008.03.004. [DOI] [PubMed] [Google Scholar]
- Hall R, Ilhan T, Kirvar E, Wilkie G, Preston PM, Darghouth M, Somerville R, Adamson R. Mechanism(s) of attenuation of Theileria annulata vaccine cell lines. Trop Med Int Health. 1999;4(9):A78–84. doi: 10.1046/j.1365-3156.1999.00454.x. [DOI] [PubMed] [Google Scholar]
- Doolan DL, Dobano C, Baird JK. Acquired immunity to malaria. Clin Microbiol Rev. 2009;22(1):13–36. doi: 10.1128/CMR.00025-08. Table of Contents. [DOI] [PMC free article] [PubMed] [Google Scholar]
- Langhorne J, Ndungu FM, Sponaas AM, Marsh K. Immunity to malaria: more questions than answers. Nat Immunol. 2008;9(7):725–732. doi: 10.1038/ni.f.205. [DOI] [PubMed] [Google Scholar]
- Rask TS, Hansen DA, Theander TG, Gorm Pedersen A, Lavstsen T. Plasmodium falciparum erythrocyte membrane protein 1 diversity in seven genomes--divide and conquer. PLoS Comput Biol. 2010;6(9) doi: 10.1371/journal.pcbi.1000933. [DOI] [PMC free article] [PubMed] [Google Scholar]
- Colinet D, Schmitz A, Cazes D, Gatti JL, Poirie M. The origin of intraspecific variation of virulence in an eukaryotic immune suppressive parasite. PLoS Pathog. p. e1001206. [DOI] [PMC free article] [PubMed]
- Iyer JK, Amaladoss A, Genesan S, Preiser PR. Variable expression of the 235 kDa rhoptry protein of Plasmodium yoelii mediate host cell adaptation and immune evasion. Mol Microbiol. 2007;65(2):333–346. doi: 10.1111/j.1365-2958.2007.05786.x. [DOI] [PubMed] [Google Scholar]
- May FJ, Li L, Davis CT, Galbraith SE, Barrett AD. Multiple pathways to the attenuation of West Nile virus in South-East Texas in 2003. Virology. 2010;405(1):8–14. doi: 10.1016/j.virol.2010.04.022. [DOI] [PMC free article] [PubMed] [Google Scholar]
- Broadbent K, Park D, Wolf AR, Van Tyne D, Sims JS, Ribacke U, Volkman S, Duraisingh M, Wirth D, Sabeti PC, A global transcriptional analysis of Plasmodium falciparum malaria reveals a novel family of telomere-associated lncRNAs. Genome Biol. p. R56. [DOI] [PMC free article] [PubMed]
Associated Data
This section collects any data citations, data availability statements, or supplementary materials included in this article.
Supplementary Materials
Table s1 Sequencing related information for the Babesia bovis strains. Additional sequencing information showing the coverages of the six B. bovis genomes. Each genome coverage is calculated relative to the size of the T2Bo_vir genome as the reference, which is 8.3 Mbp. Table s2. Contig distribution by chromosome of the three Babesia bovis strain pairs. This table illustrates the total number of assembled contigs of each genome and their chromosomal distributions of the six B. bovis strains. Table s3. List of candidate genes for re-sequencing. Candidate genes that required re-sequencing after comparative gene analysis among all six B. bovis strains was completed.


