Abstract
Summary:In vivo dynamic contrast-enhanced imaging tools provide non-invasive methods for analyzing various functional changes associated with disease initiation, progression and responses to therapy. The quantitative application of these tools has been hindered by its inability to accurately resolve and characterize targeted tissues due to spatially mixed tissue heterogeneity. Convex Analysis of Mixtures – Compartment Modeling (CAM-CM) signal deconvolution tool has been developed to automatically identify pure-volume pixels located at the corners of the clustered pixel time series scatter simplex and subsequently estimate tissue-specific pharmacokinetic parameters. CAM-CM can dissect complex tissues into regions with differential tracer kinetics at pixel-wise resolution and provide a systems biology tool for defining imaging signatures predictive of phenotypes.
Availability: The MATLAB source code can be downloaded at the authors′ website www.cbil.ece.vt.edu/software.htm
Contact: yuewang@vt.edu
Supplementary information: Supplementary data are available at Bioinformatics online.
1 INTRODUCTION
In vivo dynamic contrast-enhanced imaging tools provide non-invasive methods for analyzing various functional changes associated with disease initiation, progression and responses to therapy (McDonald and Choyke, 2003). Typical modalities include dynamic contrast-enhanced magnetic resonance imaging (DCE-MRI) (Costouros et al., 2002), dynamic contrast-enhanced optical imaging (Hillman et al., 2007), positron emission tomography (Zhou et al., 1997) and spectroscopic computed tomography (Anderson et al., 2010). These tools exploit the dynamics of contrast accumulation and washout to produce functionally relevant images of vascular perfusion and permeability, metabolism or gene expression, and can potentially test novel hypotheses and predict drug efficacy.
However, due to spatially mixed tissue heterogeneity, the precise imaging-based phenotyping by these tools has been hindered by its inability to accurately resolve and characterize targeted functional tissue compartments (Hillman and Moore, 2007). This indistinction between contributions of different tissues to the mixed tracer signals could significantly confound subsequent pharmacokinetics compartmental modeling (CM) (Zhou et al., 1997) and affect the accuracy of genotype–phenotype association studies (Costouros et al., 2002; Segal et al., 2007).
We developed convex analysis of mixtures – compartment modeling (CAM-CM) signal deconvolution tool that enables geometrically principled, unsupervised and accurate characterization and delineation of major functional tissue structures from dynamic contrast-enhanced imaging data, not only dissecting complex tissue into regions with differential tracer kinetics at pixel-wise resolution, but also substantially improving tissue-specific pharmacokinetic parameter estimation (Wang et al., 2010). CAM-CM is supported by a well-grounded mathematical framework, and combines the advantages of multivariate clustering, convex geometry analysis and compartmental modeling. The algorithm possesses a novel, powerful feature allowing pure-volume pixels to be readily identified from the measured pixel time series, without any knowledge of the associated compartmental pharmacokinetics, leading to a completely unsupervised approach. We provide CAM-CM software as an open-source standalone Matlab application.
2 DESCRIPTION
2.1 Method and software
Under the framework of compartment modeling in dynamic contrast-enhanced imaging studies, the spatial-temporal signals x(i,t) of tracer concentration at pixel i can be expressed as a non-negative linear combination of the latent tissue-specific compartmental time activity curves aj(t), weighted by the relative tissue type proportions Kj(i) at that pixel: x(i,t)=at1(t)K1(i)+···+aj(t)Kj(i)+···+aJ(t)KJ(i), where J is the number of functional tissue compartments (Hillman et al., 2007). This falls neatly within the definition of a convex set:
 |
where aj is the vector notation of aj(t) over time. We have shown that the corner points of the pixel time series convex hull  (
( ) correspond to the pure-volume pixels for each tissue compartments (Wang et al., 2010).
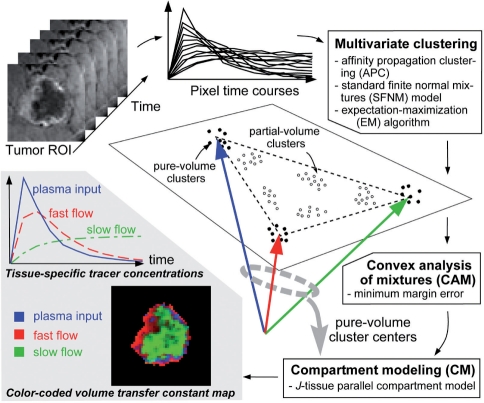
The flowchart of CAM-CM algorithm is given in Figure 1. The three core components of CAM-CM software include: (i) initialization-free multivariate clustering of pixel time series into an optimum number of representative and robust clusters using affinity propagation clustering and expectation–maximization mixture model fitting (Frey and Dueck, 2007); (ii) convex analysis of mixtures that automatically identifies the pure-volume pixel clusters geometrically located at the corners of the clustered pixel time-series scatter simplex via minimum-error-margin convex-hull-to-data fitting (Wang et al., 2010); and (iii) compartment modeling that estimates tissue-specific pharmacokinetic parameters using only pure-volume pixel time series. The CAM-CM software is implemented in MATLAB, and runs successfully on both Microsoft Windows and Linux platforms.
Fig. 1.
Software flowchart of the CAM-CM algorithm.
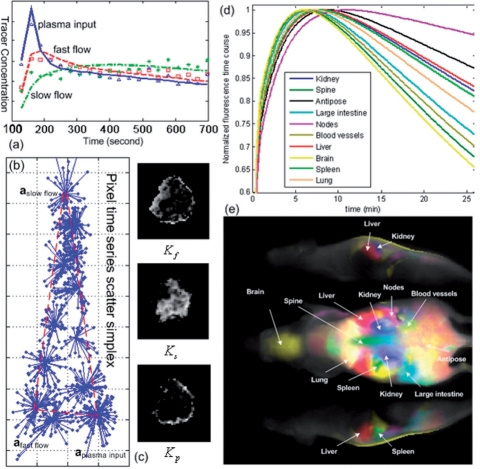
The CAM-CM software takes input from the .mat data files that record the pixel time series of dynamic contrast-enhanced images in matrices. Each row corresponds to a time frame and each column corresponds to a pixel. Running CAM-CM software is automatic and convenient, with only two user-controlled parameters: the number of tissue types J and the sampling time interval between two consecutive dynamic image frames. Results of CAM-CM are provided to the users via a multiplatform graphical summary that includes compartment time activity curves, convexity-preserved clustered scatter simplex, and dissected and composite compartment parametric images (Fig. 2). The displays are visually simple to interpret, yet still convey considerable mathematical and biological insights.
Fig. 2.
Output of CAM-CM software on biomedical case studies (see Supplementary Material for more detailed discussions).
2.2 Biomedical case studies
CAM-CM has been tested on real dynamic contrast-enhanced imaging data. Using DCE-MRI dataset of an advanced breast cancer case (McDonald and Choyke, 2003), CAM-CM analysis reveals two biologically interpretable vascular compartments with distinct kinetic patterns: fast clearance in peripheral ‘rim’ and slow clearance in inner ‘core’ (Fig. 2a–c) which otherwise could not be seen if tissue heterogeneity (84% in this case) was not taken into account, plausibly consistent with the previously reported heterogeneity within tumors (Costouros et al., 2002). Since angiogenesis is essential for tumor development, it has been widely observed that active angiogenesis in advanced breast tumors often occurs in the peripheral ‘rim’ with co-occurrence of inner-core hypoxia, due to the defective endothelial barrier function and outgrowth blood supply (McDonald and Choyke, 2003).
In another application to dynamic fluorescence molecular imaging data acquired on a mouse after bolus injection of indocyanine green dye (Hillman and Moore, 2007), CAM-CM provides physiologically interpretable biodistribution dynamics of the major organs. Ten fluorescence time courses (Fig. 2d) show distinct patterns of circulating, accumulating or metabolizing the dye in different organs, which agree with expected physiological trends, such as late uptake by adipose tissue and fast clearance from the brain region. The merged and color-coded maps of these dissected tissue compartments constitute anatomical structures of the mouse that agree well with a digital anatomical mouse atlas, allowing the longitudinal identification of the internal organs (Fig. 2e) (Hillman and Moore, 2007).
Detailed descriptions on method, simulation-based validation and more biomedical case studies are included in the Supplementary Material.
3 DISCUSSION
CAM-CM spatial-temporal analysis can be very effective at revealing multi-compartment structure within dynamic contrast-enhanced imaging data of complex tissues, estimating tissue-specific kinetic parameter values and characterizing the roles of different functional tissue compartments. We would expect the CAM-CM method, with publicly available open-source software package, to be a very useful tool for the exploratory analysis of dynamic functional imaging data in many research and clinical applications. We plan to develop and deliver future versions of the software written in both R and Java languages.
Funding: National Institutes of Health, under Grants (EB000830, EB008627 and HHSN261200800001E) in part.
Conflict of Interest: none declared.
Supplementary Material
REFERENCES
- Anderson N.G., et al. Spectroscopic (multi-energy) CT distinguishes iodine and barium contrast material in MICE. Eur. Radiol. 2010;20:2126–2134. doi: 10.1007/s00330-010-1768-9. [DOI] [PubMed] [Google Scholar]
- Costouros N.G., et al. Microarray gene expression analysis of murine tumor heterogeneity defined by dynamic contrast-enhanced MRI. Mol. Imaging. 2002;1:301–308. doi: 10.1162/15353500200202124. [DOI] [PubMed] [Google Scholar]
- Frey B.J., Dueck D. Clustering by passing messages between data points. Science. 2007;315:972–976. doi: 10.1126/science.1136800. [DOI] [PubMed] [Google Scholar]
- Hillman E.M.C., Moore A. All-optical anatomical co-registration for molecular imaging of small animals using dynamic contrast. Nat. Photonics. 2007;1:526–530. doi: 10.1038/nphoton.2007.146. [DOI] [PMC free article] [PubMed] [Google Scholar]
- Hillman E.M., et al. Depth-resolved optical imaging and microscopy of vascular compartment dynamics during somatosensory stimulation. NeuroImage. 2007;35:89–104. doi: 10.1016/j.neuroimage.2006.11.032. [DOI] [PMC free article] [PubMed] [Google Scholar]
- McDonald D.M., Choyke P.L. Imaging of angiogenesis: from microscope to clinic. Nat. Med. 2003;9:713–725. doi: 10.1038/nm0603-713. [DOI] [PubMed] [Google Scholar]
- Segal E., et al. Decoding global gene expression programs in liver cancer by noninvasive imaging. Nat. Biotechnol. 2007;25:675–680. doi: 10.1038/nbt1306. [DOI] [PubMed] [Google Scholar]
- Wang F.Y., et al. Nonnegative least-correlated component analysis for separation of dependent sources by volume maximization. IEEE Trans. Pattern Anal. Mach. Intell. 2010;32:875–888. doi: 10.1109/TPAMI.2009.72. [DOI] [PubMed] [Google Scholar]
- Zhou Y., et al. A modelling-based factor extraction for determining spatial heterogeneity of Ga-68 EDTA kinetics in brain tumors. IEEE Trans. Nuclear Sci. 1997;44:2522–2527. [Google Scholar]
Associated Data
This section collects any data citations, data availability statements, or supplementary materials included in this article.


