

Abstract
Noninvasively mapping the layout of cortical areas in humans is a continuing challenge for neuroscience. We present a new method of mapping cortical areas based on myelin content as revealed by T1-weighted (T1w) and T2-weighted (T2w) MRI. The method is generalizable across different 3T scanners and pulse sequences. We use the ratio of T1w/T2w image intensities to eliminate the MR-related image intensity bias and enhance the contrast to noise ratio for myelin. Data from each subject were mapped to the cortical surface and aligned across individuals using surface-based registration. The spatial gradient of the group average myelin map provides an observer-independent measure of sharp transitions in myelin content across the surface—i.e., putative cortical areal borders. We found excellent agreement between the gradients of the myelin maps and the gradients of published probabilistic cytoarchitectonically defined cortical areas that were registered to the same surface-based atlas. For other cortical regions, we used published anatomical and functional information to make putative identifications of dozens of cortical areas or candidate areas. In general, primary and early unimodal association cortices are heavily myelinated and higher, multimodal, association cortices are more lightly myelinated, but there are notable exceptions in the literature that are confirmed by our results. The overall pattern in the myelin maps also has important correlations with the developmental onset of subcortical white matter myelination, evolutionary cortical areal expansion in humans compared with macaques, postnatal cortical expansion in humans, and maps of neuronal density in non-human primates.
Introduction
Modern neuroimaging methods reveal an enormous amount of information about the functional organization and structural connectivity of human cerebral cortex. However, interpretation of these findings is seriously impeded by inadequacies of existing cortical parcellations. Brodmann's cytoarchitectonic areas (Brodmann, 1909), though widely used, are inaccurate over much of cortex (Zilles and Amunts, 2010). An additional impediment is that most analyses have been performed using methods that do not respect the sheet-like topology of the convoluted cerebral cortex. Observer-independent probabilistic architectonic maps only cover a modest portion of the cortex (Eickhoff et al., 2005a). Of these, only a minority have been mapped to the individuals' cortical surfaces (Fischl et al., 2008), enabling surface-based registration with improved intersubject alignment. Available architectonic maps are almost exclusively based on postmortem histology. In vivo MR-based methods for accurately mapping individual cortical areas would be useful, both to improve cortical coverage and because they can be applied directly to living humans.
Myeloarchitectural features have been visualized using MRI in humans, including the stria of Gennari in V1 (Clark et al., 1992; Barbier et al., 2002; Walters et al., 2003, 2007; Bridge et al., 2005; Clare and Bridge, 2005; Eickhoff et al., 2005b) and tripartite lamination of area 4 (Kim et al., 2009). Other studies have shown regional differences in T1 or T1-weighted (T1w) image intensity in cortical gray matter, including differences between association cortices and primary sensory and motor cortices using surface (Fischl et al., 2004; Salat et al., 2009) and volume analyses (Steen et al., 2000). Several studies have directly compared MR images to myelin-stained sections of the same tissue. In marmosets, this approach revealed a strong correlation between T1 and T1w intensities and histologically measured myelin content and enabled accurate delineation of several cortical areas (Bock et al., 2009). In humans, a similar approach demonstrated a myeloarchitectonic difference between areas 4 and 3a in ex vivo T1 slices and myelin-stained sections (Geyer et al., 2011). Also, fibers of the perforant path are visible in both T2*-weighted images and in myelin-stained sections (Augustinack et al., 2010). The myelin-related MR contrast largely reflects differences in lipids (Koenig, 1991) and free and myelin-bound water (Miot-Noirault et al., 1997) concentration, but is also influenced by iron, particularly in T2*-weighted images. However, myelin and iron are strongly colocalized within cortical gray matter (Fukunaga et al., 2010). Thus, it is reasonable to conclude that MR-based signals across the cortical gray matter largely reflect myelin content both directly and indirectly. Sigalovsky et al. (2006) found an increased R1 signal (the inverse of T1) in the posterior medial Heschl's gyrus and suggested that this reflected the high myelin content of primary auditory cortex. Yoshiura et al. (2000) reported that Heschl's gyrus, particularly the posterior portion, has a lower T2-weighted (T2w) intensity than the superior or middle temporal gyri. These studies suggest that the myelin content of a cortical area covaries with both T1w intensity and T2w intensity, but in opposite directions.
Here, we tested this hypothesis using T1w and T2w MR images from standard 1 mm isotropic 3T protocols. The ratio of T1w to T2w signal intensity was mapped to the cortical surface using a customized algorithm. The ratio method substantially improves areal localization by increasing the contrast to noise between heavily and lightly myelinated areas and also by mathematically canceling the MR-related intensity bias field (see methods). We demonstrate that myelin-based analysis (myelin maps) reveals part or all of the areal boundaries for dozens of cortical areas in a population-average analysis. Many of these areas can also be identified in individual subjects, albeit with less precision.
Materials and Methods
Subjects and image acquisition.
The methods were developed on a single subject and then applied to two separate datasets obtained with differing imaging parameters. All datasets were acquired using protocols approved by the institutional review boards. The first included 69 control subjects (37 males, 32 females, mean age 22 ± 6 years) from the Conte Center (provided by John G. Csernansky with assistance from Michael Harms and Lei Wang). Subjects were scanned at Washington University in St. Louis and at Northwestern University on Siemens 3T Tim Trios using a 12-channel head coil. A 3D T1w magnetization-prepared rapid gradient echo (MPRAGE; TR = 2400 ms, TE = 3.16 ms, TI = 1000 ms, 8° flip angle, bandwidth = 220 Hz/pixel, echo spacing = 7.5 ms, FOV 256 mm × 256 mm × 176 mm, matrix 256 × 256 × 176, 1 mm isotropic resolution) sequence was acquired. A generalized autocalibrating partially parallel acquisition (GRAPPA) factor of 2 in combination with 50% phase oversampling (acquisition time 8 min) gave an SNR level intermediate to that with no parallel imaging and that with GRAPPA a factor of 2 and no phase oversampling. A 3D T2w sampling perfection with application optimized contrast using different angle evolutions (SPACE; TR = 3200 ms, TE = 449 ms, variable flip angle, bandwidth = 698 Hz/pixel, echo spacing = 3.26 ms, Turbo Factor = 139, FOV 256 mm × 256 mm × 176 mm, matrix 256 × 256 × 176, 1 mm isotropic resolution) sequence was acquired. A GRAPPA factor of 2 was used with no phase oversampling (acquisition time of 5 min). Both scans were acquired sagittally. The original single subject was scanned with identical parameters to the above.
The second dataset includes the 10 control subjects (all male, mean age = 42 ± 11 years) from the publicly available Brain Multimodality dataset from the National Alliance for Medical Image Computing (NAMIC) (provided by the Psychiatry Neuroimaging Laboratory and the Surgical Planning Laboratory, Brigham and Women's Hospital). The data were acquired on a 3T General Electric (GE) scanner at Brigham and Women's Hospital in Boston using an 8-channel head coil and GE's parallel imaging technology Array Spatial Sensitivity Encoding Techniques (ASSET) was used with a SENSE (SENSitivity Encoding) factor of 2. A T1w spoiled gradient recalled sequence (SPGR; TR = 7.4 ms, TE = 3 ms, TI = 600 ms, 10° flip angle, FOV 256 mm × 256 mm, matrix 256 × 256, 1 mm slices) and a T2w extended echo train acquisition (XETA; TR = 2500 ms, TE = 80 ms, FOV 256 mm × 256 mm, matrix 256 × 256, 1 mm slices) were acquired. Data were downloaded from the NAMIC MIDAS website: http://insight-journal.org/midas/collection/view/190.
Surface generation and processing of T1w volumes.
The original unresampled T1w volumes were processed through FreeSurfer 4.5's default recon-all preprocessing pipeline (http://surfer.nmr.mgh.harvard.edu/), which includes brain extraction, intensity normalization, segmentation, generation of white and pial surfaces, surface topology correction, inflation of surfaces to a sphere, and spherical registration to the fsaverage surface based on a measure of surface shape (Sled et al., 1998; Dale et al., 1999; Fischl et al., 1999a,b, 2001; Ségonne et al., 2004). The most accurate surfaces were obtained using unresampled T1w volumes, likely through minimization of partial-volume effects. FreeSurfer white and pial surfaces were converted to GIFTI format with application of a transformation matrix to correct for a translational offset (“c_ras”) so that the surface and volume would line up. Using Caret software (Van Essen et al., 2001) a midthickness surface was generated by averaging the white and pial surface coordinates. The white, pial, and midthickness surfaces with the original number of vertices are referred to as “native” mesh surfaces.
The registered spherical surface (sphere.reg) was converted to GIFTI format and resampled onto the fsaverage template spherical surface using Caret's “create deformation map” function. The resultant deformation map between the native mesh surfaces and the fsaverage surface was applied to bring the native mesh surfaces into register with and onto the 164k vertex fsaverage left or right mesh (hereafter, fs_L or fs_R). The fs_L and fs_R meshes are not in register, so we used a landmark-based registration between them and a hybrid left and right fsaverage template (hereafter, fs_LR), creating deformation maps for left and right hemispheres (D. C. Van Essen, M. F. Glasser, D. L. Dierker, J. Harwell, and T. Coalson, unpublished observations). We applied these deformation maps to the subjects' fs_L and fs_R resampled surfaces, bringing their left and right hemispheres into register and onto the 164k vertex fs_LR mesh. These steps enable quantitative comparisons of surface-mapped data across subjects and hemispheres in a vertexwise fashion.
Processing of T2w images and generation of the T1w/T2w ratio image volume.
The T2w image was registered to the T1w image using FSL's FLIRT (Jenkinson et al., 2002) with 6 parameters (rigid body) and the mutual information cost function. This registration precisely aligned all brain regions except for small portions of ventral orbitofrontal cortex, overlying the sphenoid sinus, and inferior temporal cortex, overlying the mastoid air cells. In these areas, the gradient echo T1w and spin echo T2w data were affected differently by magnetic susceptibility-induced signal dephasing and signal loss (see Technical limitations). The T2w image was resampled using the spline interpolation algorithm of FSL's applywarp tool. Spline interpolation minimizes the white matter and CSF contamination of gray matter voxels that would result from the volumetric blurring inherent in trilinear interpolation. Spline interpolation yielded similar results when applied only to the T2w image or when applied separately to both the T1w and T2w images so that they were resampled the same number of times.
Division of the T1w image by the aligned T2w image mathematically cancels the signal intensity bias related to the sensitivity profile of the radio frequency receiver coils, which is the same in both images. Taking the ratio also increases the contrast related to myelin content. A simple approximation (Eq. 1) explains both effects: if myelin contrast is represented by x in the T1w image and 1/x in the T2w image, and the receive bias field is represented by b in both images, the T1w/T2w ratio image equals x2, i.e., enhanced myelin contrast, with no bias field contribution. Because the noise in the T1w and T2w images is uncorrelated, there is increased myelin contrast relative to the noise (i.e., increased contrast-to-noise ratio).
 |
Alternative bias field correction methods such as FSL's FAST (Zhang et al., 2001) and MINC's nu_correct (Sled et al., 1998) are not sufficiently accurate for the myelin mapping technique presented here. As demonstrated below, myelin mapping relies on detection of subtle differences in gray matter intensity that are obscured by either incomplete correction of the bias field or by errors in the bias field that can occur around the exterior of the brain. These errors take the form of local inhomogeneities between superficial cortex on the gyral crowns and deeper cortex in the fundi of sulci, and they result from the steep image intensity gradient between brain tissue and extracerebral tissues. These errors become more apparent when one runs a bias field correction utility multiple times in an attempt to completely remove the bias field. Intensity variations due to transmit field biases are minimal when using body transmit coils, as used here with the Siemens 3T Trios, because such coils produce very uniform transmit fields over the head. Further, some of the residual biases from the transmit field may also be reduced when dividing the images since, while the transmit profiles between the two sequences are different, they are correlated. Indeed, there was no discernible global signal bias in our T1w/T2w ratio images, as the low-frequency variations in gray and white matter were anti-correlated. We would expect them to be correlated if a bias field were present, as they are in the raw T1w and T2w images. These assumptions will not apply at higher resonant frequencies (i.e., at higher field strengths like 7T) where local transmit coils are used and where the transmit field biases are much stronger (Van de Moortele et al., 2009). In this case, it will be necessary to use sequences for the ratio that have very similar transmit profiles.
In volume slices of T1w and T2w images, interesting local signal inhomogeneities are evident in the gray matter, particularly in regions such as the central sulcus (Fig. 1A,B). These inhomogeneities are enhanced in the T1w/T2w ratio images (Fig. 1C). When a color palette is used instead of gray scale, the differences become even more apparent (Fig. 1D). The boundaries drawn on the colorized T1w/T2w image in Figure 1D represent putative transitions between cortical areas (see Results). Indeed, a direct comparison between myelin-stained histology and T1 contrast in the central sulcus reported a similar border between areas 4 and 3a that was aligned in both methodologies (Geyer et al., 2011).
Figure 1.
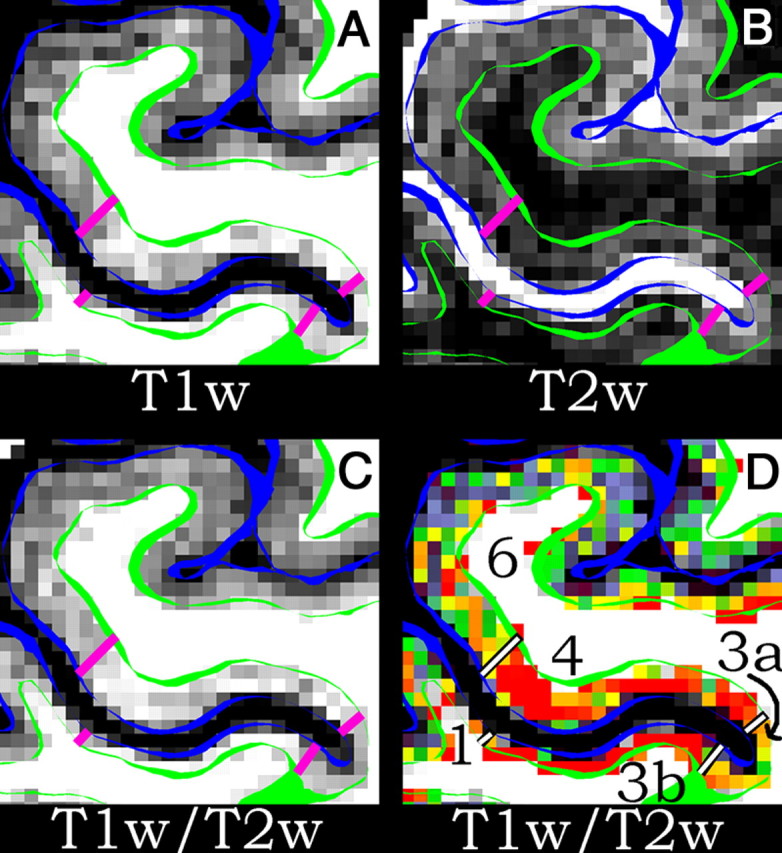
A–D, Each panel shows the central sulcus of a single subject in axial section with the anterior bank above the posterior bank. The white matter surface is a green contour and the pial surface is a blue contour. The lines delimit area 6 from area 4 on the anterior bank, area 4 from area 3a in the fundus, area 3a from area 3b in the fundus, and area 3b from area 1 on the posterior bank. A is a T1w image, B is a T2w image, C is the T1w/T2w image in gray scale, and D is the T1w/T2w image in color scale. All volumetric data are unsmoothed. From these images, it is apparent that areas 4 and 3b are more heavily myelinated than areas 6, 3a, and 1. The scale in D is T1w/T2w = 1% (purple) to 99% (red).
Surface-based T1w/T2w ratio analysis.
A customized volume-to-surface mapping algorithm was applied to voxels assigned to the gray matter ribbon by FreeSurfer—i.e., those with voxel centers located between the white and pial surfaces. To preserve accuracy, the gray matter ribbon mask was not resampled once generated. For each vertex in the native mesh midthickness surface, ribbon voxels were selected within a cylinder orthogonal to the local surface. The cylinder had a height and radius equal to the local cortical thickness value and was centered on the vertex. Voxels were excluded if the T1w/T2w value exceeded ±1 SD of all T1w/T2w values within the cortical ribbon. This criterion had the effect of removing voxels that contained significant blood vessel signal with very high T1w/T2w values or CSF signal with very low values. The remaining ribbon voxels were averaged according to a Gaussian weighted function (FWHM= ∼4 mm, σ = 5/3 mm) to produce a value for the vertex. Vertices in the noncortical medial wall had a FreeSurfer thickness value of zero and were assigned a T1w/T2w value of zero.
Small patches of aberrant T1w/T2w values were detected and corrected as follows. Each vertex's cortical thickness and T1w/T2w values were compared with the mean values of the neighbors within 10 steps across the surface. If the values of both the cortical thickness and the T1w/T2w exceeded 2 SDs from the mean, it was assumed that an error had occurred in surface reconstruction and thus the data were unreliable. These values were replaced by a Gaussian-weighted average of their neighbors using a geodesic distance weighting. Only vertices having cortical thickness values and T1w/T2w values <2 SDs from the mean were included in the Gaussian weighted average (FWHM= ∼4 mm, σ = 5/3 mm). This outlier detection and correction method performed well at removing small artifacts from the data; however, it failed to correct larger ones. If the anomalies are large enough, they affect the neighborhood mean and SD and no longer appear anomalous to the algorithm. The individual subject shown below in Figure 3, C, F, I, and L, was processed with a SD value of one. This yielded a modestly improved artifact correction, but at a large increase in computational time that precluded application to all 80 subjects. Finally, this individual's data were smoothed across the surface using a Gaussian average weighted by geodesic distance (FWHM = 5 mm) that reduced high spatial frequency information, which appeared to be mostly noise. We have incorporated the myelin mapping software into Caret and made our myelin map data available in GIFTI format online; interested investigators should visit http://brainvis.wustl.edu/MyelinMaps/.
Figure 3.

A–L, An overall comparison of the T1w/T2w ratio in two groups and an individual subject on the fs_LR inflated surface. Row 1 (A–C) is the left hemisphere lateral view, row 2 (D–F) is the left hemisphere medial view, row 3 (G–I) is the right hemisphere lateral view, and row 4 (J–L) is the right hemisphere medial view. The left column (A, D, G, J) is the Conte-69 average data. The center column (B, E, H, K) is the NAMIC-10 average data. The right column (C, F, I, L) is the single subject scanned like the Conte-69. The single subject data have been smoothed with 5 mm FWHM surface geodesic Gaussian smoothing (described in Materials and Methods). Note the strong agreement of the patterns across groups and hemispheres. In all medial surface panels, the medial wall is masked.
Construction and analysis of group average data.
Transformation of myelin map data from the individual subject's native mesh to the fs_LR standard mesh involves two deformation maps, one representing registration from the native mesh to fs_L and fs_R and another representing registration between fs_L and fs_R and fs_LR. The two deformation maps were concatenated into a single deformation map using Caret software that was applied to the individual subject's myelin map data, cortical thickness data, and surface curvature data. Average midthickness surfaces for the left and right hemispheres were generated from the individual subjects' registered surfaces, and these were strikingly similar to the fsaverage midthickness surfaces. The individual myelin map data were normalized to a group global mean and then averaged at each surface node. A small amount of geodesic Gaussian-weighted smoothing was applied to the group average myelin map (FWHM = 2.35 mm); prior to gradient calculation, group data shown are unsmoothed. The gradient magnitude—i.e., the first spatial derivative—of the group average myelin map was computed on the group average midthickness surface. This gradient provides an observer-independent measure of rapid transitions in myelin content and can be used as a basis for delineating areal borders. To avoid edge effects along the noncortical medial wall, this region was masked and the intensity along the edge was dilated into the center before computing the gradient. The gradient analyses used here are similar in spirit to those introduced by Cohen et al. (2008) and Nelson et al. (2010), but differ in implementation. Whereas they computed gradients on a Cartesian grid overlaid on a flat map (Cohen et al., 2008; Nelson et al., 2010), we computed gradients directly on the convoluted surface mesh, avoiding the necessary cuts and inherent distortions in the flattening process.
Color palette.
Myelin map values are dimensionless quantities whose magnitude depends on many factors. The color palette used to display myelin maps was adjusted so that its dynamic range was most informative for identifying the transitions between adjacent areas that are also highlighted by the gradient calculation. Practically, the myelin maps (and other images) were displayed at third and 96th percentiles for the hemisphere as a whole, with saturation above (red) and below (black) these values. Figure 2 shows the image histograms for the Conte-69, NAMIC-10, and the individual subject datasets. The histograms are very similar in shape, with the highest peak representing the large expanses of lightly myelinated cortex and a smaller peak or hump representing the heavily myelinated regions of cortex. Although the absolute values are twofold higher for NAMIC-10 vs Conte-69, the use of percentile scaling allows a direct comparison between them in Figure 3.
Figure 2.

A comparison of image histograms from the datasets in Figure 3. The gray lines mark the minimum (black = 3%) and maximum (red = 96%) for the color palette used in Figure 3. The shapes of the T1w/T2w histograms are very similar, but their absolute magnitudes differ markedly. The values for the NAMIC-10 group are twice as high as those for the Conte-69 group, reflecting the fact that the data were collected on different scanners using different pulse sequences (see Materials and Methods). The top row is the left hemisphere and the bottom row is the right hemisphere.
Thickness maps.
In addition to myelin maps and their gradients, cortical thickness maps and their gradients were also analyzed. Cortical thickness maps and surface curvature maps were averaged after resampling onto the fs_LR mesh. The average surface curvature was regressed out of the average cortical thickness map in a manner similar to that used by Sigalovsky et al. (2006), thereby correcting the thickness map for biases caused by gyral and sulcal folding. The magnitude of the spatial gradient was computed on this curvature-compensated cortical thickness map with a prior smoothing of FWHM = 2.35 mm.
Probabilistic cytoarchitectonic areas and activation foci.
Surface-based probabilistic cytoarchitectonic areas were obtained from the standard FreeSurfer distribution, most of which were described by Fischl et al. (2008). Spatial gradient magnitudes were computed for each probabilistic cytoarchitectonic area as an observer-independent measure of its most likely average border. Volume-based cytoarchitectonic areas were obtained from the SPM Anatomy Toolbox (Eickhoff et al., 2005a) and were transformed from the original Colin27 space into the fsaverage volume space for accurate mapping to the fsaverage atlas surfaces. This entailed linear (FLIRT) followed by nonlinear (FNIRT) registration of Colin27 to the MNI152 nonlinearly generated template distributed with FSL. The fsaverage average volume was also linearly and then nonlinearly registered to the MNI152 template. This transformation was inverted and concatenated to the Colin27-to-MNI152 transform to produce a Colin27-to-fsaverage nonlinear transform. The transform was then applied to the probabilistic architectonic volumes using nearest neighbor resampling to preserve the actual probability values. The volumetric maps were mapped to the fs_LR midthickness surface using Caret's interpolated voxel method. Because these maps do not respect the topology of the cortical sheet, spatial gradients would not be meaningful, as they are for surface-based probabilistic areas, and thus were not computed. In some cases, volumetric maps were represented by foci located at their centers of gravity, or as a hard segmentation. Hard segmentations were produced by thresholding the volumetric probabilistic cortical areas at a value that reflected 40% of subjects and then assigning each voxel to the cortical area having the highest probability. Published coordinates of functional activation foci were used in their reported MNI coordinates or after conversion from the Talairach coordinates using a Matlab script (http://imaging.mrc-cbu.cam.ac.uk/imaging/MniTalairach). Functional activation maps and parcellations were mapped onto the fs_LR surfaces as described by D. C. Van Essen, M. F. Glasser, D. L. Dierker, J. Harwell, and T. Coalson (unpublished observations).
Delineation of corresponding locations along putative areal borders.
The highlighted surface vertices (white squares) in Figures 3–12 are in corresponding locations in each panel (see figure legend to determine whether they are also corresponding for left and right hemispheres). They were positioned using information in the myelin gradients, probabilistic areal gradients, and/or thickness gradients, unless otherwise specified. They are positioned to reveal the correlations across the different modalities in the panels. They also indicate areal borders (when the identity of an area is known from histological studies mapped onto the surface) or putative areal borders when the areal identity is inferred from published figures. They are not intended to create a “hard” segmentation of cortex into distinct parcels; rather, they draw attention to myelin features that likely represent distinct cortical areas. The magnitude and width of the myelin gradient represents how distinct one feature is from another and how quickly the myelin content changes.
Figure 4.

A–J, A comparison of myelin maps and gradients to probabilistic cytoarchitectonically defined cortical areas and gradients. The top row (A–E) shows the left hemisphere and the bottom row (F–J) the right hemisphere in the region of the central sulcus. The first column (A, F) shows myelin maps as in Figure 3. The second column (B, G) is the gradient of the myelin maps, i.e., regions of rapid intensity changes. The third column (C, H) is the sum of the gradients of the probabilistic cortical areas shown in the last two columns (D, I and E, J). These two columns alternate cortical areas: D, I have 4, 3b, 2; E, J have 6, 3a, 1. The white marks are in the same position within each hemisphere, allowing direct comparison of the location of the gradients with respect to each other, the myelin map, and the cortical areas.
Figure 5.
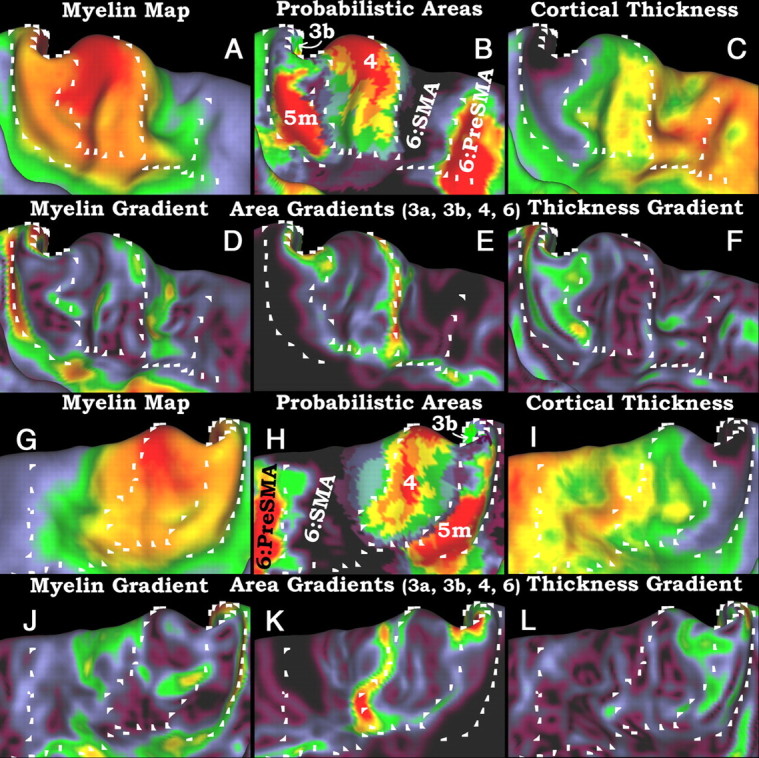
A–L, A comparison of myelin maps and their gradients to probabilistic cortical areas and their gradients and also to cortical thickness maps and their gradients. The top two rows (A–F) show the left paracentral lobule, and the bottom two rows (G–L) show the right paracentral lobule. A and G are myelin maps; D and J are myelin gradients; and B and H are probabilistic cytoarchitectonic maps of areas 3b, 4, and 5m. Area 6 is divided into SMA and pre-SMA by a diffusion tractography-based parcellation (Johansen-Berg et al., 2004), and only pre-SMA is shown for clarity. E and K are the sum of the gradients of areas 3b, 3a, 4, and 6. C and I are cortical thickness maps corrected for surface curvature. F and L are thickness gradients. As in Figure 4, the white marks are in the same positions in each panel.
Figure 6.
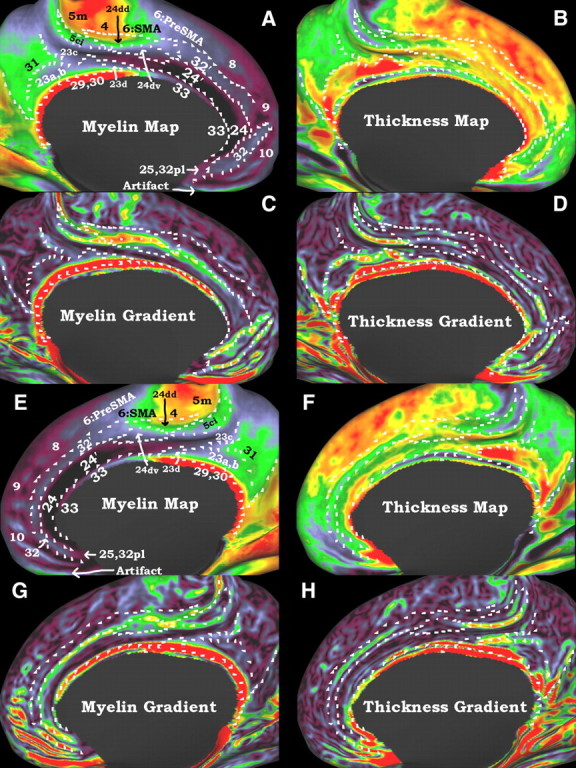
A–H, Myelin and thickness maps and their gradients are used to define putative cortical areas in the cingulate region on an inflated surface. White marks are in the same positions within each hemisphere and were drawn on either the myelin gradients, the thickness gradients, or the inferior borders of probabilistic areas 4 and 6 (data not shown). The top two rows (A–D) are the left hemisphere and the bottom two rows (E–H) are the right hemisphere. A and E show the myelin maps, B and F show the cortical thickness maps corrected for surface curvature, C and G show the myelin gradients, and D and H show the thickness gradients.
Figure 7.
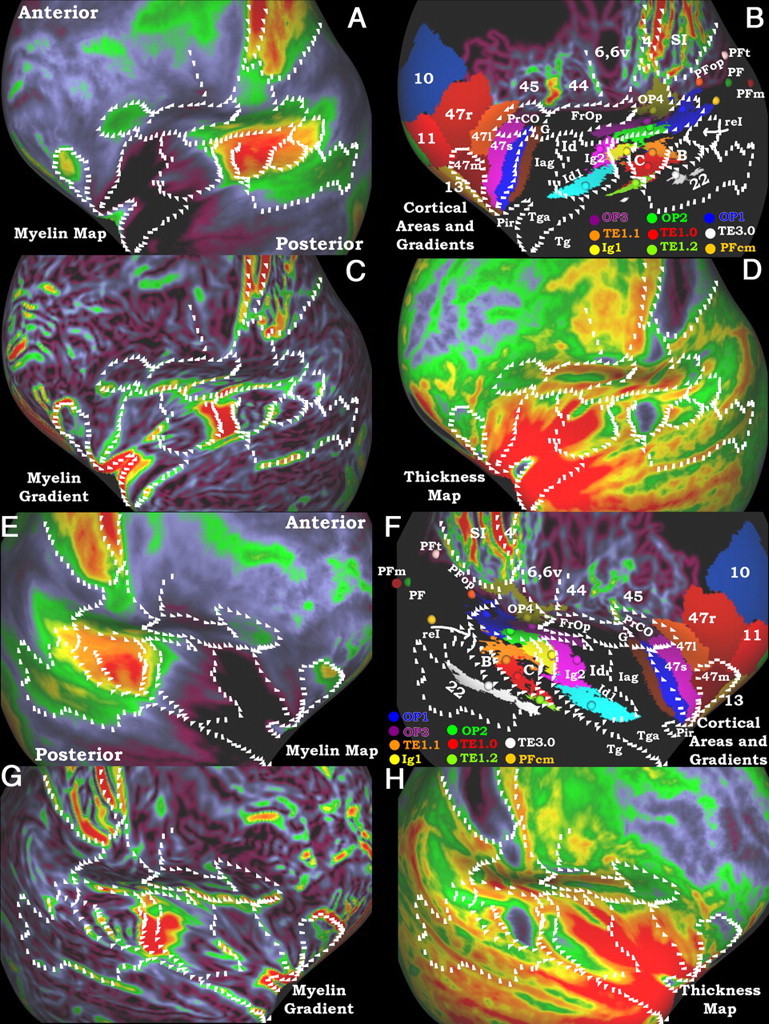
A–H, Myelin maps, gradients of myelin maps, and thickness maps are compared with cortical areas and gradients of cortical areas in the perisylvian region on an inflated surface. White marks are in the same positions within each hemisphere and were drawn on the myelin gradients and gradients of probabilistic areas. The top two rows (A–D) are the left hemisphere and the bottom two rows (E–H) are the right hemisphere. A and E show the myelin maps. B and F include the gradients of the probabilistic areas in Figure 4 and the gradients of surface mapped areas 44 and 45. The orbito-frontal parcellation was derived from surface mapped architectonic parcels from the 4 hemispheres presented by Öngür et al. (2003). The spheres and associated colored patches are 3D centers of gravity of volume mapped cortical areas and a hard segmentation of the volume mapped cortical areas thresholded at 4 subjects from the SPM anatomy toolbox (Eckhoff et al., 2005a). C and G show the myelin gradients. D and H show the cortical thickness maps corrected for surface curvature. Note that Tga is more lightly myelinated than Tg, but the difference is not visible in A and E because both are extremely lightly myelinated compared with the rest of the brain.
Figure 8.

A–J, Myelin maps, gradients of myelin maps, cytoarchitectonic areas, gradients of cytoarchitectonic areas, and visuotopic areas of the lateral visual cortex on an inflated surface. Because of increased variability of the gradients within this region, white marks were drawn on a map of left × right myelin gradients, which highlights gradients that are consistent across hemispheres and are in the same positions in all images. For the area18 border, the left × right gradient of area 18 was used, as myelin maps become unreliable in this region. The top row (A–E) is the left hemisphere and the bottom row (F–J) is the right hemisphere. A and F show the myelin maps, B and G show the gradients of the myelin maps, C and H show gradients of the cortical areas shown in D and I (17, 18, and hOc5; Amunts et al., 2000; Malikovic et al., 2007), and E and J show the visuotopic areas from Kolster et al. (2010), Swisher et al. (2007), and V6 of Pitzalis et al. (2006). Two volumetrically mapped probabilistic areas (PGa and PGp; Caspers et al., 2006, 2008) are shown as 3D centers of gravity. For the visuotopic maps, areas V1, V2, and V3 were not shown because they do not align with the histologically defined areas (D. C. Van Essen, M. F. Glasser, D. L. Dierker, J. Harwell, and T. Coalson, unpublished observations).
Figure 9.
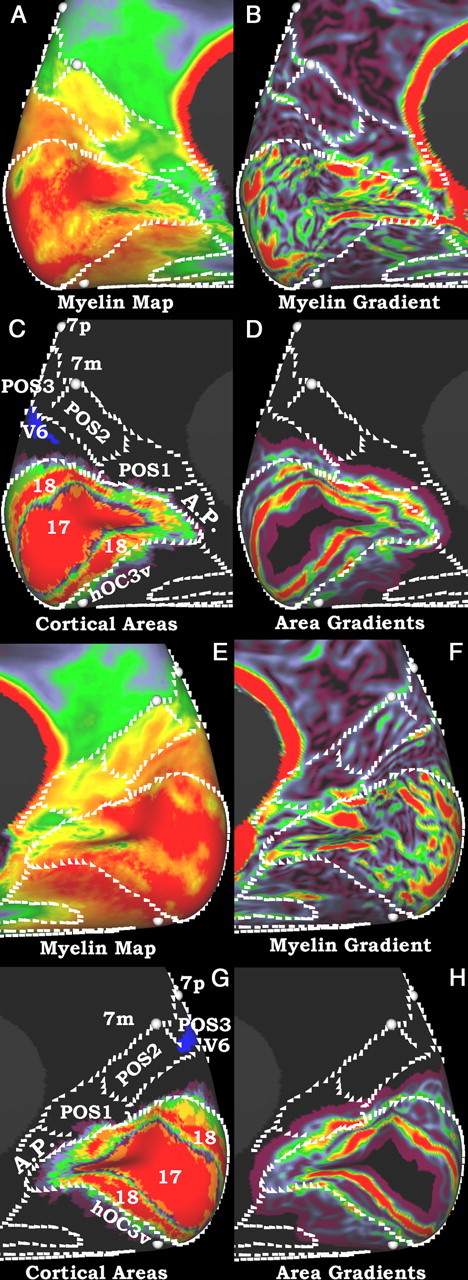
A–H, Myelin maps, gradients of myelin maps, cortical areas, and gradients of cortical areas of the medial visual cortex on an inflated surface. Similar to Figure 8, the white marks are in the same location in both hemispheres and were defined similarly. The top two rows (A–D) are the left hemisphere and the bottom two rows (E–H) are the right hemisphere. A and E show the myelin maps, B and F show the gradients of the myelin maps, C and G show the cortical areas 17 and 18 from Amunts et al. (2000), V6 from Pitzalis et al. (2006), 7m and 7p from Scheperjans et al. (2008a,b), and hOC3v from Rottschy et al. (2007); D and H show the gradients of the area 18.
Figure 10.

A–F, Myelin maps, gradients of myelin maps, and the group average right hemisphere results of Rajimehr et al. (2009) on an inflated surface. Similar to Figures 8 and 9, the white marks are in the same location in both hemispheres and were defined similarly. A–C are the left hemisphere and D–F are the right hemisphere. A and D show the myelin maps and 3D centers of gravity of areas hOC3v and hOC4v from (Rottschy et al., 2007), B and E show the gradients of the myelin maps, and C and F show the Faces > Places task fMRI contrast of the right hemisphere from Rajimehr et al. (2009).
Figure 11.

A–F, Myelin maps (A, B, E, F), gradients of myelin maps (C, G), and visuotopic areas of Swisher et al. (2007) of one right hemisphere (D, H) on an inflated surface. The top panels (A–D) are the left hemisphere and the bottom panels (E–H) are the right hemisphere. The most heavily myelinated IPS area is surrounded by white marks that are the same in each panel within a hemisphere. The ellipse surrounds the region that has been suggested to be the homolog of macaque area LIP by functional studies, spheres. The center of gravity of the nearby area hIP3 from Scheperjans et al. (2008a) is also shown.
Figure 12.

A–F, Myelin maps (B, E) and probabilistic cortical area (C, F) from Amunts et al. (2005) on a cortical midthickness surface. Left hemisphere is shown in A–C, and right hemisphere is shown in D–F. The probabilistic area of the subiculum complex (Sub) is centered on the region of heavier myelination on the parahippocampal gyrus. The white marks are in the same locations in each panel within a hemisphere.
Myelin content surface maps of Adolf Hopf.
Adolf Hopf produced some of the most detailed myeloarchitectonic parcellations of human cortex (Zilles, 2004). Unfortunately, most of these results were published in German in a now defunct journal and are rarely cited. Hopf produced drawings of what appear to be surface maps of myelin content for temporal (Hopf, 1955), frontal (Hopf, 1956), and parietal (Hopf and Vitzthum, 1957) cortices. Maps of cingulate cortex are also included together with frontal and parietal cortex (Hopf, 1956; Hopf and Vitzthum, 1957). These works are available online (http://www.thehumanbrain.info/database/literature.php) and are cited where relevant.
Results
Full-hemisphere myelin maps
Figure 3 shows myelin maps for the Conte-69 group average and the NAMIC-10 group average, along with an individual subject scanned like the Conte-69 subjects. Rows 1 and 2 are the left lateral and medial inflated surfaces; rows 3 and 4 are the right lateral and medial inflated surfaces. Although the Conte-69 and NAMIC-10 datasets were acquired with different 1 mm T1w and T2w sequences on different scanners, the spatial patterns are very similar in the two population averages, as well as in the individual. Regions of heavy myelination in all three datasets include the motor-somatosensory strip in the central sulcus, visual cortex in the occipital lobe, and, extending into temporal and parietal lobes, early auditory areas in the Sylvian fissure, and several other regions of parietal, temporal, cingulate, and frontal cortex that are discussed in detail below. Other regions of cortex in predominantly classical “multimodal association” areas are less heavily myelinated, including the inferior parietal cortex, most of the temporal, prefrontal, cingulate, and medial and superior parietal cortices. The lightest myelination occurs in anterior insula, temporal pole, medial prefrontal cortex, and portions of the anterior cingulate cortex. These patterns are highly consistent between the left and right hemispheres, as are the more detailed patterns discussed below. In presenting the relationship of the distinctly myelinated regions to known anatomical and functional data, we will focus on the larger Conte-69 dataset that provides the finest spatial detail. A subsequent section assesses the residual artifactual results present in these data.
The motor-somatosensory strip: lateral
The motor-somatosensory strip in the central sulcus is an excellent domain for anatomical validation of the myelin mapping technique. In this region, the individual myelin maps that produce the population average are well aligned because there is less folding variability. The well defined surface-based probabilistic architectonic maps that are available for this region provide a substrate for validation. Of the six somatosensory and motor areas in this region, areas 4 and 3b are the most heavily myelinated (Fig. 4A,F, red). Each is bounded entirely by more moderately myelinated areas (area 3a in between, area 6 anteriorly, and areas 1 and 2 posteriorly, yellow and green on the myelin maps). A similar pattern of alternating heavy and less heavy myelination of these areas has been reported on flattened cortex in the macaque (Disbrow et al., 2003).
We compared these myelin maps to a set of probabilistic cortical areas defined histologically using observer-independent cytoarchitecture (Geyer et al., 1996, 1999, 2000; Grefkes et al., 2001; Geyer, 2004) that had been mapped to individual cortical surfaces and registered to fsaverage (Fischl et al., 2008) (Fig. 4D,E,I,J). No myelination difference was discernible between areas 4a and 4p, so we summed the probabilistic architectonic maps and identified this as area 4. To provide an objective basis for these comparisons, we computed the spatial gradients of the myelin maps (Fig. 4B,G). We also computed the gradient of each probabilistic architectonic map and then summed all of the areal gradients (Fig. 4C,H). In general, there is excellent agreement between the myelin map gradient and the architectonic areal gradients in both hemispheres. Thus, the myelin maps provide an accurate method for identifying cortical areas in group average data. Area 4 is clearly distinguished from areas 6 and 3a, area 3a is clearly distinguished from 3b, and 3b is clearly distinguished from areas 1 and 2. Areas 1 and 2 only differ modestly in myelination and cannot be reliably discriminated by myelin gradients. In contrast, the posterior border between area 2 and higher somatosensory association cortex is identifiable along its full extent despite less accurate intersubject alignment (Fig. 4D,I).
Architectonic area 6 is much wider than the other motor and somatosensory areas and also is more variable in location, which precludes an accurate estimate of its anterior extent. Its myelin map is more heterogeneous, with heavier myelination dorsally and caudally and lighter myelination ventrally and rostrally. This pattern is evident in individual subjects (Fig. 3C,I), and is thus not likely the result of lower intersubject alignment quality in the group average data. A similar pattern is present in myelin content maps of Hopf, with cortex in the vicinity of caudal and dorsal area 6 being more heavily myelinated than cortex in rostral and ventral parts (Hopf, 1956). Area 4 also contains a gradual dorsoventral myelin gradient in many individual subjects (Fig. 3C,I), with lighter myelination ventrally and heavier myelination dorsally. The regional differences in areas 4 and 6 are correlated with the somatotopy of these areas as determined in macaques. The lower body is represented dorsally in area 4 and dorsoposteriorly in area 6, whereas the upper body is represented ventrally in area 4 and rostrally and ventrally in area 6 (He et al., 1993; Rizzolatti et al., 1996). There is also a correlation with architecture in the macaque, as Barbas and Pandya (1987) reported heavier myelination in dorsal area 6 relative to ventral area 6 and rostrocaudal differences in cytoarchitecture in dorsal area 6. In addition, corticospinal projections are denser from the more caudal portions of area 6 in the monkey (Dum and Strick, 1991). These data, in combination with our myelin maps, suggest that within-area variation in myelin content in areas 4 and 6 may be related to the density and/or length of corticospinal projections (see Discussion).
The motor-somatosensory strip: medial
Figure 5 shows an analysis of the paracentral lobule, immediately medial to the central sulcus. Rows 1 and 3 show myelin maps (Fig. 5A,G), probabilistic areas (Fig. 5B,H), and cortical thickness maps (Fig. 5C,I) for the left (top) and right (bottom) hemispheres. Rows 2 and 4 show the respective gradients of the myelin, areal (sum of gradients of areas 3a, 3b, 4, and 6), and thickness maps. The area of heavy myelination in the paracentral lobule is an extension of that from the central sulcus, but without the regular pattern of alternating heavy and moderate myelination. This region contains the heavily myelinated medial extension of area 4, a moderately heavily myelinated area 5m, and progressively more lightly myelinated subdivisions of area 6, the supplementary motor area (area SMA) and the pre-SMA. The probabilistic maps of areas 3a, 3b, 1, and 2 terminate dorsal to the paracentral lobule. Only the tip of area 3b is discernible on the medial surface, where a transition in cortical thickness map agrees with the areal gradient (Fig. 5B,C,E,F; 5H,I,K,L). Area 4 extends farther ventral into the paracentral lobule (Fig. 5A,B; 5G,H) (Rademacher et al., 1993), as does the heavy myelination. The posterior portion of the paracentral lobule contains a thin and moderately heavily myelinated area. This area is well delineated by the myelin and thickness gradients and is in reasonable agreement with area 5m (Scheperjans et al., 2008a), as mapped to the atlas by volume-to-surface mapping (see Materials and Methods). Cortex in the region of area 5m is heavily myelinated, according to the maps of Hopf (Hopf and Vitzthum, 1957). Anterior to area 4, the caudal portion of the SMA (medial area 6) is more heavily myelinated than the rostral portion. This pattern is similar to dorsal area 6 and is consistent with evidence for lower-versus-upper body in caudal-versus-rostral SMA in the macaque (He et al., 1995; Rizzolatti et al., 1996). There is architectonic evidence for a rostral-caudal subdivision of area SMA on the basis of pigmentoarchitecture and Nissl stains (Braak, 1979b; Vorobiev et al., 1998). Anterior to the rostral SMA is pre-SMA, which is less heavily myelinated than the SMA is, though the transition is gradual. In macaques, the transition from SMA (F3) to pre-SMA (F6) also shows a decrease in myelin content (Matelli et al., 1991). There is a weak ridge in the myelin gradient map (Fig. 5D,J) that coincides with the volumetrically mapped boundary of probabilistic pre-SMA (Fig. 5B,H) as defined by diffusion connectivity (Johansen-Berg et al., 2004). The myelin content maps of Hopf show a gradual caudal to rostral decrease in myelin content, similar to our myelin maps. The pattern is consistent with area 4 being most heavily myelinated, a moderately heavily myelinated caudal division of SMA, a less heavily myelinated rostral division, and a more lightly myelinated pre-SMA (Hopf, 1956).
Cingulate cortex
Thirteen distinct subdivisions were identified in cingulate cortex using myelin maps (Fig. 6A,E), thickness maps (Fig. 6B,F), and their respective gradients (Fig. 6C,D,G,H). These subdivisions tend to be elongated parallel to the cingulate sulcus. In general, the myelin maps show three distinct regional patterns for anterior, middle, and posterior cingulate cortex. Posterior and middle cingulate cortex tend to be more heavily myelinated than anterior cingulate cortex but have a pattern of heavier, then lighter, then heavier myelination as one proceeds dorsal to ventral. In anterior cingulate cortex, the combination of myelin maps and thickness maps reveals 3 distinct strips of cortex, in locations similar to the schema of Paus (2001). He describes them as periallocortex, the thinnest, most inferior strip; proisocortex, the middle strip; and paralimbic cortex, the most superior strip. In Figure 6, these strips are labeled 33, 24′, and 32′ respectively, as described in detail below. The middle strip of proisocortex has some of the lowest myelin content of the entire cerebral hemisphere and is of moderate thickness. The inner strip of periallocortex is slightly more heavily myelinated, and is thicker. Posteriorly, there is a sharp transition to thin, very heavily myelinated, retrosplenial cortex that is located posteriorly. The outer strip of paralimbic cortex is lightly myelinated relative to the rest of the brain but, when compared with adjacent medial prefrontal cortex and proisocortex, is relatively more heavily myelinated. It is also the thickest strip of anterior cingulate cortex, being more similar in thickness to the medial prefrontal cortex.
Cingulate cortex has been extensively studied with architectonic techniques; however, over most of its extent, neither volumetric nor surface reconstructed probabilistic cortical area maps are available. Thus, the comparisons we make here are necessarily less precise than those of the motor-somatosensory strip are. Aside from area 5Ci (Scheperjans et al., 2008a,b) and part of medial prefrontal cortex (Öngür et al., 2003), our comparisons between myelin maps and architectonic parcellations are restricted to visual comparisons with published figures. Nonetheless, these comparisons enabled many putative areal identifications based on comparisons of the spatial topology of the gradient defined areas with figures in published architectural studies (Vogt et al., 1995, 2004, 2006; Vogt and Vogt, 2003; Palomero-Gallagher et al., 2009). In particular, Figure 6 of Vogt et al. (1995), Figure 4 of Palomero-Gallagher et al. (2009), and Figure 1 of Vogt et al. (2006) were used in generating the identifications in Figure 6A,E. We will discuss these areas in a superior-to-inferior progression within each of three cingulate subregions: posterior, middle, and anterior cingulate cortices.
In the posterior cingulate, below the posterior portion of the paracentral lobule is a distinct region of moderate myelin content and medium thickness. This region overlaps extensively with area 5Ci as reported by Scheperjans et al. (2008a,b), i.e., it is on the superior bank of the posterior part of the cingulate sulcus. However, the volume-to-surface map of probabilistic area 5Ci is artifactually located primarily on the ventral bank of the cingulate sulcus, and thus is not shown here. This mismatch illustrates the limitations of making comparisons to parcellations (or functional activations) that are based on volumetric registration, and therefore do not respect the topology of the cortical sheet. Inferior to putative area 5Ci is a strip of thick, lightly myelinated cortex that likely corresponds to area 23c, based the locations of neighboring areas. Immediately inferior is a very thick, lightly myelinated strip that likely corresponds to areas 23a and 23b. Inferior to putative areas 23a and 23b are the very heavily myelinated and thinner areas 29 and 30. Multiple studies have shown areas 29 and 30 to be very heavily myelinated histologically in macaques (Kobayashi and Amaral, 2000) and in humans (Braak, 1979a; Morris et al., 2000), and via MRI in humans (Fatterpekar et al., 2002). This retrosplenial cortex is even visible in the myelin-stained sections of the Atlas of the Human Brain (Mai et al., 1997), and for these reasons we are especially confident in the delineation of this region. Posterior to areas 23a–c is a moderately myelinated, moderately thick putative area 31, which is situated mainly within the splenial (subparietal) sulcus. Anterior to areas 23a,b and inferior to area 23c is putative area 23d, which has similar myelin density to areas 23a,b, but is not as thick.
The midcingulate region, inferior to motor cortex and the SMA, also has a number of putative cortical areas. The myelin map shows heavy to moderately heavy myelination immediately inferior to areas 4 and 6:SMA, which is putative area 24dd. This area is adjoined inferiorly by more lightly myelinated cortex, putative area 24dv, analogous to the variation in the dorsal and medial parts of area 6. Inferior to area 24dv is the posterior part of area 24′, which is very lightly myelinated and of moderate thickness. In the macaque, area 24d is more heavily myelinated than areas 24c and 23 that surround it (Matelli et al., 1991); however, it has not been explicitly subdivided into dorsal and ventral subdivisions (Vogt et al., 2005). As with dorsomedial area 6, the electrophysiology in the macaque suggests that the dorsal portion of area 24d (more heavily myelinated area 24dd in the human) represents the lower body, and the ventral portion of area 24d (more lightly myelinated area 24dv in the human) represents the upper body (Rizzolatti et al., 1996). Corticospinal projections are not as clearly differentiated as in area 6, but there tend to be more lower body projections dorsally (area 24dd) and more upper body projections ventrally (area 24dv) (He et al., 1995).
In the anterior cingulate, a superior strip of cortex is relatively lightly myelinated, moderately thick, and likely corresponds to area 32′ (32p), which extends from the fundus of the cingulate sulcus up onto the free wall of the medial frontal cortex or into the paracingulate gyrus and sulcus if present (Palomero-Gallagher et al., 2008). Inferior to area 32′ is a very lightly myelinated, moderately thick area, likely corresponding to area 24. [The a, b, c, and prime subdivisions of area 24 (Palomero-Gallagher et al., 2009) are not obvious from myelin maps or thickness maps.] Like area 24, this strip extends from the fundus of the cingulate sulcus and occupies all of the cingulate gyrus. This lightly myelinated strip is consistent with evidence that area 24 in the macaque is very lightly myelinated, whereas area 32 is relatively more heavily myelinated (Barbas and Pandya, 1989). The cortex of area 24 has variously been called agranular cortex (Vogt et al., 1995), heterotypic isocortex (Triarhou, 2007a), and proisocortex (Paus, 2001). As shown below, other regions of similarly named cortex in the anterior insula and planum polare are also very lightly myelinated. The putative definition of area 24 is consistent with evidence in the human for a lightly myelinated agranular area on the convexity of the cingulate gyrus (Braak's agm) (Braak, 1979c). Inferior to area 24/agm is a narrow, more heavily myelinated strip of cortex buried in the callosal sulcus that is most likely area 33. This putative definition of area 33 matches the more heavily myelinated periallocortical strip of cortex (Braak's eg) that lies buried in the callosal sulcus (Braak, 1979c). Anterior to area 24 is a region of thinner, somewhat more heavily myelinated cortex that is most likely area 32 (Palomero-Gallagher et al., 2009), also called area 32ac (Öngür et al., 2003). The cortex posterior and inferior to areas 24 and 32 is lightly myelinated, thick, and likely corresponds to areas 25 and 32 pl (Öngür et al., 2003). Anterior and inferior to area 32 is area 10 according to Öngür et al. (2003), and the other medial frontal cortical areas 8 and 9 are inferred from their locations on the Vogt et al. (1995) flat map. Farther inferior, an MR susceptibility artifact is present in both the myelin maps and thickness maps, resulting in artificially thin cortex with artificially high T1w/T2w ratio in the region labeled “artifact” on the gyrus rectus (Fig. 6A,E). Altogether, there are extensive regional differences in myelin content and cortical thickness in the cingulate cortex, allowing for delineation of many putative cortical areas.
Cortex in and surrounding the Sylvian fissure
Figure 7 shows maps of the lateral aspect of each hemisphere, more inflated than in Figure 3 so that all buried cortex is visible. The hemispheres are oriented obliquely with anterior in the upper quadrant and posterior in the lower quadrant for the left hemisphere and the reverse for the right. Many putative areas were identified in insular and adjoining cortex based on myelin maps (Fig. 7A,E) and myelin gradients (Fig. 7C,G). Thickness maps are also provided to illustrate areal differences in cortical thickness (Fig. 7D,H). We related the myelin maps and myelin gradients to more than two dozen areas delineated in various architectonic studies and mapped to the atlas using multiple methods (Fig. 7B,F). The regions in which myelin-based areas were delineated include lateral orbitofrontal, insular, parietal, and frontal opercular cortex, Heschl's gyrus, the planum temporale, parts of the superior temporal gyrus (STG), and the planum polare. In broad terms, this region is characterized by a heavily myelinated auditory core, moderate to heavily myelinated auditory association regions posteriorly, a lightly myelinated and thick insular cortex, and mostly moderate or lightly myelinated opercular and orbitofrontal regions. Our detailed analysis of Figure 7 proceeds from anterior to posterior, starting with lateral orbitofrontal cortex; then fronto-opercular, insular, and temporal polar cortex; then parieto-opercular cortex; and finally, auditory cortex including Heschl's gyrus, the planum temporale, and the superior temporal gyrus. Because of the extensive parcellation data shown in Figure 7, we will give the putative areal identification first (labels in B and F), then discuss its myelin content (A and E) and thickness (D and G), and finally correlate these measures with previous architectonic studies. Parcellations of cortex surrounding the perisylvian cortical areas of interest are also indicated in panels B and F (Amunts et al., 1999, 2010; Caspers et al., 2006, 2008; Fischl et al., 2008).
Starting anteriorly, the lateral orbitofrontal cortex contains area 47, which has been subdivided into areas 47m, 47l, 47r, and 47s (Öngür et al., 2003). They described areas 47m and 47l as being especially heavily myelinated. We find a heavily myelinated area in orbitofrontal cortex that corresponds well with their area 47m; however, 47l does not clearly appear more heavily myelinated than surrounding cortex in our maps. In agreement with our maps, Öngür et al. (2003) describe area 47s as the least heavily myelinated subdivision of area 47. Medial to area 47m are areas 11 and 13, which are less heavily myelinated than area 47m (Öngür et al., 2003), in agreement with our findings. Additionally, we find a moderately heavily myelinated area in the frontal operculum inferior and medial to area 45. This area is most likely precentral opercular cortex (PrCO) as described by Öngür et al. (2003); however, it was not a focus of their parcellation and has not otherwise been investigated histologically in humans. PrCO is moderately heavily myelinated in the macaque (Preuss and Goldman Rakic, 1991; Belmalih et al., 2009) and marmoset (Burman and Rosa, 2009). PrCO is located laterally and anteriorly to primary gustatory cortex (G) in humans (Öngür et al., 2003) and is implicated in olfactory and taste processing (de Araujo et al., 2003).
Posterior to area 47s and inferior to putative areas PrCO and G is a sharp transition from lightly myelinated orbitofrontal and opercular cortex to the very lightly myelinated anterior insula. Although the insula has not been fully parcellated by recent investigators, based on the partial parcellations of Öngür et al. (2003) and Kurth et al. (2009) and the classical anatomical work of Brodmann (Brodmann and Garey, 2006) and Von Economo (Triarhou, 2007a), the anterior very lightly myelinated region likely corresponds to agranular insular cortex. This region, which is the most lightly myelinated cortex in the entire cerebral hemisphere, is labeled Iag in Figure 7B,F. Several studies have reported that agranular insular cortex is very lightly myelinated in the macaque (Mesulam and Mufson, 1982) and human (Öngür et al., 2003). We can relate the low myelin content of anterior insular cortex to that of very lightly myelinated cingulate cortex (area 24; see above). The Von Economo and Koskinas map shows a strip of agranular cortex extending from the anterior insula laterally onto the medial portion of the planum polare (Triarhou, 2007a). Following the convention of Von Economo and Koskinas, we identify this medial cortex as area Tga (Triarhou, 2007b). This difference in the type of cortex on the medial planum polare accords with our finding of a strong gradient between medially located Tga and the temporal polar cortex (Tg). Braak (1978) describes several cortical areas on the medial planum polare as proisocortex, and the border between these areas and the more anterolateral isocortex appears parallel to the Tga/Tg gradient we find in the myelin maps (Braak, 1978). The myelin content maps of Hopf also agree with our myelin maps, showing a strip of very lightly myelinated cortex located medially on the planum polare, and then relatively more heavily myelinated cortex located laterally on the temporal pole (Hopf, 1955). Ding et al. (2009) described isocortical areas TG and TAr as extending over most of the planum polare, but this is not consistent with our myelin maps or the parcellations of Braak and Von Economo. The agranular insular and planum polare cortices are also among the thickest in the brain (Fig. 7D,H; see also Fischl and Dale, 2000; Triarhou, 2007a). Enclosed within this region is the piriform cortex (Pir) (Ding et al., 2009), which is significantly more heavily myelinated than the surrounding cortex and thinner.
Posterior to agranular insular cortex is dysgranular insular cortex (Fig. 7B,F, labeled Id). Kurth et al. (2009) generated probabilistic architectonic maps for one subdivision of this cortex, Id1, shown as a turquoise region in Figure 7B,F after volume-to-surface mapping. They also indicated that there were at least two other dysgranular subdivisions (Id2 and Id3). Areas Id1–3 are all comparably lightly myelinated in our myelin maps, though more heavily myelinated than Iag. Areas Id2 and Id3 (Fig. 7B,F, indicated by Id) are considerably thicker than Id1 in both hemispheres (Fig. 7D,H); however, we did not attempt to draw boundaries between the dysgranular cortical areas. Posterior to dysgranular insular cortex, Kurth et al. (2009) generated probabilistic architectonic maps of two divisions of granular insular cortex, Ig1 and Ig2 (Fig. 7B,D, yellow and pink, respectively, after volume-to-surface mapping). In general, the dysgranular cortex is intermediate in myelin content between agranular cortex and granular cortex, as was also reported in the macaque (Mesulam and Mufson, 1982). Ig1 may be more heavily myelinated than Ig2; however, we cannot rule out an alternative explanation arising from imperfect intersubject registration. This region contains a very steep gradient between the heavily myelinated auditory core and the adjoining lightly myelinated insular cortex. Averaging these signals in the population could lead to spuriously elevated myelin levels in the region of Ig1 showing a myelin content intermediate between the two extremes.
Posterior to frontal opercular and insular cortex is rolandic and parietal opercular cortex. Immediately inferior to areas 4 and SI are the opercular areas OP1–4 (Eickhoff et al., 2006a,b) displayed on the atlas after volume-to-surface mapping. Strong myelin or thickness gradients are lacking in this region, and the lack of surface-based cortical areas made interpretation of the weaker gradients difficult; however, several trends were apparent in both hemispheres. Area OP1 (dark blue), the putative homolog of macaque area SII according to Eickhoff et al., was moderately heavily myelinated. OP4 (olive green), is the least heavily myelinated of the opercular areas, and may correspond partially to Brodmann area 43. Eickhoff et al. (2006a,b) suggest that OP4 is the homolog of non-human primate area PV, which is somewhat less heavily myelinated than area SII (Krubitzer and Kaas, 1990; Krubitzer et al., 1995; Disbrow et al., 2003; Coq et al., 2004). OP3 (purple) is moderately heavily myelinated, and Eickhoff et al. (2006a,b) propose that it corresponds to non-human primate area VS, which is also moderately heavily myelinated (Coq et al., 2004). Area OP2 (green) appears to be more heavily myelinated than the other opercular areas, though blurring of the myelin signal from misregistration, as with Ig1, cannot be ruled out. In the macaque, cortex posteromedial to the auditory core (area proA) is relatively heavily myelinated (Pandya and Sanides, 1973), similar to area OP2. Eickhoff et al. consider area OP2 to be separate from the SII complex (SII, PV, VS), and instead consider it a homolog of parieto-insular vestibular cortex (Eickhoff et al., 2006c), which would be consistent with its different myelin profile from OP1, 3, and 4. Superior and posterior to the parietal opercular areas are divisions of parietal association area PF. After volume-to-surface mapping of the probabilistic areas of (Caspers et al., 2006, 2008), Figure 7, B and F, shows only the centers of gravity of these areas to reduce complexity. All but one of these areas (PF, PFop, PFt, PFm) are all lightly myelinated and moderately thick, and they are all distinct from area 2 anteriorly, which is thinner and more heavily myelinated. Of the PF subdivisions, PFcm (yellow) may be distinguished by more moderate myelination.
Inferior to the parietal opercular cortex is auditory cortex. The posterior two thirds of Heschl's gyrus is one of the most heavily myelinated regions of neocortex, as noted originally by Sigalovsky et al. (2006) using R1 from MRI. This region corresponds to the auditory core (C) and has been subdivided into areas TE1.0 (red) and TE 1.1 (orange) by Morosan et al. (2001). The other core subdivision, area TE1.2 (green) is less heavily myelinated. Contrary to what Siglovsky et al. reported, but consistent with Fischl et al. (2000), average cortical thickness values are notably low for areas TE1.0 and 1.1; however, this may at least in part reflect an artifactual bias of heavy myelination in segmentation and thickness estimates (see Discussion). The lateral belt (B) region, which corresponds to BA 42, is more heavily myelinated than the medial belt region. The medial belt is located anteromedial to the auditory core (Fig. 7B,F, black region surrounded by C, Ig1, and Id1) and may correspond to BA 52 (Brodmann, 1909). This difference between lateral and medial belt cortices is consistent with histological estimates of myelination in human and non-human primate auditory cortex (Hackett et al., 2001). Posterior to the belt cortex and inferior to area PFcm is a moderately heavily myelinated region that overlaps with retro-insular cortex (reI) (Kurth et al., 2009). This cortex is also relatively heavily myelinated in the macaque (Pandya and Sanides, 1973). Inferior to the early auditory regions on the posterior STG is a large region of moderately myelinated cortex that extends to the fundus of the superior temporal sulcus (STS). A moderately myelinated region in the STG has previously been described in humans (Wallace et al., 2002; Zilles, 2004), and the posterior portion of the STG has a lower T2w intensity than does the middle temporal gyrus (MTG) (Yoshiura et al., 2000). This region overlaps extensively with BA 22 and is moderately myelinated in the myelin map of Hopf (1955). The region also overlaps with the cortical termination of the superior temporal portion of the arcuate fasciculus, and likely represents auditory association cortex involved in phonologic processing (i.e., classically defined Wernicke's area) in the left hemisphere (Glasser and Rilling, 2008; Rilling et al., 2008). The most posterior part of the moderately myelinated region (inferior to the divisions of area PF) does not overlap with the arcuate termination. This posterior region has a distinctly stronger myelination signal in some individuals (Fig. 3C,I, for example), but is in a region of high interindividual folding variability [similar to an area in the intraparietal sulcus (IPS) discussed below]. Thus, it might represent a separate heavily myelinated area that has higher myelin density than auditory association cortex. Inferior to the posterior STG is lightly myelinated cortex that overlaps with temporal multimodal association cortex involved in lexical-semantic language processing in the left hemisphere (Glasser and Rilling, 2008).
Visual cortex
Because visual cortex occupies all of the occipital lobe and portions of the parietal and temporal lobes, we discuss its myelination and its parcellation from three separate views: posterolateral (Fig. 8), medial (Fig. 9), and ventral (Fig. 10). In the lateral view, we will discuss areas 17 and 18 first, then area MT (middle temporal area), and finally the region in between. In Figure 8, the myelin maps show heavy myelination at the occipital pole (Fig. 8A,F) and moderately heavy myelination in a surrounding belt of extrastriate areas that includes a “finger” extending into lateral occipitotemporal cortex in the vicinity of area MT. In general, early visual areas in occipital cortex are heavily myelinated. Areas V1/17 and V2/18 are thin, as well as heavily myelinated, making it difficult to obtain accurate myelin maps and gradients (Fig. 8B,G) in this region (see Technical limitations). We used the gradient (Fig. 8C,H) of probabilistic area 18 (Fig. 8D,I) (Amunts et al., 2000) that was surface registered (Fischl et al., 2008) to delineate the boundary of V1 plus V2. Area 17 is coextensive with retinotopic V1 (Hinds et al., 2009), but it is uncertain how closely the boundaries of area 18 and retinotopic V2 align, especially in anterior parts of the calcarine sulcus, where peripheral visual fields are represented (D.C. Van Essen, M. F. Glasser, D.L. Dierker, J. Harwell, and T. Coalson, unpublished observations). For myelin and areal gradients in Figures 8–10, we marked only gradients that are consistent across hemispheres, given that there are many uncertainties regarding the parcellation of higher extrastriate areas.
A third visual area that has surface-based cytoarchitectonic maps is area hOc5 of Malikovic et al. (2007), which corresponds approximately with functionally defined area MT+ (Wilms et al., 2005) but only partially with retinotopic MT (D.C. Van Essen, M. F. Glasser, D.L. Dierker, J. Harwell, and T. Coalson, unpublished observations). Figure 8, A and F, shows an extension of heavily myelinated cortex that completely encloses cytoarchitectonically defined area hOc5 (Fig. 8D,I); however, the myelin gradient (Fig. 8B,G) delineates a slightly larger domain than the areal gradients (Fig. 8C,H). This difference suggests that the heavily myelinated region includes other heavily myelinated portions of the MT+ complex, perhaps including middle superior temporal area (MST) and floor of superior temporal area (FST) (Huk et al., 2002; Kolster et al., 2010). In humans, area MT is heavily myelinated (Clarke and Miklossy, 1990; Clarke, 1994; Tootell and Taylor, 1995), and identification of this area by the myelin mapping technique further supports its validity. The MT+ region is surrounded ventrally, anteriorly and superiorly by a band of moderately myelinated cortex that transitions into lightly myelinated cortex of the inferior parietal lobe (areas PGa and PGp from Caspers et al., 2006), middle temporal gyrus, and ventral temporal cortex. The anterior myelin transition is near the termination of the arcuate fasciculus in the middle temporal gyrus (Glasser and Rilling, 2008).
Cortex immediately anterior to area 18 and posterior to area MT in these lateral views is relatively heavily myelinated compared with the lightly myelinated cortex in the parietal lobe, but is not of uniform myelin content. Consistent gradients in both hemispheres enable demarcation of three myelin-based ROIs in this region (Fig. 8B,G, 1–3). These are only in approximate correspondence with the retinotopic areas from the Swisher et al. (2007) and Kolster et al. (2010) parcellations that were mapped to the atlas (Fig. 8E,J) (D. C. Van Essen, M. F. Glasser, D. L. Dierker, J. Harwell, and T. Coalson, unpublished observations). These retinotopic maps represent two of many visual cortical parcellations in the literature, and the exact retinotopic parcellation of higher extrastriate visual cortex remains a matter of debate (Hansen et al., 2007; Georgieva et al., 2009). The most dorsal ROI (1, Fig. 8B,G) includes most of V3A and parts of V3B on the lateral surface, but extends onto the medal surface (Fig. 9). The middle ROI (2, Fig. 8B,G) is more heavily myelinated and overlaps most with V3B, but also with LO. The inferior ROI (3, Fig. 8B,G) overlaps with area LO as defined in both studies and is the most lightly myelinated of the three ROIs. The superior limit of heavily myelinated visual cortex (above ROI1) is near the border between areas V7 and V3A. More moderately myelinated cortex (including V7) extends along the medial bank of the IPS, where Swisher et al. (2007) also reported multiple additional retinotopic visual areas (Fig. 11).
On the medial surface (Fig. 9), the heavily myelinated cortex of areas 17 and 18 dominates, but technical artifacts make the myelin gradients in and near the calcarine sulcus essentially uninterpretable (see Technical limitations). Dorsal to area 18 is a wedge of heavily myelinated cortex whose areal identity is unknown except that it may partially overlap with area V6 in the left hemisphere (Pitzalis et al., 2006). More anteriorly, in the anterior bank of the parieto-occipital sulcus (POS), there are three ROIs of distinct myelin content: an inferior moderately myelinated area, a middle heavily myelinated area, and a superior moderately myelinated area. The histological and functional correlates of these areas are unclear, as this sulcal part of human cortex has not been extensively studied. We have named these regions POS1, POS2, and POS3 from ventral to dorsal, as we were unable to correlate them with published cortical parcellations, although it has been noted that there are multiple cortical areas of heterogenic cytoarchitecture in this region (Scheperjans et al., 2008a). Cortex in the vicinity of POS1 is activated in mental navigation tasks, and it has been suggested to be homologous to macaque area V6A (Ino et al., 2002), though human V6 (Pitzalis et al., 2006) does not adjoin this region. Anterior to this sulcal region is more lightly myelinated posterior cingulate cortex including areas 31 and 23a,b (Fig. 6A,E). Anterior and further superior are areas 7m and 7p (Scheperjans et al., 2008a,b), which appear to have little or no overlap with these 3 parieto-occipital sulcus areas. Between area 18 and the corpus callosum is a strip of relatively lightly myelinated cortex, the area properistriata (A.P.) (Braak, 1977). Ventral and anterior to area 18 is a swath of heavily myelinated cortex that includes areas hOC3v/V3v and hOC4v/V4v (Rottschy et al., 2007), whose centers of gravity have been mapped as foci on the surface.
Figure 10 shows ventral views of the visual cortex, including the border between areas 17 plus 18 and higher visual cortex and the same centers of gravity of hOC3v and hOC4v from Rottschy et al. (2007). Extending anteriorly along the medial portion of the fusiform gyrus (Fig. 10A,D, downward) is a finger of cortex that is more heavily myelinated than cortex on either side. To assess its relationship to the fusiform face area (FFA), we mapped the face-selective activation pattern reported by Rajimehr et al. (2009) for the right hemisphere onto both the left and right hemisphere atlas surfaces (Fig. 10C,F). (Their data were not available for the left hemisphere.) The medial boundary of the FFA activation (Fig. 10C,F, yellow-to-blue transition) is closely aligned to a myelin gradient between moderate myelination laterally (within FFA) and heavier myelination medially, overlapping with the parahippocampal place area (Epstein et al., 1999). The myelin content maps of Hopf show more heavily myelinated strip along the fusiform gyrus (Hopf, 1955), though the strip in Hopf appears to extend further anterior than it does in our data (but see Technical limitations in this region).
Superior parietal and IPS cortex
Within the IPS, a strip of moderate myelination runs along the full extent of the medial bank in the group average results (Fig. 11B,F). This strip overlaps extensively with cortical areas V7 and IPS1-4 defined in a retinotopic fMRI study (Swisher et al., 2007) (Fig. 11D,H). A restricted focus of modestly heavier myelination is present on the medial wall of the IPS (Fig. 11B,F, dotted outline); however, the intensity is much lower than in the exemplar individual subject (compare Fig. 3A,G vs C,I). A plausible explanation is that intersubject alignment is relatively poor in this region, because of the high degree of folding variability and the inability of surface-based registration using only cortical shape features (“average convexity”) to align architectonically corresponding areas. Hence, the peaks of heaviest myelination may remain spatially dispersed when averaged across subjects. A similar problem may affect the heavily myelinated posterior STS area mentioned above (compare Fig. 7). Therefore, the heavily myelinated IPS area, which is relatively consistently identifiable in individuals (data not shown) may not be as well aligned as the other heavily myelinated structures in more consistently folded regions. This region is also evident in the myelin content maps of Hopf on the anterior part of the medial bank of the IPS (Hopf and Vitzthum, 1957). The border of this area colocalizes with transitions in functional connectivity maps (Glasser et al., 2011), adding further evidence that it is a distinct functional area.
One intriguing possibility is that this area is the human homolog of the heavily myelinated macaque area LIPv (Lewis and Van Essen, 2000). Several neuroimaging studies reviewed by Grefkes and Fink (2005) have suggested that human LIP is located on the medial bank of the posterior IPS (Sereno et al., 2001; Koyama et al., 2004; Orban et al., 2006; Swisher et al., 2007). Figure 11 shows the anterior and posterior IPS stereotaxic coordinates reported in these studies plus that of Shulman et al. (2003) plotted as spherical foci. The posterior activations lie within moderately myelinated cortex of the posterior IPS in both hemispheres but are not centered on the most heavily myelinated portion. Of these studies, Shulman et al. is closest. The anterior IPS activations are also not centered on the heavily myelinated region. The center of gravity of the nearby cytoarchitectonically defined area hIP3 (orange cube) (Scheperjans et al., 2008a) overlaps with the heavily myelinated area in the left but not right hemisphere. To fully disentangle the homologies in the highly variable medial IPS, it will be valuable to perform myelin mapping together with a saccade task in individual humans and macaques. The rest of the superior and medial parietal cortices are relatively lightly myelinated, similar to inferior parietal cortex, frontal cortex, and temporal cortex, suggesting that they are association regions.
Hippocampal/parahippocampal cortex
The hippocampal/parahippocampal region includes heavy myelination that corresponds to the subiculum complex (subiculum, presubiculum, and parasubiculum). Figure 12 compares myelin maps (B,D) to the probabilistic map of the subiculum complex (C,E) from Amunts et al. (2005). This volumetric probabilistic map was mapped to the fs_LR surface; however, because of the reduced precision afforded by this method, we did not attempt to analyze areal gradients. The combined histological and high-resolution structural and diffusion MRI study of Augustinack et al. (2010) shows that the presubiculum is more heavily myelinated than surrounding cortex, particularly in the superficial layers. This heavier myelination corresponds to fibers from the perforant pathway collecting in the superficial layers of cortex (Augustinack et al., 2010) and explains the signal we see in the myelin map.
Frontal eye fields and neighboring cortex
The last region in which we consider myelin maps is the cortex around the frontal eye fields (FEFs). Figure 13 shows myelin maps (A,C) and probabilistic maps of area 6 (B,D) together with a number of stereotaxic foci from functional neuroimaging and electrophysiological studies of eye movements. As noted previously (compare Fig. 4), area 6 is heterogeneously myelinated. Some cortex that is anterior to area 6 is also moderately heavily myelinated, including cortex on the anterior bank of the precentral sulcus next to the middle frontal gyrus and cortex of the inferior frontal sulcus (Fig. 13A,C). In the macaque, the portion of the FEFs with the lowest threshold for stimulating eye movements is associated with a distinct architectonic area, 8Ac, which is more heavily myelinated than surrounding cortex (Stanton et al., 1989; Preuss and Goldman Rakic, 1991). The region of the FEFs is also more heavily myelinated than neighboring cortex in the marmoset (Krubitzer and Kaas, 1990).
Figure 13.
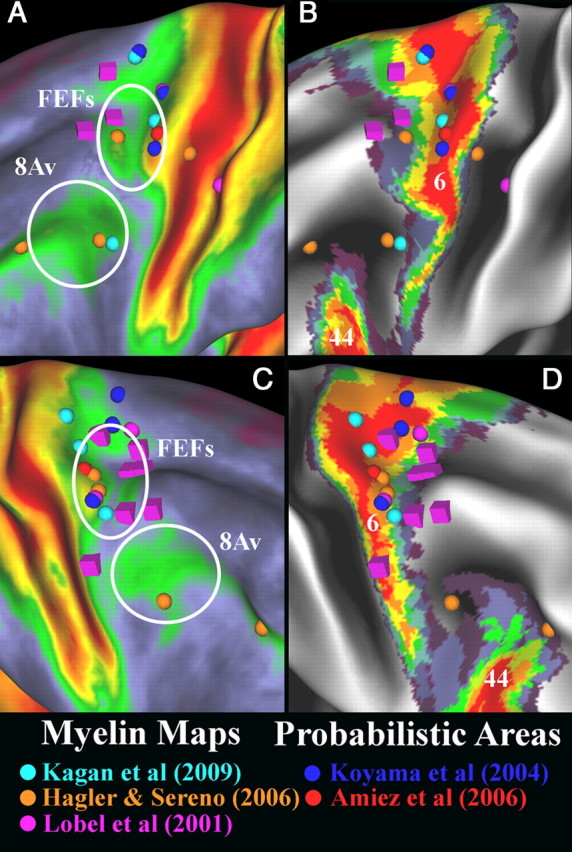
A–D, Myelin maps and probabilistic areas 6 from Geyer (2004) and 44 from Amunts et al. (1999). A and B are the left hemisphere, and C and D are the right hemisphere. Foci from several fMRI studies of regions activated by saccade tasks are shown for both hemispheres as spheres. One study (Lobel et al., 2001) also used electrical stimulation to elicit saccades, and their stimulation coordinates are marked by cubes. The dorsal ellipse surrounds the region of overlap between fMRI activations, saccades elicited by stimulation, and moderate to heavy cortical myelination that is the most likely location of the FEFs. The ventral ellipse surrounds a region that may be area 8Av.
To test whether functionally defined human FEFs colocalize with more heavily myelinated cortex, we plotted stereotaxic coordinates from several functional neuroimaging studies of saccades (Lobel et al., 2001; Koyama et al., 2004; Amiez et al., 2006; Hagler and Sereno, 2006; Kagan et al., 2010). A cluster of eye-movement activation peaks (spheres) is centered on the posterior bank of the precentral sulcus in locally heavily myelinated cortex (Fig. 13A,C, ellipses). The anterior bank also contains a cluster of foci where electrical stimulation elicited saccades (Lobel et al., 2001), and this cluster also colocalizes with a spot of heavier myelination (Fig. 13A,C, cubes). A second electrical stimulation study described a similar location (Blanke et al., 2000) in their figures. Electrical stimulation results tend to localize in cortex anterior to area 6 in macaques and humans, whereas fMRI results tend to localize in area 6 (Amiez and Petrides, 2009). This discrepancy is apparent in our meta-analysis as well (Fig. 13B,D). Both clusters appear to have heavier myelination than surrounding cortex, however. Preuss and colleagues noted that it was possible to elicit eye movements from cortex surrounding the lowest threshold area FEF (anterior to area 6), and in particular parts of adjacent rostral premotor cortex (area 6) in the owl monkey (Preuss et al., 1996). Given this evidence, at least two heavily myelinated frontal eye fields may be present in humans, one on the anterior bank of the precentral sulcus and one on the posterior bank.
Ventral to the putative FEFs is a region of moderate myelin content in the posterior portion of the inferior frontal sulcus (Fig. 13A,C). This cortex is also anterior to probabilistic area 6 and superior to probabilistic area 44 (Fig. 13B,D). According to Petredies and Pandya (1999), this region would correspond to area 8Av in the human, given its topographical relationships to areas 6 and 44. The myelin content maps of Hopf (1956) also show a region of moderately increased myelination in a corresponding location to putative 8Av.
Technical limitations
The preceding sections demonstrate that myelin mapping can identify many cortical areas and putative areas in both individuals and group data acquired with different scanners and pulse sequences. Nonetheless, the technique has limitations that can cause artifactual results of two main types: (1) artifacts in the MRI volumes themselves (chiefly susceptibility-induced dephasing and resultant signal loss of the gradient echo-based T1w images), and (2) imperfect surface reconstructions (where if the surface reconstruction were perfect, the artifact would not be present, because the volumetric data are accurate).
MR-induced myelin map artifacts are limited to regions very close to air/tissue interfaces. The same regions also affect fMRI, though they are more restricted in their extent in the myelin maps. Orbitofrontal cortex on the crowns of the gyrus rectus and medial orbital gyrus contains regions of spurious hyperintensity because of the sphenoid sinus. The cortex of the frontal pole adjacent to the frontal sinus also contains regions of increased signal variability and intensity that may be related to susceptibility artifacts. Finally, in the temporal lobe, the middle portion of the fusiform gyrus contains regions of hyperintensity that are related to susceptibility-induced dephasing from the mastoid air cells. The myelin map hyperintensities are caused by signal loss in the superficial layers of cortex near sinuses, which lead to artificially thin cortex that overrepresents the more heavily myelinated deeper layers. These artifacts might be improved by using spin-echo-based T1w images that would not suffer from dephasing and signal loss.
Artifacts caused by imperfect surface reconstructions could be improved by better surface reconstruction algorithms or higher-resolution data, because the volumetric T1w/T2w ratio data are accurate in these regions. These artifacts take two forms (termed Type A and Type B errors here), and the amount of each appears to depend on the exact acquisition parameters of the T1w image used to generate the cortical surface. The first form (Type A) involves hypointensities in cortex that is thin and heavily myelinated, particularly in association with thin gyral blades of white matter. These artifacts occur principally on the postcentral gyrus in area 3b and in the occipital lobe in early visual cortex (V1, V2, and perhaps V3). In these regions, cortex at 1 mm isotropic resolution may be as little as one voxel thick. FreeSurfer has significant difficulty in segmenting these regions because the heavily myelinated gray matter intensity differs only modestly from that of white matter. Partial-volume voxels of CSF and gray matter have a signal that appears to FreeSufer to be more like gray matter than the heavily myelinated full-volume gray matter voxels, which look more like white matter. FreeSurfer's algorithm may place the white matter surface just below the partial-volume voxels and the pial surface just above them. This error leads to artificially low T1w/T2w ratio values and underestimates cortical thickness. The second form (Type B) of surface reconstruction artifact involves hyperintensities in regions of thick lightly myelinated cortex, particularly in frontal and cingulate areas. In these cases, the superficial layers of gray matter are more similar in intensity to CSF than to the deeper layers. FreeSurfer's algorithm may place the pial surface too deep in the cortex, and thus produce an artificially high T1w/T2w ratio and also underestimate cortical thickness. In our experience, the Type B error predominates when the TI is set lower (e.g., 900 ms), and the Type A error predominates when it is high (e.g., 1100 ms) for an 8° flip angle. We attempted to minimize the impact of these artifacts by using the outlier detection algorithm described in Materials and Methods and doing our primary analysis on the group average data; however, significant improvements are likely feasible. The main results presented here were carefully vetted to ensure that they were present in volume slices of the individual subject as well and were not attributable to MR artifacts or surface reconstruction errors.
Discussion
Few studies have made surface maps of myelin content in cortical gray matter using MRI, or used differences in myelin content to identify cortical areas in vivo. Previous studies have demonstrated proof of concept by showing that cortical myelin content can be estimated in vivo and used to identify one or a few cortical areas (see Introduction). The present study shows that regional differences in myelin content can be objectively assessed across nearly all of cerebral cortex after mapping the MRI-derived T1w/T2w ratio to the surface, producing myelin maps. This analysis was made possible by improvements in bias field removal, mapping of cortical gray matter voxels to the surface, and surface-constrained smoothing to reduce noise.
Using population-average myelin maps and their gradients, coupled with cortical thickness maps and their gradients, we were able to largely or completely delineate dozens of cortical areas and candidate areas. Areas were identified by comparisons with parcellation schemes mapped to the same atlas surface, in particular, surface-based probabilistic cytoarchitectonic areas (Fischl et al., 2008), and by using figures in published cortical parcellation studies. Where possible, we also compared our myelin maps with histological myeloarchitectural studies in humans and non-human primates. In general, primary and early unimodal areas are more heavily myelinated than multimodal association areas. For example, motor, somatosensory, visual, and auditory cortices are all heavily myelinated, whereas prefrontal, temporal, parietal, insular, and cingulate association cortices are more lightly myelinated. Notable exceptions to this trend include the heavily myelinated orbitofrontal area 47m, retrosplenial cortex, areas on the medial bank of the IPS, in the STS, in the parieto-occipital sulcus, and the frontal eye fields. Also, primary gustatory cortex is relatively lightly myelinated, being less heavily myelinated than a neighboring gustatory association area (PrCO) both in our data and in the marmoset (Burman and Rosa, 2009), and thus it is an exception to the trend of primary areas being heavily myelinated. Our results raise intriguing questions about the cause and functional significance of differences in myelin content across the cortical gray matter.
Several neurobiological and technical issues warrant further discussion. Neurobiological issues include the anatomical basis of myelin content heterogeneity within motor areas, spatial correlations between myelin content and neuronal density, cortical expansion during evolution and development, and the progression of subcortical myelination during development. Technical issues include potential methodological improvements, the relationship between cortical thickness and myelin maps, and comparing myelin maps across studies and subject groups.
Myelin map heterogeneity in motor areas
Myelin evolved as a way to speed conduction along axons, and is present in most long-distance projection neurons of the CNS. Corticospinal projections may be more heavily myelinated because they must traverse long distances to reach their spinal cord targets. These distances are much greater for lower versus upper body projections, and larger axons and heavier myelination may help offset the additional time delay. If efferent connections contribute substantially to myelin content of a cortical area, or if heavily myelinated outputs are correlated with heavy myelination of input connections and/or intrinsic connections, this could account for the observed tendency for myelin content to be greater in motor regions representing the lower body compared with the upper body in areas 4, 6, and 24d.
Correlations of myelin with neuronal density and cortical expansion in development and evolution
Hill et al. (2010) noted a correlation between neuronal cell density and cortical expansion in human postnatal development and primate evolution. We find that myelin content is closely correlated with all three patterns. Collins et al. (2010) analyzed neuronal cell density across the entire hemisphere in the macaque and two other non-human primates. They reported high neuronal densities in a number of heavily myelinated areas, including area V1, early visual association areas, primary auditory and primary sensory areas, early sensory association areas, and area MT. Lightly myelinated multimodal association areas in the STS, IPL, SPL, frontal, and cingulate cortices tended to have relatively low neuronal densities in the macaque. In general, regions with relatively low neuronal densities and myelin content have more complex dendritic arbors, larger somas and dendritic field sizes, and more spines than regions with higher neuron densities (Elston et al., 2001). Collins et al. have suggested that early cortical sensory processing is highly parallel and uses a large number of neurons with small dendritic arbors, resulting in high neuronal density. Conversely, areas involved in “higher” functions use neurons with large dendritic arbors and many synapses, resulting in lower neuronal density. Thus, a key determinant of myelin content in different areas may be the density of neurons, leading to an increased density of myelinated axons exiting and perhaps also entering the cortex. Other potentially important factors are the density of tangential fibers and the thickness of the lightly myelinated superficial layers (i.e., above layer IV) relative to the more heavily myelinated deep layers.
Another interesting correlation is between myelin maps and cortical expansion during human postnatal maturation (Hill et al., 2010). The regions with high areal expansion tend to be lightly myelinated, including prefrontal, inferior parietal, lateral temporal, and anterior cingulate cortices. Regions with low areal expansion, including primary motor, primary sensory, primary auditory, and early visual cortices, tend to be heavily myelinated. A similar correlation exists between myelin content and maps of cortical expansion generated by registering human and macaque cortex using landmarks that reflect known or presumed homologies (Van Essen and Dierker, 2007). Lightly myelinated regions have expanded much more than heavily myelinated regions during human evolution. Importantly, generation of myelin maps for macaque and chimpanzee cortex is technically feasible. Such myelin maps may enable a detailed comparison of cortical areal homologies based on the hypothesis that myelin profiles are largely preserved during primate evolution. Group average myelin maps may also provide a substrate for improved cross-species landmark-based surface registrations that use architectonic features along with conventionally defined homologies. Myelin maps may also be useful in improving registration of regions with highly variable folding patterns across subjects, such as the IPS and STS.
Correlations of myelin content with the order of subcortical myelination during development
Over 100 years ago, Paul Flechsig mapped the myelination order of white matter beneath the cortical sheet during perinatal development. His map (Fig. 14) is widely reproduced (Fuster, 1995, 1997), and highlights the heavily myelinated primary sensory and motor cortices as myelinating first (darkest shading). Most of the nonprimary heavily myelinated areas also myelinate early, including an orbitofrontal region near area 47m, retrosplenial cortex, the subiculum, the heavily myelinated area in the IPS, area MT, and the cingulate motor area. Lightly myelinated areas tend to myelinate later in Flechsig's analysis, including prefrontal, inferior parietal, middle and inferior temporal, and anterior cingulate cortices. In short, there is a striking correlation between high adult gray matter myelin content and early white matter myelination versus low myelin content and late myelination.
Figure 14.
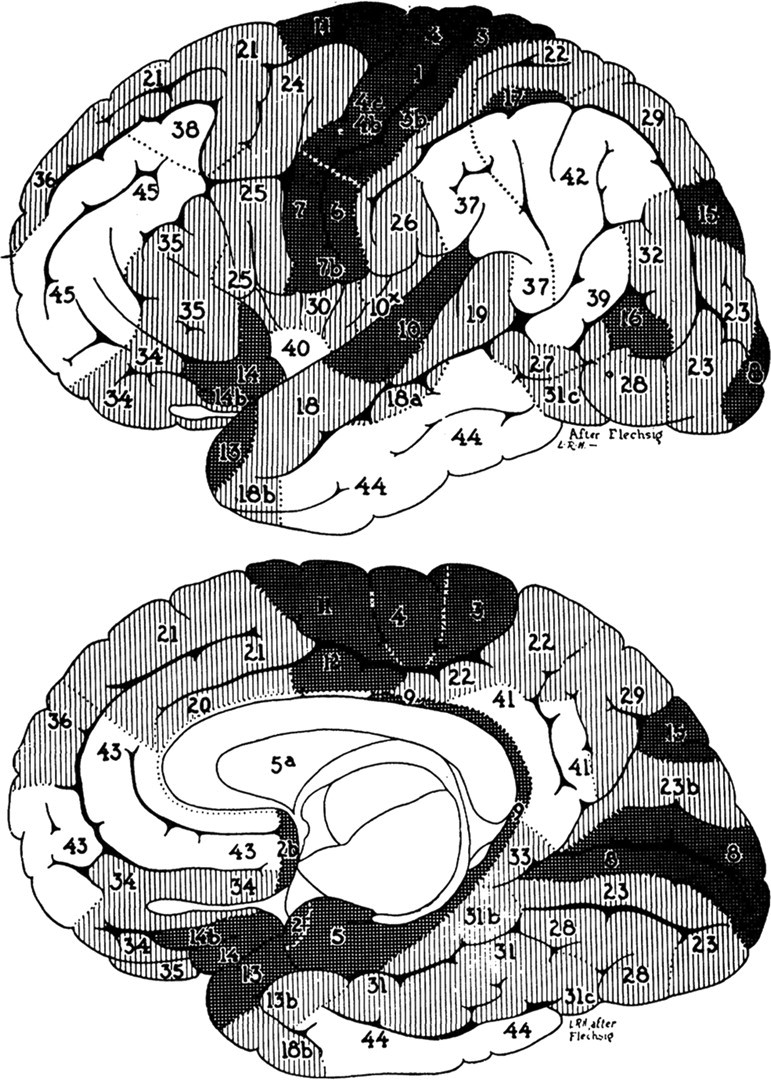
Map of subcortical myelination during development by Flechsig, modified by Von Bonin (1950). Darkly shaded regions myelinate first, then intermediate shaded regions myelinate, and finally, unshaded regions myelinate last. The order of myelinatation is given by the numbers.
Potential methodological refinements
As discussed in Technical limitations, imperfect surface reconstructions present more significant limitations to this technique than do the principles behind the T1w/T2w ratio. Errors in surface reconstruction are especially common in regions such as early visual cortex, where they strongly affect the group average data; however, individuals often have artifacts irregularly distributed across the cortical surface. These errors limit the current utility of myelin gradients for estimating areal boundaries in individuals. Improvements in image resolution and surface reconstruction algorithms may improve individual myelin maps. Higher resolution would also allow for measurement of the myelination profile across the cortical thickness, i.e., to do laminar-based myeloarchitectonics. The algorithms presented here are also applicable to other bias field-free measures of cortical myelin, including T1, T2*, or the M2PRAGE (Marques et al., 2010).
Interaction between myelin and cortical thickness measurements
Cortical thickness corrected for surface curvature is generally inversely related to myelin content, with more heavily myelinated cortex being thinner (except for primary motor cortex), and thicker cortex being more lightly myelinated [except for the thin lightly myelinated cortex of the frontal pole (Triarhou, 2007a)]. The cause of this relationship is twofold. (1) Cortex that is more heavily myelinated tends to be thinner as measured histologically; e.g., thin somatosensory and visual cortex versus thick superior frontal, inferior parietal, and temporal cortices. (2) In heavily myelinated cortex, the deeper layers may be difficult to distinguish from white matter, which may lead to artificially thin estimates of cortical thickness (see Technical limitations, Type A errors). The auditory core, which appears thin in Figure 7, is not found to be thinner histologically (Triarhou, 2007a), for example. The interaction between cortical thickness and myelin content also works against our ability to accurately measure myelin content, as it is most frequently underestimated in thin heavily myelinated regions. The dependence of cortical thickness measures on myelin content may affect the interpretation of the growing number of studies measuring cortical thickness, as group differences in cortical thickness may in part reflect systematic differences in myelin content.
Quantitative comparison of myelin maps across subject groups and studies
An obvious next step would be to compare controls and diseased groups, as the short scans needed to acquire myelin mapping data are applicable to clinical populations. Myelin mapping gives highly consistent local patterns of relative variation in the gray matter across different scanners and sequences, given high-resolution 1 × 1 × 1 mm data or better (Fig. 3). A cautionary note is warranted, however, as the T1w/T2w ratio is a unitless quantity based on unitless raw intensity data. The myelin map values are simply the ratio of the raw intensities of the T1w and T2w images and will vary in absolute magnitude depending upon what those intensities are. Therefore, absolute myelin map values of a given region of cortex may differ according to the physical scanner or pulse sequence (Fig. 2). It may be possible to use the relative percentage difference between the myelin map values of a region and the average myelin map value of the whole brain, but this would need validation. Also, because the method is dependent on highly accurate structural images, groups that differ in degree or incidence of head motion might have systematic biases in their myelin map values because of different degrees of image blur.
Conclusions
No single imaging modality is likely to be adequate in identifying the estimated 150–200 cortical areas per hemisphere in humans (D.C. Van Essen, M. F. Glasser, D.L. Dierker, J. Harwell, and T. Coalson, unpublished observations). However, progress may be accelerated by using a multimodal approach involving structural and functional imaging performed on each individual. The Human Connectome Project (http://humanconnectome.org) will use surface-based methods to analyze structural connectivity, resting-state functional connectivity, task-evoked fMRI, and myelin mapping in each of 1200 normal human subjects. Such multimodal comparisons would ideally be performed with an observer-independent approach that used gradients in the various modalities to delimit cortical areas and identified areas based on their unique patterns of myelin content, structural and functional connectivity, and task activations. Such an approach would go beyond the results presented here and lead to a more accurate parcellation of the cortex. Cross-modal comparisons of myelin maps with resting state fMRI (Glasser et al., 2011) and the other modalities, coupled with careful study of a rapidly growing body of anatomical and functional information, may greatly increase our understanding of how to parcellate the complex cortical mosaic.
Footnotes
This work was supported by NIH Grant R01 MH-60974 and by the Human Connectome Project (1U54MH091657-01) from the 16 NIH Institutes and Centers that support the NIH Blueprint for Neuroscience Research. M.F.G. was supported by a National Research Science Award–Medical Scientist NIH T32 GM007200. The Conte Center data were provided by John G. Csernansky with assistance from Michael Harms and Lei Wang and were acquired through support from NIH Grants MH056584 and MH071616. The NAMIC multimodality data were provided by the Psychiatry Neuroimaging Laboratory and the Surgical Planning Laboratory at Brigham and Women's Hospital, supported in part by grants from the National Alliance for Medical Image Computing (NAMIC-U54 EB005149), and a Neuroimage Analysis Center grant (NACP41 RR 13218). Computations were performed using facilities of the Washington University Center for High Performance Computing, partially supported by Grant NCRR 1S10RR022984-01. We thank Todd Preuss for discussions that helped stimulate this project, consultations on anatomical findings, and comments on this manuscript; Joel Price for consultations on anatomical findings; and John Harwell and Tim Coalson for software development.
References
- Amiez C, Petrides M. Anatomical organization of the eye fields in the human and non-human primate frontal cortex. Prog Neurobiol. 2009;89:220–230. doi: 10.1016/j.pneurobio.2009.07.010. [DOI] [PubMed] [Google Scholar]
- Amiez C, Kostopoulos P, Champod AS, Petrides M. Local morphology predicts functional organization of the dorsal premotor region in the human brain. J Neurosci. 2006;26:2724–2731. doi: 10.1523/JNEUROSCI.4739-05.2006. [DOI] [PMC free article] [PubMed] [Google Scholar]
- Amunts K, Schleicher A, Bürgel U, Mohlberg H, Uylings HB, Zilles K. Broca's region revisited: cytoarchitecture and intersubject variability. J Comp Neurol. 1999;412:319–341. doi: 10.1002/(sici)1096-9861(19990920)412:2<319::aid-cne10>3.0.co;2-7. [DOI] [PubMed] [Google Scholar]
- Amunts K, Malikovic A, Mohlberg H, Schormann T, Zilles K. Brodmann's areas 17 and 18 brought into stereotaxic space—where and how variable? Neuroimage. 2000;11:66–84. doi: 10.1006/nimg.1999.0516. [DOI] [PubMed] [Google Scholar]
- Amunts K, Kedo O, Kindler M, Pieperhoff P, Mohlberg H, Shah NJ, Habel U, Schneider F, Zilles K. Cytoarchitectonic mapping of the human amygdala, hippocampal region and entorhinal cortex: intersubject variability and probability maps. Anat Embryol. 2005;210:343–352. doi: 10.1007/s00429-005-0025-5. [DOI] [PubMed] [Google Scholar]
- Amunts K, Lenzen M, Friederici A, Schleicher A, Morosan P, Palomero-Gallagher N, Zilles K. Broca's region: novel organizational principles and multiple receptor mapping. PLoS Biol. 2010;8:330–357. doi: 10.1371/journal.pbio.1000489. [DOI] [PMC free article] [PubMed] [Google Scholar]
- Augustinack JC, Helmer K, Huber KE, Kakunoori S, Zöllei L, Fischl B. Direct visualization of the perforant pathway in the human brain with ex vivo diffusion tensor imaging. Front Hum Neurosci. 2010;4:42. doi: 10.3389/fnhum.2010.00042. [DOI] [PMC free article] [PubMed] [Google Scholar]
- Barbas H, Pandya D. Architecture and frontal cortical connections of the premotor cortex (area 6) in the rhesus monkey. J Comp Neurol. 1987;256:211–228. doi: 10.1002/cne.902560203. [DOI] [PubMed] [Google Scholar]
- Barbas H, Pandya DN. Architecture and intrinsic connections of the prefrontal cortex in the rhesus monkey. J Comp Neurol. 1989;286:353–375. doi: 10.1002/cne.902860306. [DOI] [PubMed] [Google Scholar]
- Barbier EL, Marrett S, Danek A, Vortmeyer A, van Gelderen P, Duyn J, Bandettini P, Grafman J, Koretsky AP. Imaging cortical anatomy by high-resolution MR at 3.0 T: detection of the stripe of Gennari in visual area 17. Magn Reson Med. 2002;48:735–738. doi: 10.1002/mrm.10255. [DOI] [PubMed] [Google Scholar]
- Belmalih A, Borra E, Contini M, Gerbella M, Rozzi S, Luppino G. Multimodal architectonic subdivision of the rostral part (area F5) of the macaque ventral premotor cortex. J Comp Neurol. 2009;512:183–217. doi: 10.1002/cne.21892. [DOI] [PubMed] [Google Scholar]
- Blanke O, Spinelli L, Thut G, Michel CM, Perrig S, Landis T, Seeck M. Location of the human frontal eye field as defined by electrical cortical stimulation: anatomical, functional and electrophysiological characteristics. Neuroreport. 2000;11:1907–1913. doi: 10.1097/00001756-200006260-00021. [DOI] [PubMed] [Google Scholar]
- Bock N, Kocharyan A, Liu JV, Silva AC. Visualizing the entire cortical myelination pattern in marmosets with magnetic resonance imaging. J Neurosci Methods. 2009;185:15–22. doi: 10.1016/j.jneumeth.2009.08.022. [DOI] [PMC free article] [PubMed] [Google Scholar]
- Braak H. The pigment architecture of the human occipital lobe. Anat Embryol. 1977;150:229–250. doi: 10.1007/BF00316652. [DOI] [PubMed] [Google Scholar]
- Braak H. The pigment architecture of the human temporal lobe. Anat Embryol. 1978;154:213–240. doi: 10.1007/BF00304663. [DOI] [PubMed] [Google Scholar]
- Braak H. Pigment architecture of the human telencephalic cortex. IV. Regio retrosplenialis. Cell Tissue Res. 1979a;204:431–440. doi: 10.1007/BF00233654. [DOI] [PubMed] [Google Scholar]
- Braak H. The pigment architecture of the human frontal lobe. Anat Embryol. 1979b;157:35–68. doi: 10.1007/BF00315640. [DOI] [PubMed] [Google Scholar]
- Braak H. Pigment architecture of the human telencephalic cortex. V. Regio anterogenualis. Cell Tissue Res. 1979c;204:441–451. doi: 10.1007/BF00233655. [DOI] [PubMed] [Google Scholar]
- Bridge H, Clare S, Jenkinson M, Jezzard P, Parker AJ, Matthews PM. Independent anatomical and functional measures of the V1/V2 boundary in human visual cortex. J Vis. 2005;5:93–102. doi: 10.1167/5.2.1. [DOI] [PubMed] [Google Scholar]
- Brodmann K. Leipzig: Barth; 1909. Vergleichende Lokalisationslehre der Grosshirnrinde in ihren Prinzipien dargestellt auf Grund des Zellenbaues. [Google Scholar]
- Brodmann K, Garey L. New York: Springer; 2006. Brodmann's Localisation in the cerebral cortex: the principles of comparative localisation in the cerebral cortex based on the cytoarchitectonics. [Google Scholar]
- Burman KJ, Rosa MG. Architectural subdivisions of medial and orbital frontal cortices in the marmoset monkey (Callithrix jacchus) J Comp Neurol. 2009;514:11–29. doi: 10.1002/cne.21976. [DOI] [PubMed] [Google Scholar]
- Caspers S, Geyer S, Schleicher A, Mohlberg H, Amunts K, Zilles K. The human inferior parietal cortex: cytoarchitectonic parcellation and interindividual variability. Neuroimage. 2006;33:430–448. doi: 10.1016/j.neuroimage.2006.06.054. [DOI] [PubMed] [Google Scholar]
- Caspers S, Eickhoff SB, Geyer S, Scheperjans F, Mohlberg H, Zilles K, Amunts K. The human inferior parietal lobule in stereotaxic space. Brain Struct Funct. 2008;212:481–495. doi: 10.1007/s00429-008-0195-z. [DOI] [PubMed] [Google Scholar]
- Clare S, Bridge H. Methodological issues relating to in vivo cortical myelography using MRI. Hum Brain Mapp. 2005;26:240–250. doi: 10.1002/hbm.20162. [DOI] [PMC free article] [PubMed] [Google Scholar]
- Clark VP, Courchesne E, Grafe M. In vivo myeloarchitectonic analysis of human striate and extrastriate cortex using magnetic resonance imaging. Cereb Cortex. 1992;2:417–424. doi: 10.1093/cercor/2.5.417. [DOI] [PubMed] [Google Scholar]
- Clarke S. Modular organization of human extrastriate visual cortex: evidence from cytochrome oxidase pattern in normal and macular degeneration cases. Eur J Neurosci. 1994;6:725–736. doi: 10.1111/j.1460-9568.1994.tb00984.x. [DOI] [PubMed] [Google Scholar]
- Clarke S, Miklossy J. Occipital cortex in man: Organization of callosal connections, related myelo and cytoarchitecture, and putative boundaries of functional visual areas. J Comp Neurol. 1990;298:188–214. doi: 10.1002/cne.902980205. [DOI] [PubMed] [Google Scholar]
- Cohen AL, Fair DA, Dosenbach NU, Miezin FM, Dierker D, Van Essen DC, Schlaggar BL, Petersen SE. Defining functional areas in individual human brains using resting functional connectivity MRI. Neuroimage. 2008;41:45–57. doi: 10.1016/j.neuroimage.2008.01.066. [DOI] [PMC free article] [PubMed] [Google Scholar]
- Collins CE, Airey DC, Young NA, Leitch DB, Kaas JH. Neuron densities vary across and within cortical areas in primates. Proc Natl Acad Sci U S A. 2010;107:15927–15932. doi: 10.1073/pnas.1010356107. [DOI] [PMC free article] [PubMed] [Google Scholar]
- Coq JO, Qi H, Collins CE, Kaas JH. Anatomical and functional organization of somatosensory areas of the lateral fissure of the New World titi monkey (Callicebus moloch) J Comp Neurol. 2004;476:363–387. doi: 10.1002/cne.20237. [DOI] [PubMed] [Google Scholar]
- Dale AM, Fischl B, Sereno MI. Cortical surface-based analysis. I. Segmentation and surface reconstruction. Neuroimage. 1999;9:179–194. doi: 10.1006/nimg.1998.0395. [DOI] [PubMed] [Google Scholar]
- de Araujo I, Rolls ET, Kringelbach ML, McGlone F, Phillips N. Taste olfactory convergence, and the representation of the pleasantness of flavour, in the human brain. Eur J Neurosci. 2003;18:2059–2068. doi: 10.1046/j.1460-9568.2003.02915.x. [DOI] [PubMed] [Google Scholar]
- Ding SL, Van Hoesen GW, Cassell MD, Poremba A. Parcellation of human temporal polar cortex: a combined analysis of multiple cytoarchitectonic, chemoarchitectonic, and pathological markers. J Comp Neurol. 2009;514:595–623. doi: 10.1002/cne.22053. [DOI] [PMC free article] [PubMed] [Google Scholar]
- Disbrow E, Litinas E, Recanzone GH, Padberg J, Krubitzer L. Cortical connections of the second somatosensory area and the parietal ventral area in macaque monkeys. J Comp Neurol. 2003;462:382–399. doi: 10.1002/cne.10731. [DOI] [PubMed] [Google Scholar]
- Dum RP, Strick PL. The origin of corticospinal projections from the premotor areas in the frontal lobe. J Neurosci. 1991;11:667–689. doi: 10.1523/JNEUROSCI.11-03-00667.1991. [DOI] [PMC free article] [PubMed] [Google Scholar]
- Eickhoff SB, Stephan KE, Mohlberg H, Grefkes C, Fink GR, Amunts K, Zilles K. A new SPM toolbox for combining probabilistic cytoarchitectonic maps and functional imaging data. Neuroimage. 2005a;25:1325–1335. doi: 10.1016/j.neuroimage.2004.12.034. [DOI] [PubMed] [Google Scholar]
- Eickhoff SB, Walters NB, Schleicher A, Kril J, Egan GF, Zilles K, Watson JD, Amunts K. High resolution MRI reflects myeloarchitecture and cytoarchitecture of human cerebral cortex. Hum Brain Mapp. 2005b;24:206–215. doi: 10.1002/hbm.20082. [DOI] [PMC free article] [PubMed] [Google Scholar]
- Eickhoff SB, Schleicher A, Zilles K, Amunts K. The human parietal operculum. I. Cytoarchitectonic mapping of subdivisions. Cereb Cortex. 2006a;16:254–267. doi: 10.1093/cercor/bhi105. [DOI] [PubMed] [Google Scholar]
- Eickhoff SB, Amunts K, Mohlberg H, Zilles K. The human parietal operculum. II. Stereotaxic maps and correlation with functional imaging results. Cereb Cortex. 2006b;16:268–279. doi: 10.1093/cercor/bhi106. [DOI] [PubMed] [Google Scholar]
- Eickhoff SB, Weiss PH, Amunts K, Fink GR, Zilles K. Identifying human parieto-insular vestibular cortex using fMRI and cytoarchitectonic mapping. Hum Brain Mapp. 2006c;27:611–621. doi: 10.1002/hbm.20205. [DOI] [PMC free article] [PubMed] [Google Scholar]
- Elston GN, Benavides-Piccione R, DeFelipe J. The pyramidal cell in cognition: a comparative study in human and monkey. J Neurosci. 2001;21:163. doi: 10.1523/JNEUROSCI.21-17-j0002.2001. [DOI] [PMC free article] [PubMed] [Google Scholar]
- Epstein R, Harris A, Stanley D, Kanwisher N. The parahippocampal place area: recognition, navigation, or encoding? Neuron. 1999;23:115–125. doi: 10.1016/s0896-6273(00)80758-8. [DOI] [PubMed] [Google Scholar]
- Fatterpekar GM, Naidich TP, Delman BN, Aguinaldo JG, Gultekin SH, Sherwood CC, Hof PR, Drayer BP, Fayad ZA. Cytoarchitecture of the human cerebral cortex: MR microscopy of excised specimens at 9.4 Tesla. Am J Neuroradiol. 2002;23:1313–1321. [PMC free article] [PubMed] [Google Scholar]
- Fischl B, Dale AM. Measuring the thickness of the human cerebral cortex from magnetic resonance images. Proc Natl Acad Sci U S A. 2000;97:11050–11055. doi: 10.1073/pnas.200033797. [DOI] [PMC free article] [PubMed] [Google Scholar]
- Fischl B, Sereno MI, Dale AM. Cortical surface-based analysis. II. Inflation, flattening, and a surface-based coordinate system. Neuroimage. 1999a;9:195–207. doi: 10.1006/nimg.1998.0396. [DOI] [PubMed] [Google Scholar]
- Fischl B, Sereno MI, Tootell RB, Dale AM. High-resolution intersubject averaging and a coordinate system for the cortical surface. Hum Brain Mapp. 1999b;8:272–284. doi: 10.1002/(SICI)1097-0193(1999)8:4<272::AID-HBM10>3.0.CO;2-4. [DOI] [PMC free article] [PubMed] [Google Scholar]
- Fischl B, Liu A, Dale AM. Automated manifold surgery: constructing geometrically accurate and topologically correct models of the human cerebral cortex. IEEE Trans Med Imaging. 2001;20:70–80. doi: 10.1109/42.906426. [DOI] [PubMed] [Google Scholar]
- Fischl B, Salat D, van der Kouwe A, Makris N, Ségonne F, Quinn B, Dale A. Sequence-independent segmentation of magnetic resonance images. Neuroimage. 2004;23:S69–S84. doi: 10.1016/j.neuroimage.2004.07.016. [DOI] [PubMed] [Google Scholar]
- Fischl B, Rajendran N, Busa E, Augustinack J, Hinds O, Yeo BT, Mohlberg H, Amunts K, Zilles K. Cortical folding patterns and predicting cytoarchitecture. Cereb Cortex. 2008;18:1973–1980. doi: 10.1093/cercor/bhm225. [DOI] [PMC free article] [PubMed] [Google Scholar]
- Fukunaga M, Li TQ, van Gelderen P, de Zwart JA, Shmueli K, Yao B, Lee J, Maric D, Aronova MA, Zhang G, Leapman RD, Schenck JF, Merkle H, Duyn JH. Layer-specific variation of iron content in cerebral cortex as a source of MRI contrast. Proc Natl Acad Sci U S A. 2010;107:3834–3839. doi: 10.1073/pnas.0911177107. [DOI] [PMC free article] [PubMed] [Google Scholar]
- Fuster JM. Gradients of Cortical Plasticity. In: McGaugh JL, Weinberger NM, Lynch G, editors. Brain and memory: modulation and mediation of neuroplasticity. New York: Oxford UP; 1995. [Google Scholar]
- Fuster JM. Network memory. Trends Neurosci. 1997;20:451–459. doi: 10.1016/s0166-2236(97)01128-4. [DOI] [PubMed] [Google Scholar]
- Georgieva S, Peeters R, Kolster H, Todd JT, Orban GA. The processing of three-dimensional shape from disparity in the human brain. J Neurosci. 2009;29:727–742. doi: 10.1523/JNEUROSCI.4753-08.2009. [DOI] [PMC free article] [PubMed] [Google Scholar]
- Geyer S. The microstructural border between the motor and the cognitive domain in the human cerebral cortex. Adv Anat Embryol Cell Biol. 2004:174. doi: 10.1007/978-3-642-18910-4. [DOI] [PubMed] [Google Scholar]
- Geyer S, Ledberg A, Schleicher A, Kinomura S, Schormann T, Bürgel U, Klingberg T, Larsson J, Zilles K, Roland PE. Two different areas within the primary motor cortex of man. Nature. 1996;382:805–807. doi: 10.1038/382805a0. [DOI] [PubMed] [Google Scholar]
- Geyer S, Schleicher A, Zilles K. Areas 3a, 3b, and 1 of human primary somatosensory cortex. 1. Microstructural organization and interindividual variability. Neuroimage. 1999;10:63–83. doi: 10.1006/nimg.1999.0440. [DOI] [PubMed] [Google Scholar]
- Geyer S, Schormann T, Mohlberg H, Zilles K. Areas 3a, 3b, and 1 of human primary somatosensory cortex. 2. Spatial normalization to standard anatomical space. Neuroimage. 2000;11:684–696. doi: 10.1006/nimg.2000.0548. [DOI] [PubMed] [Google Scholar]
- Geyer S, Weiss M, Reimann K, Lohmann G, Turner R. Microstructural parcellation of the human cerebral cortex—from Brodmann's postmortem map to in vivo mapping with high-field magnetic resonance imaging. Front Hum Neurosci. 2011;5:19. doi: 10.3389/fnhum.2011.00019. [DOI] [PMC free article] [PubMed] [Google Scholar]
- Glasser MF, Rilling JK. DTI tractography of the human brain's language pathways. Cereb Cortex. 2008;18:2471–2482. doi: 10.1093/cercor/bhn011. [DOI] [PubMed] [Google Scholar]
- Glasser M, Laumann T, Coalson T, Cohen A, Snyder A, Schlaggar B, Petersen S, Van Essen D. Comparison of surface gradients derived from myelin maps and functional connectivity analysis. 17th Annual Meeting of Organization for Human Brain Mapping; June; Quebec City. 2011. [Google Scholar]
- Grefkes C, Fink GR. The functional organization of the intraparietal sulcus in humans and monkeys. J Anat. 2005;207:3–17. doi: 10.1111/j.1469-7580.2005.00426.x. [DOI] [PMC free article] [PubMed] [Google Scholar]
- Grefkes C, Geyer S, Schormann T, Roland P, Zilles K. Human somatosensory area 2: observer-independent cytoarchitectonic mapping, interindividual variability, and population map. Neuroimage. 2001;14:617–631. doi: 10.1006/nimg.2001.0858. [DOI] [PubMed] [Google Scholar]
- Hackett T, Preuss TM, Kaas JH. Architectonic identification of the core region in auditory cortex of macaques, chimpanzees, and humans. J Comp Neurol. 2001;441:197–222. doi: 10.1002/cne.1407. [DOI] [PubMed] [Google Scholar]
- Hagler DJ, Jr, Sereno MI. Spatial maps in frontal and prefrontal cortex. Neuroimage. 2006;29:567–577. doi: 10.1016/j.neuroimage.2005.08.058. [DOI] [PubMed] [Google Scholar]
- Hansen KA, Kay KN, Gallant JL. Topographic organization in and near human visual area V4. J Neurosci. 2007;27:11896–11911. doi: 10.1523/JNEUROSCI.2991-07.2007. [DOI] [PMC free article] [PubMed] [Google Scholar]
- He SQ, Dum RP, Strick PL. Topographic organization of corticospinal projections from the frontal lobe: motor areas on the lateral surface of the hemisphere. J Neurosci. 1993;13:952–980. doi: 10.1523/JNEUROSCI.13-03-00952.1993. [DOI] [PMC free article] [PubMed] [Google Scholar]
- He SQ, Dum RP, Strick PL. Topographic organization of corticospinal projections from the frontal lobe: motor areas on the medial surface of the hemisphere. J Neurosci. 1995;15:3284–3306. doi: 10.1523/JNEUROSCI.15-05-03284.1995. [DOI] [PMC free article] [PubMed] [Google Scholar]
- Hill J, Inder T, Neil J, Dierker D, Harwell J, Van Essen D. Similar patterns of cortical expansion during human development and evolution. Proc Natl Acad Sci U S A. 2010;107:13135–13140. doi: 10.1073/pnas.1001229107. [DOI] [PMC free article] [PubMed] [Google Scholar]
- Hinds O, Polimeni JR, Rajendran N, Balasubramanian M, Amunts K, Zilles K, Schwartz EL, Fischl B, Triantafyllou C. Locating the functional and anatomical boundaries of human primary visual cortex. Neuroimage. 2009;46:915–922. doi: 10.1016/j.neuroimage.2009.03.036. [DOI] [PMC free article] [PubMed] [Google Scholar]
- Hopf A. Über die Verteilung myeloarchitektonischer Merkmale in der isokortikalen Schläfenlappenrinde beim Menschen. J Hirnforsch. 1955;2:36–54. [Google Scholar]
- Hopf A. Über die Verteilung myeloarchitektonischer Merkmale in der Stirnhirnrinde beim Menschen. J Hirnforsch. 1956;2:311–333. [PubMed] [Google Scholar]
- Hopf A, Vitzthum HG. Über die Verteilung myeloarchitektonischer Merkmale in der Scheitellappenrinde beim Menschen. J Hirnforschung. 1957;3:79–104. [PubMed] [Google Scholar]
- Huk AC, Dougherty RF, Heeger DJ. Retinotopy and functional subdivision of human areas MT and MST. J Neurosci. 2002;22:7195–7205. doi: 10.1523/JNEUROSCI.22-16-07195.2002. [DOI] [PMC free article] [PubMed] [Google Scholar]
- Ino T, Inoue Y, Kage M, Hirose S, Kimura T, Fukuyama H. Mental navigation in humans is processed in the anterior bank of the parieto-occipital sulcus. Neurosci Lett. 2002;322:182–186. doi: 10.1016/s0304-3940(02)00019-8. [DOI] [PubMed] [Google Scholar]
- Jenkinson M, Bannister P, Brady M, Smith S. Improved optimization for the robust and accurate linear registration and motion correction of brain images. Neuroimage. 2002;17:825–841. doi: 10.1016/s1053-8119(02)91132-8. [DOI] [PubMed] [Google Scholar]
- Johansen-Berg H, Behrens TE, Robson MD, Drobnjak I, Rushworth MF, Brady JM, Smith SM, Higham DJ, Matthews PM. Changes in connectivity profiles define functionally distinct regions in human medial frontal cortex. Proc Natl Acad Sci U S A. 2004;101:13335–13340. doi: 10.1073/pnas.0403743101. [DOI] [PMC free article] [PubMed] [Google Scholar]
- Kagan I, Iyer A, Lindner A, Andersen RA. Space representation for eye movements is more contralateral in monkeys than in humans. Proc Natl Acad Sci U S A. 2010;107:7933–7938. doi: 10.1073/pnas.1002825107. [DOI] [PMC free article] [PubMed] [Google Scholar]
- Kim EY, Kim DH, Chang JH, Yoo E, Lee JW, Park HJ. Triple-layer appearance of Brodmann area 4 at thin-section double inversion-recovery MR Imaging. Radiology. 2009;250:515–522. doi: 10.1148/radiol.2502080266. [DOI] [PubMed] [Google Scholar]
- Kobayashi Y, Amaral DG. Macaque monkey retrosplenial cortex: I. Three-dimensional and cytoarchitectonic organization. J Comp Neurol. 2000;426:339–365. doi: 10.1002/1096-9861(20001023)426:3<339::aid-cne1>3.0.co;2-8. [DOI] [PubMed] [Google Scholar]
- Koenig SH. Cholesterol of myelin is the determinant of gray white contrast in MRI of brain. Magn Reson Med. 1991;20:285–291. doi: 10.1002/mrm.1910200210. [DOI] [PubMed] [Google Scholar]
- Kolster H, Peeters R, Orban GA. The retinotopic organization of the human middle temporal area MT/V5 and its cortical neighbors. J Neurosci. 2010;30:9801–9820. doi: 10.1523/JNEUROSCI.2069-10.2010. [DOI] [PMC free article] [PubMed] [Google Scholar]
- Koyama M, Hasegawa I, Osada T, Adachi Y, Nakahara K, Miyashita Y. Functional magnetic resonance imaging of macaque monkeys performing visually guided saccade tasks: comparison of cortical eye fields with humans. Neuron. 2004;41:795–807. doi: 10.1016/s0896-6273(04)00047-9. [DOI] [PubMed] [Google Scholar]
- Krubitzer LA, Kaas JH. The organization and connections of somatosensory cortex in marmosets. J Neurosci. 1990;10:952–974. doi: 10.1523/JNEUROSCI.10-03-00952.1990. [DOI] [PMC free article] [PubMed] [Google Scholar]
- Krubitzer L, Clarey J, Tweedale R, Elston G, Calford M. A redefinition of somatosensory areas in the lateral sulcus of macaque monkeys. J Neurosci. 1995;15:3821–3839. doi: 10.1523/JNEUROSCI.15-05-03821.1995. [DOI] [PMC free article] [PubMed] [Google Scholar]
- Kurth F, Eickhoff SB, Schleicher A, Hoemke L, Zilles K, Amunts K. Cytoarchitecture and probabilistic maps of the human posterior insular cortex. Cereb Cortex. 2009;20:1448–1461. doi: 10.1093/cercor/bhp208. [DOI] [PMC free article] [PubMed] [Google Scholar]
- Lewis JW, Van Essen DC. Corticocortical connections of visual, sensorimotor, and multimodal processing areas in the parietal lobe of the macaque monkey. J Comp Neurol. 2000;428:112–137. doi: 10.1002/1096-9861(20001204)428:1<112::aid-cne8>3.0.co;2-9. [DOI] [PubMed] [Google Scholar]
- Lobel E, Kahane P, Leonards U, Grosbras MH, Lehéricy S, Le Bihan D, Berthoz A. Localization of human frontal eye fields: anatomical and functional findings of functional magnetic resonance imaging and intracerebral electrical stimulation. J Neurosurg Pediatrics. 2001;95:804–815. doi: 10.3171/jns.2001.95.5.0804. [DOI] [PubMed] [Google Scholar]
- Mai J, Assheuer J, Paxinos G. New York: Academic; 1997. Atlas of the human brain. [Google Scholar]
- Malikovic A, Amunts K, Schleicher A, Mohlberg H, Eickhoff SB, Wilms M, Palomero-Gallagher N, Armstrong E, Zilles K. Cytoarchitectonic analysis of the human extrastriate cortex in the region of V5/MT+: a probabilistic, stereotaxic map of area hOc5. Cereb Cortex. 2007;17:562–574. doi: 10.1093/cercor/bhj181. [DOI] [PubMed] [Google Scholar]
- Marques JP, Kober T, Krueger G, van der Zwaag W, Van de Moortele PF, Gruetter R. MP2RAGE, a self bias-field corrected sequence for improved segmentation and T1-mapping at high field. Neuroimage. 2010;49:1271–1281. doi: 10.1016/j.neuroimage.2009.10.002. [DOI] [PubMed] [Google Scholar]
- Matelli M, Luppino G, Rizzolatti G. Architecture of superior and mesial area 6 and the adjacent cingulate cortex in the macaque monkey. J Comp Neurol. 1991;311:445–462. doi: 10.1002/cne.903110402. [DOI] [PubMed] [Google Scholar]
- Mesulam MM, Mufson EJ. Insula of the old world monkey. Architectonics in the insulo-orbito-temporal component of the paralimbic brain. J Comp Neurol. 1982;212:1–22. doi: 10.1002/cne.902120102. [DOI] [PubMed] [Google Scholar]
- Miot-Noirault E, Barantin L, Akoka S, Le Pape A. T2 relaxation time as a marker of brain myelination: experimental MR study in two neonatal animal models. J Neurosci Methods. 1997;72:5–14. doi: 10.1016/s0165-0270(96)00148-3. [DOI] [PubMed] [Google Scholar]
- Morosan P, Rademacher J, Schleicher A, Amunts K, Schormann T, Zilles K. Human primary auditory cortex: cytoarchitectonic subdivisions and mapping into a spatial reference system. Neuroimage. 2001;13:684–701. doi: 10.1006/nimg.2000.0715. [DOI] [PubMed] [Google Scholar]
- Morris R, Paxinos G, Petrides M. Architectonic analysis of the human retrosplenial cortex. J Comp Neurol. 2000;421:14–28. doi: 10.1002/(sici)1096-9861(20000522)421:1<14::aid-cne2>3.0.co;2-s. [DOI] [PubMed] [Google Scholar]
- Nelson SM, Cohen AL, Power JD, Wig GS, Miezin FM, Wheeler ME, Velanova K, Donaldson DI, Phillips JS, Schlaggar BL, Petersen SE. A parcellation scheme for human left lateral parietal cortex. Neuron. 2010;67:156–170. doi: 10.1016/j.neuron.2010.05.025. [DOI] [PMC free article] [PubMed] [Google Scholar]
- Öngür D, Ferry AT, Price JL. Architectonic subdivision of the human orbital and medial prefrontal cortex. J Comp Neurol. 2003;460:425–449. doi: 10.1002/cne.10609. [DOI] [PubMed] [Google Scholar]
- Orban GA, Claeys K, Nelissen K, Smans R, Sunaert S, Todd JT, Wardak C, Durand JB, Vanduffel W. Mapping the parietal cortex of human and non-human primates. Neuropsychologia. 2006;44:2647–2667. doi: 10.1016/j.neuropsychologia.2005.11.001. [DOI] [PubMed] [Google Scholar]
- Palomero-Gallagher N, Mohlberg H, Zilles K, Vogt B. Cytology and receptor architecture of human anterior cingulate cortex. J Comp Neurol. 2008;508:906–926. doi: 10.1002/cne.21684. [DOI] [PMC free article] [PubMed] [Google Scholar]
- Palomero-Gallagher N, Vogt BA, Schleicher A, Mayberg HS, Zilles K. Receptor architecture of human cingulate cortex: evaluation of the four region neurobiological model. Hum Brain Mapp. 2009;30:2336–2355. doi: 10.1002/hbm.20667. [DOI] [PMC free article] [PubMed] [Google Scholar]
- Pandya DN, Sanides F. Architectonic parcellation of the temporal operculum in rhesus monkey and its projection pattern. Z Anat Entwicklungsgesch. 1973;139:127–161. doi: 10.1007/BF00523634. [DOI] [PubMed] [Google Scholar]
- Paus T. Primate anterior cingulate cortex: where motor control, drive and cognition interface. Nat Rev Neurosci. 2001;2:417–424. doi: 10.1038/35077500. [DOI] [PubMed] [Google Scholar]
- Petrides M, Pandya DN. Dorsolateral prefrontal cortex: comparative cytoarchitectonic analysis in the human and the macaque brain and corticocortical connection patterns. Eur J Neurosci. 1999;11:1011–1036. doi: 10.1046/j.1460-9568.1999.00518.x. [DOI] [PubMed] [Google Scholar]
- Pitzalis S, Galletti C, Huang RS, Patria F, Committeri G, Galati G, Fattori P, Sereno MI. Wide-field retinotopy defines human cortical visual area V6. J Neurosci. 2006;26:7962–7973. doi: 10.1523/JNEUROSCI.0178-06.2006. [DOI] [PMC free article] [PubMed] [Google Scholar]
- Preuss TM, Goldman-Rakic PS. Myelo and cytoarchitecture of the granular frontal cortex and surrounding regions in the strepsirhine primate Galago and the anthropoid primate Macaca. J Comp Neurol. 1991;310:429–474. doi: 10.1002/cne.903100402. [DOI] [PubMed] [Google Scholar]
- Preuss TM, Stepniewska I, Kaas JH. Movement representation in the dorsal and ventral premotor areas of owl monkeys: a microstimulation study. J Comp Neurol. 1996;371:649–676. doi: 10.1002/(SICI)1096-9861(19960805)371:4<649::AID-CNE12>3.0.CO;2-E. [DOI] [PubMed] [Google Scholar]
- Rademacher J, Caviness VS, Jr, Steinmetz H, Galaburda AM. Topographical variation of the human primary cortices: implications for neuroimaging, brain mapping, and neurobiology. Cereb Cortex. 1993;3:313–329. doi: 10.1093/cercor/3.4.313. [DOI] [PubMed] [Google Scholar]
- Rajimehr R, Young JC, Tootell RB. An anterior temporal face patch in human cortex, predicted by macaque maps. Proc Natl Acad Sci U S A. 2009;106:1995–2000. doi: 10.1073/pnas.0807304106. [DOI] [PMC free article] [PubMed] [Google Scholar]
- Rilling JK, Glasser MF, Preuss TM, Ma X, Zhao T, Hu X, Behrens TE. The evolution of the arcuate fasciculus revealed with comparative DTI. Nat Neurosci. 2008;11:426–428. doi: 10.1038/nn2072. [DOI] [PubMed] [Google Scholar]
- Rizzolatti G, Luppino G, Matelli M. The classic supplementary motor area is formed by two independent areas. Adv Neurol. 1996;70:45–56. [PubMed] [Google Scholar]
- Rottschy C, Eickhoff SB, Schleicher A, Mohlberg H, Kujovic M, Zilles K, Amunts K. Ventral visual cortex in humans: cytoarchitectonic mapping of two extrastriate areas. Hum Brain Mapp. 2007;28:1045–1059. doi: 10.1002/hbm.20348. [DOI] [PMC free article] [PubMed] [Google Scholar]
- Salat DH, Lee SY, van der Kouwe AJ, Greve DN, Fischl B, Rosas HD. Age-associated alterations in cortical gray and white matter signal intensity and gray to white matter contrast. Neuroimage. 2009;48:21–28. doi: 10.1016/j.neuroimage.2009.06.074. [DOI] [PMC free article] [PubMed] [Google Scholar]
- Scheperjans F, Hermann K, Eickhoff SB, Amunts K, Schleicher A, Zilles K. Observer-independent cytoarchitectonic mapping of the human superior parietal cortex. Cereb Cortex. 2008a;18:846–867. doi: 10.1093/cercor/bhm116. [DOI] [PubMed] [Google Scholar]
- Scheperjans F, Eickhoff SB, Homke L, Mohlberg H, Hermann K, Amunts K, Zilles K. Probabilistic maps, morphometry, and variability of cytoarchitectonic areas in the human superior parietal cortex. Cereb Cortex. 2008b;18:2141–2157. doi: 10.1093/cercor/bhm241. [DOI] [PMC free article] [PubMed] [Google Scholar]
- Ségonne F, Dale AM, Busa E, Glessner M, Salat D, Hahn HK, Fischl B. A hybrid approach to the skull stripping problem in MRI. Neuroimage. 2004;22:1060–1075. doi: 10.1016/j.neuroimage.2004.03.032. [DOI] [PubMed] [Google Scholar]
- Sereno MI, Pitzalis S, Martinez A. Mapping of contralateral space in retinotopic coordinates by a parietal cortical area in humans. Science. 2001;294:1350–1354. doi: 10.1126/science.1063695. [DOI] [PubMed] [Google Scholar]
- Shulman GL, McAvoy MP, Cowan MC, Astafiev SV, Tansy AP, d'Avossa G, Corbetta M. Quantitative analysis of attention and detection signals during visual search. J Neurophysiol. 2003;90:3384–3397. doi: 10.1152/jn.00343.2003. [DOI] [PubMed] [Google Scholar]
- Sigalovsky I, Fischl B, Melcher J. Mapping an intrinsic MR property of gray matter in auditory cortex of living humans: a possible marker for primary cortex and hemispheric differences. Neuroimage. 2006;32:1524–1537. doi: 10.1016/j.neuroimage.2006.05.023. [DOI] [PMC free article] [PubMed] [Google Scholar]
- Sled JG, Zijdenbos AP, Evans AC. A nonparametric method for automatic correction of intensity nonuniformity in MRI data. IEEE Trans Med Imaging. 1998;17:87–97. doi: 10.1109/42.668698. [DOI] [PubMed] [Google Scholar]
- Stanton GB, Deng SY, Goldberg ME, McMullen NT. Cytoarchitectural characteristic of the frontal eye fields in macaque monkeys. J Comp Neurol. 1989;282:415–427. doi: 10.1002/cne.902820308. [DOI] [PubMed] [Google Scholar]
- Steen RG, Reddick WE, Ogg RJ. More than meets the eye: significant regional heterogeneity in human cortical T1. Magn Reson Imaging. 2000;18:361–368. doi: 10.1016/s0730-725x(00)00123-5. [DOI] [PubMed] [Google Scholar]
- Swisher JD, Halko MA, Merabet LB, McMains SA, Somers DC. Visual topography of human intraparietal sulcus. J Neurosci. 2007;27:5326–5337. doi: 10.1523/JNEUROSCI.0991-07.2007. [DOI] [PMC free article] [PubMed] [Google Scholar]
- Tootell RB, Taylor JB. Anatomical evidence for MT and additional cortical visual areas in humans. Cereb Cortex. 1995;5:39–55. doi: 10.1093/cercor/5.1.39. [DOI] [PubMed] [Google Scholar]
- Triarhou LC. The Economo-Koskinas Atlas revisited: cytoarchitectonics and functional context. Stereotact Funct Neurosurg. 2007a;85:195–203. doi: 10.1159/000103258. [DOI] [PubMed] [Google Scholar]
- Triarhou LC. A proposed number system for the 107 cortical areas of Economo and Koskinas, and Brodmann area correlations. Stereotact Funct Neurosurg. 2007b;85:204–215. doi: 10.1159/000103259. [DOI] [PubMed] [Google Scholar]
- Van de Moortele PF, Auerbach EJ, Olman C, Yacoub E, Uğurbil K, Moeller S. T1 weighted brain images at 7 Tesla unbiased for Proton Density, T2 contrast and RF coil receive B1 sensitivity with simultaneous vessel visualization. Neuroimage. 2009;46:432–446. doi: 10.1016/j.neuroimage.2009.02.009. [DOI] [PMC free article] [PubMed] [Google Scholar]
- Van Essen DC, Dierker DL. Surface-based and probabilistic atlases of primate cerebral cortex. Neuron. 2007;56:209–225. doi: 10.1016/j.neuron.2007.10.015. [DOI] [PubMed] [Google Scholar]
- Van Essen DC, Drury HA, Dickson J, Harwell J, Hanlon D, Anderson CH. An integrated software suite for surface-based analyses of cerebral cortex. J Am Med Inform Assoc. 2001;8:443–459. doi: 10.1136/jamia.2001.0080443. [DOI] [PMC free article] [PubMed] [Google Scholar]
- Vogt B, Hof P, Vogt L. Cingulate gyrus. In: Paxinos G, Mai J, editors. The human nervous system. Amsterdam: Elsevier; 2004. pp. 915–949. [Google Scholar]
- Vogt BA, Vogt L. Cytology of human dorsal midcingulate and supplementary motor cortices. J Chem Neuroanat. 2003;26:301–309. doi: 10.1016/j.jchemneu.2003.09.004. [DOI] [PubMed] [Google Scholar]
- Vogt BA, Vogt L, Farber NB, Bush G. Architecture and neurocytology of monkey cingulate gyrus. J Comp Neurol. 2005;485:218–239. doi: 10.1002/cne.20512. [DOI] [PMC free article] [PubMed] [Google Scholar]
- Vogt BA, Nimchinsky EA, Vogt LJ, Hof PR. Human cingulate cortex: surface features, flat maps, and cytoarchitecture. J Comp Neurol. 1995;359:490–506. doi: 10.1002/cne.903590310. [DOI] [PubMed] [Google Scholar]
- Vogt BA, Vogt L, Laureys S. Cytology and functionally correlated circuits of human posterior cingulate areas. Neuroimage. 2006;29:452–466. doi: 10.1016/j.neuroimage.2005.07.048. [DOI] [PMC free article] [PubMed] [Google Scholar]
- Von Bonin G. Springfield, IL: Charles C Thomas; 1950. Essay on the cerebral cortex. [Google Scholar]
- Vorobiev V, Govoni P, Rizzolatti G, Matelli M, Luppino G. Parcellation of human mesial area 6: cytoarchitectonic evidence for three separate areas. Eur J Neurosci. 1998;10:2199–2203. doi: 10.1046/j.1460-9568.1998.00236.x. [DOI] [PubMed] [Google Scholar]
- Wallace MN, Johnston PW, Palmer AR. Histochemical identification of cortical areas in the auditory region of the human brain. Exp Brain Res. 2002;143:499–508. doi: 10.1007/s00221-002-1014-z. [DOI] [PubMed] [Google Scholar]
- Walters NB, Egan GF, Kril JJ, Kean M, Waley P, Jenkinson M, Watson JD. In vivo identification of human cortical areas using high-resolution MRI: an approach to cerebral structure–function correlation. Proc Natl Acad Sci U S A. 2003;100:2981–2986. doi: 10.1073/pnas.0437896100. [DOI] [PMC free article] [PubMed] [Google Scholar]
- Walters NB, Eickhoff SB, Schleicher A, Zilles K, Amunts K, Egan GF, Watson JD. Observer-independent analysis of high-resolution MR images of the human cerebral cortex: in vivo delineation of cortical areas. Hum Brain Mapp. 2007;28:1–8. doi: 10.1002/hbm.20267. [DOI] [PMC free article] [PubMed] [Google Scholar]
- Wilms M, Eickhoff SB, Specht K, Amunts K, Shah NJ, Malikovic A, Fink GR. Human V5/MT+: comparison of functional and cytoarchitectonic data. Anat Embryol. 2005;210:485–495. doi: 10.1007/s00429-005-0064-y. [DOI] [PubMed] [Google Scholar]
- Yoshiura T, Higano S, Rubio A, Shrier DA, Kwok WE, Iwanaga S, Numaguchi Y. Heschl and superior temporal gyri: low signal intensity of the cortex on T2-weighted MR images of the normal brain. Radiology. 2000;214:217–221. doi: 10.1148/radiology.214.1.r00ja17217. [DOI] [PubMed] [Google Scholar]
- Zhang Y, Brady M, Smith S. Segmentation of brain MR images through a hidden Markov random field model and the expectation-maximization algorithm. IEEE Trans Med Imaging. 2001;20:45–57. doi: 10.1109/42.906424. [DOI] [PubMed] [Google Scholar]
- Zilles K. Amsterdam: Elsevier Academic; 2004. Architecture of the human cerebral cortex. Regional and laminar organization. The human nervous system; pp. p:997–1055. [Google Scholar]
- Zilles K, Amunts K. Centenary of Brodmann's map—conception and fate. Nat Rev Neurosci. 2010;11:139–145. doi: 10.1038/nrn2776. [DOI] [PubMed] [Google Scholar]