Abstract
Background and Purpose
Previous studies have suggested that patients’ potential for post-stroke language recovery is related to lesion size; however, lesion location may also be of importance, particularly when fiber tracts that are critical to the sensorimotor mapping of sounds for articulation (e.g. the arcuate fasciculus [AF]) have been damaged. In this study, we tested the hypothesis that lesion loads of the AF (i.e. volume of AF that is affected by a patient’s lesion) and of two other tracts involved in language processing (the extreme capsule [EmC] and the uncinate fasciculus [UF]) are inversely related to the severity of speech production impairments in stroke patients with aphasia.
Methods
Thirty chronic stroke patients with residual impairments in speech production underwent high-resolution anatomical MR imaging and a battery of cognitive and language tests. Impairment was assessed using three functional measures of spontaneous speech (e.g. rate, informativeness, and overall efficiency) as well as naming ability. To quantitatively analyze the relationship between impairment scores and lesion-load along the three fiber tracts, we calculated tract–lesion overlap volumes for each patient using probabilistic maps of the tracts derived from diffusion tensor images of ten age-matched healthy subjects.
Results
Regression analyses showed that AF-lesion load, but not EmC- or UF-lesion load or lesion size, significantly predicted rate, informativeness, and overall efficiency of speech, as well as naming ability.
Conclusions
A new variable, AF-lesion load, complements established voxel-based lesion-mapping techniques and, in the future, may potentially be used to estimate impairment and recovery potential after stroke and refine inclusion criteria for experimental rehabilitation programs.
Introduction
Aphasia is a devastating complication of stroke that is characterized by an impairment in or loss of verbal communication ability. While researchers have long attempted to identify the major predictors of recovery from this condition,1 it remains difficult for clinicians to make accurate prognoses regarding speech and language deficits after stroke. In particular, the extent to which lesion size affects speech production remains unclear. While some researchers2, 3 have reported lesion size to be a significant determinant of fluency after stroke, others have found no significant differences in lesion size between patients who recover fully and those who do not.4 Indeed, one recent study found no significant correlations between lesion size and severity of initial impairment or performance at 90 days. Furthermore, a regression model combining age, lesion size, and severity of initial impairment, although statistically significant, predicted less than 30% of the variance in speech outcome at 90 days.5
In their efforts to delineate the relationship between lesion size/location and degree of impairment, several recent studies have used voxel-based lesion–symptom mapping (VLSM) techniques to investigate the anatomical correlates of aphasia.6-10 Some of these studies have suggested that the degree of white matter involvement plays a role in language deficits and recovery; however, the extent to which aphasia severity and recovery potential are affected by specific white matter damage—for example, the involvement of language-related fiber tracts—has not been assessed.
In this study, we examined three major language tracts previously identified by researchers: the arcuate fasciculus (AF), uncinate fasciculus (UF), and extreme capsule (EmC). The AF connects the superior and middle temporal gyri (STG/MTG) with the posterior inferior frontal lobe. Recent studies have suggested that the AF may be primarily involved in the mapping of sounds to articulation.11, 12 In contrast, the UF and the EmC, which connect the temporal lobe to more anterior portions of the inferior frontal gyrus, are thought to be more involved in the mapping of sounds to meaning.11-13 Thus, the aim of our study was to quantitatively examine the relationship between lesion size and location—as measured by extent of damage to these three language tracts—and impairment of fluent speech production. Speech fluency—a multidimensional parameter of speech production that encompasses various elements such as speech rate, phrase length, pauses, articulatory struggle and accuracy, prosody, syntactic structure, and so on—is notoriously difficult to measure and lacks a widely-accepted standard measure.14, 15 In the absence of such an assessment tool, we chose to evaluate fluency using three functional measures of conversational speech; this is in contrast to using clinical measures of speech production, which do not necessarily capture all aspects of speech and language that may be of importance to the patient or for recovery.14
Accordingly, we overlaid lesion maps of thirty chronic stroke patients with probabilistic maps of the AF, UF, and EmC derived from diffusion tensor images of healthy, age-matched subjects. Lesion loads (i.e. volume of tract affected by a patient’s lesion) of these tracts were then calculated and related to three functional measures of speech production: words per minute (WPM), correct information units (CIUs) per total words uttered (%CIUs), and CIUs per minute.16 WPM reflects the rate of speech, but includes uninformative ‘filler’ words, circumlocutions, and incorrect words. A high WPM score therefore requires relatively intact articulatory abilities, but does not necessarily require excellent retrieval of phonological word forms. Percent CIUs measures the informativeness of speech. This measure relies on retrieval of correct phonological word forms; semantic-to-phonological connections must be relatively intact in order for %CIUs to be high. CIUs/min measures the efficiency of speech; a high score on this measure requires both adequate articulatory abilities and good retrieval of phonological word forms. In keeping with our interpretation of these three fluency measures, we hypothesized that lesion load would be a better predictor of impairment than lesion size alone and, furthermore, that AF lesion-load would predict WPM, whereas UF- and EmC-lesion load would predict %CIUs.
Methods
Subjects
The study group consisted of thirty right-handed patients, all of whom had suffered left-hemispheric strokes in the middle cerebral artery territory at least 11 months after their stroke at the time of testing (6 females and 24 males; mean age 58.5 years [SD 10.0]; mean time post-stroke 35.0 months [SD 28.7]). Although all patients had been diagnosed with severe non-fluent aphasia in the acute/subacute phase (based on assessments conducted during the initial hospitalization period), they had recovered to varying degrees at time of study enrollment (see table in supplemental information for details on patients). Exclusion criteria included bi-hemispheric or brainstem infarcts, primary intracerebral hemorrhages, previous or subsequent strokes, concomitant neurological diseases/disorders, and other aphasic syndromes such as pure anomia and those characterized by severe comprehension deficits (less than 45th percentile on the combined Auditory Comprehension subtest scores on the Boston Diagnostic Aphasia Evaluation [BDAE]17) or cognitive impairments (less than 50th percentile on the Raven’s Coloured Progressive Matrices (RCPM)18). Mean, SD, and range data for 6 tests that the patient group underwent including their normative values are shown in Table 1. Normative values are taken from Nicholas and Brookshire18 for CIUs, from the BDAE and BNT manual for BDAE and BNT scores; Smits et al19 was used for the normative values for the RCPM. We enrolled an additional ten healthy, right-handed, age-matched control subjects (3 women and 7 men; mean age 57.2 years [SD 15.7]). This study was approved by the local IRB, and all participants gave written informed consent.
Table 1.
Patient data and normative values.
| RCPM | WPM | %CIUs | CIUs/min | BNT | BDAE_R | ||
|---|---|---|---|---|---|---|---|
| Patient Group | Mean | 20.0 | 21.0 | 31.0 | 8.6 | 33.2 | 4.9 |
| SD | 3.4 | 15 | 24.3 | 11.9 | 17.4 | 3.3 | |
| Range | 13-24 | 2.3-59.4 | 3.3-87.5 | 0.3-42.8 | 47-60 | 0-10 | |
| Norm. Values | Mean | 20.3 | 167.7 | 86.7 | 145.0 | 55.6 | 9.9 |
| SD | 3.3 | 22.0 | 6.0 | 21.0 | 3.0 | 0.3 | |
| Range | 8-24 | 110-200 | 73-93 | 96-174 | 47-60 | 9-10 |
Behavioral Assessments
Spontaneous speech was elicited using conversational interviews8 regarding biographical data, medical history, daily activities, descriptions of complex pictures (e.g. the Cookie Theft picture from the BDAE), and descriptions of routine procedures (e.g., cooking a favorite dish, working on a hobby or doing a simple repair). Videotapes of patient assessments were transcribed, timed, and scored by blinded coders with backgrounds in communication disorders and speech language pathology.
Because there is no standard definition for fluency14-16and, as a result, no widely-accepted means of assessing spontaneous speech, we chose to evaluate speech production by using three measures of functional relevance: words per minute (rate of speech), percent correct information units (CIUs) of total words uttered (informativeness), and CIUs per minute (overall efficiency of speech). In order to be counted as CIUs, words had to be intelligible in context as well as accurate, relevant, and informative with respect to the stimulus; meaningless utterances, exclamations, inappropriate information, and perseverations were counted as words but not as CIUs.16 Intra-observer reliability as well as inter-observer (2 coders) reliability for these three items were >0.9.
In addition to assessing spontaneous speech, we also evaluated each patient’s naming ability using an untimed version of the Boston Naming Test.20 Patients were given a full point for items they could name unassisted, 0.5 points for items named with help of a semantic or phonemic cue, and 0.25 points for items they could identify by choosing the correct written word (from a set of four words presented in conjunction with the picture stimulus).
MRI and DTI Acquisition
All stroke patients and age-matched control subjects were scanned using a 3-Tesla General Electric scanner with a standard radiofrequency head-coil. T1-weighted images (voxel resolution of 0.93×0.93×1.5 mm) were acquired and spatially normalized into images of isotropic voxel size (2×2×2 mm) using SPM5 (Wellcome Department of Neurology, London, UK) implemented in Matlab (The Mathworks Inc., Natick, MA). For patients with extensive lesions, masks were drawn in MRIcro21 in order to exclude the lesion from the cost function calculation of the spatial normalization process.22
The control subjects underwent diffusion tensor imaging (DTI) using a single-shot, spin-echo EPI sequence with the following parameters: TR=10 s; TE=86.9 ms; resolution 2.6×2.6.×2.6 mm3; 30 non-collinear diffusion directions with a b-value of 1000 s/mm2 and 6 acquisitions with a value of 0 s/mm2. A total of 56 slices covered the entire brain including the brainstem. Postprocessing of DTI images and fiber-tracking were done as detailed in Zhu et al., (2010).23
For the AF, a curved fiber bundle that connects the posterior portion of the temporo-parietal junction with the frontal cortex,24 we drew one region of interest (ROI) on the FA map in the white matter underlying the posterior middle and superior temporal gyri at approximately x=−50 mm (MNI space); a second ROI was drawn on the same sagittal slice in the white matter underlying the pars opercularis of the posterior inferior frontal gyrus.
The UF is a hook-shaped fiber bundle that links the anterior portion of the temporal lobe with the orbital and inferior frontal gyri.25, 26 In order to reconstruct this tract, we drew coronal ROIs in the anterior region of the corona radiata (y=37), the anterior part of the temporal lobe where the UF adjoins the inferior fronto-occipito fasciculus26, 27 and in the white matter underlying the inferior and middle temporal gyri (y=49).
The EmC is a fiber bundle that links the temporal and inferior frontal gyrus/inferior prefrontal regions.12, 28 In order to reconstruct the EmC, an ROI was first drawn on a sagittal slice (x=−37) in the white matter underlying the pars orbitalis and triangularis in the inferior frontal gyrus; a second ROI was drawn on the same slice in the mid-portion of the white matter underlying the superior temporal gyrus.
Lesion Mapping
We used MRIcro to define each patient’s chronic lesion in the spatially normalized T1-weighted images while referring to the co-registered FLAIR images for additional guidance. In some cases, we found marked ventricular dilatation due to extensive ischemic lesions and subsequent hemispheric atrophy. However, no part of the dilated ventricle was included in the lesion area. Lesions were drawn by a single rater who was blind to the patients’ fluency/behavioral scores. A second rater, also naïve to the patients’ speech impairment scores, drew lesions in a subset of 10 patients in order to calculate an inter-observer reliability, which was 0.93 for lesion volume.
Lesion Load Calculation
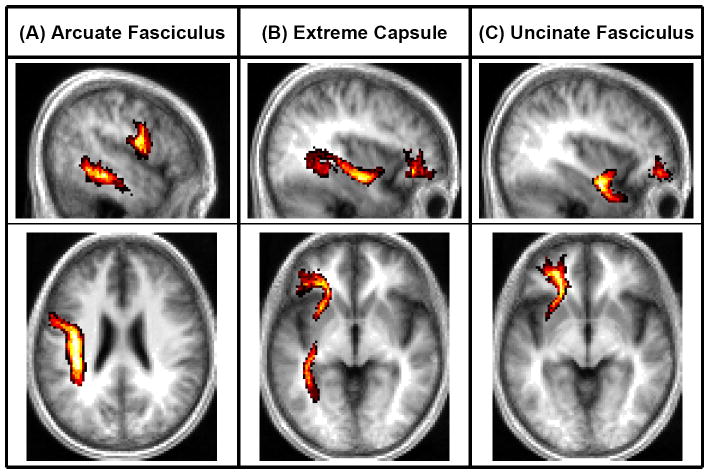
The reconstructed fiber tracts of the control subjects were transformed into binary images and then spatially normalized using SPM5. Overlaps between lesions and fiber tracts were calculated using the previously-described raw lesion load method.23 In brief, the binary fiber tracts of the ten healthy control subjects were summed to generate a fiber map using Matlab (Figure 1). Voxel intensities ranged from I = 0 (i.e. voxel is not part of the tract in any of the subjects) to I = 10 (i.e. voxel is part of the tract in all ten subjects); thus, the probability that a particular voxel would be part of the tract was calculated as one-tenth of the voxel’s intensity. For each lesion, a raw lesion–tract overlap volume (Vraw) was calculated by overlaying the lesion map onto the probabilistic fiber tract and summing the intensities of all intersecting voxels. This calculation is denoted by the equation
where nmax is the total number of intersecting voxels between the lesion map and fiber map, and I (n) is the intensity of the n th voxel (as represented in the fiber map).
Figure 1. Lesion Maps and Probabilistic Fiber Tracts.
Shown here are probabilistic maps of the (A) AF, (B) EmC, and (C) UF. The sagittal slices shown correspond to x=−50, −36, and −36 in Talairach space; the axial slices shown correspond to z=−26, −4, and −6.
Results
Relating tract lesion load to Rate of Speech (words/minute)
A regression analysis was first conducted using lesion size and lesion loads of all three tracts (i.e. AF, EmC, and UF) as predictors of words/minute (adjusted R2=0.301, p=0.011). AF-lesion load proved to be the best variable (partial R2=0.175, p=0.030; see Figure 2), while EmC-lesion load (partial R2=0.087, p=0.135), UF-lesion load (partial R2=0.098, p=0.112) and lesion size (partial R2=0.002, p=0.829) were shown to be non-significant predictors.
Figure 2. Regression Analyses.
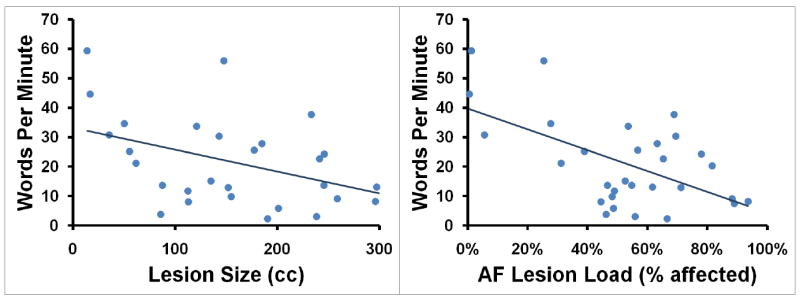
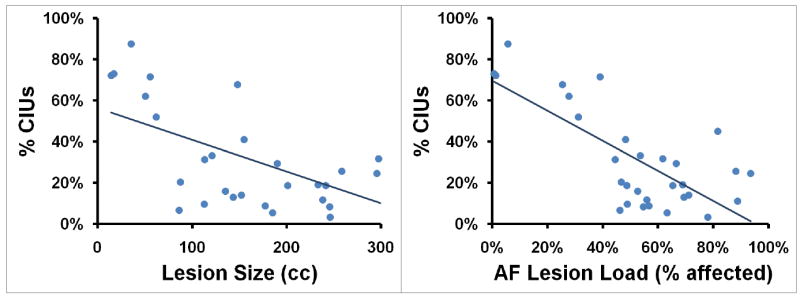
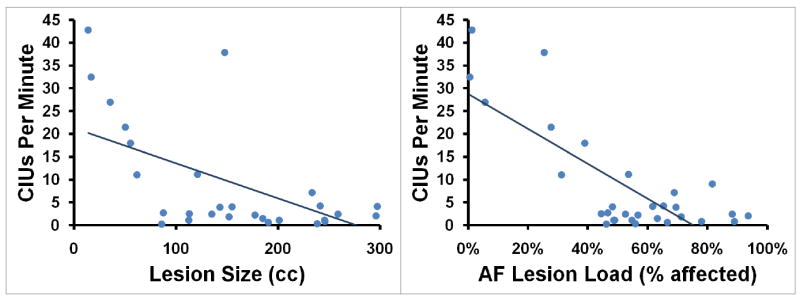
(A) Words/minute, (B) %CIUs, and (C) CIUs/minute are plotted as functions of lesion size (measured in cc) and AF-lesion load (represented as percentage of tract affected).
Relating tract lesion load to Informativeness (%CIUs)
A second regression analysis was conducted using the same four variables to predict %CIUs (adjusted R2=0.496, p<0.001). Again, AF-lesion load was shown to be a significant predictor (partial R2=0.336, p=0.002; see Figure 2) whereas EmC-lesion load (partial R2=0.052, p=0.520), UF-lesion load (partial R2=0.058, p=0.227) and lesion size (partial R2=0.002, p=0.844) were non-significant.
Relating tract lesion load to Overall Efficiency of Speech (CIUs/minute)
A third regression analysis was conducted using lesion size as well as AF-, EmC, and UF-lesion loads as predictors of CIUs/minute (adjusted R2=0.610, p<0.001). Once again, AF-lesion load proved to be a significant predictor (partial R2=0.450, p<0.001; see Figure 2) while EmC-lesion load (partial R2=0.086, p=0.138), UF-lesion load (partial R2=0.106, p=0.100) and lesion size (partial R2=0.034, p=0.358) remained non-significant.
Relating tract lesion load to Naming Ability
A final regression analysis was conducted using the same four variables to predict naming ability (adjusted R2=0.417, p=0.001). AF-lesion load (R2=0.159, p=0.039) significantly predicted BNT score, and UF-lesion load displayed a non-significant trend (R2=0.123, p=0.073). Neither EmC-lesion load (partial R2=0.069, p=0.187) nor lesion size (partial R2=0.029, p=0.399) significantly predicted BNT score.
Discussion
AF-lesion load, but not EmC- or UF-lesion load, significantly predicted rate, informativeness, and overall efficiency of speech in patients with impairments of speech production after stroke. Lesion size, despite showing a substantial correlation with these lesion-load measures, was shown not to be a significant predictor of speech production after stroke (Figure 3).
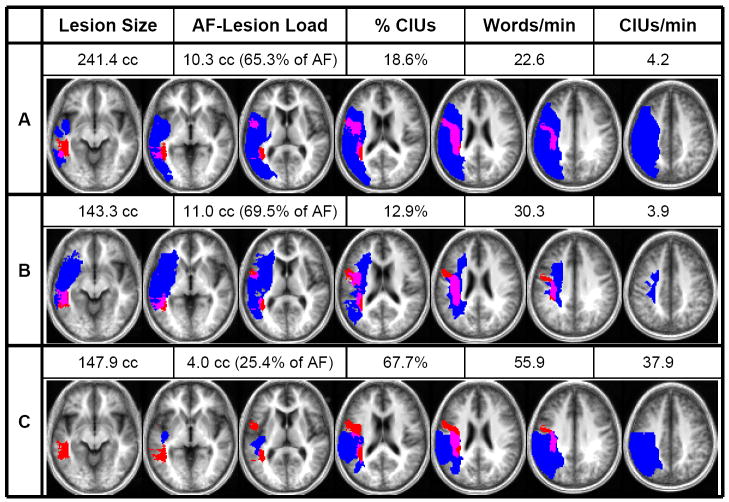
Figure 3. Lesion–DTI fiber tract overlap.
Shown here are examples of three patients’ behavioral scores, lesion sizes, and AF-lesion loads, as well as their individual lesion maps (depicted in blue) overlaid onto the probabilistic AF map (depicted in red). Overlap between lesion and AF is displayed in purple. The axial slices depicted correspond to z=−10, −2, 8, 18, 26, 34, and 42 in Talairach space.
Comparison of patients A and B shows how two patients can display comparable AF-lesion loads and behavioral scores despite drastically different overall lesion volumes. Similarly, comparison of patients B and C shows how a similar lesion size can produce two markedly different AF-lesion loads and, accordingly, result in very different levels of impairment.
Our results are in accordance with previous lesion–behavior mapping studies indicating a critical role for white matter tracts in the production of fluent speech. In one such study,29 CT images of twenty-seven chronic patients were used to rate extent of lesion damage within specific regions on a scale from 0 (no lesion) to 5 (entire area has lesion). While severity of impairment was not predicted by the amount of lesion damage in any single area, the authors did report that extent of lesion within two sub-cortical regions (the subcallosal fasciculus and the middle one-third of the periventricular white matter [PVWM]) could, when used together, discriminate severely-affected patients from mildly-affected patients. It should be noted that the PVWM contains fibers of the arcuate fasciculus, which we have examined in this study and associated with speech production. More recently, lesion–behavior mapping techniques have been used on a voxel-by-voxel basis to implicate white matter tracts in the production of fluent speech. In particular, several studies have suggested involvement of the arcuate/superior longitudinal fasciculus to be related to impaired performance on the fluency subtest of the Western Aphasia Battery and decreased word production during conversational interviews; however, the VLSM method used in these studies does not allow differentiation between white and gray matter damage and their relation to speech impairment.7, 8
Despite the emergence of DTI as a means of tracing white matter tracts in vivo and, as a result, a growing body of evidence for the importance of fiber tract integrity in fluent speech production,30-32 very few researchers have investigated the predictive value of lesion size and location with respect to major fiber tracts. Several studies have related speech and language impairment after stroke to extent of lesion damage within specific cortical and sub-cortical structures30, 33-35; however, the aforementioned study by Naeser and colleagues29 remains the only one that has examined the relationship between white matter damage and impairment of speech production. In contrast to the qualitative nature of their investigation, our study is the first to quantitatively relate the extent of lesion damage within white matter tracts to verbal fluency.
Our results are of particular interest when considered in light of the dual-stream framework of auditory language processing originally proposed by Hickok and Poeppel.36 In this dual-stream model, the dorsal stream, which is thought to be serviced by the AF, is responsible for the mapping of sound onto articulatory-based representations whereas the ventral stream, which includes the UF and EmC, is involved in the mapping of sound onto meaning.11-13, 36-38 According to this model, speech rate should be more related to AF-lesion load, whereas measures of semantic processing and function (e.g. informativeness of content) should be more related to UF- and/or EmC-lesion load. However, we found that all three of our measures were predicted by AF-lesion-load, but neither EmC- nor UF-lesion load.
Possible explanations might be that our measures do not purely reflect one neural circuit or the other (e.g., WPM relies in part on retrieval of phonological word forms, although not as heavily as %CIUs does). As a result, all of the behavioral measures may correlate most strongly with damage to the most vulnerable tract of the three we considered. This tract is likely the AF. Furthermore, as was suggested by Hickock and Poeppel (2007),39 the dorsal stream (i.e., the AF) is more strongly left lateralized than the ventral stream and does not have the same degree of bihemispheric redundancy as the ventral stream. Furthermore, the AF mainly runs dorsal to the sylvian fissure, which is supplied by the superior division of the middle cerebral artery, and the superior division of the MCA is the most frequent stroke area. Regardless of the explanation our results highlight the critical role played by the AF in the feed-forward and feedback loops for the efficient mapping of articulatory-based representations onto phonemic representations.40
Although it has been suggested that the UF is important for tasks involving semantic processing, such as naming,41 our results are in accordance with those of a recent study,42 in which stimulation and resection of the UF in epileptic patients did not produce any deficits in performance on the naming subtest of the BDAE.
In the future, automation of AF-lesion load calculations may allow physicians and researchers to make more accurate prognoses regarding impairment of speech production after stroke and recovery potential, possibly even in the sub-acute stroke phase, and thus, identify optimal interventions for patients based on their lesion behavior profiles.
Supplementary Material
Acknowledgments
Funding This work was supported by grants from the National Institutes of Health [1RO1 DC008796, 3RO1 DC008796-02S1 ARRA].
Footnotes
Disclosures The authors have no conflicts of interest related to this manuscript, including employment, consultancies, honoraria, ownership or options, expert testimony, grants or patents receiving or pending, or royalties.
References
- 1.Lazar R, Antoniello D. Variability in recovery from aphasia. Current Neurology and Neuroscience Reports. 2008;8:497–502. doi: 10.1007/s11910-008-0079-x. [DOI] [PubMed] [Google Scholar]
- 2.Kertesz A, Harlock W, Coates R. Computer tomographic localization, lesion size, and prognosis in aphasia and nonverbal impairment. Brain Lang. 1979;8:34–50. doi: 10.1016/0093-934x(79)90038-5. [DOI] [PubMed] [Google Scholar]
- 3.Pedersen PM, Jorgensen HS, Nakayama H, Raaschou HO, Olsen TS. Aphasia in acute stroke - incidence, determinants, and recovery. Ann Neurol. 1995;38:659–666. doi: 10.1002/ana.410380416. [DOI] [PubMed] [Google Scholar]
- 4.Laska AC, Hellblom A, Murray V, Kahan T, Von Arbin M. Aphasia in acute stroke and relation to outcome. J Intern Med. 2001;249:413–422. doi: 10.1046/j.1365-2796.2001.00812.x. [DOI] [PubMed] [Google Scholar]
- 5.Lazar RM, Speizer AE, Festa JR, Krakauer JW, Marshall RS. Variability in language recovery after first-time stroke. J Neurol Neurosurg Psychiatry. 2008;79:530–534. doi: 10.1136/jnnp.2007.122457. [DOI] [PubMed] [Google Scholar]
- 6.Baldo JV, Schwartz S, Wilkins D, Dronkers NF. Role of frontal versus temporal cortex in verbal fluency as revealed by voxel-based lesion symptom mapping. J Int Neuropsychol Soc. 2006;12:896–900. doi: 10.1017/S1355617706061078. [DOI] [PubMed] [Google Scholar]
- 7.Bates E, Wilson SM, Saygin AP, Dick F, Sereno MI, Knight RT, et al. Voxel-based lesion-symptom mapping. Nature Neuroscience. 2003;6:448. doi: 10.1038/nn1050. [DOI] [PubMed] [Google Scholar]
- 8.Borovsky A, Saygin AP, Bates E, Dronkers N. Lesion correlates of conversational speech production deficits. Neuropsychologia. 2007;45:2525–2533. doi: 10.1016/j.neuropsychologia.2007.03.023. [DOI] [PMC free article] [PubMed] [Google Scholar]
- 9.Piras F, Marangolo P. Noun-verb naming in aphasia: A voxel-based lesion-symptom mapping study. Neuroreport. 2007;18:1455–1458. doi: 10.1097/WNR.0b013e3282ef6fc9. [DOI] [PubMed] [Google Scholar]
- 10.Schwartz MF, Kimberg DY, Walker GM, Faseyitan O, Brecher A, Dell GS, et al. Anterior temporal involvement in semantic word retrieval: Voxel-based lesion-symptom mapping evidence from aphasia. Brain. 2009;132:3411–3427. doi: 10.1093/brain/awp284. [DOI] [PMC free article] [PubMed] [Google Scholar]
- 11.Leclercq D, Duffau H, Delmaire C, Capelle L, Gatignol P, Ducros M, et al. Comparison of diffusion tensor imaging tractography of language tracts and intraoperative subcortical stimulations. J Neurosurg. 2010;112:503–511. doi: 10.3171/2009.8.JNS09558. [DOI] [PubMed] [Google Scholar]
- 12.Saur D, Kreher BW, Schnell S, Kummerer D, Kellmeyer P, Vry MS, et al. Ventral and dorsal pathways for language. Proc Natl Acad Sci U S A. 2008;105:18035–18040. doi: 10.1073/pnas.0805234105. [DOI] [PMC free article] [PubMed] [Google Scholar]
- 13.Friederici AD. Pathways to language: Fiber tracts in the human brain. Trends in Cognitive Sciences. 2009;13:175–181. doi: 10.1016/j.tics.2009.01.001. [DOI] [PubMed] [Google Scholar]
- 14.Hillis AE. The ‘standard’ for poststroke aphasia recovery. Stroke. 2010;41:1316–1317. doi: 10.1161/STROKEAHA.110.585364. [DOI] [PubMed] [Google Scholar]
- 15.Wilson SM, Henry ML, Besbris M, Ogar JM, Dronkers NF, Jarrold W, et al. Connected speech production in three variants of primary progressive aphasia. Brain. 2010;133:2069–2088. doi: 10.1093/brain/awq129. [DOI] [PMC free article] [PubMed] [Google Scholar]
- 16.Nicholas LE, Brookshire RH. A system for quantifying the informativeness and efficiency of the connected speech of adults with aphasia. J Speech Hear Res. 1993;36:338–350. doi: 10.1044/jshr.3602.338. [DOI] [PubMed] [Google Scholar]
- 17.Goodglass H, Kaplan E. Boston diagnostic aphasia examination (BDAE) 2. Philadelphia, PA: Lippincott Williams & Wilkins; 1983. [Google Scholar]
- 18.Raven JC. Coloured Progressive Matrices. Oxford, United Kingdom: Oxford Psychologists Press; 1995. [Google Scholar]
- 19.Smits CHM, Smit JH, van den Heuvel N, Jonker C. Norms for an abbreviated raven’s coloured progressive matrices in an older sample. J Clin Psychol. 1997;53:687–697. doi: 10.1002/(sici)1097-4679(199711)53:7<687::aid-jclp6>3.0.co;2-f. [DOI] [PubMed] [Google Scholar]
- 20.Kaplan E, Goodglass H, Weintraub S. Boston Naming Test. Philadelphia, PA: Lippincott Williams & Wilkins; 2001. [Google Scholar]
- 21.Rorden C, Brett M. Stereotaxic display of brain lesions. Behav Neurol. 2000;12:191–200. doi: 10.1155/2000/421719. [DOI] [PubMed] [Google Scholar]
- 22.Brett M, Leff AP, Rorden C, Ashburner J. Spatial normalization of brain images with focal lesions using cost function masking. NeuroImage. 2001;14:486–500. doi: 10.1006/nimg.2001.0845. [DOI] [PubMed] [Google Scholar]
- 23.Zhu LL, Lindenberg R, Alexander MP, Schlaug G. Lesion load of the corticospinal tract predicts motor impairment in chronic stroke. Stroke. 2010;41:910–915. doi: 10.1161/STROKEAHA.109.577023. [DOI] [PMC free article] [PubMed] [Google Scholar]
- 24.Catani M, Jones DK, ffytche DH. Perisylvian language networks of the human brain. Ann Neurol. 2005;57:8–16. doi: 10.1002/ana.20319. [DOI] [PubMed] [Google Scholar]
- 25.Catani M, Thiebaut de Schotten M. A diffusion tensor imaging tractography atlas for virtual in vivo dissections. Cortex. 2008;44:1105–1132. doi: 10.1016/j.cortex.2008.05.004. [DOI] [PubMed] [Google Scholar]
- 26.Jellison BJ, Field AS, Medow J, Lazar M, Salamat MS, Alexander AL. Diffusion tensor imaging of cerebral white matter: A pictorial review of physics, fiber tract anatomy, and tumor imaging patterns. AJNR Am J Neuroradiol. 2004;25:356–369. [PMC free article] [PubMed] [Google Scholar]
- 27.Kier EL, Staib LH, Davis LM, Bronen RA. Mr imaging of the temporal stem: Anatomic dissection tractography of the uncinate fasciculus, inferior occipitofrontal fasciculus, and meyer’s loop of the optic radiation. AJNR Am J Neuroradiol. 2004;25:677–691. [PMC free article] [PubMed] [Google Scholar]
- 28.Makris N, Pandya DN. The extreme capsule in humans and rethinking of the language circuitry. Brain Struct Funct. 2009;213:343–358. doi: 10.1007/s00429-008-0199-8. [DOI] [PMC free article] [PubMed] [Google Scholar]
- 29.Naeser MA, Palumbo CL, Helm-Estabrooks N, Stiassny-Eder D, Albert ML. Severe nonfluency in aphasia. Role of the medial subcallosal fasciculus and other white matter pathways in recovery of spontaneous speech. Brain. 1989;112(Pt 1):1–38. doi: 10.1093/brain/112.1.1. [DOI] [PubMed] [Google Scholar]
- 30.Breier JI, Hasan KM, Zhang W, Men D, Papanicolaou AC. Language dysfunction after stroke and damage to white matter tracts evaluated using diffusion tensor imaging. Am J Neuroradiol. 2008;29:483–487. doi: 10.3174/ajnr.A0846. [DOI] [PMC free article] [PubMed] [Google Scholar]
- 31.Hosomi A, Nagakane Y, Yamada K, Kuriyama N, Mizuno T, Nishimura T, et al. Assessment of arcuate fasciculus with diffusion-tensor tractography may predict the prognosis of aphasia in patients with left middle cerebral artery infarcts. Neuroradiology. 2009;51:549–555. doi: 10.1007/s00234-009-0534-7. [DOI] [PubMed] [Google Scholar]
- 32.Schlaug G, Marchina S, Norton A. Evidence for plasticity in white-matter tracts of patients with chronic broca’s aphasia undergoing intense intonation-based speech therapy. Ann N Y Acad Sci. 2009;1169:385–394. doi: 10.1111/j.1749-6632.2009.04587.x. [DOI] [PMC free article] [PubMed] [Google Scholar]
- 33.Hillis AE, Barker PB, Wityk RJ, Aldrich EM, Restrepo L, Breese EL, et al. Variability in subcortical aphasia is due to variable sites of cortical hypoperfusion. Brain Lang. 2004;89:524–530. doi: 10.1016/j.bandl.2004.01.007. [DOI] [PubMed] [Google Scholar]
- 34.Hillis AE, Work M, Barker PB, Jacobs MA, Breese EL, Maurer K. Re-examining the brain regions crucial for orchestrating speech articulation. Brain. 2004;127:1479–1487. doi: 10.1093/brain/awh172. [DOI] [PubMed] [Google Scholar]
- 35.Parkinson RB, Raymer A, Chang YL, FitzGerald DB, Crosson B. Lesion characteristics related to treatment improvement in object and action naming for patients with chronic aphasia. Brain Lang. 2009;110:61–70. doi: 10.1016/j.bandl.2009.05.005. [DOI] [PMC free article] [PubMed] [Google Scholar]
- 36.Hickok G, Poeppel D. Dorsal and ventral streams: A framework for understanding aspects of the functional anatomy of language. Cognition. 2004;92:67–99. doi: 10.1016/j.cognition.2003.10.011. [DOI] [PubMed] [Google Scholar]
- 37.Glasser MF, Rilling JK. Dti tractography of the human brain’s language pathways. Cereb Cortex. 2008;18:2471–2482. doi: 10.1093/cercor/bhn011. [DOI] [PubMed] [Google Scholar]
- 38.Parker GJM, Luzzi S, Alexander DC, Wheeler-Kingshott CAM, Ciccarelli O, Lambon Ralph MA. Lateralization of ventral and dorsal auditory-language pathways in the human brain. NeuroImage. 2005;24:656–666. doi: 10.1016/j.neuroimage.2004.08.047. [DOI] [PubMed] [Google Scholar]
- 39.Hickok G, Poeppel D. The cortical organization of speech processing. Nature Reviews Neuroscience. 2007;8:393–402. doi: 10.1038/nrn2113. [DOI] [PubMed] [Google Scholar]
- 40.Guenther FH, Ghosh SS, Tourville JA. Neural modeling and imaging of the cortical interactions underlying syllable production. Brain Lang. 2006;96:280–301. doi: 10.1016/j.bandl.2005.06.001. [DOI] [PMC free article] [PubMed] [Google Scholar]
- 41.Lu LH, Crosson B, Nadeau SE, Heilman KM, Gonzalez-Rothi LJ, Raymer A, et al. Category-specific naming deficits for objects and actions: Semantic attribute and grammatical role hypotheses. Neuropsychologia. 2002;40:1608–1621. doi: 10.1016/s0028-3932(02)00014-3. [DOI] [PubMed] [Google Scholar]
- 42.Duffau H, Gatignol P, Moritz-Gasser S, Mandonnet E. Is the left uncinate fasciculus essential for language? A cerebral stimulation study. J Neurol. 2009;256:382–389. doi: 10.1007/s00415-009-0053-9. [DOI] [PubMed] [Google Scholar]
Associated Data
This section collects any data citations, data availability statements, or supplementary materials included in this article.


