Abstract
Enabling the paradigm of quality by design requires the ability to quantitatively correlate material properties and process variables to measureable product performance attributes. In this study, we show how heterogeneities in compacted ribbon densities quantitatively correlate to tablet mechanical properties. These density variations, which have been purposely modulated by internal and external lubrications, are characterized longitudinally and transversally by nondestructive ultrasonic and X-ray micro-computed tomography measurements. Subsequently, different transversal regions of the compacted ribbon are milled under the same conditions, and granules with nominally the same particle size distribution are utilized to manufacture cylindrical tablets, whose mechanical properties are further analyzed by ultrasonic measurements. We consider three different ribbon conditions: no lubrication (case 1); lubricated powder (case 2); and lubricated tooling (hopper, side sealing plates, feed screws, and rolls) (case 3). This study quantitatively reveals that variation in local densities in ribbons (for case 1) and process conditions (i.e., internal case 2 and external lubrication case 3) during roller compaction significantly affect the mechanical properties of tablets even for granules with the same particle size distribution. For case 1, the mechanical properties of tablets depend on the spatial location where granules are produced. For cases 2 and 3, the ribbon density homogeneity was improved by the use of a lubricant. It is demonstrated that the mechanical performances of tablets are decreased due to applied lubricant and work-hardening phenomenon. Moreover, we extended our study to correlate the speed of sound to the tensile strength of the tablet. It is found that the speed of sound increases with the tensile strength for the tested tablets.
Key words: density distribution, elastic properties, nondestructive ultrasonic technique, roller compaction, tensile strength, x-ray micro-computed tomography
INTRODUCTION
A priori design of pharmaceutical dosage forms for optimal performance requires a strategy for selecting raw material properties and process conditions. Such an approach needs to be supported by a cascade of unit operation models that quantitatively tie input material/process conditions to output performance characteristics, providing in this manner the necessary closure conditions to enable an inherently iterative design methodology. Central to the success of this scheme is the ability of models to reproduce the experimental record, or model predictability, which in turns requires the availability of high-quality experimental data for model validation. In many cases, the variability in data sets is due to unaccounted spatial variations of the conditions observed during the manufacturing process. Providing a methodology for detecting and quantifying such variations and their effects on the downstream products is an essential step forward for improving dosage design. In this article, we establish a quantitative correlation between the transversal ribbon density variations to the lubrication conditions and to subsequent tablet properties manufactured with granules milled from transversal sections of the ribbon (i.e., left, middle, and right segments). We utilize ultrasonics—a simple, nondestructive, accurate, and fast methodology requiring no calibration—to map these spatial variations that have been contrasted vis-à-vis against X-ray micro-computed tomography (μCT) measurements. The ability to quantitatively link ribbon density variations to tablet properties provides the opportunity for developing designing strategies to select product formulation as well as process variables to meet target performance attributes, and thus advancing the quality-by-design (QbD) paradigm. To provide a better context for the findings of this study, we describe the roller compaction process giving emphasis to current efforts relating process conditions and tablet properties. In addition, we describe succinctly the utilization and current advances of ultrasonics and X-ray tomography for the quantitative characterization of pharmaceutical solids.
Roller compaction is a continuous dry pressure-induced agglomeration process in which granules with acceptable compaction properties, flowability, and compositional uniformity are formed from feed material consisting of mixtures of active and excipient powders. Roller compaction process relies on powder bonding mechanisms which are mediated by densification mechanisms including particle rearrangement, elastic and plastic deformation, and particle fragmentation (1,2). Although roller compaction has been used in the pharmaceutical industry for several decades and gained more attention and popularity in recent years (3–11), there is no well-established QbD methodology to study and quantitatively correlate the effect of density variations in ribbons on the final product mechanical performance. In the roller compaction process, powder blend is continuously fed into the feeding zone (slip region), where most of the densification is solely due to the particle rearrangement under relatively small stresses created by the feeding method. The densified powder blend is then gripped and subjected to high pressure at the compaction zone (nip region) between a pair of counter rotating rolls by gravity or a feed screw. The powder is forced toward the narrow gap between the rotating rolls due to the feeding mechanism as well as friction between the material and the roll surface. The extrusion zone (release region) is the final region where the densification stresses are relieved and the compacted material (i.e. ribbon, flake, briquette, or sheet) is released (1). At the extrusion zone, most of the elastic recovery/porosity expansion in the compacted material may occur. The ribbon is subsequently milled into granules and undergoes additional blending and lubrication before being compressed into pharmaceutical tablets.
Agglomeration in roll presses has several advantages, such as improvement in powder flow properties, significant control over final particle bulk density and particle size distribution, minimization of blend segregation, improvement in solubility and dispersion rates, high volume production of granules, and relatively low operational costs (1–12). However, this technique presents some drawbacks such as the generation of fines due to the leakage of uncompacted powder during roller compaction or due to the variation in the porosity of the ribbons during milling (13), loss of reworkability or loss of tabletability (14), and heterogeneous density distribution across the width and along the length of the roller-compacted ribbons (11).For instance, it has been reported(3,7,10) that the variation of local densities in the ribbons led to localized ribbon strength and consequently resulted in the differences in the non-uniform size distribution and strength of the produced granules for a given milling operation. In addition, the variation of local density and strength in a ribbon can affect powder flow, mixing, compaction, and physical stability, which, in turn, alter the final dosage form performance. It has been discussed by many researchers that the physical and the mechanical properties of tablets are known to potentially influence the solid dosage form’s physical stability (due to mechanical defect generation over time), the accuracy of dosage (due to density distribution), and the shelf life (due to residual stresses and defects in the coat and core materials) (3,15–18). Therefore, exploring and characterizing the density distributions in the roller-compacted ribbons and linking this knowledge to the mechanical performance of the compacted pharmaceutical material (i.e., powder-to-tablet) would provide a means to characterize tablet stability and structural integrity and improve tableting quality. A recent study has investigated the relationship between roller compaction conditions and tablet strength (10). It has been reported that tablets compressed from the granulation were weaker than those compressed by direct compression at the same compression force. Sheskey and Hendren (3) investigated the influence of granulation technique on the properties of a controlled-release matrix drug formulation. It has been observed that relatively smoother-surfaced granules with higher bulk and tap densities were produced from roller-compacted ribbons compared with high shear granulation (i.e., wet granulation). Sheskey et al. (19) studied roller compaction as a viable mechanical process to develop controlled-release matrix tablets. It has been indicated that an increase in roll pressure resulted in a decrease in tablet hardness and increase in tablet friability. The tabletability of the brittle and ductile materials has also been investigated (20). It has been reported that the tabletability of brittle materials such as lactose was not greatly affected by roller compaction, but for plastically deforming materials such as microcrystalline cellulose where tabletability decreased due to granule size enlargement (20). Zinchuk et al. (6) compared the ribbons produced using a lab-scale compactor with tablets produced by uniaxial compression with a compactor simulator. They found that the ribbons presented much larger variations in tensile strength and solid fraction values than tablets, which was due to the load transmission, non-uniform stress distribution, and density reduction across the length and the width induced during the roller compaction process.
As stated above, one of the major drawbacks associated with roller compaction is its loss of reworkability or reduced tabletability. Reworkability is defined as the ratio of the tensile strength of a material at a given solid fraction before and after roller compaction (1). Work hardening is often used to explain the loss of reworkability of dry granulated powders (1,14).Work hardening suggests that during the initial plastic deformation phase, a significant amount of random defects form in the particles. The high volume of defects or dislocation movements within the crystal structure in turn strengthens the particles and reduces the plasticity that is required for the permanent deformation of the granules during tableting, which can alter the mechanical and physical integrity of the produced final tablet. Malkowska and Khan (14) studied the effect of re-compression on the tableting properties of directly compressible starch, dicalcium phosphate dihydrate, and microcrystalline cellulose. They reported that re-compression reduced the tablet strength when the initial compaction was carried out at a higher pressure. They concluded that the reason for the reduction of tensile strength upon re-working was due to work hardening and the production of robust granules, which have increased resistance to deformation compared with unworked (i.e., non-compacted) particles. In other words, the granules become more difficult to plastically deform after being compacted multiple times.
The mechanical and physical properties of a tablet such as elastic properties, mechanical strength, and mass density are closely related to the unit operations employed in its production (e.g., roller compaction and tableting). Over the decades, volume reduction mechanism, bond formation and compaction characteristics of pharmaceutical powders (21–23), and the mechanical and physical property characterization of tablets either with destructive (15,16,24,25) or with nondestructive (17,26–29) methods have been intensely studied. Relatively few studies (11,30–32) have focused on the determination of the density distributions in roller-compacted ribbons and the impact of the localized ribbon density on the performance of the final pharmaceutical solid dosage form using nondestructive methods. Nondestructive ultrasonic testing has been recently utilized to characterize the elastic properties of the coat and the core materials of tablets (26–28). Ultrasound differs from X-rays because the propagation speed is much lower and thus it is possible to measure the exact pressure of the wave as a function of time. From the pressure waveform, it is possible, for example, to measure not only the attenuation of the pressure field but also the delay in the signal induced by the local density variations. In a recent study using a nondestructive ultrasonic technique, it has been demonstrated that the local mechanical hardness (i.e., local Young’s modulus) was proportional to the local density in a tablet (27,28). It has also been reported that the local Young’s modulus values vary with different testing orientations, which indicates Young’s modulus anisotropy in the compacted tablets.
In the current study, for the first time, nondestructive ultrasonic testing and X-ray μCT are utilized to determine the variation of local densities in the roller-compacted ribbons and to systematically study the effect of these variations on the material properties of the produced tablets after minimizing the impact of the particle size. In the presented nondestructive ultrasonic technique, an acoustic wave pulse (in the bandwidth of ultrasonic frequencies) is generated by a pitching transducer and the acoustic field transmitted through the transversal sections of the test ribbon, namely, left, middle, and right, was captured by the receiving transducer in contact with the opposite face of the ribbon and digitized as a waveform by the oscilloscope. The propagation of acoustic waves (wave packets) is governed by the mechanical properties of materials (i.e., mass density, Young’s modulus, and Poisson’s ratio); therefore, methods based on acoustic waves result in direct measurements of such properties. Based on the measurement of the time of flight (TOF) of an acoustic wave pulse to travel through the test ribbon, variation of local densities in the ribbon was characterized. These findings were also confirmed by the X-ray μCT analysis. Subsequent milling and compaction of these ribbons revealed that variation in local densities in the ribbons and process conditions such as internal or external lubrication drastically affect the mechanical properties of the final tablet for a given milling condition and particle size distribution. This paper includes six major components: ribbon production using a roller compactor, characterization of density distribution in ribbons using nondestructive ultrasonic testing and X-ray μCT, subsequent milling and compression/tableting, analysis of compression data, visualization of the tablet surface morphology under scanning electron microscope (SEM), and mechanical characterization of tablets. Due to the interdisciplinary nature of the nondestructive techniques covered in this paper, a concise background is reviewed separately at the beginning of each section.
MATERIALS AND METHODS
Materials
In the current study, microcrystalline cellulose MCC (Lot no. P208819508, Avicel PH102, FMC Biopolymer, Newark, DE) and magnesium stearate (MgSt; Lot no. V18852, USP, Mallinckrodt, NJ) were employed as the test and the lubricant materials, respectively. The true density of the pure virgin MCC was measured by helium pycnometry (AccuPyc 1330, Micromeritics Instrument Corp., Norcross, GA) in triplicate using fresh samples each time. In order to investigate the effect of lubrication on the density distribution in the ribbons, three cases were considered. In case 1 (hereafter referred to as C1), MCC was roller-compacted without lubricating the powder, rolls, side sealing, feed screws (vertical and horizontal), and the feed hopper. In case 2 (hereafter referred to as C2), MCC was prepared by adding 0.5% (w/w) MgSt and blended for 15 min at 15 rpm (Twin Shell V-Blender, Patterson-Kelley, East Stroudsburg, PA). In case 3 (hereafter referred to as C3), rolls, feed screws, and side sealing plates at the compaction zone were sparingly lubricated with MgSt powder suspended in methanol (5%, w/v). For each case, the masses of powders that was filled into the feed hopper were kept identical, i.e., 2,970 g of MCC for C1, 2,955 g of MCC + 15 g of MgSt for C2, and 2,970 g of MCC for C3. All powder materials were used as received, with the exception of MgSt which was pre-screened through a 297-μm (48-mesh) screen to minimize agglomeration. In the current study, all measurements were conducted at ambient conditions of 23 ± 2°C and 38 ± 5% RH.
Methods
Ribbon Preparation
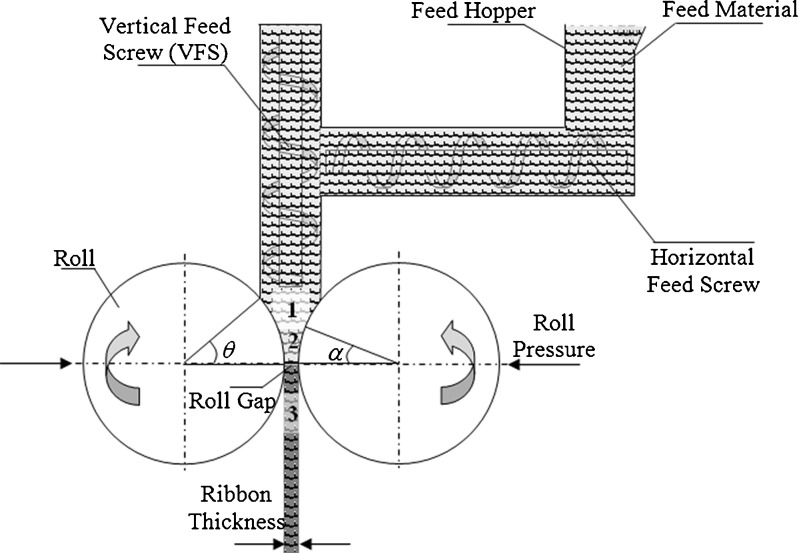
Powders were roller-compacted using an instrumented roller compactor (Fitzpatrick, IR520). Fluted rolls of 203 mm in diameter and 50 mm in width were used for roller compaction. The rationale behind the selection of fluted rolls is to demonstrate that the proposed nondestructive ultrasonic methodology can determine the density distribution in different parts of a ribbon even for complex ribbon shapes. The powders were fed into the compaction zone with vertical and horizontal feed screws through a feed hopper (Fig. 1). In all three cases, the examined powders were compacted at a roll speed of 10 rpm; vertical feed screw speed of 100 rpm; horizontal feed screw speed of 20 rpm; roll gap of 2 mm; and maximum roll pressures of 65.9, 33.8, and 72.1 MPa for cases 1, 2, and 3, respectively. The ribbons were collected after the first minute of each run for 2 min. The ribbons produced at the beginning and at the end of the roller compaction were discarded. By adjusting the powder feed screw speed, the thickness of the produced ribbon was kept approximately constant at 2 mm (coefficient of variation of 3.6%). For the X-ray μCT nondestructive ultrasonic testing and tableting, a series of 50 ribbons per case were employed. The same ribbons were used throughout each experiment. The thickness, width, and length of the selected ribbons were measured by a digital caliper (±0.01 mm, Starrett B5000BZ-40/1000, Athol, MA) and the mass was recorded by an electronic balance (±0.1 mg, Fisher Scientific XD-800, Pittsburgh, PA) immediately after roller compaction. The width, thickness, and length of the selected ribbons were 49 ± 1, 2 ± 0.2, and 27 ± 1.1 mm, respectively. It is observed that some of the collected ribbons have less width than the roll width (e.g., all case 2 and some of the case 1 ribbons). This is attributed to the leakage of loose powder at the ribbon edges which are relatively less compacted. To determine the solid fraction (SF) values of different locations of the ribbons, the collected samples were sectioned into three segments of approximately 34 × 2 × 27 mm as middle and 7.5 × 2 × 27 mm (width × thickness × length) as left and right edges. The solid fraction was then calculated from the following relationship:
 |
1 |
where ρt is the true density of the virgin MCC powder and ρe is the envelope density of each section, which is defined as the ratio of the section mass to the section apparent volume, including pores and cavities. The envelope density values of each section were measured using an envelope density analyzer (GeoPyc 1360, Micromeritics). A 25.4-mm internal diameter tube was used for the envelope density measurement. For each ribbon section, five replicate readings were carried out. A consolidation force of 51 N and a conversion factor of 0.5153 cm3/mm were used. It was observed that for each case, the SF values of each section remained reasonably constant during the roller compaction process (Table I). The reported envelope density and SF data for each section are a mean of 50 determinations.
Fig. 1.
Schematic diagram of the roller compaction process (not to scale). Different zones of roller compactor: 1 Feed zone (slip region), 2 Compaction zone (nip region), and 3 Extrusion zone (release region). θ and α are the entry and nip (gripping) angles, respectively
Table I.
Particle Size Distributions of the Milled Granules and Section Solid Fractions of the Ribbons Used
| Left section of the ribbon | Middle section of the ribbon | Right section of the ribbon | Virgin MCC powder | |||||||
|---|---|---|---|---|---|---|---|---|---|---|
| Case 1 | Case 2 | Case 3 | Case 1 | Case 2 | Case 3 | Case 1 | Case 2 | Case 3 | n/a | |
| Section solid fraction | 0.53 | 0.45 | 0.63 | 0.70 | 0.48 | 0.66 | 0.57 | 0.46 | 0.65 | n/a |
| Particle size distribution (μm) D(v,0.5) | 68 | 71 | 72 | 67 | 71 | 73 | 69 | 71 | 73 | 70 |
X-ray Micro-computed Tomography: Determination of the Density Distribution in the Ribbons
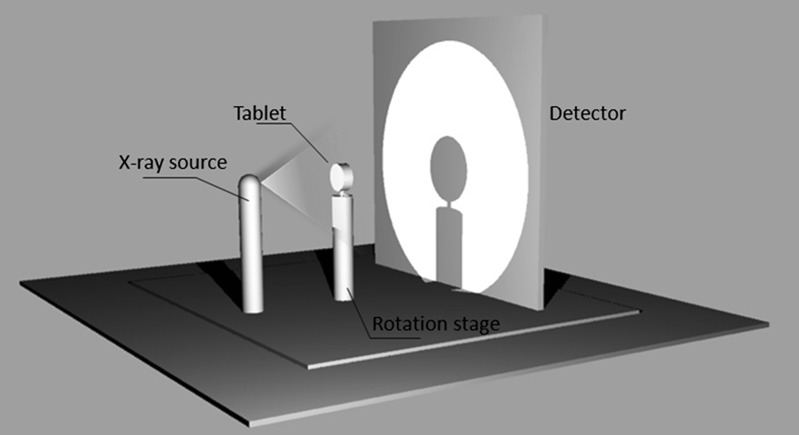
X-ray micro-computed tomography is a volumetric imaging technique which permits noninvasively determining the density of a material in space on the principle of attenuation of when X-rays pass through it (33). The specimen is placed on a rotating stage between a microfocal monoenergetic source and a charge-coupled device (CCD) array-based detector (Fig. 2). A phosphor plate between the specimen and the detector is used to intensify the image. Most modern industrial μCT systems are capable of attaining resolutions of <50 μm. Projection images (radiographs) of the object are obtained in slices at specified angular rotational steps, from which horizontal slices are reconstructed utilizing Fourier-based filtered back-projection algorithms. The attenuation values calculated as a function of space obeys the Beer–Lambert’s law:
 |
2 |
where Io is the incident X-ray intensity, I is the measured X-ray intensity, μ is the linear attenuation coefficient (per centimeter), and x is the sample length. Upon normalizing by the mass density, the mass attenuation coefficient (μ/ρ is found to be constant for most materials over a range of energies, leaving the attenuation values (CT or HU) as a function of density and path alone. By means of calibration, it is quantitatively possible to determine the density of the sample as a function of space at a sufficiently high resolution. The individual slices can be stacked up and a 3D volumetric reconstruction of the specimen can be obtained using standard interpolation techniques such as marching cubes or adaptive rendering.
Fig. 2.
X-ray micro-computed tomography principle
In the reported study, X-ray μCT measurements were carried out on a high-resolution SkyScan-1172 XRCT (SkyScan, Kontich, Belgium). The X-ray source was operated at a voltage (U) of 50 kV and a current (I) of 100 μA. The total sample rotation was set at 180° with an interval of 0.6° (i.e., the ribbon was scanned every 0.6°). The spatial resolution was 14.8 μm/pixel for the ribbons considered (i.e., 14.8-μm resolution size in the three directions after image reconstruction). Magnified transmitted projection pictures were detected by a 2D X-ray CCD camera with 1,024 × 1,024-pixel resolution 12-bit dynamic range sensor. To minimize the beam hardening artifacts, an aluminum–copper plate of 0.5-mm thickness was placed over the X-ray source to filter the low-energy X-rays. Depending on the sample length, typical image acquisition times were in the range of 20–25 min. The reconstruction was carried out with the NRecon software (SkyScan). Quantitative parameters such as thresholding were analyzed using CT analyser (CTAn) software (SkyScan). Three-dimensional model rendering and viewing were performed using associate program CT-Volume (CTVol) software (SkyScan). ImageJ software, which is a public domain Java-based image processing program, was employed to analyze all the images (http://www.nih.gov).
Image Processing
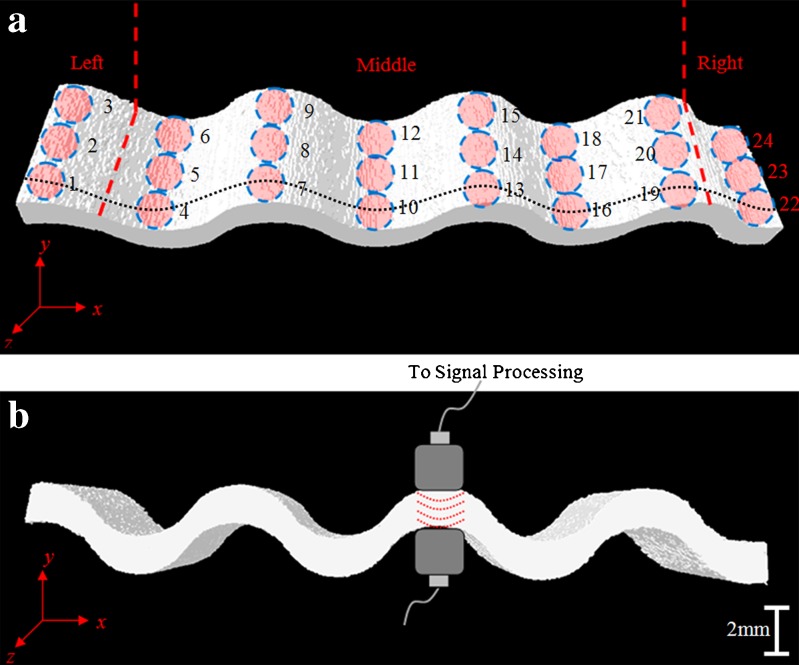
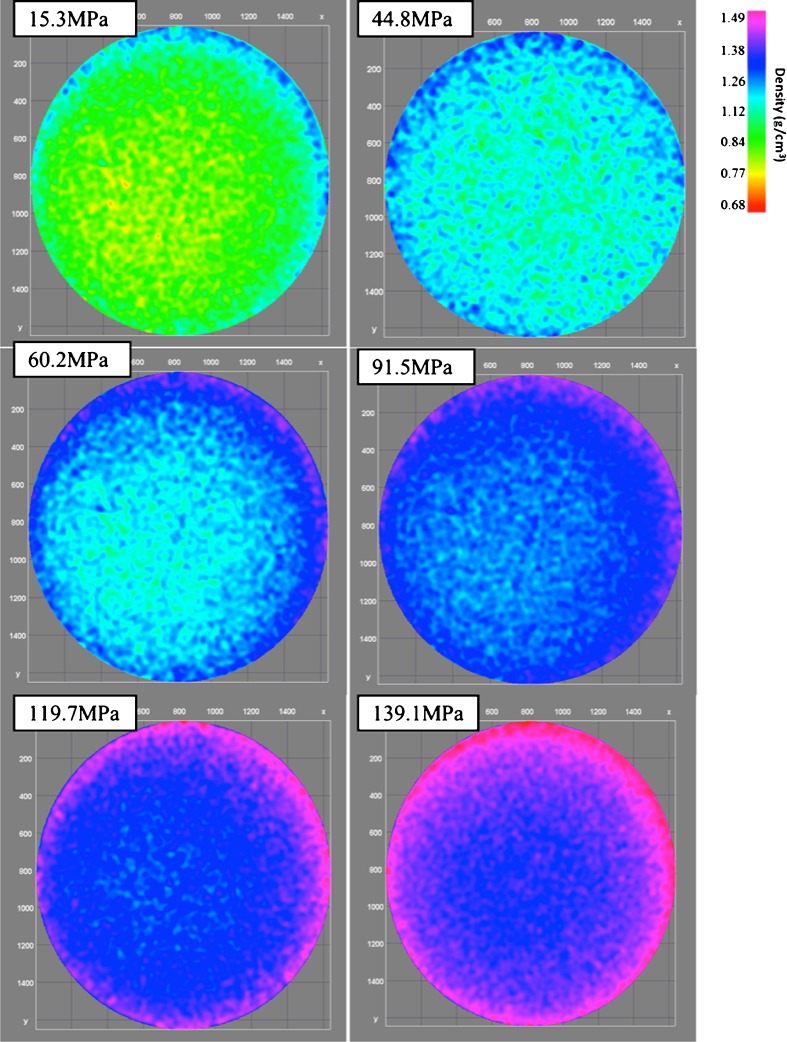
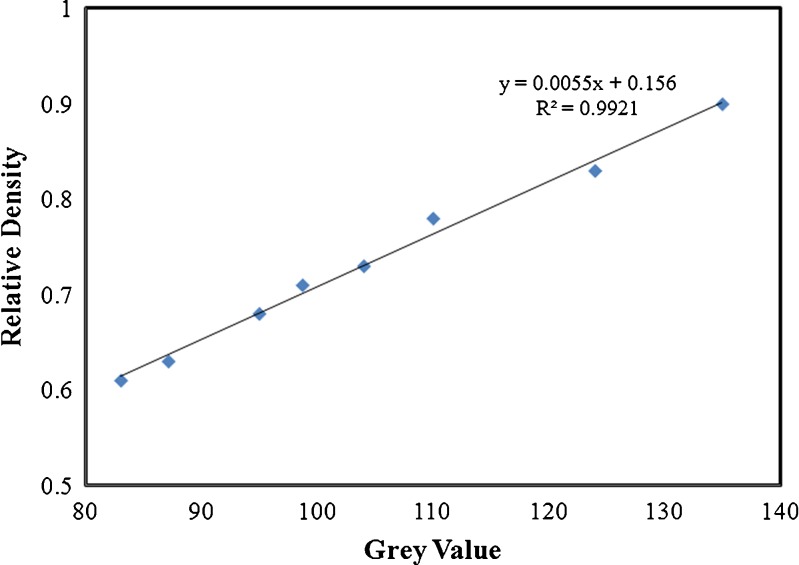
Due to the large volume of data and the size of the individual image data set, images were resized to reduce computer storage space and improve computational efficiency. Matlab7.9b (The Mathworks, Natick, MA, USA) software was utilized for the following image processing steps. In the first step, individual images were read into 2D matrices and then stacked up to render 3D volume. Further reduction in data was achieved by cropping individual slices to eliminate most empty voxels. Since, in practice, the X-ray source is non-monoenergetic, despite the use of an aluminum–copper filter, it was observed that few beam hardening artifacts of relatively lower grayscale values remain. To prevent their contribution to the calculations, artifacts were eliminated by assigning a zero value for all voxels with values below a cutoff. The choice of this cutoff value was made, visually, by selecting the grayscale value at which almost all the artifacts just vanish. Figure 3 depicts the 3D volumetric regeneration of the sectioned ribbon with the dimensions of 49-mm width, 2-mm thickness, and 7.6-mm length along the x, y, and z-axes. To compute the relative densities of the compacted ribbons, a statistical approach has been used. Sample tablets of the same material as the ribbons (MCC) and same thickness as the ribbons were compacted in the tablet emulator in a compression pressure range of 15–140 MPa. Each of the tablets were scanned maintaining the exact same scan parameters (i.e., resolution, rotation step, voltage, and intensity) as used for the ribbons (Fig. 4). The average grayscale value of each of the tablet and the relative densities were computed. Figure 5 shows the plot of tablet relative density vs. average tablet grayscale value. In agreement with our presumption, the plot is strongly linear (R2 = 0.9921). We have used this plot as the basis of calibration to determine the relative densities of the compacted ribbons by interpolating the mean grayscale values of the ribbons.
Fig. 3.
Reconstructed X-ray micro-computed tomography images of the actual roller-compacted ribbon with its perspective (a) and side (b) views. Piezoelectric transducers with a diameter of 3 mm are illustrated during a scan operating in pitch-catch mode (b). Dashed circles correspond to the ultrasonically scanned areas (a) (Left: 1, 2, 3–Middle: 4–21–Right: 22, 23, 24). a Dotted line represents the X-ray micro-computed tomography cross-section image in Fig. 10. The ribbon thickness is measured as 2 ± 0.2 mm (x = width, y = thickness, z = length)
Fig. 4.
X-ray micro-computed tomography cross-section images obtained after 2D reconstruction of the calibration tablets compacted in a compression pressure range of 15–140 MPa. The images are taken at mid-height of tablets
Fig. 5.
Correlation between relative densities of the calibration tablets made with different compression pressures and the grayscale values
Nondestructive Ultrasonic Testing
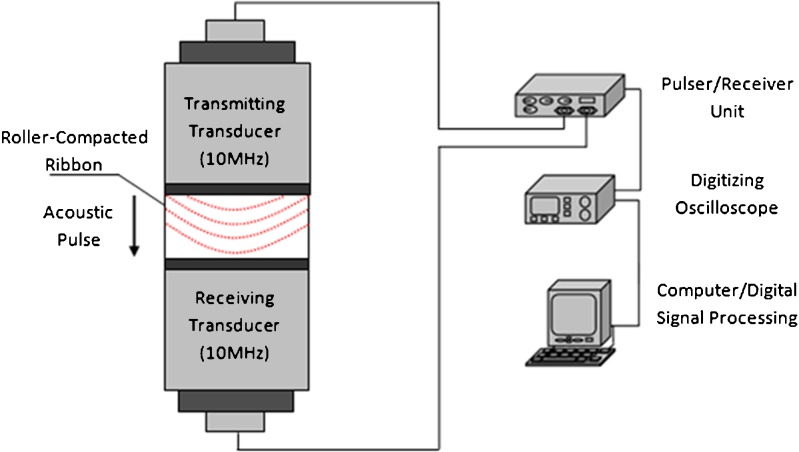
Elastic properties (e.g., Young’s modulus E and Poisson’s ratio ν) and the difference in the solid fraction (i.e., the proportion of solid in the compact, 1 − porosity) of a material can be determined by measuring the acoustic properties of pressure (longitudinal waves) and shear (transverse waves) pulses propagating in the material as the propagation of elastic waves in a material is governed by such parameters (28). The presented nondestructive ultrasonic method is based on the measurement of the TOF of an acoustic wave pulse (in the bandwidth of ultrasonic frequencies) to travel through the specimen from the transmitting transducer to the receiving one (Fig. 6). The experimental setup developed for the ultrasonic measurements consists of a pulser/receiver unit (Panametrics, 5077PR), a pair of piezoelectric longitudinal wave transducers (Panametrics, V129-RM) with a central frequency and a diameter of 10 MHz and 3 mm, respectively, a pair of piezoelectric longitudinal wave transducers (Panametrics, V111-RM) with a central frequency and a diameter of 10 MHz and 13 mm, respectively, a digitizing oscilloscope (Tektronix TDS3052), and a computer controlling the data acquisition. For the determination of density distribution in the ribbons, two piezoelectric longitudinal wave transducers (i.e., transducer with a diameter of 3 mm), operating in a pitch-catch mode, were placed in direct contact with the top and bottom surfaces of the ribbon, as shown in Fig. 4. For ultrasonic testing (UT), 1 × 3 test points along the width (x-axis) and length (z-axis) of the left and right edges and 6 × 3 test points along the width (x-axis) and length (z-axis) of the middle side of the ribbon were probed (Fig. 3). The ultrasonic responses of these test points obtained from UT (Fig. 7) were then compared with the X-ray μCT images. In order to prevent damage to the ribbons tested, a thin, adhesive plastic tape layer with a thickness of d (d << λ, where λ denotes the ultrasonic wavelength) was used as an acoustic couplant instead of a glycerin gel. Acoustic impedance of the ribbon material is much higher than the acoustic impedance of soft plastic layer; therefore, the influence of the interface is minimal. The TOF in the plastic tape, 0.19 μs, was subtracted from the determined TOF of each sample. A square electrical pulse from the pulser/receiver unit was then launched into the pitching transducer with a central frequency of 10 MHz. The acoustic field transmitted through the ribbon was captured by the receiving (catch) transducer in contact with the other face of the ribbon and digitized as a waveform by the oscilloscope. In order to determine the Young’s modulus values of compacted tablets, the reported procedure was applied with 10-MHz longitudinal wave transducers (i.e., transducer with a diameter of 13 mm) to acquire the longitudinal acoustic wave values of each tablet. To determine the times of flight of pressure waves, a Matlab7.9b (The Mathworks) subroutine was used to record the time instants when the signal amplitude exceeds a threshold value set at three times the background ultrasonic noise level and saved these values as the arrival times of the pressure waves. Processing of the acquired waveforms yields the time-of-flight values of the pressure acoustic wave Δtp (Fig. 8). The longitudinal (pressure) phase velocity, cp, can be related to Δtp in the medium by
 |
3 |
where h is the distance traveled in the tablet. cp is a function of the mass density ρ of the propagation medium, the Young’s modulus E of the medium, that is,
 |
4 |
Fig. 6.
Schematic of the nondestructive ultrasonic experimental setup with a pair of 10-MHz transducers operating in pitch-catch mode (not to scale)
Fig. 7.
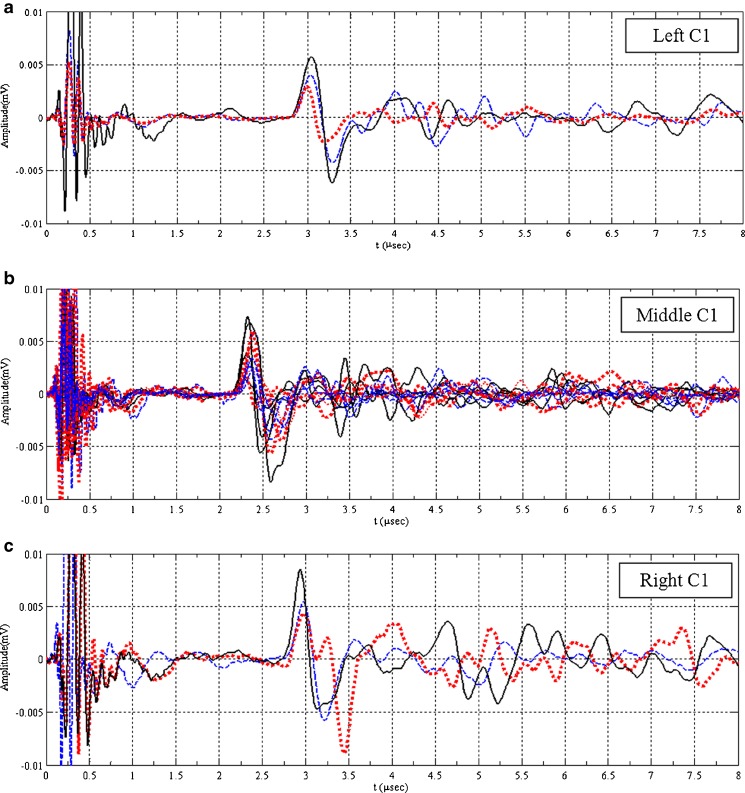
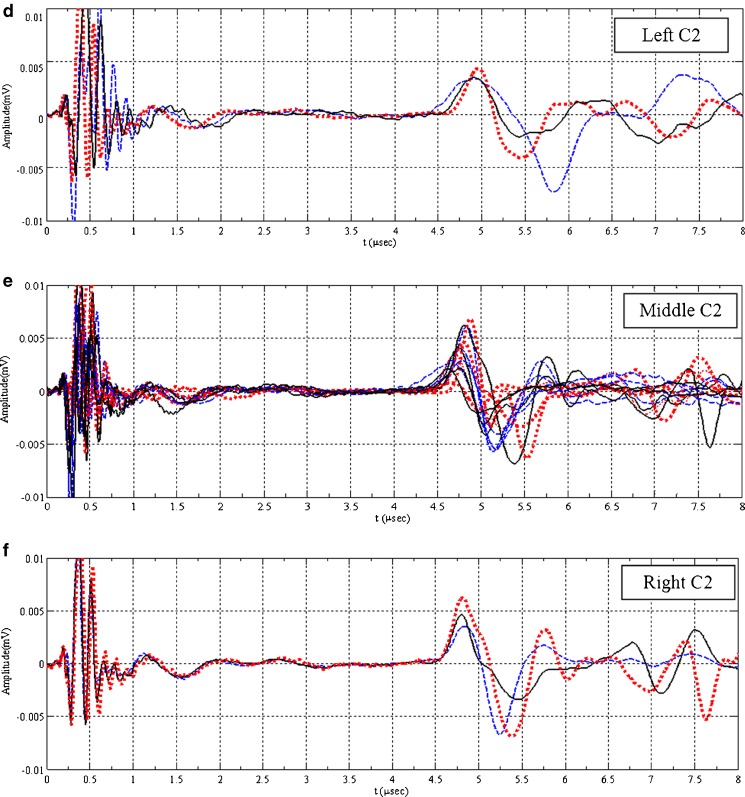
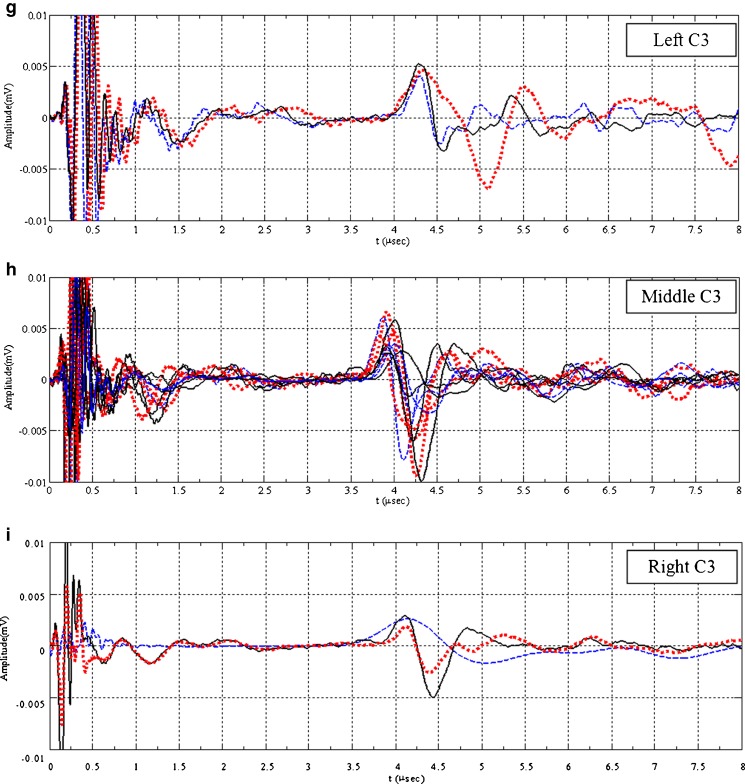
Longitudinal (pressure) acoustic waveforms for the ribbons obtained in case 1 (a–c), case 2 (d–f), and case 3 (g–i). Dashed, solid, and dotted waveforms correspond to the ultrasonically scanned points as the first (1, 4, 7, 10, 13, 16, 19, 22); middle (2, 5, 8, 11, 14, 17, 20, 23); and the last (3, 6, 9, 12, 15, 18, 21, 24) rows on the ribbon in the z-direction (i.e., along the length of the ribbon), respectively
Fig. 8.
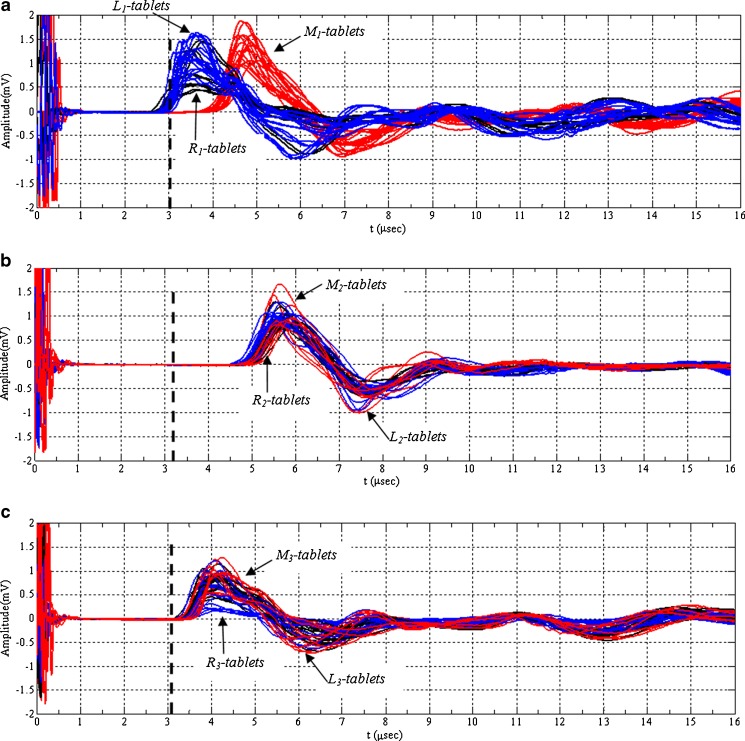
Comparison of the longitudinal (pressure) acoustic waveforms for case 1 (a), case 2 (b), and case 3 (c) tablets with solid fractions of 0.85. Dashed lines show the mean average of the acoustic arrival times for tablets prepared with virgin unlubricated MCC powder (3.04 μs) (a), virgin lubricated MCC powder (3.22 μs) (b), and virgin unlubricated MCC powder formed using lubricated die–punch set (3.09 μs) (c)
From Fig. 8, the arrival times, Δtp, were measured and for a known tablet thickness, the h and cp values were determined for each tablet (Table II). In the reported nondestructive ultrasonic measurements, the sampling resolution of the acquired acoustic signals was 100 ns, the pulse repetition frequency was 1 kHz, and the oversampling rate of the digitizing oscilloscope was set to 512. All measurements were conducted in triplicate.
Table II.
Summary of the Ultrasonic and Physical Properties of Tablets and Roller-Compacted Ribbons
| Case no. | Section | Tablet (n = 30) | Ribbon (n = 50) | ||||
|---|---|---|---|---|---|---|---|
| Mass density, ρ (g/cm3) | Thickness, h (mm) | Δt p (μs) | c p (m/s) | Δt p (μs) | c p (m/s) | ||
| Case 1 | Left | 1.32 (0.005) | 4.05 (0.008) | 2.85 (0.08) | 1,422.13 (16.11) | 2.59 (0.03) | 769.26 (18.14) |
| Middle | 1.31 (0.008) | 4.06 (0.014) | 4.16 (0.09) | 976.74 (17.76) | 1.79 (0.08) | 1,111.53 (17.73) | |
| Right | 1.33 (0.002) | 4.05 (0.009) | 3.05 (0.07) | 1,328.21 (21.33) | 2.40 (0.07) | 833.31 (12.21) | |
| Case 2 | Left | 1.31 (0.006) | 4.06 (0.014) | 5.12 (0.14) | 793.71 (18.62) | 4.40 (0.06) | 454.16 (11.52) |
| Middle | 1.32 (0.009) | 4.06 (0.017) | 5.12 (0.23) | 794.42 (12.37) | 4.22 (0.05) | 473.41 (14.35) | |
| Right | 1.31 (0.011) | 4.06 (0.016) | 5.20 (0.22) | 782.04 (20.01) | 4.27 (0.08) | 467.81 (4.54) | |
| Case 3 | Left | 1.31 (0.005) | 4.05 (0.016) | 3.56 (0.09) | 1,138.25 (14.28) | 3.74 (0.09) | 533.76 (18.27) |
| Middle | 1.31 (0.003) | 4.06 (0.008) | 3.57 (0.08) | 1,137.77 (13.26) | 3.32 (0.10) | 601.23 (41.89) | |
| Right | 1.31 (0.007) | 4.06 (0.011) | 3.58 (0.11) | 1,135.05 (11.81) | 3.65 (0.04) | 547.46 (10.11) | |
| Unlubricated | 1.31 (0.012) | 4.06 (0.009) | 2.48 (0.04) | 1,637.46 (12.78) | n/a | n/a | |
| Virgin MCC powder | |||||||
| Lubricated | 1.32 (0.009) | 4.05 (0.007) | 2.66 (0.05) | 1,523.05 (15.99) | n/a | n/a | |
| Virgin MCC powder | |||||||
| Virgin MCC powder (lubricated tooling) | 1.31 (0.006) | 4.06 (0.011) | 2.53 (0.06) | 1,605.54 (13.72) | n/a | n/a | |
| Case 1 (blend) | 1.32 (0.010) | 4.06 (0.012) | 3.97 (0.10) | 1,021.14 (13.31) | n/a | n/a | |
| Case-2 (blend) | 1.31 (0.012) | 4.06 (0.008) | 5.17 (0.07) | 785.43 (14.78) | n/a | n/a | |
| Case 3 (blend) | 1.32 (0.007) | 4.05 (0.005) | 3.55 (0.08) | 1,139.67 (12.25) | n/a | n/a | |
Standard deviations in estimate of grams per cubic centimeter (for ρ), millimeters (for h), microseconds (for Δt p), and meters per second (for c p) are included in parenthesis. Tablet solid fraction of 0.85
Compact Preparation
Sieving
For each case of ribbons, randomly collected 50 samples were carefully sectioned into three segments as left, middle, and right of the ribbon (Fig. 3) and subsequently milled into granules using a QuadroCoMil (Model 197S, Quadro Engineering, Inc., Waterloo, OT, Canada). The impeller speed was set at 900 rpm. A stainless steel screen with opening size of 210 μm (65 mesh) was used for milling. By restricting the use of the roller-compacted powder to a narrow particle size range, the effect of particle size on the mechanical properties of tablets could be minimized. The average particle size distribution of 63–74 μm was obtained by sieving the granulated powders and the pure virgin MCC from the same stock that was not roller-compacted (i.e., unworked) using an analytical sieve shaker with an automatic shaking mechanism (Sieve Shaker AS200 Control, Retsch, Inc., Newtown, PA) for 10 min for each run using three screens with opening sizes of 149 μm (100 mesh), 74 μm (200 mesh), and 63 μm (250 mesh). Powders and granules that were retained on the 63-μm screen were employed throughout the tablet compaction. The mean particle size distributions of all powders were then measured using a laser diffraction particle size analyzer (Malvern Mastersizer 2000, Southborough, MA, USA) equipped with a dry powder feeder. A sample size of approximately 1 g of powder was used for each analysis. The volume median diameter D(v,0.5) was used to calculate the average particle size (Table I).
Tablet Compaction
Virgin MCC powder and roller-compacted granules were compressed using a tableting emulator (Presster; Metropolitan Computing Corp., NJ) to simulate a Fette2100 (47 stations) press with a press speed of 16.4 rpm. A dwell time of 27 ms (i.e., the time when the flat portion of the punch head is in contact with the compaction roll), corresponding to a production speed of 42,400 tablets per hour, was used. The ejection angle was set at 5.3°. No pre-compression was used. A set of flat-faced punches (10-mm diameter) was used for compression. For the mechanical property characterization of each case, a series of 30 tablets from the left, middle, and right sections of the ribbon were produced (hereafter referred to as Li tablet, Mi tablet, and Ri tablet, respectively, where i is the corresponding case number). For comparison purposes, using the same compaction settings, tablets were produced with unlubricated sieved virgin MCC powder, sieved virgin MCC powder blended with MgStat at 0.5% (w/w) level for 15 min at 15 rpm, and unlubricated sieved virgin MCC powder using a lubricated die and punch surfaces with MgSt suspended in methanol (5%, w/v). For each case, granules obtained from the left, middle, and right sections were also blended for 15 min at 15 rpm and compacted using the same compaction settings. The compaction profiles for each tablet were recorded. Each powder was compressed to a target solid fraction of 0.85 when possible, which is typical of pharmaceutical tablets (34). The thickness and diameter of the tablets were carefully measured by a digital caliper (±0.01 mm, Starrett B5000BZ-40/1000), and the weight was recorded by an electronic balance (±0.1 mg, Fisher Scientific XD-800) immediately after ejection. From these measurements, the volume and packing density of tablets were determined (Table II).
Analysis of Compression: Heckel Analysis
Heckel analysis is the most frequently used method for studying the powder volume reduction process which is based on the assumption that the volume reduction of the powder during compression follows first-order kinetics in which the pores constitute the reactant (35). The kinetics of the process may be described as the proportionality between the change in the density with pressure and the pore fraction. The relation was described by the following equation:
 |
5 |
where D is the relative density, P is the applied pressure, and K and A are constants that describe the ability of the compact to deform plastically and the ability of the particle movement and rearrangement at low pressures before interparticulate bonding, respectively. In the current study, out-of-die Heckel analysis was performed to determine the mean yield pressures of the powders. Out-of-die analysis can be characterized by two phases: (1) the initial curvature that is due to particle rearrangement (35), particle fragmentation (36), and a decrease in the total porous volume and (2) linear phase that is attributed to densification and plastic deformation. The slope of the linear region is the Heckel constant (K). Hersey and Rees (37) demonstrated that the reciprocal of K represents the mean yield pressure Py by the expression Py = 1/K. For the out-of-die analysis and elastic recovery measurements, using the virgin powder, blends and granules were compacted in a compression pressure range of 15–125 MPa. The corresponding tableting data were evaluated in order to determine the mean yield pressure, Py, values.
Elastic Recovery
The elastic recovery (ER) that describes the percentage of axial expansion of a compact is determined according to the following equation:
 |
6 |
where h0 is thickness of the tablet “out of die” and hf is thickness of the tablet “in die.” h0 was measured using a digital caliper (±0.01 mm, Starrett B5000BZ-40/1000) and hf is the height of the tablet in the die at maximum pressure which is determined directly from the tableting emulator. All tablets were tested and mechanically characterized on the same day to reduce the effects of aging and ambient conditions on the measurements.
Tensile Strength Measurements
Using the same nondestructively tested tablets, we have conducted destructive tensile strength measurements using a conventional hardness tester (Schleuniger tablet tester 6D, Pharmatron, Inc., Manchester, NH). The mean of 30 measurements was used. The diametrical compression test is carried out by subjecting a tablet with a low height-to-diameter aspect ratio to compression across its diameter between two rigid platens. Assuming that the material is linear elastic up to failure, from the recorded maximal tablet breaking force (F) and measured tablet dimensions (i.e., diameter d and thickness t), tensile strength can be calculated by (38)
 |
7 |
Scanning Electron Microscopy
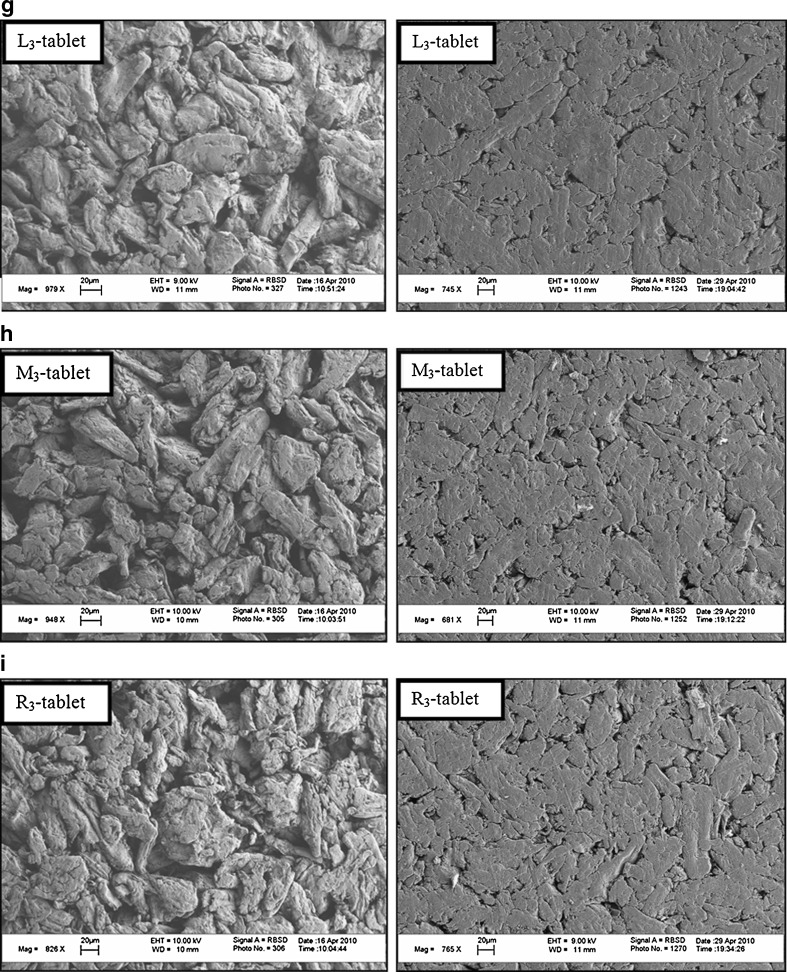
The upper surfaces of tablets (i.e., the surface normal to the compaction direction) compacted to solid fractions of 0.60 and 0.85 were qualitatively evaluated via a scanning electron microscope (LEO 1530VP FESEM), as illustrated in Fig. 9.
Fig. 9.
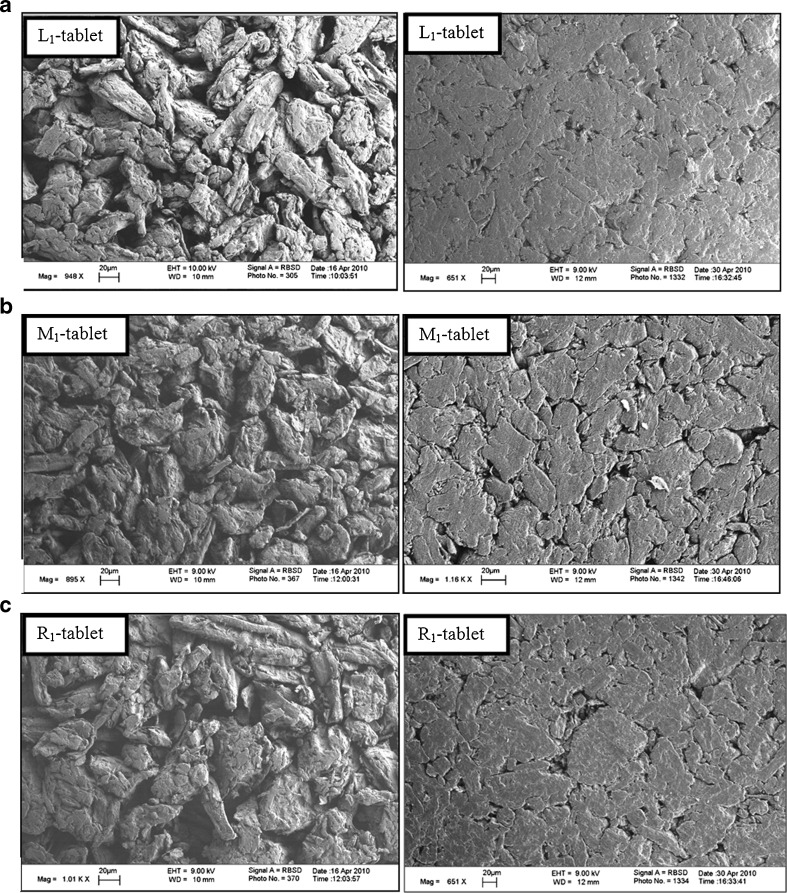
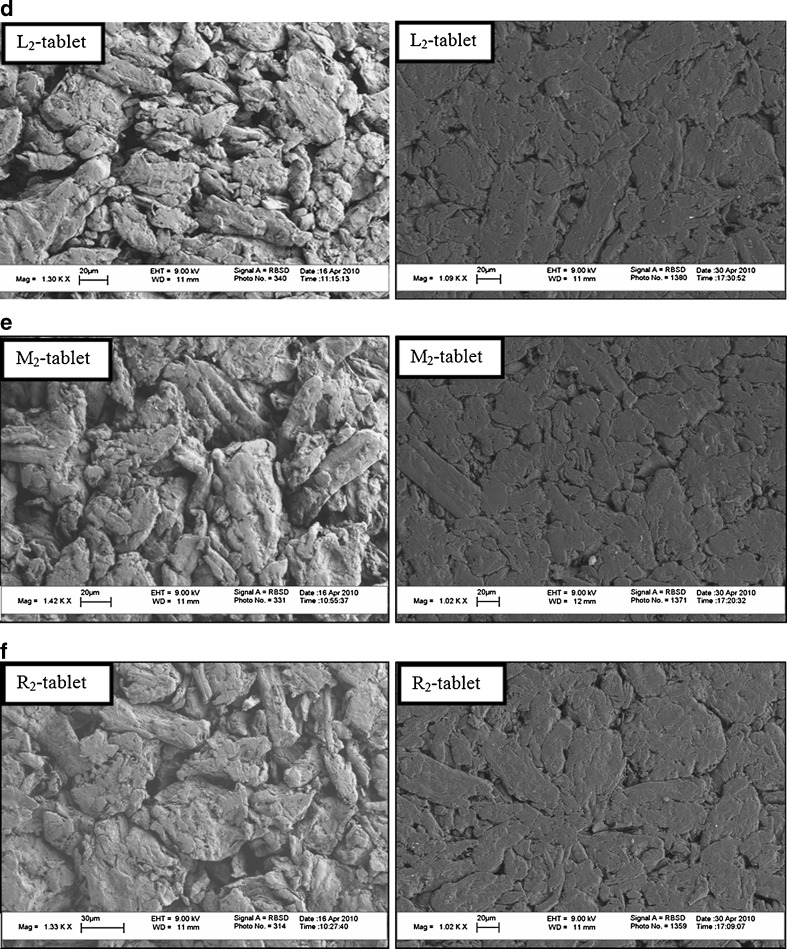
SEM images of the upper surfaces of tablets at a solid fraction of 0.60 (left-hand side) and 0.85 (right-hand side) for case 1 (a–c), for case-2 (d–e) and for case 3 (g–i)
RESULT AND DISCUSSION
Heterogeneous Density Distribution in Roller-Compacted Ribbon
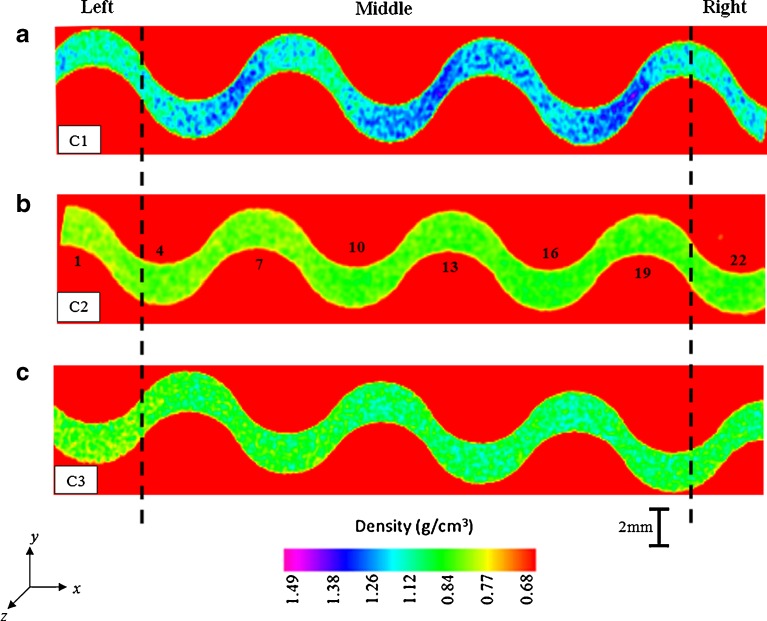
Nondestructive ultrasonic and X-ray micro-computed tomography techniques to determine the local density variations in the roller-compacted ribbons were utilized. From the acoustic waveforms, for all cases (C1, C2, C3), measurable differences were detected among the one-way arrival times Δtp of the pressure waves in the left, middle, and right of the ribbon, as depicted in Fig. 7. Corresponding TOF and longitudinal phase velocity, cp, values are tabulated in Table II. The acoustic pulse (in the ultrasonic spectrum) generated by the piezoelectric transducer is a vibration of kinetic energy which passes from particle to particle. Stronger interparticulate bonding thus enhances the pressure wave transmission. In other words, the tighter and denser the interparticulate bonds are, the faster sound travels in the medium. In case 1 (Fig. 7a–c), among the left, middle, and right of the ribbon, the longitudinal phase velocity, cp, values acquired for the middle section along the x- and z-directions (i.e., ribbon width and length) were substantially different from those determined for the left and right edges (cp-C1_middle > cp-C1_right > cp-C1_left). The average longitudinal phase velocity, cp, values determined for the left, middle, and right sections produced in C1 were 769.2 ± 18, 1111.5 ± 17, and 833.3 ± 12 m/s, respectively. This indicates that the powder in the middle was compressed more than that close to the edges, which leads to a relatively high-density zone at the middle and low-density region at the edges of the ribbon. This is attributable to the presence of friction at the feed zone between the powder and the side walls (Fig. 1). The side wall friction inhibits the powder at the edges moving downwards as the powder is being gripped into the nip region; consequently, the powder at the edges is less compressed, while the powder at the middle is highly compressed. Similar observations were also reported by other researchers (11,13). This is further confirmed by the X-ray μCT images (Fig. 10). Close examination of the 2D reconstructed X-ray μCT image for C1 ribbon reveals that there is an intensive high-density region in the middle of the ribbon width and length and relatively lower density regions at the left and right edges (Fig. 10). In contrast, as depicted in Fig. 7d–f, g–i, the intragroup TOF of the ultrasonic pulse acquired along the width and length (x- and z-directions) of the ribbon that was produced in C2 and C3 are comparable (see Table II for longitudinal phase velocity, cp, values). For the C2 ribbons, it is clear that the longitudinal phase velocity, cp, values drastically decreased by incorporating 0.5% MgSt into the roller-compacted powder. However, lubricating the roll press and feed screw (C3) increased the longitudinal phase velocity, cp, values. The longitudinal phase velocity, cp, values determined for the left, middle, and right of the ribbon in C2 and C3 are 454.1 ± 11, 473.4 ± 14, 467.8 ± 4 m/s and 533.7 ± 18, 601.2 ± 41, 547.4 ± 10 m/s, respectively. These results suggest that compared with the unlubricated powder (C1), lubricated powder (C2), and unlubricated powder with lubricated rolls, side sealing at the compaction zone and feed screws (C3) were compressed into more homogeneous ribbons by minimizing the effect of the particle–particle and particle–side wall friction. Consequently, the powder can be fed into the compaction zone more uniformly in these two cases. However, in C2, from the corresponding time-of-flight data (Fig. 7d–f) and reconstructed X-ray μCT image (Fig. 10), it is clear that the lubricated powder was not roller-compacted dense enough and the longitudinal phase velocity, cp, values along the width and length are considerably less than those for C1 and C3 ribbons (Table II). This is attributed to the mixing of MCC with MgSt, which contributes to the reduction of the interparticulate bonds (contacts), friction between the powder and the side walls, the increase in the flowability of the MCC powder, and the drastic decrease in the compaction pressure, which, in turn, leads to less compaction of the powder at the nip region (Fig. 1). For C3 ribbons, lubricating the roll press and feed screws minimizes the effect of friction between the powder and tooling; however, still interparticulate friction exists which adversely affects the flowability of the powder and prevents any further interparticulate movement at the nip region (Fig. 1). Therefore, the unlubricated powder (C3-lubricated tooling) at the compaction zone was subjected to more homogeneous compression along the width of the ribbon when compared with the non-uniformly roller-compacted C1 ribbons (see Fig. 10a, c).This can also be quantified from the acoustic waveforms; for example, the average arrival time of the pulse Δtp in the middle section is 1.79 μs (Fig. 7b), which is 1.4 times less than those obtained for the left and right sections (Fig. 7a–c and Table II). However, for C3 ribbons, the ratio between the average arrival times of the acoustic pulse in the middle section and edges drops to 1.1 (Fig. 7g–i and Table II), suggesting that the density distribution in the ribbon is more uniform. The intragroup longitudinal phase velocity, cp, variations along the z-direction (i.e., along the length) of the examined ribbons for each case are not significant (mean relative standard deviation of the cp for the left, middle, and right sections are 2.3%, 1.6%, and 1.4% for C1, 2.5%, 3.1%, and 0.9% for C2 and 3.4%, 6.9%, and 1.8% for C3, respectively; Fig. 7). This can also be seen by comparing the arrival times of the acoustic pulses shown as dashed, solid, and dotted waveforms in Fig. 7. In other words, along the z-direction, the density distribution is rather uniform (homogeneous). This indicates that the roller compaction process in the current study operates at steady state. This is further confirmed by the 2D reconstructed X-ray μCT cross-section images (not reported in this study). In these cross-sections, it was observed that density varies along the ribbon width, however remains relatively uniform along the ribbon length.
Fig. 10.
X-ray micro-computed tomography cross-section images obtained after 2D reconstruction showing the density distributions across the width of the ribbon for case 1 (a), case 2 (b), and case 3 (c) corresponding to a cut of 14.8-μm thickness at the exact ultrasonically scanned points (1, 4, 7, 10, 13, 16, 19, 22)
Density variations and the solid fraction of the left, middle, and right of the ribbon were also determined by envelope density measurements, as tabulated in Table I. From the envelope density measurements for C1, it seems reasonable that the less compacted powders at the left and right edges of the ribbon at SFs of 0.53 and 0.57 contain relatively more microscopic voids or flaws than the highly compacted ribbon at the middle section at a SF of 0.70. This degree of densification at the edges hence weakens the ribbon and consequently decreases the overall stiffness of the ribbon, which can adversely alter the size distribution and increase the amount of finer granules and material properties of the milled granules that are obtained from these regions. On the contrary, for C2 ribbons, the SF values were between 0.45 and 0.48, and for C3 ribbons, the values were between 0.63 and 0.66. These values confirm that due to the improved powder flowability in C2 and the decreased effect of friction between powder and tooling in C3, the powders were compressed into more homogeneous ribbons, which leads to uniform density distributions along the width and length of the ribbons.
Compression Behavior Analysis
Heckel Analysis and Tablet Mechanical Properties
The ability of a material to undergo plastic deformation is often defined by the mean yield pressure Py, which is inversely proportional to the Heckel constant (K). In order to determine the compression characteristics of powders and the roller-compacted granules, the compression data were fitted according to the Heckel equation. To estimate the mean yield pressure (Py) values of the materials, out-of-die analysis was performed. For the tablet, Young’s modulus characterization nondestructive ultrasonic technique (28,29) was employed. This technique was based on the extraction of Young’s modulus values of the compacts in the axial direction (i.e., parallel to the compaction direction).
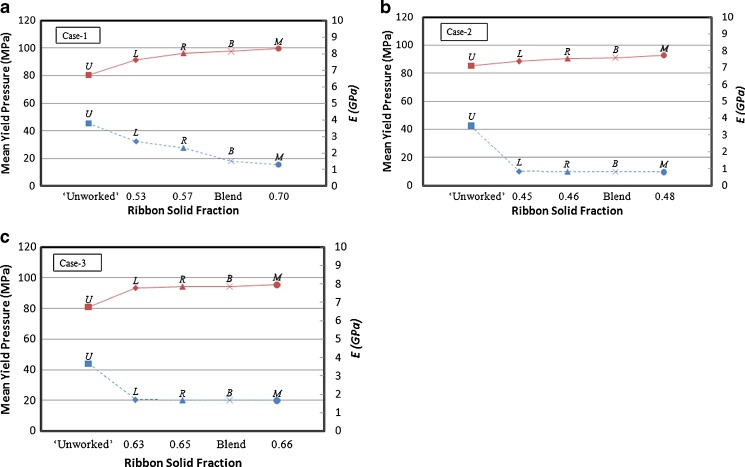
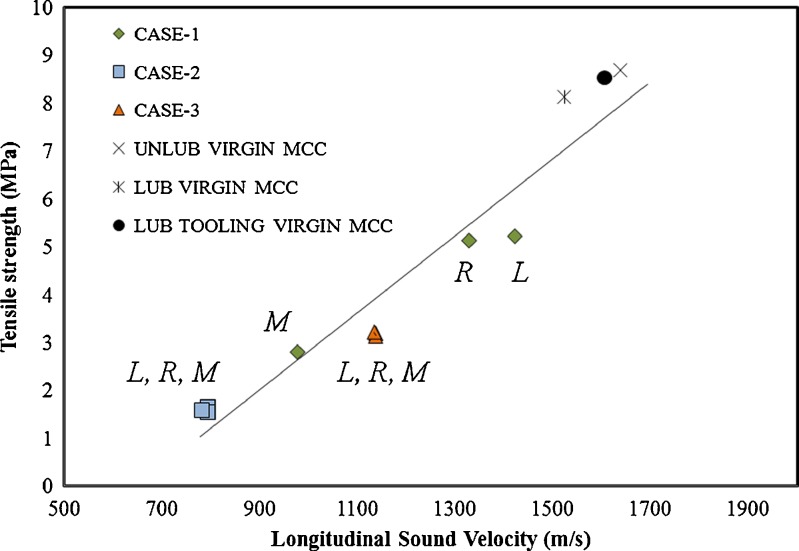
The ultrasonic waveforms of the Li tablet, Mi tablet, and Ri tablet compacts are depicted in Fig. 8. For comparison purposes, for 15 min at 15 rpm (Twin Shell V-Blender, Patterson-Kelley), milled granules in all cases were blended. Based on the mean average of 30 tablets, the TOF and longitudinal phase velocities, cp, are listed in Table II. As shown in Fig. 11, for all cases, Py values increase with an increase in the ribbon section SF or with a decrease in section porosity and with a decrease in the Young’s modulus and tensile strength of the tablet (see Fig. 12 and Table III). As can be seen in Fig. 12, for the tested tablets, there is a good correlation between the tensile strength and longitudinal sound velocity, cp, values with a coefficient of determination (R2) value of 0.9256. In Fig. 9, the SEM images of the upper surfaces of tablets with a SF of 0.60 and 0.85 were shown. In this figure, the capabilities of the granules obtained from the left, middle, and right sections of C1, C2, and C3 ribbons to deform plastically under uniaxial compression were illustrated. In C1, the tablets prepared with granules made from the left and right sections of the ribbon whose SF values are 0.53 and 0.57 exhibit the lowest Py values, while tablets formed from the middle of the ribbon with a SF of 0.70 have the highest Py values, an indicator of work hardening (Fig. 11a). For M1 tablets, it is clear that the original shape of the granules obtained from the middle section of the ribbon can be recognized, whereas for the L1 and R1 tablets, the initial boundaries of the left and right section granules are no longer existent due to plastic deformation (Fig. 9a–c). These results indicate that the granules obtained from the left and right sections in C1 exhibited the fastest onset of plastic deformation during tableting where granules milled from the middle section have the slowest plastic deformation rate. This is also shown with the ultrasonic waveforms. In Fig. 8a, for C1 tablets, it is clear from the ultrasonic waveforms that the longitudinal phase velocities, cP, in the M1 tablets prepared from the middle of the ribbon (i.e., harder section or section with a solid fraction of 0.70) exhibited relatively low values (i.e., higher time of flight of the pressure acoustic wave, Δtp) when compared with those in the L1 and R1 tablets (Table II). These substantial longitudinal phase velocity, cp, value variations resulted in 82.8–108.6% decrease in the Young’s modulus values for the M1 tablets (Table III). Tensile strength values of the M1 tablets were also drastically dropped 83.5–86.7% compared with those of L1 and R1 tablets (Table III). L1 and R1 tablets prepared with the granules obtained from the ribbon edges (i.e., weaker sections of the ribbon or sections with solid fractions of 0.53 and 0.57, respectively) exhibited a relatively high Young’s modulus and tensile strength values (i.e., faster cp), as tabulated in Table III. Since these granules exhibited higher plastic deformation, the direction of propagation of the acoustic waves in these tablets was not interfered by the intergranular boundaries while it was scattered in the M1 tablets. When a propagating ultrasonic pulse (mechanical wave) impinges the interface between discrete granules, a portion of the propagating pulse energy is reflected back and the remaining energy is transmitted across the medium. Therefore, the arrival times Δtp of the ultrasonic pulse for M1 tablets are relatively low (Table II).
Fig. 11.
Comparison of the yield pressure (solid line) and Young’s modulus (dashed line) of compacted tablets formed with left (L), middle (M), and right (R) sections of case 1 (a), case 2 (b), and case 3 (c) as a function of ribbon solid fraction with tablets made of unworked powder (U) and blend (B)
Fig. 12.
Longitudinal sound velocity as a function of tensile strength of tablets (n = 30) from particles milled from the left (L), right (R), and middle (M) portion of case 1, 2, and 3 ribbons together with tablets from virgin MCC with different conditions of lubrication. Coefficient of determination (R 2) is 0.9256
Table III.
Summary of the Elastic Properties, Tensile Strength, and Mean Yield Pressures of Tablets
| Case no. | Section | Section solid fraction | Tablet, n = 30 | ||
|---|---|---|---|---|---|
| Young’s modulus, E (GPa) | Tensile strength, σ (MPa) | Mean yield pressure, P y (MPa) | |||
| Case 1 | Left | 0.53 | 2.67 (0.21) | 5.21 (0.20) | 91 (2.2) |
| Middle | 0.70 | 1.28 (0.09) | 2.79 (0.15) | 99 (2.8) | |
| Right | 0.57 | 2.34 (0.16) | 5.12 (0.21) | 96 (1.3) | |
| Case 2 | Left | 0.45 | 0.84 (0.04) | 1.65 (0.09) | 88 (3.8) |
| Middle | 0.48 | 0.82 (0.08) | 1.55 (0.04) | 92 (3.4) | |
| Right | 0.46 | 0.80 (0.07) | 1.59 (0.08) | 90 (3.1) | |
| Case 3 | Left | 0.63 | 1.71 (0.17) | 3.18 (0.12) | 93 (4.3) |
| Middle | 0.66 | 1.69 (0.08) | 3.12 (0.07) | 95 (4.1) | |
| Right | 0.65 | 1.66 (0.15) | 3.21 (0.08) | 94 (3.3) | |
| Unlubricated | n/a | 3.78 (0.13) | 8.69 (0.12) | 80 (3.6) | |
| Virgin MCC powder | |||||
| Lubricated | n/a | 3.54 (0.11) | 8.12 (0.15) | 85 (2.1) | |
| Virgin MCC powder | |||||
| Virgin MCC powder (lubricated tooling) | n/a | 3.66 (0.14) | 8.53 (0.09) | 80 (2.4) | |
| Case 1 (blend) | n/a | 1.52 (0.13) | 3.11 (0.11) | 97 (1.9) | |
| Case 2 (blend) | n/a | 0.81 (0.07) | 1.61 (0.08) | 91 (2.4) | |
| Case 3 (blend) | n/a | 1.69 (0.09) | 3.24 (0.15) | 94 (2.7) | |
Standard deviations in estimate of gigapascals (for E) and megapascal (for σ and P y) are included in parenthesis. Tablet solid fraction of 0.85
In C2, for tablets formed from ribbons with low SF, less bonding was obtained and granules kept their individuality with relatively less plastic deformation when compared with C1 (except for the middle section) and C3 granules (Fig. 9d–f). This is attributed to the presence of a MgSt film upon the surface of the MCC granules which significantly affects the intergranular bonding strength and consequently leads to a weaker tablet (Fig. 11b). The modest increase in mean yield pressure, Py, also indicates the influence of work hardening on the C2 granules. As shown in Table III, the mechanical properties of C2 tablets were comparable to each other. However, incorporating 0.5% lubricant has a drastic effect on the mechanical properties of tablets. The Young’s modulus and tensile strength values dropped substantially when compared with tablets prepared from virgin MCC powder, C1 and C3 granules. For C2 tablets, the longitudinal phase velocity, cp, values acquired were comparable to each other as 793.71 ± 18.62 m/s for L2 tablet, 794.42 ± 12.37 m/s for M2 tablet, and 782.04 ± 20.01 m/s for R2 tablet (Table II). However, these values are substantially lower than the longitudinal phase velocity values acquired from C1 and C3 tablets. This is also attributed to the scattering of the sound waves in the C2 tablets. For C3, all granules readily fused together, tightly packed, and exhibited plastic deformation (Fig. 9g–i).Though C3 granules showed plastic deformation, the sharp decrease in Young’s modulus and tensile strength values and a modest increase in Py is an indicator of work hardening.
Elastic Recovery
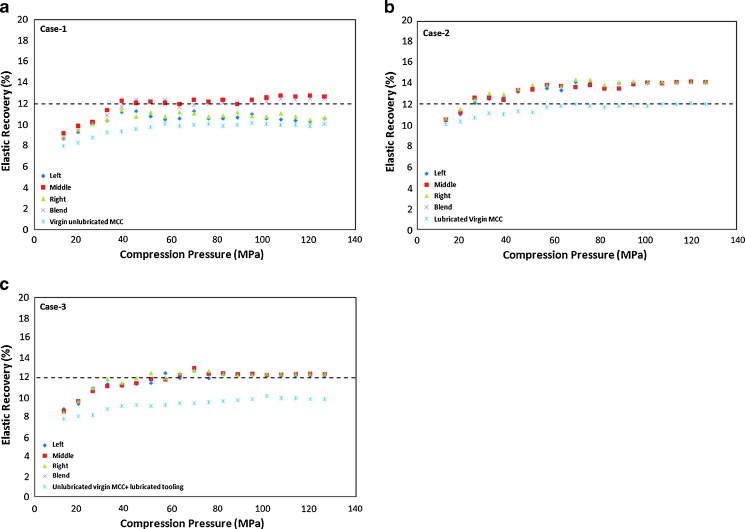
The elastic recovery (ER) is useful as a measure of the disruptive effects of elastic deformation; in other words, it provides insight into the elastic deformation undergone by the powder bed during compression. Elastic recovery occurs during the decompression phase and results in the rupture of interparticulate bonds formed during compression (39). Excessive elastic recovery after compression could strongly reduce the intergranular bonding, which could cause a drastic decrease in tablet mechanical strength (40). In Fig. 13, for C1 tablets, it is shown that the differences between the ER values of L1, M1, and R1 tablets become more pronounced above a compression of 40 MPa, suggesting the high tendency of M1 tablets to recover elastically. This large elastic recovery of M1 tablets contributes to weaker intergranular bonding and low Young’s modulus and tensile strength values, as tabulated in Table III. Relatively high values of the mean yield pressure of granules obtained from the middle section also support the increase in the ER values for M1 tablets since the higher the mean yield pressure the more difficult is the onset of plastic deformation during compression. In addition, at higher compression pressures, the still slight increase and decrease of the ER values of C1 tablets indicates that the reorganization of the material was not totally completed. In contrast, ER values of C2 and C3 tablets were relatively stable above a compression pressure of 65 MPa. Close examination of the ER values reveals that C2 tablets axially expand to a larger extent than C1 and C3 tablets. This could be attributed to the incorporation of MgSt into the MCC powder which forms a film of MgSt on the surface of the granule. Due to the presence of this film, the intergranular bonding may significantly reduce, and this can result in the accumulation of the stored elastic strain within the granules that will be released upon the removal of the rigid constraints (i.e., upper punch and die wall). This mechanism can act like a loaded spring and hence cause an elastic spring-back as the compaction force is relaxed during decompression and ejection phases which will weaken the intergranular bonding and tablet mechanical strength and consequently will lead to capping and delamination of tablets.
Fig. 13.
Elastic recovery profiles for case 1 (a), case 2 (b), and case 3 (c) tablets prepared from the left, middle, and right of the ribbons
CONCLUSIONS AND REMARKS
The local density variations in the ribbons and process conditions (i.e., internal and external lubrication) during roller compaction of microcrystalline cellulose and the impact of these variations on the mechanical properties of tablets were quantitatively characterized using nondestructive ultrasonic and X-ray micro-computed tomography techniques. Three different roller compaction conditions, namely, no lubrication (case 1); lubricated powder (case 2); and lubricated feed hopper, side sealing plates, feed screws, and rolls (case 3) were considered and evaluated. Out-of-die Heckel analysis and elastic recovery of the produced tablets from the milled granules were also studied. From the reported study, the following conclusion can be made:
From the acoustic waveforms (in the ultrasonic spectrum) and X-ray analysis, for case 1, differences in the ribbon density along the width were detected while a weak dependency was observed along the length.
Using both techniques, non-uniform density distribution in the ribbons appears to be clearly discernible with different degrees of resolution: (1) For the unlubricated case, the analysis revealed that the middle of the ribbon has a relatively higher density than the edges of the ribbon due to the friction between the powder and the tooling. (2) For cases 2 and 3, a more homogeneous ribbon density profile was obtained along the width and length of the specimen by the use of internal and external lubricants, respectively.
It has been shown that the mean tablet yield pressure (out-of-die Heckel analysis) increases with the ribbon section solid fraction.
Case 2 tablets axially expand to a larger extent than those of case 1 and case 3 tablets, as revealed by elastic recovery observations. This could be due to the presence of poorly bonding MgSt powder on the surface of the plastically deforming MCC powder which could significantly reduce the bonding strength, which is consistent with SEM studies of tablet surfaces. The hollow microfibrillar structure of MCC powder may also be responsible for the high fraction of elastic recovery (41).
Using the same nondestructively tested tablets, we demonstrated that there is a linear correlation between the speed of sound in the tablet and tensile strength. For the tablets tested, it was found that the speed of sound increases with the tensile strength. In view of that, the developed nondestructive ultrasonic technique can be used to determine the tensile strength of tablets.
Finally, we note that the short acoustic signal duration in the ultrasonic method, which is <10 μs, makes it an attractive nondestructive laboratory tool for spatially resolving non-uniform density characterization of compacted ribbons and for measuring the average Young’s modulus values of pharmaceutical compacts. It is noteworthy that since the described nondestructive ultrasonic approach provides insight into the mechanical performance of the ribbons and tablets and fosters increased process knowledge, it can be applied to identify quality problems early on the formulation process and will lead to a significant reduction of associated cost and material waste, thus supporting the material-sparing approach.
Contributor Information
Ilgaz Akseli, Phone: +1-203-7916703, Email: Ilgaz.Akseli@boehringer-ingelheim.com.
Alberto M. Cuitiño, Phone: +1-732-4454210, Email: cuitino@jove.rutgers.edu
References
- 1.Miller RW. Roller compaction technology. In: Parikh DM, editor. Handbook of pharmaceutical granulation technology. New York: Marcel Dekker; 1997. pp. 100–149. [Google Scholar]
- 2.Adeyeye MC. Roller compaction and milling pharmaceutical unit processes: part I. Am Pharm Rev. 2000;3:37–42. [Google Scholar]
- 3.Sheskey PJ, Hendren J. The effects of roll compaction equipment variables granulation technique and HPMC polymer level on a controlled-release matrix model drug formulation. Pharm Technol. 1999;23:90–106. [Google Scholar]
- 4.Simon O, Guigon P. Correlation between powder-packing properties and roll press compact heterogeneity. Powder technol. 2003;130:257–264. doi: 10.1016/S0032-5910(02)00202-4. [DOI] [Google Scholar]
- 5.Kleinebudde P. Roll compaction/dry granulation: pharmaceutical applications. Eur J Pharm Biopharm. 2004;58:317–326. doi: 10.1016/j.ejpb.2004.04.014. [DOI] [PubMed] [Google Scholar]
- 6.Zinchuk AV, Mullarney MP, Hancock BC. Simulation of roller compaction using a laboratory scale compaction simulator. Int J Pharm. 2004;269:403–415. doi: 10.1016/j.ijpharm.2003.09.034. [DOI] [PubMed] [Google Scholar]
- 7.Weyenberg W, Vermeire A, Vandervoort J, Remon JP, Ludwig A. Effects of roller compaction settings on the preparation of bioadhesive granules on ocular minitablets. Eur J Pharm Biopharm. 2005;59:527–536. doi: 10.1016/j.ejpb.2004.09.012. [DOI] [PubMed] [Google Scholar]
- 8.Bindhumadhavan G, Seville JPK, Adams MJ, Greenwood RW, Fitzpatrick S. Roll compaction of a pharmaceutical excipient: experimental validation of rolling theory for granular solids. Chem Eng Sci. 2005;60:3891–3897. doi: 10.1016/j.ces.2005.02.022. [DOI] [Google Scholar]
- 9.Xiaorong H, Pamela JS, Gregory EA. Mechanistic study of the effect of roller compaction and lubricant on tablet mechanical strength. J Pharm Sci. 2007;96:1342–1355. doi: 10.1002/jps.20938. [DOI] [PubMed] [Google Scholar]
- 10.Farber L, Hapgood KP, Michaels JN, Fu XY, Meyer R, Johnson MA, Li F. Unified compaction curve model for tensile strength of tablets made by roller compaction and direct compression. Int J Pharm. 2008;346:17–24. doi: 10.1016/j.ijpharm.2007.06.022. [DOI] [PubMed] [Google Scholar]
- 11.Miguélez-Morán AM, Wu CY, Dong H, Seville JPK. Characterisation of density distributions in roller-compacted ribbons using micro-indentation and X-ray micro-computed tomography. Eur J Pharm Biopharm. 2009;72:173–182. doi: 10.1016/j.ejpb.2008.12.005. [DOI] [PubMed] [Google Scholar]
- 12.Mitchell SA, Reynolds TD, Dasbach TP. A compaction process to enhance dissolution of poorlywatersoluble drugs using hydroxypropyl methylcellulose. Int J Pharm. 2003;250:3–11. doi: 10.1016/S0378-5173(02)00293-4. [DOI] [PubMed] [Google Scholar]
- 13.Funakoshi Y, Asogawa T, Satake E. Use of a novel roller compactor with a concavo-convex roller pair to obtain uniform compacting pressure. Drug Dev Ind Pharm. 1977;6:555–573. doi: 10.3109/03639047709055633. [DOI] [Google Scholar]
- 14.Malkowska S, Khan KA. Effect of recompression on the properties of tablets prepared by dry granulation. Drug Dev Ind Pharm. 1983;9:331–347. doi: 10.3109/03639048309044678. [DOI] [Google Scholar]
- 15.Roberts RJ, Rowe RC. Relationships between the modulus of elasticity and tensile strength for pharmaceutical drugs and excipients. J Pharm Pharmacol. 1999;51:975–977. doi: 10.1211/0022357991773438. [DOI] [PubMed] [Google Scholar]
- 16.Podczeck F, Drake KR, Newton JM, Haririan I. The strength of bilayered tablet. Eur J Pharm Sci. 2006;29:361–366. doi: 10.1016/j.ejps.2006.07.005. [DOI] [PubMed] [Google Scholar]
- 17.Akseli I, Mani G, Cetinkaya C. Non-destructive acoustic defect detection in drug tablets. Int J Pharm. 2008;360:65–76. doi: 10.1016/j.ijpharm.2008.04.019. [DOI] [PubMed] [Google Scholar]
- 18.Hein S, Picker-Freyer KM. Simulation of roller compaction with subsequent tableting and characterization of lactose and microcrystalline cellulose. Pharm Dev Technol. 2008;13:523–532. doi: 10.1080/10837450802288972. [DOI] [PubMed] [Google Scholar]
- 19.Sheskey PJ, Cabelka TD, Robb RT, Boyce BM. Use of roller compaction in the preparation of controlled-release hydrophilic matrix tablets containing methylcellulose and hydroxypropyl methylcellulose polymers. Pharm Technol. 1994;9:133–150. [Google Scholar]
- 20.Sun CC, Himmelspach MW. Reduced tabletability of roller compacted granules as a result of granule size enlargement. J Pharm Sci. 2006;95:200–206. doi: 10.1002/jps.20531. [DOI] [PubMed] [Google Scholar]
- 21.Alderborn G, Nystrom C. Studies on direct compression of tablets. III. The effect on tablet strength of changes in particle shape and texture obtained by milling. Acta Pharm Suec. 1982;19:147–156. [PubMed] [Google Scholar]
- 22.Luangtana-Anan M, Fell JT. Bonding mechanisms in tabletting. Int J Pharm. 1990;60:197–202. doi: 10.1016/0378-5173(90)90073-D. [DOI] [Google Scholar]
- 23.Kadiri MS, Michrafy A, Dodds JA. Pharmaceutical powders compaction: experimental and numerical analysis of the density distribution. Powder Technol. 2005;157:176–182. doi: 10.1016/j.powtec.2005.05.025. [DOI] [Google Scholar]
- 24.Hancock BC, Clas SD, Christensen K. Micro-scale measurement of the mechanical properties of compressed pharmaceutical powders. 1: The elasticity and fracture behaviour of microcrystalline cellulose. Int J Pharm. 2000;209:27–35. doi: 10.1016/S0378-5173(00)00541-X. [DOI] [PubMed] [Google Scholar]
- 25.Eichhorn SJ, Young RJ. The Young’s modulus of microcrystalline cellulose. Cellulose. 2001;8:197–207. doi: 10.1023/A:1013181804540. [DOI] [Google Scholar]
- 26.Akseli I, Libordi C, Cetinkaya C. Real-time acoustic elastic property monitoring of compacts during compaction. J Pharm Innov. 2008;3:134–140. doi: 10.1007/s12247-008-9029-z. [DOI] [Google Scholar]
- 27.Akseli I, Becker DC, Cetinkaya C. Ultrasonic determination of Young’s Moduli’s of the coat and core of a drug tablet. Int J Pharm. 2009;370:17–25. doi: 10.1016/j.ijpharm.2008.11.003. [DOI] [PubMed] [Google Scholar]
- 28.Akseli I, Hancock BC, Cetinkaya C. Anisotropic mechanical property testing for the development of pharmaceutical dosage forms. Int J Pharm. 2009;377:35–44. doi: 10.1016/j.ijpharm.2009.04.040. [DOI] [PubMed] [Google Scholar]
- 29.Akseli I, Dey D, Cetinkaya C. Mechanical property characterization of bilayered tablets using nondestructive air-coupled acoustics. AAPS PharmSciTech. 2010;11:90–102. doi: 10.1208/s12249-009-9352-9. [DOI] [PMC free article] [PubMed] [Google Scholar]
- 30.Busignies V, Leclerc B, Porion P, Evesque P, Couarraze G, Tchoreloff P. Quantitative measurements of localized density variations in cylindrical tablets using X-ray microtomography. Eur J Pharm Biopharm. 2006;64:38–50. doi: 10.1016/j.ejpb.2006.02.007. [DOI] [PubMed] [Google Scholar]
- 31.Sinka IC, Burch SF, Tweed JH, Cunningham JC. Measurement of density variations in tablets using X-ray computed tomography. Int J Pharm. 2004;271:215–224. doi: 10.1016/j.ijpharm.2003.11.022. [DOI] [PubMed] [Google Scholar]
- 32.Hancock BC, Mullarney MP. X-ray microtomography of solid dosage forms. Pharmaceut Tech. 2005;2:92–100. [Google Scholar]
- 33.Kak AC. Computerized tomography with X-ray, emission and ultrasound sources. Proc IEEE. 1979;67:1245–1272. doi: 10.1109/PROC.1979.11440. [DOI] [Google Scholar]
- 34.Hancock BC, Colvin JT, Mullarney PM, Zinchuk AV. The relative densities of pharmaceutical powders, blends, dry granulations, and immediate-release tablets. Pharm Technol. 2003;27:64–80. [Google Scholar]
- 35.Heckel RW. Density–pressure relationships in powder compaction. Trans Metall Soc AIME. 1961;221:671–675. [Google Scholar]
- 36.Denny PJ. Compaction equations: a comparison of the Heckel and Kawakita equations. Powder Technol. 2002;127:162–172. doi: 10.1016/S0032-5910(02)00111-0. [DOI] [Google Scholar]
- 37.Hersey, J.A. and Rees, J.E., 1970. The effect of particle size on the consolidation of powders during compaction. Particle Size Analysis Conference, 2nd edn. University of Bradford: Bradford, UK
- 38.Fell JT, Newton JM. Determination of tablet strength by the diametral-compression test. J Pharm Sci. 1970;59:688–691. doi: 10.1002/jps.2600590523. [DOI] [PubMed] [Google Scholar]
- 39.Krycer I, Pope DV, Hersey JA. An evaluation of the techniques employed to investigate powder compaction behavior. Int J Pharm. 1982;12:113–134. doi: 10.1016/0378-5173(82)90112-0. [DOI] [Google Scholar]
- 40.Johansson B, Alderborn G. Degree of pellet deformation during compaction and its relationship to the tensile strength of tablets formed of microcrystalline cellulose pellets. Int J Pharm. 1996;132:207–220. doi: 10.1016/0378-5173(95)04373-X. [DOI] [Google Scholar]
- 41.Aulton ME, Tebby HG, White PJ. Indentation hardness testing of tablets. J Pharm Pharmacol. 1974;26(Suppl):59P–60P. doi: 10.1111/j.2042-7158.1974.tb10081.x. [DOI] [PubMed] [Google Scholar]


