Abstract
The purpose of this article is to review non-impactor-based methods for measuring particle size distributions of orally inhaled and nasal pharmaceutical aerosols. The assessment of the size distributions of sprays and aerosols from orally inhaled and nasal drug products by methods not involving multi-stage cascade impaction may offer significant potential advantages in terms of labor savings and reducing the risk for operator-related errors associated with complex-to-undertake impactor-based methods. Indeed, in the case of nasal spray products, cascade impaction is inappropriate and alternative, and preferably non-invasive methods must be sought that minimize size-related bias associated with the measurement process for these relatively large droplets. This review highlights the options that are available to those involved with product quality assessments, providing guidance on relative strengths and weaknesses, as well as highlighting precautions that should be observed to minimize bias. The advent of Raman chemical imaging, which enables an estimate to be made of the proportion of each particle comprising active pharmaceutical ingredient(s) (APIs), necessitates a re-think about the value of classical microscopy image analysis as now being capable of providing API-relevant information from collected aerosols and sprays.
Key words: aerosol, efficient data analysis, measurement techniques, size distribution, spray
INTRODUCTION
The in vitro assessment of orally inhaled and nasal drug products (OINDPs) has been traditionally undertaken by multi-stage cascade impactors (CIs) or multi-stage liquid impingers (in Europe) because these types of equipment provide aerodynamic particle size directly, together with the capability for recovery and assay for active pharmaceutical ingredients (APIs) in a traceable manner (1). In the context of this article, oral inhaled products (OIPs), such as pressurized metered dose inhalers (pMDIs), dry powder inhalers (DPIs), and nebulizing systems, produce inhalable aerosols typically comprising micron-sized particles that are capable of being transported via the oropharynx to the airways of the lungs for subsequent deposition and therapeutic action. In contrast, nasal products (NPs), in general, release a spray containing droplets in the 10- to >200-μm-size range that is intended for topical delivery to the sites of action in the nasal cavity.
It is widely recognized that effective use of CIs is demanding on those making the measurements (2), increasing the risk of mistakes as well as slowing the process of product development, even when precautions are taken to identify and minimize causes of variability (3). Furthermore, such measurement method-related complexity does not lend itself to applications related to quality-by-design (QbD). QbD is a concept developed in 2005 under the auspices of the International Conference on Harmonisation of Technical Requirements for Registration of Pharmaceuticals for Human Use under Quality Guideline Q8: ‘Pharmaceutical Development’ and later promulgated by the US Food and Drug Administration (4). In a QbD environment, multiple measurements may be needed at a variety of conditions in order to define the response surface within which the product is expected to meet specification.
An additional and important limitation of the cascade impactor method is its unsuitability for making size-resolved measurements with liquid droplet emitting nasal sprays that are typically in the range from 20 to 200 μm volume equivalent diameter (5). Cascade impactor systems typically have a maximum size limit that is close to 20 μm aerodynamic diameter because gravitational sedimentation dominates particle motion at larger sizes (6). In practice, therefore, the technique is limited to size-characterizing the proportion of the dose that is finer than about 10 μm aerodynamic diameter that are deemed to be at risk of penetrating beyond the nasopharyngeal region into the airways of the lungs (7). Given these circumstances, there is currently an interest in exploring the potential for non-cascade impactor-based methods for determining aerosol size distribution data that are sufficiently sensitive to be useful in guiding the process of formulation development and the interface with the intended delivery vehicle (pMDI, DPI, or liquid droplet delivery system) (8). This review aims to summarize the current state-of-the-art concerning alternatives to cascade impactors. Much of the detailed information has already been published in peer-reviewed journals, so the intention of this article is to provide a more general overview of the options that are available, highlighting the strengths and weaknesses of each technique, with the purpose of guiding the reader toward the process of implementing such techniques.
PARTICLE SIZE DISTRIBUTION TECHNIQUE ASSESSMENTS
Overview and Relative Cost
The basic techniques that are currently available to assess particle or droplet size distribution data in the range between about 0.5 and 10 μm (aerosols from orally inhaled forms and nasal metered dose inhalers) and 20 to >200 μm diameter (aqueous droplets from nasal spray products) are summarized in Table I. These techniques are subdivided into aerodynamic and non-aerodynamic classes.
Table I.
Classification of Size Analysis Methods for OINDPs
| Aerodynamic methods | Non-aerodynamic methods |
|---|---|
| Multi-stage cascade impactor and liquid impinger | Laser diffractometry |
| Full resolution CIs provide complete APSDs but are slow and labor-intensive | Rapid with high size resolution |
| Abbreviated impactor for simplified APSD metrics based on large and small particles (product QC) or coarse, fine, and extra-fine particles (human respiratory tract-relevant metrics) | Can be made non-invasive (no need to sample the aerosol) |
| No API specificity hence inapplicable to mixtures of APIs or API + excipient(s) | |
| The most useful technique for size analyzing the large droplets from nasal sprays | |
| Time-of-flight methods | Laser (phase) Doppler particle size analysis |
| Provide APSD directly with high size resolution, but weighting is count- rather than mass-based | Similar to LD in terms of resolution and rapidity |
| No API specificity hence may be inapplicable to mixtures of APIs or API + excipient(s) | |
| Rapid compared with cascade impaction | |
| Complex signal rejection criteria can make representative sampling difficult | |
| No API specificity—hence may be inapplicable to mixtures of APIs or API + excipient(s) | |
| Single-particle light scattering (optical particle counting) | |
| Similar to LD in terms of resolution and rapidity | |
| No API specificity hence may be inapplicable to mixtures of APIs or API + excipient(s) | |
| Sampling system is needed | |
| Microscopy-automated image analysis | |
| Requires careful sample capture and preparation | |
| Moderately fast with automated image analysis | |
| Care needed to define particle boundaries | |
| When combined with Raman chemical imaging may provide specificity to API content |
API active pharmaceutical ingredient, CI cascade impactor, LD laser diffractometry, TOF time of flight
In general, the cascade impactor or multi-stage liquid impinger is the lowest cost equipment (US$), typically priced at $5–10 k/unit, which, apart from regulatory preferences, has likely been a significant factor in the almost universal adoption of these methods for OIP characterization. Time-of-flight (TOF)-based methods vary in cost from about $35 k for an Aerodynamic Particle Size Analyzer (APS®) aerosol spectrometer to more than $100 k for an E-SPART system. Likewise, laser diffractometers can cost from about $40 k for a basic system to more than $100 k for the state-of-the-art Spraytec system. Single-particle counters can cost as little as $20 k for a basic near-forward scattering system with 16 size channels covering a decade and a half of size but become more expensive with features such as validation for border-zone error (particles grazing the measurement zone and becoming partially illuminated), as well as enhanced size resolution. Phase-Doppler systems are generally more than $60 k, but the cost depends on the number of detector units, as well as the sophistication of the data processing equipment. Excepting laser diffractometers, all the other non-cascade impactor particle size measurement techniques are research-based instruments rather than validated systems for general use across the spectrum of OINDPs. Apart from the microscopy image analysis combined with Raman chemical imaging (RCI), in which traceability to API mass is potentially feasible, and the size analysis of aerosols and sprays of solution droplets by laser diffractometry, made possible because the API is homogeneously distributed, their place is therefore likely to remain in early phase product development rather than as tools in support of later development and the commercial phase.
The ability to determine aerodynamic particle size is of particular importance for orally inhaled dosage forms because of the possible association between aerodynamic diameter, which includes the effect of both particle shape and density on its motion in a gas flow (9) with the likely location in the respiratory tract where API-containing particles of a given size in the range from about 0.5 to 10 μm aerodynamic diameter may deposit following inhalation (10). Once deposited, the API can become available topically to drug receptors there or be absorbed into the bloodstream for systemic delivery (11). Thus, if the need for aerodynamic size information is the dominant criterion for measurement system selection, the choice of particle size analysis methodology other than cascade impactor is currently limited to TOF-based systems.
However, in many instances, particularly with aerosols from aqueous solutions, aerodynamic and physical size determined by microscopy or from light scattering measurements converge because the droplets are spherical and have unit density (centimeter–gram–second system) (9). Under these circumstances, non-aerodynamic methods, in particular laser diffractometry (LD), offer alternative approaches that can be even more effective than cascade impaction in terms of rapidity per measurement and size-resolving capability (8).
Specificity for API is a further important criterion in the selection of an appropriate measurement system and, combined with the need to determine aerodynamic diameter-related metrics, has historically limited the choice to multi-stage cascade impaction for micron-sized particles emitted from most OIPs (12), with laser diffraction reserved for the larger droplets produced from aqueous nasal spray pumps (13). The larger droplets emitted by NPs as sprays are incapable of being size-classified by inertial size fractionation, the underlying principle of the cascade impactor (1), so that time-averaged LD droplet size distribution analysis, despite its non-specificity for API, has become widely used for this class of inhalers (5,7,8). Recently, however, with the advent of RCI as an adjunct to microscopy-automated image analysis, there is the prospect that microscopy combined with RCI may have application with all OINDP forms (14,15).
Methods Yielding Particle Size Based on Aerodynamic Diameter Scale
TOF Analysis
The operating principle for TOF analysis is the acceleration of individual particles through the measurement zone in a highly defined flow field in which the particles experience ultra-Stokesian motion (16). In essence, the time of flight of the particle between two well-defined locations in the measurement zone is a monotonic function of aerodynamic diameter, longer flight times being associated with larger-sized particles due to enhanced drag in the accelerating flow field. The application of this class of equipment to OINDP performance testing was reviewed by Mitchell and Nagel in 1999 (17). Since that time, the Aerosizer® family of measurement instruments has become obsolete after the manufacturer (Amherst Process Instruments, Amherst, MA, USA) was absorbed into TSI Corp. (St. Paul, MN, USA), the manufacturer of the APS® aerosol spectrometer. The current APS, which is a third-generation instrument, represents the state-of-the-art in terms of minimizing bias caused by particle coincidence in the measurement zone, so-called phantom particle events that were created in earlier instruments and other software-related issues described by Mitchell and Nagel (17).
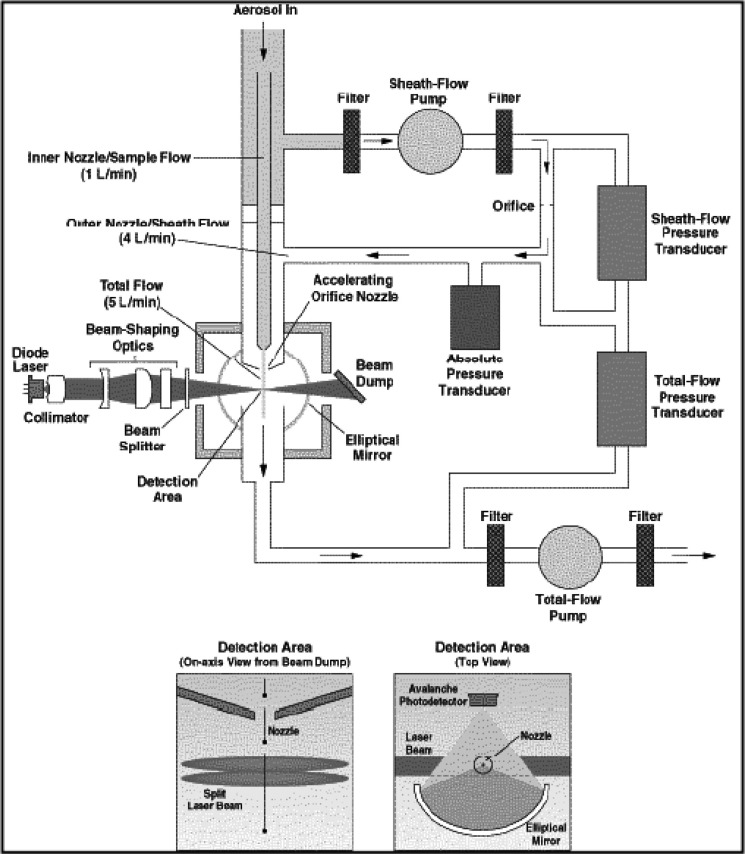
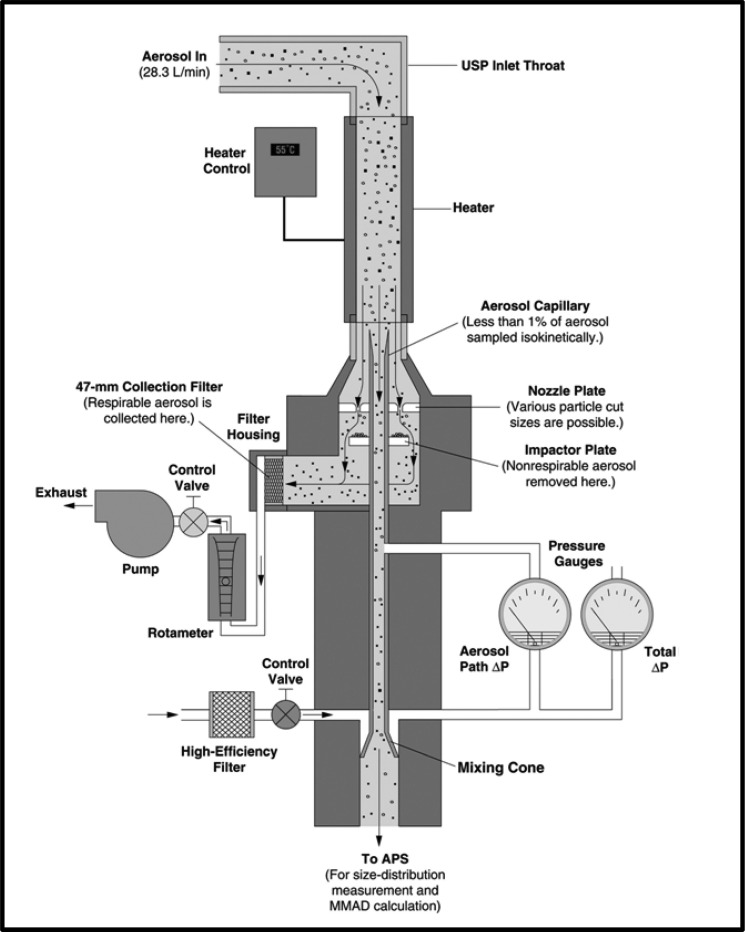
The internal configuration of the APS is illustrated schematically in Fig. 1. Aerosol is introduced into the instrument at a flow rate of 5 L/min, a flow rate that is too low for direct sampling from most OINDPs. The APS derives its flow of clean sheath air by removing 80% of the incoming aerosol stream, filtering it, and returning it to the outer nozzle, which is co-axial to the tapered focusing nozzle that carries the remaining aerosol flow to the measurement zone. The combined sheath and aerosol flows pass through a second tapered nozzle, where particle acceleration takes place. The pressure drop below this nozzle is subcritical (13 kPa) so that sonic velocity is not attained (18). The flow rates of sheath air and total air are controlled by needle valves and monitored with thermal mass flow meters. In the APS-3320 and more recent instruments, flow control is supervised by a dedicated microprocessor. When the incoming aerosol concentration is sufficiently low, particles leaving the distal end of the acceleration nozzle pass individually through the laser beams, causing two pulses to be detected from which the TOF for the particle is determined. Larger particles have greater TOF values, as their inertia has prevented them being accelerated to the velocity of the airstream as they leave the nozzle. The interpretation of the detector signals as aerodynamic diameter requires fast signal processing and a dedicated microcomputer. The overall particle size range of the currently available instrument (model 3321) is from 0.5 to 20 μm aerodynamic diameter, in 52 size channels (32 channels per decade of size). More detail for this particular instrument can be found from the manufacturer at http://www.tsi.com/uploadedFiles/Product_Information/Literature/Spec_Sheets/3321.pdf (visited 21 April 2011), noting that it has undergone significant and progressive evolution since its initial launch as the model 3300 in 1981. The APS has been most frequently applied to determine aerodynamic particle size distribution (APSD) from pMDI products (19–21), and the manufacturer has developed a single-stage impactor (SSI) with USP/Ph.Eur. induction port for this purpose (19,22,23) (Fig. 2). This arrangement is an attempt to overcome the limitation that TOF systems are non-specific for API (Table II) by enabling an abbreviated impactor measurement to be made for fine particle fraction <4.7 μm aerodynamic diameter (other size limits are possible) simultaneously with the full APSD (24–27). It also overcomes the low entry flow rate into the APS, as the complete system operates at 28.3 L/min, similar to that for the Andersen eight-stage cascade impactor when used to sample aerosols emitted by pMDIs (see http://www.tsi.com/uploadedFiles/Product_Information/Literature/Spec_Sheets/3306Phar.pdfvisited, April 21, 2011). In the product development or quality control environments, the handling of pMDI formulations containing ethanol as a low volatile excipient poses the additional problem of ensuring full evaporation before making these comparative measurements, a limitation that was overcome by the use of heated inlet tubing (27). If full evaporation of low volatile species is not ensured, the aerosol may be at different points in the evaporation process; thus, SSI-determined fine particle fraction will likely be systematically higher than equivalent measurements by multi-stage stage cascade impactor, due to the longer time needed to reach the relevant stage having its cut-point closest to that of the SSI (27).
Fig. 1.
TSI APS® TOF-based aerosol spectrometer
Fig. 2.
APS® TOF-based aerosol spectrometer with single-stage impactor inlet
Table II.
Advantages and Limitations of TOF Analyzers
| Advantage | Importance | Disadvantage | Importance |
|---|---|---|---|
| Rapid—many hundred measurements/day possible | High | Lack of API specificitya | High |
| High size resolution (>10 channels/decade) | Moderate | Particle coincidence possible at high aerosol concentrations | Moderate |
| Well-characterized sampling system with aerosol dilution possible | Moderate | Count (number)-rather than mass-weighted APSDs | High |
| Continuous tracking of particles through measurement zone | High | Particle density bias | Moderate—mainly of concern with DPIs |
| Particle shape bias | Moderate—mainly of concern with DPIs | ||
| No simulation of inhalation | Low to moderate—needed to test spacers |
API active pharmaceutical ingredient, APSD aerodynamic particle size distribution, DPI dry powder inhaler, TOF time of flight
aWithout abbreviated impactor-inlet accessory
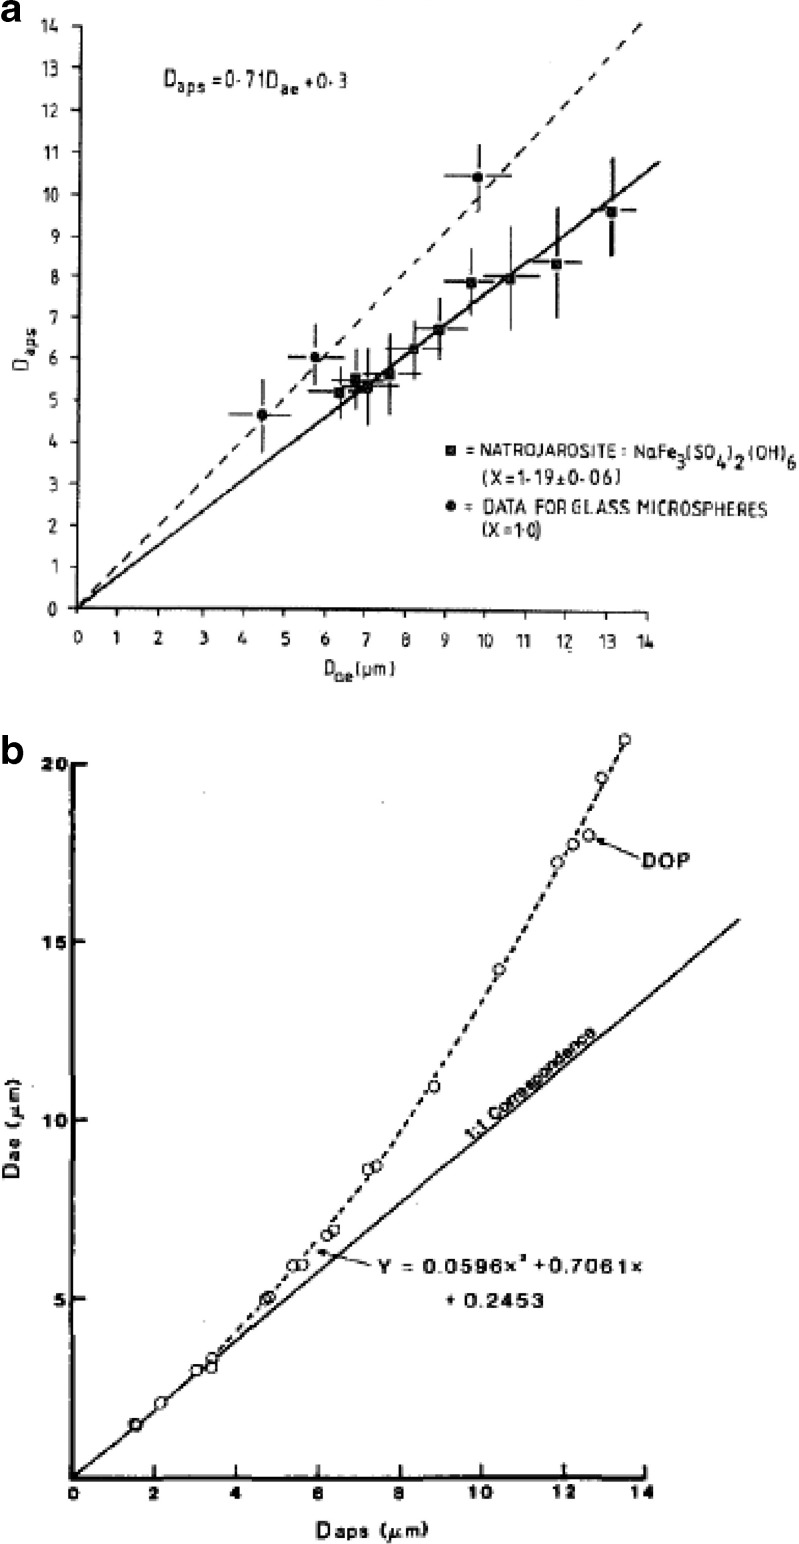
Although much of the DPI-related work has been reported with the Aerosizer TOF analyzer, most probably on account of its versatile range of sample introduction arrangements (17), the APS has also been used with this class of inhalers, but mostly for the evaluation of dry powder characteristics in pre-delivery device development (28). The sampling arrangement for the powder can be problematic, requiring some ingenuity to achieve consistent results. In the case of the study by Kuehl et al. (29), they adapted a bolus dry powder delivery system developed at the Lovelace Respiratory Research Institute (Albuquerque, NM, USA) to deliver the aerosol via an insufflator operated under positive pressure from a mechanical ventilator. Although not acknowledged specifically as a source of bias in such investigations, TOF analyzers have been shown to significantly undersize micron-sized non-spherical particles by as much as 25%, in studies with calibration standard particles having a known dynamic shape factor (χ) (Fig. 3a), defined as the ratio of the resistance force to motion in the Stokesian flow regime for the non-spherical particle compared with that for an ideal spherical particle (30,31). This bias emanates from the way in which non-spherical particles accelerate more efficiently in ultra-Stokesian motion and is therefore an intrinsic error that cannot be eliminated.
Fig. 3.
Two source of bias in the APS® TOF analyzer. a Particle shape-related bias (D aps)—true D ae values were measured by Timbrell gravitational sedimentometer (from Marshall et al. (30)—used by permission). b Droplet deformation based on measurements with low-volatile liquid dioctyl phthalate—true D ae values are calculated from theory (from Cheng et al. (33)—used by permission)
Very few studies have been undertaken using the APS TOF analyzer with jet or ultrasonic nebulizers. This is largely because LD or laser (phase) Doppler analysis are the techniques of choice, both being non-invasive and not involving acceleration of the aerosol stream to ultra-Stokesian conditions as part of the measurement process. In contrast, a sample of the aerosol produced by the nebulizer has to be removed to be measured by the APS, introducing the risk of changes to the measured size distribution brought about by size-selective losses. Furthermore, deformation of droplets larger than a few microns due to ultra-Stokesian behavior in the measurement zone of either instrument may result in a bias toward finer sizes (Fig. 3b) that is hard to quantify, as factors such as surface tension and viscosity also influence the magnitude of the effect (32,33). For these reasons, TOF analysis is unlikely to be appealing for the assessment of larger droplets emitted from nasal spray pumps and nasal pressurized metered dose inhalers.
The development of a version of the TSI APS aerodynamic particle size analyzer with capability for concurrent fluorescence detection of particulates (34) marks a possible way forward to provide the capability for selective detection of certain API species capable of fluorescence, such as the xinafoate radical by TOF-based technique; however, to the authors’ knowledge, nothing is currently available in the public domain concerning this potential application.
E-SPART Analysis
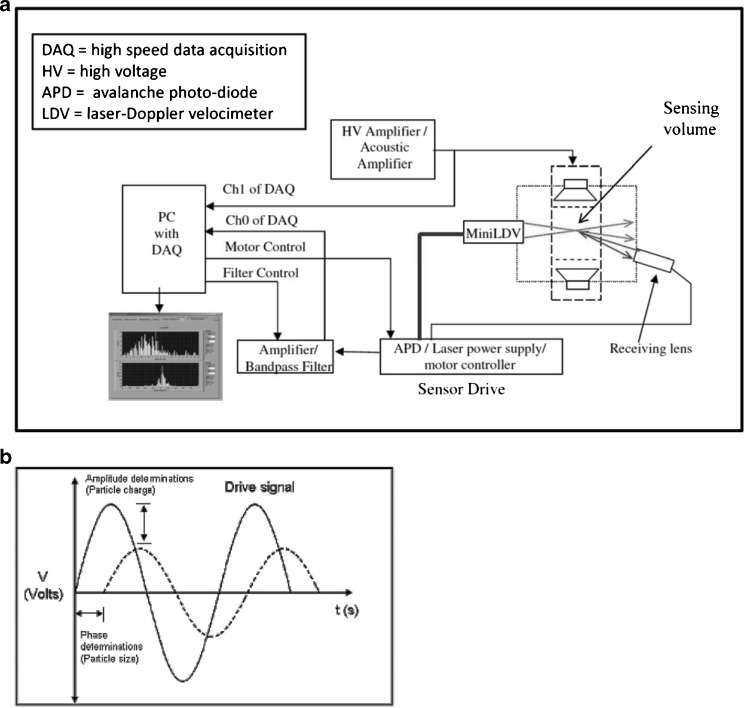
The electrical single-particle aerodynamic relaxation time (E-SPART) analyzer is an alternative technique which is based on the principle of laser Doppler velocimeter for particle sizing but also has aerodynamic particle sizing capability. The E-SPART is an alternative TOF-based system based on the measurement of relaxation time in externally imposed oscillating motion from an applied acoustic or alternating current electric field (Fig. 4a). This instrument, developed by Baron and co-workers (35) from the University of Arkansas in the late 1980s and modified through several generations since, as particle detection technology has improved, has to date been mainly used as an aid in formulation screening (36,37) rather than in routine product performance characterization of OIPs. This is because it has the capability to determine simultaneously the electrostatic charge distribution as well as the APSD. For example, in one study, Philip et al., used an acoustic E-SPART to examine whether the surface charge of hydrophobic poly (d,l-lactide-co-glycolide) microspheres treated with polyamino acids and 2-propanol for a slow-release DPI-delivered formulation can be used as an indicator of their tendency to aggregate (37).
Fig. 4.
TOF analysis by E-SPART analyzer. a Schematic for the acoustic system. b Particle oscillatory motion in response to an alternative electric drive for the E-SPART system (modified from Saini et al. (38)—used by permission)
In this complex measurement system, particles are introduced by the actuation of aerosol generating devices into the aerosol settling chamber, which is followed by the sampling of particles by the E-SPART analyzer at a certain flow rate for detecting the oscillatory motion of particles. Aerodynamic particle size and electrostatic charge are calculated from the phase lag between the electric drive and the particle velocity and the amplitude ratio of the particle motion to that of the electric drive (Fig. 4b) (38).
The E-SPART system has a major advantage of offering the independent measurement of APSDs classified in terms of positive, negative, and neutral particles. Additionally, a dynamic aerosol classification using a pharmaceutical impactor is not required due to the unique detection mechanism of the E-SPART, which is a single-particle-based measurement instrument (39). It has been demonstrated that the E-SPART measurement system has a capability to measure the charge profile of aerosol particles at different particle size distributions without the need for particle impaction (38). From the results, it was found that most OIP aerosols examined had a bipolar charge distribution, and the individual charges showed higher values, although net charge acquired by the aerosol was small, indicating that it has advantages in understanding the nature of materials used for formulation design over other methods. In addition to investigations with pMDI- and DPI-based aerosols, the E-SPART method has been used in conjunction with aqueous droplets from jet nebulizers (40). However, as a general caution, care must be taken when this system is applied, since many factors may influence the result. In particular, the way in which the incoming aerosol is sampled representatively must be validated. Otherwise, it is difficult to know if a representative sample of the aerosol has been taken, due to the severe signal validation criteria that need to be met for an acceptable measurement and which result in many particle transits, particularly those that graze the measurement zone, being rejected. In addition, the E-SPART systems derive number- rather than mass-weighted APSDs, so that statistical noise at the large-particle end of the distribution can be a problem in the same way as is the case with APS-measured data.
Non-aerodynamic Diameter-Based Methods
Laser Diffractometry
The operating principle underlying LD is the low-angle scattering of coherent light (so-called low-angle laser light scattering) that is described comprehensively in a recently updated ISO standard (41). In summary, LD is an ensemble rather than a single-particle measurement method, enabling volume (mass)-weighted PSD data to be obtained rapidly (Table III) and without the need to transform number- to mass-weighted data, as is the case with TOF analyzer-based measurements (Table II). LD systems typically measure particle sizes covering more than 2 orders of magnitude, depending on optical configuration in size with as many as 15 channels per decade of size. The precise range limits depend on the configuration of the optical bench of the instrument. The overall capability is from 0.1 μm to several millimeters depending upon instrument type.
Table III.
Advantages and Limitations of LD Analyzers
| Advantage | Importance | Disadvantage | Importance |
|---|---|---|---|
| Ultra-rapid—few thousand measurements/second—enables transient phenomena to be observed—important with nasal sprays | High | Lack of API specificity | High |
| High size resolution >10 channels/decade | Moderate | Requires the use of a light scattering model (Lorenz–Mie or Fraunhofer approximation) | High (especially for OIPs) |
| Wide dynamic size range: <1 μm to >2 mm diameter | High | Refractive index needed for Lorenz–Mie model | Moderate (many values are readily available) |
| Volume (mass) weighted PSDs directly | Moderate | Particles assumed to be spherical | Moderate (important for DPIs) |
| Can be made non-invasive (no sampling system) | High (especially for nasal sprays) | “Vignetting” may cause truncation of fine particles in PSD—newer systems are less susceptible | Moderate for OIPs and nasal pMDIs—low for nasal sprays |
| No calibration required (validation with a reference standard recommended as part of GXP) | High | Beam steering by propellant if concentrated | High for pMDIs products |
| Low intrinsic measurement variability (coefficients of variation typically <2% for size metrics) | High | Multiple scattering at high aerosol concentrations | High for some nebulizers, otherwise low |
| Droplet evaporation in measurement zone | High for some nebulizers |
API active pharmaceutical ingredient, DPI dry powder inhaler, OIP orally inhaled product, pMDI pressurized metered dose inhaler, PSD particle size distribution
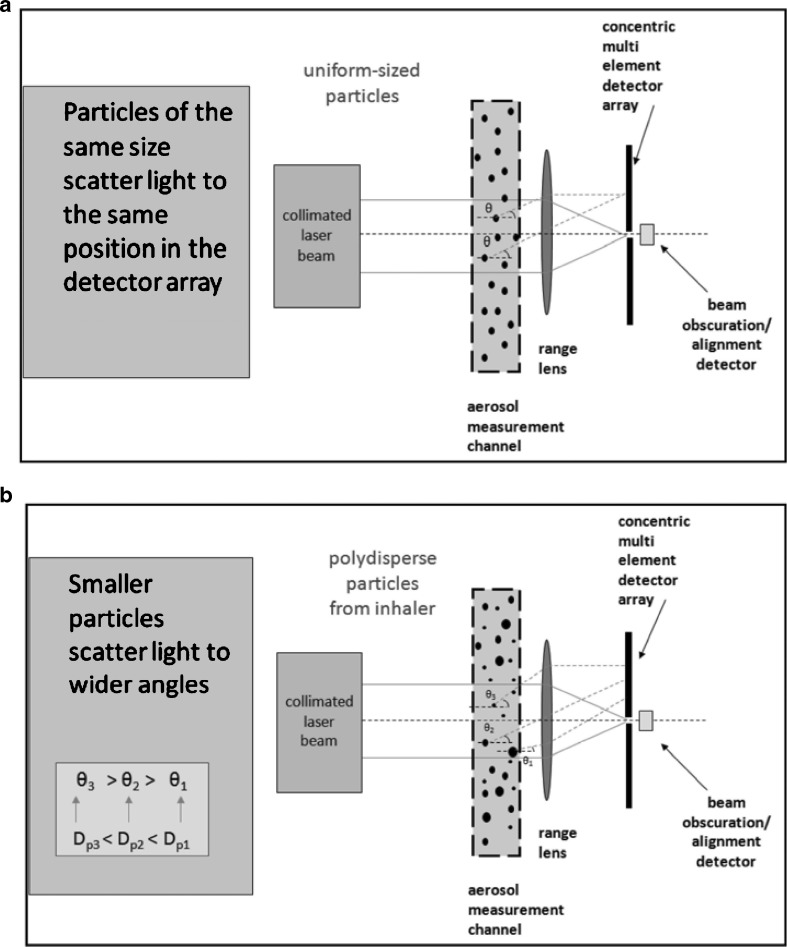
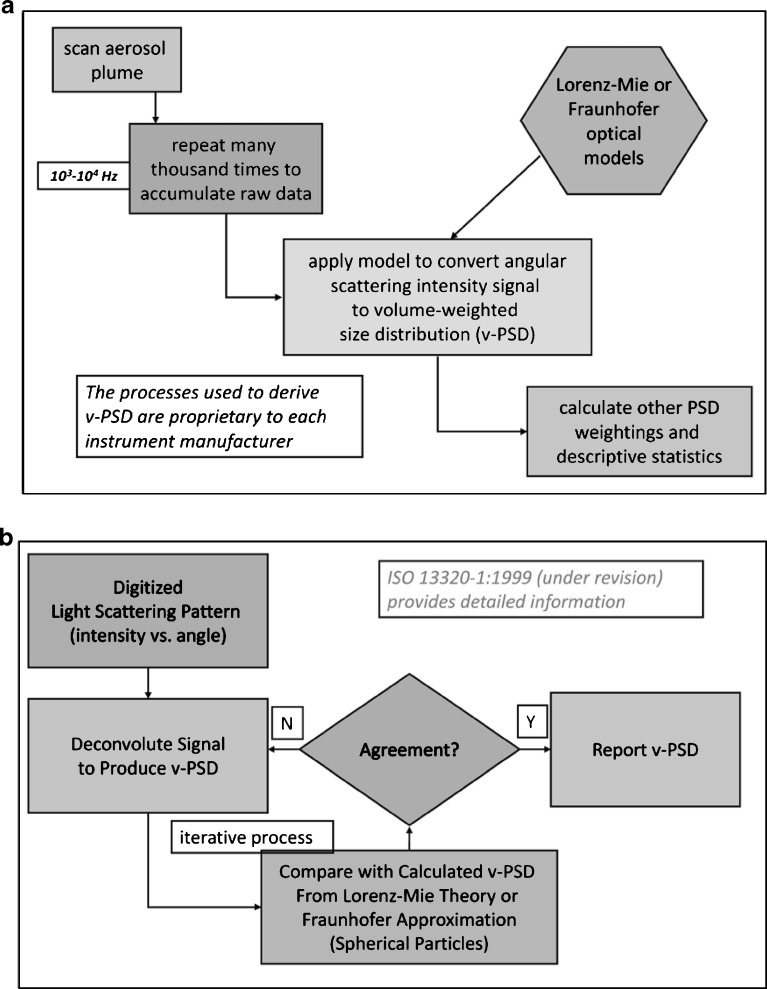
The application of LD for the measurement of aerosols and sprays from all OINDP forms has been reviewed by Mitchell et al. (42), and the reader is referred to that article for a description of the underlying theory, as well as specific applications. A typical configuration of an LD measurement sampling solid particles or droplets of the same size (monodisperse system) is illustrated in Fig. 5a. Note that such particles or droplets always scatter light at the same angle to the concentric ring-diode photodetector (upper illustration), regardless of where they are in the measurement zone. More typically, polydisperse particles or droplets scatter the incoming light at fixed angles related to their size, the smallest scattering at the widest angles (Fig. 5b). Once the light is collected by the photodetector, typically in a sweep lasting less than 1 ms for all the detecting components, the signals are processed and a model applied (either the more comprehensive Lorenz–Mie theory or the simpler Fraunhofer theory) to enable the PSD to be calculated (Fig. 6a).
Fig. 5.
Simplified LD measurement configurations. a LD system sampling monodisperse particles or droplets. b LD system sampling polydisperse particles or droplets
Fig. 6.
Principles of LD. a Processing of light scattering signals into particle size distribution data. b Overall measurement process
Two principal manufacturers of LD systems that are suitable for aerosol or spray measurement are currently Sympatec GmbH (Clausthal-Zellerfeld, Germany—see http://www.sympatec.com/) and Malvern Instruments (Great Malvern, Worcestershire, UK—see http://www.malvern.com/). Sympatec HELOS systems generally make use of Fraunhofer theory, a simplification that avoids the need to specify refractive index data for the particle/droplet and the support medium (air, Heliox, etc.). However, this approach is unsuitable when particle sizes are less than about 40 times the wavelength of the light (41), which in practice, for helium–neon laser light illumination at 0.693 μm, limits this approach for sizing objects larger than ca. 25 μm. This restriction is not likely to be important when assessing aqueous nasal sprays but should be considered for all other inhaled products. Sympatec offers the choice of Lorenz–Mie data interpretation, which is mandatory with systems supplied by Malvern Instruments, such as the older Mastersizer-S and Mastersizer-X instruments, as well as the recently introduced Spraytec instrument.
The overall measurement process by LD is summarized in Fig. 6b. It involves comparing the measured volume-weighted particle size distribution (v-PSD) from deconvolution of the light scattering signals from the photodetector with the corresponding calculated v-PSD applying either Lorenz–Mie or Fraunhofer models in iterative cycles until the two converge within an acceptable amount defined by the manufacturer.
In recent years, LD has become the most important alternative inhaler aerosol/spray sizing technique after multi-stage cascade impaction, on account of its versatility, as well as the potential to avoid having to invasively sample the aerosol. Instead, LD systems can measure by means of a so-called non-invasive approach, in which the droplets or particles are blown across the measurement zone in a flow of air or other support gas. In the case of pMDIs, expansion of the propellant upon actuation will perform this operation automatically. However, it is more usual to draw the sample from these products, or from nebulizers through a measurement cell using a vacuum pump, as greater control of the flow of the aerosol through the measurement zone is possible (43). There are several published studies in which various LD systems have been compared with the multi-stage cascade impactor, using the latter as a validation aid, since LD neither determines API mass nor aerodynamic diameter directly (43–46). An important finding from these investigations was that virtually identical droplet size distributions are obtainable with either technique when sampling aqueous-based solutions, provided precautions are taken to minimize evaporation of the aerosol during sampling (including heat transfer from the impactor to the droplet aerosol), as well as losses associated with different sampling geometries for the CI and LD systems.
Some US and European regulatory guidance documents relating to inhaler testing permit the use of LD in relation to OIP performance assessment, but only if supported by cascade impactor validation data (47,48). The inhalation cell supplied by Malvern Instruments can be set up for simultaneous sampling by LD and multi-stage cascade impactor (Fig. 7) to provide such method validation. In the case of aqueous nasal sprays, however, where cascade impaction is unsuitable because of the large size of the droplets, LD is the preferred method by the US FDA for PSD assessment in at least one guidance document (49).
Fig. 7.
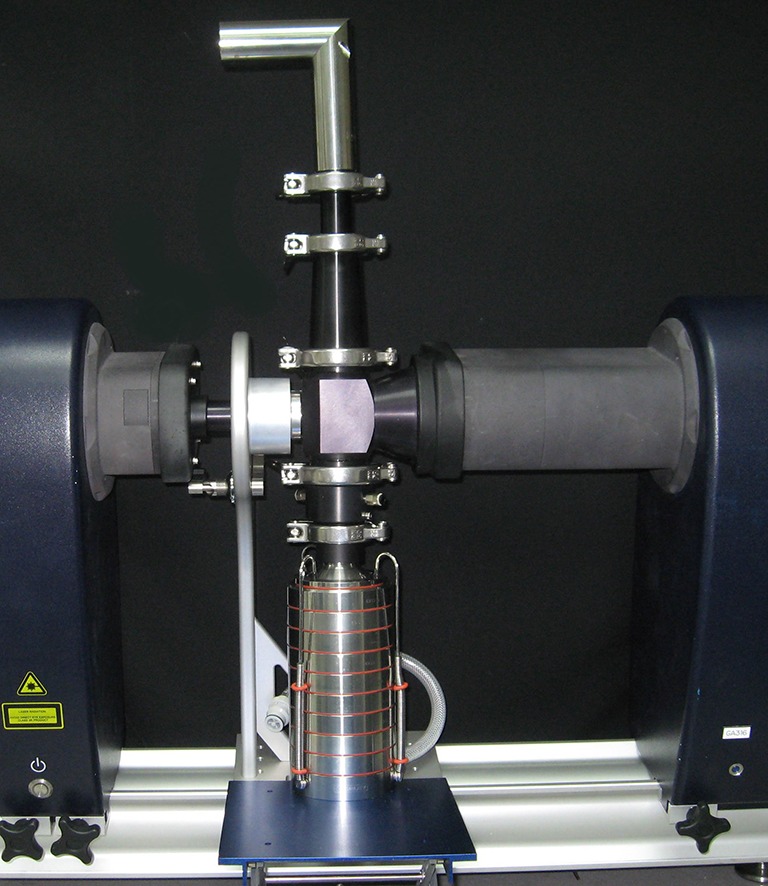
Malvern Spraytec LD with inhalation cell, showing facility for simultaneous sampling to multi-stage cascade impactor (in this Instance the Andersen eight-stage apparatus)
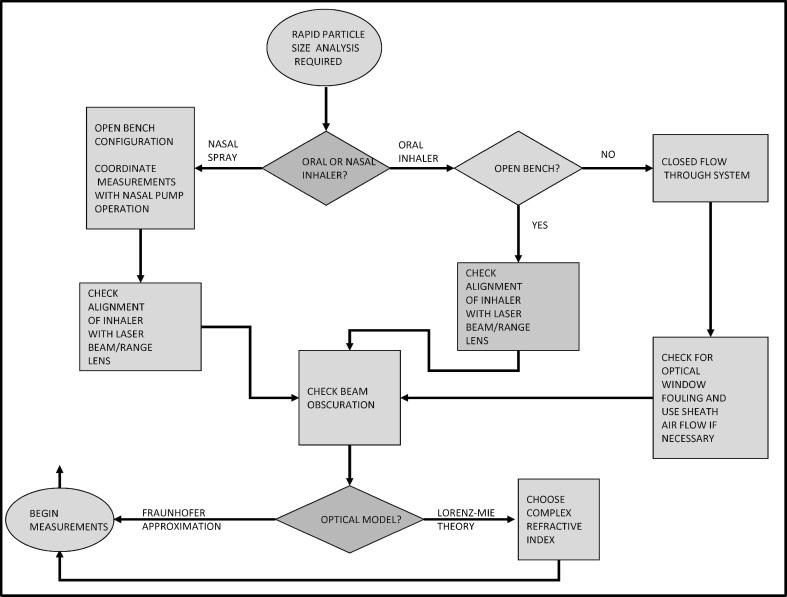
Some general guidance on the suitability of the LD technique across all classes of OINDPs has been provided by Mitchell et al. (42) (Table IV). The general applicability of the technique across the entire platform of delivery systems is apparent (46,50–52), including the capability to subtract one particle size distribution (lactose) from a binary mixture containing drug particles to achieve a drug only particle size distribution, in the context of DPI development (53). In particular, its versatility in being able to be used non-invasively in the open bench configuration (i.e., by blowing the aerosol through the measurement zone) or in the more traditional sampling mode using a so-called inhalation cell is a distinct advantage compared with methods, such as the cascade impactor, that can only sample invasively. Although not cited specifically, LD can be used to size-examine the relatively large carrier particles associated with some DPI products, in which case either Fraunhofer or Lorenz–Mie models are suitable. In Fig. 8, these considerations have been taken a step further, with the development of a decision tree to guide potential LD users to select the most appropriate configuration for their application.
Table IV.
Considerations When Using LD with the Various OINDP Forms
| Consideration | OINDP category | ||||
|---|---|---|---|---|---|
| pMDI | Non-propellant liquid inhalers | Nebulizers | DPIs | Nasal sprays | |
| Preferred configuration | Enclosed system | Open bench/enclosed system | Open bench/enclosed system | Enclosed system | Open bench |
| Vignetting | Yes | Yes | Yes | Yes | No |
| Beam steering | Yes | No | No | No | No |
| Low obscuration | Yes | Yes | Yes | Yes | Yes |
| High obscuration | Yes | No | No | Yes | No |
| Particle refractive index | Yes | Yes | Yes | Yes | Yes (Lorenz–Mie) |
| No (Fraunhofer) | |||||
| Optical model | Lorenz–Mie | Lorenz–Mie | Lorenz–Mie | Lorenz–Mie | Lorenz–Mie/Fraunhofer |
| Evaporation | Yes | Yes | Yes | No | Yes |
| Coordination of measurements with inhaler operation | Yes | Yes | No | Yes | Yes |
DPI dry powder inhaler, pMDI pressurized metered dose inhaler
Fig. 8.
Inhaler-specific considerations associated with the use of LD (from (42), used with permission)
Although the manufacturers of LD equipment point out the advantage of not requiring calibration because the technique is absolute in nature, the accuracy of such measurements of dry powder inhaler lactose carrier particles in the range 20 to 250 μm diameter has recently been investigated systematically (54). Comparisons were made between sizes derived from microscopy-automated image analysis, taking precautions to control particle cohesion. This carefully undertaken study concluded that deviations from non-sphericity resulted in particle size distribution peak broadening while the volume-weighted median diameter (VMD) is unchanged. Almost all users of the LD technique assume that particle density is a constant, independent of size, so that VMD becomes numerically equivalent to the mass median diameter. In the above investigation, deviations from sphericity were estimated to over-predict size distribution breadth (determined by comparing the ratio: ([d90 − d10]/VMD)) by as much as 50% with the non-spherical particles having two-dimensional aspect ratios (Ar) slightly greater than 2.0 (Ar = 1.0 for a perfect sphere). A similar bias was also observed in another similar study by Etzler and Deanne (55). The underlying Lorenz–Mie- or Fraunhofer-based models associated with commercially available LD both assume that the particles are spherical (41). Although these models can be modified to deal with non-spherical particles, such a development would require defining the particle shape rigorously that is a non-trivial task, requiring significant development work to be done by the equipment manufacturers. Given these findings, care should be taken when applying LD to aerosols containing non-spherical particles.
Single-Particle Light Scattering
In contrast to LD, single-particle light scattering systems, sometimes referred to as optical particle counters (OPCs), determine particle size on the basis of differences in scattered light intensity within a well-defined angle in relation to the illuminating light source, which may be polychromatic (white light) or more commonly coherent, monochromatic laser-emitted light (56). These instruments are widely used to characterize aerosols in the environment as well as in specialized applications, such as clean room monitoring, where particle concentrations are low. However, their applicability to study aerosols from medical inhalers is severely limited by sampling problems, as many instruments require focusing of individual particles in the light path as they are measured, which restricts the flow rate that can be achieved into the OPC. Hence, experience with these particle size measurement systems has to date been very limited with respect to the size characterization of aerosols from OINDPs. The advantages and disadvantages of these systems in connection with the measurement of aerosols from OIPs are summarized in Table V.
Table V.
Advantages and Limitations of Single-Particle Light Scattering Analysis
| Advantage | Importance | Disadvantage | Importance |
|---|---|---|---|
| Relatively rapid in comparison to CI | High | Lack of API specificity | High |
| High size resolution (>10 channels/decade) | Moderate | Particles assumed to be spherical | High for DPIs; otherwise low |
| Moderate dynamic range (2 orders of magnitude) | High | Count- rather than mass-weighted data | High |
| Low intrinsic measurement variability (CofV typically <5% for size metrics) | High | Invasive sampling of aerosol generally is required | High |
| Calibration against droplets or spherical particles of known size needed | High | ||
| Some designs have ambiguous region between 1 and 3 μm in region where Mie scattering oscillations in Isca are important- can be improved by use of white light with right-angle scattering | High |
The size measured by OPCs is a complex function of the light scattering cross section of the particle and the angle within which the scattered light is measured (9). Assuming the light source is unpolarized and monochromatic, when its wavelength (λ) ≪ dp, the particle size determined by microscopy, the relation between light scattering intensity (Isca) approximates to dp according to the relationship in accordance with Lorenz–Mie theory:
 |
An exact solution of the relationship requires a knowledge of the geometry of the optical system (i.e., near-forward or right-angle detection of scattered light) and the complex refractive indices (light refraction and absorption components) of the particle and support medium (usually air). The particle’s complex refractive index is often unknown, particularly for formulations that are mixtures of API and excipients.
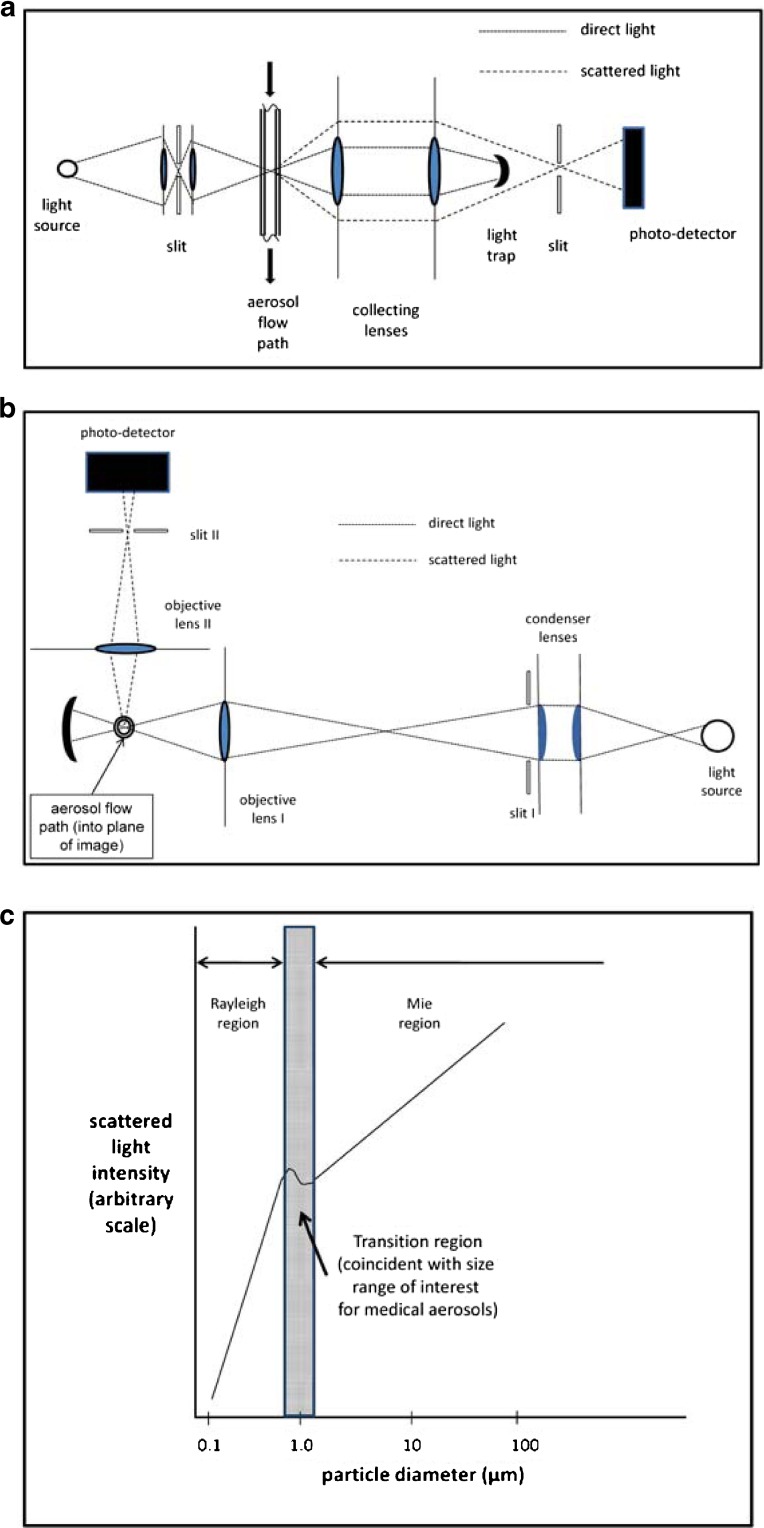
For spherical or near-to-spherical particles, Isca in the near-forward direction (Fig. 9a) ≫Isca at right angles (Fig. 9b), making near-forward systems more sensitive to the detection of smaller particles. When λ ≫ dp, so-called Rayleigh light scattering takes place, where:
 |
Fig. 9.
Single-particle light scattering (optical particle counters). a Near-forward light scattering. b Right angle light scattering. c Non-monotonic light intensity as function of particle size for near-forward light scattering in transition between Rayleigh and Mie regimes
The transition zone between Lorenz–Mie and Rayleigh scattering for widely used He–Ne laser light of λ = 0.69 μm is unfortunately located in the important size range from 1 to 5 μm diameter, where the relationship between Isca and dp oscillates, resulting in multi-valued sizes for a given Isca (Fig. 9c).
Fortunately, although less sensitive in the Lorenz–Mie region, the relationship between Isca and dp with right-angle detection systems is monotonic throughout the transition zone if the light source is polychromatic (i.e., from a halogen lamp; Fig. 9b). Hence, this class of OPC has received significant attention in the development of moderate resolution systems which can typically exceed ten channels per decade of size.
The size range of a single-particle light scattering system is fundamentally constrained by the need to optimize sensitivity in the Rayleigh range and at the same time to have a measurement volume that is large enough to accommodate the largest particles. The sixth power relationship between Isca and dp defines the lower limit at about 0.1 μm for the milliwatt light sources that are used in these instruments. At the large-particle end of the measurement range, the size of the measurement volume determines the probability for oversizing bias caused by the coincidence of more than one particle during measurement at a given particle concentration. Modern OPCs avoid undersizing bias from so-called border-zone error, in which a particle passes only partly illuminated through the edge of the measurement volume (57), by the use of an inner fully illuminated “validation” volume through which particles have to pass in order to be sized (58). In practical terms, a state-of-the-art instrument, such as the Inas® right-angle scattering system with a polychromatic light source (Palas GmbH, Karlsruhe, Germany, www.palas.de/Produktlinien/E_mfp.html), has an upper size limit of 40 μm, with a lower size limit of 0.2 μm, and can measure aerosols whose particle concentration is as high as 107 particles cm−3 without significant coincidence bias.
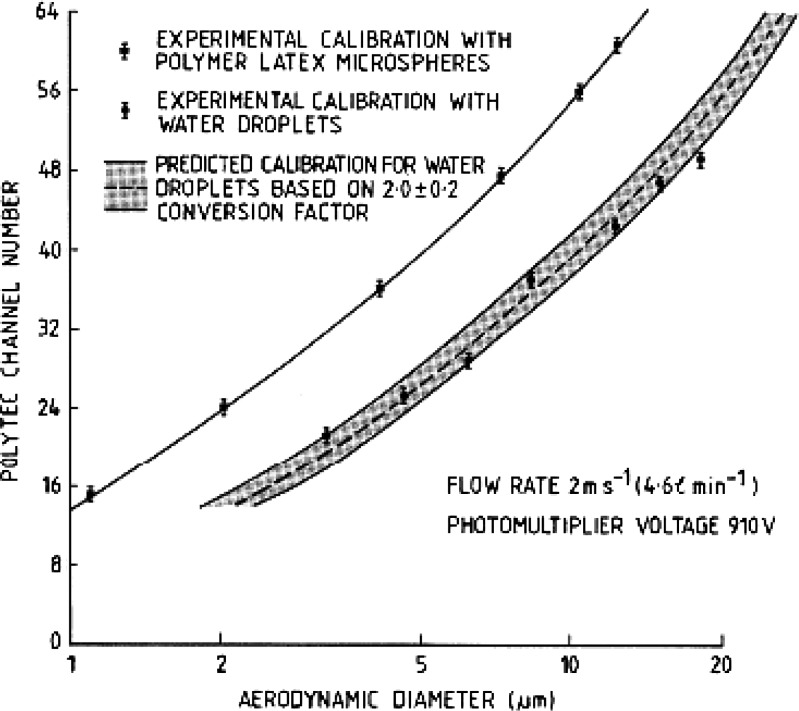
Like TOF analyzers, single-particle light scattering systems are most susceptible to particle coincidence when concentrated aerosols are sampled (59,60), a situation that is likely to occur with many inhalers. Similarly, OPCs also measure particle number concentration by counting particles as they pass through the measurement zone, resulting in the potential for error associated with the transformation from number- to mass-weighted PSD, caused by inadequate sampling of the few largest particles present in almost any given polydisperse distribution. Furthermore, they do not determine the mass of API directly. However, in contrast to TOF-based systems, there is a lack of a direct relationship between OPC-measured particle size and aerodynamic diameter. Mitchell et al. (61) overcame this limitation for aqueous aerosols with similar PSDs to those produced by most nebulizing systems. They developed a single-stage impactor in which the cut-off size could be varied by altering the incoming nozzle diameter. After calibration with various sizes of monodisperse polystyrene latex microspheres of known aerodynamic diameter, this impactor was located in front of an OPC (based on right-angle scattering of light from a polychromatic source) sampling aqueous droplets in the range from about 1 to 20 μm aerodynamic diameter. Confirmation that the calibration of the OPC had been transferred from a size scale related to diameter based on Isca to aerodynamic diameter was verified by comparing the measured response with that predicted from application of Lorenz–Mie theory for spherical light scatterers having the refractive index for pure water (1.33 + 0i) (Fig. 10).
Fig. 10.
Transfer calibration of right-angle polychromatic light OPC in terms of aerodynamic diameter (from (61), used with permission)
In addition to the above-mentioned well-defined sources of bias, OPCs are susceptible to a variety of environmental factors that alter either the light intensity of the illuminating beam or the detected scattered light in an unpredictable manner, in particular, optical window contamination if a sampling cell is present, as is almost always the case (59).
In spite of these limitations, Loffert et al. used a high volume light scattering single-particle spectrometer (model CSASP-100, Particle Measuring Systems, Boulder, CO, USA) to measure size distributions of a variety of jet nebulizers delivering aqueous albuterol solution containing physiologically normal saline (62). Their estimates of volume median diameter ranged from 3.77 to 7.20 μm, and they were able to discriminate differences in droplet size distribution from one nebulizer type to another. Unfortunately, that group did not provide any comparative measurements utilizing other techniques, in particular LD, so it is not possible to judge the value of this approach by reference to the more commonly encountered nebulizer droplet sizing methods. More recently, Jaeger et al. (63), using a single-particle light scattering system with correction for particle coincidence, were able to obtain meaningful particle size distribution data for aerosols from pMDI and nebulizer sources that correlated well with corresponding APSDs determined by multi-stage cascade impactor. Despite the apparent success of these studies, the use of OPCs for OINDPs in vitro assessment will likely not become widespread in the near future, nor will become established in the compendial literature, given the currently large number of potential sources of bias.
Phase-Doppler Particle Sizing
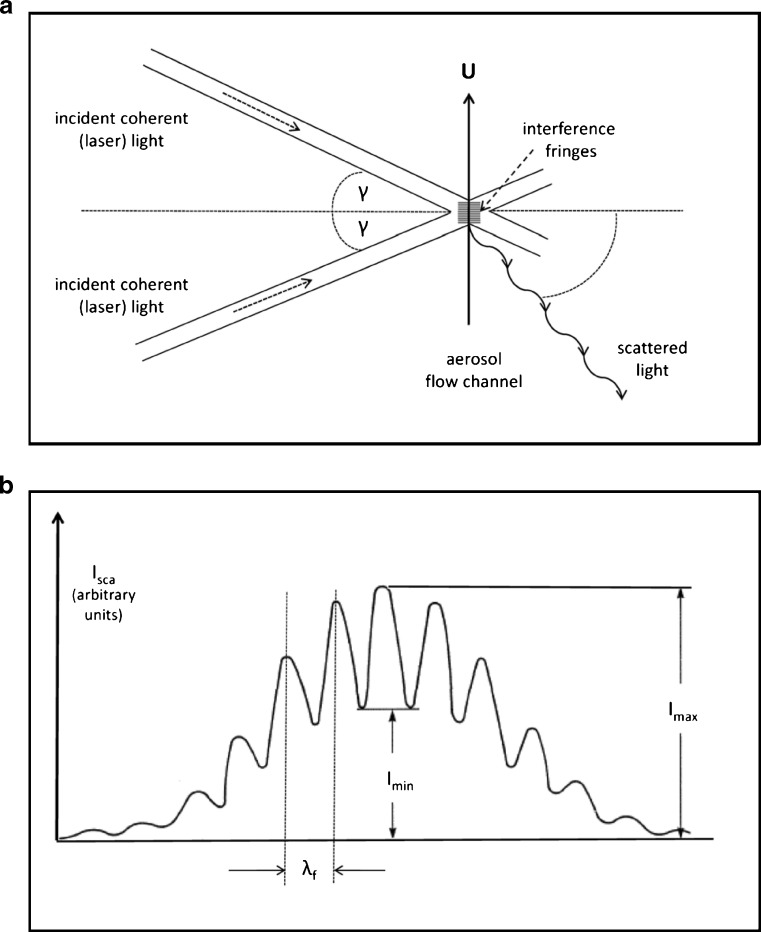
Another group of non-aerodynamic particle sizing instruments is based on the laser Doppler effect. In its simplest form, the scattered light from an individual particle transiting a series of interference fringes set up by coherent, monochromatic light from intersecting laser beams forming the measurement zone is detected as a train of oscillating pulses (64) (Fig. 11a). This technique was developed from laser Doppler anemometry, and information about individual particle velocity (U) as well as size can therefore be obtained simultaneously.
Fig. 11.
Laser interferometry. a Optical arrangement. b Ideal light scattering signal visibility profile
The two laser beams establish an interference pattern with fringe spacing, λf:
 |
where γ is the half angle between the two laser beams. The general form of the scattered light signal from a particle crossing the fringe pattern with velocity, U, takes the form:
 |
where νb = U/λf and t is the transit time (Fig. 11b).
It is possible to measure either the time-averaged scattered intensity of the signal (A) or the signal visibility (Vi). The latter is defined in terms of the amplitudes of the oscillating signal, Imax and Imin:
 |
where Vi is uniquely related to the size of the particle producing the signal normalized to the fringe size, providing that the scattering angle and collection aperture are carefully chosen (65).
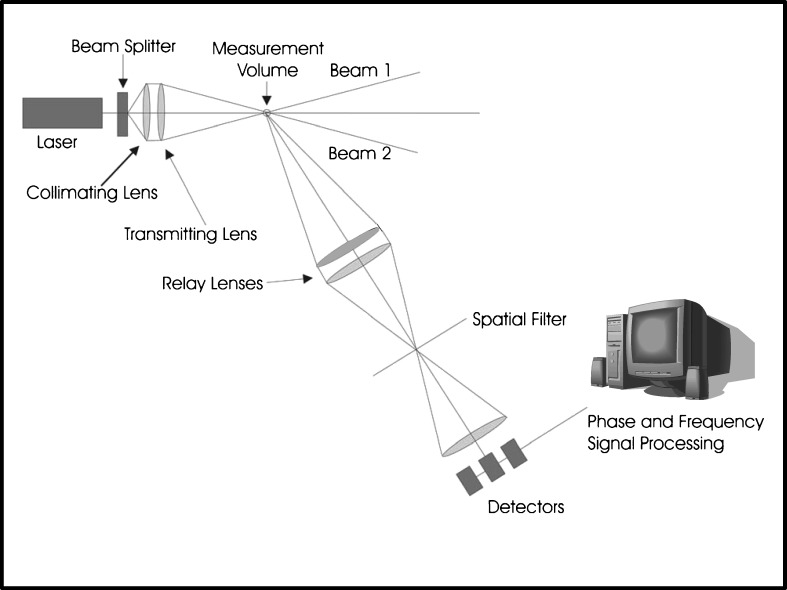
Despite its comparative simplicity, the visibility technique is limited in dynamic size range and cannot be extended to the study of particles much smaller than 20 μm. This limitation has been overcome by making use of the phase difference between light scattering signals at appropriate angles, which was found in the mid-1980s to be a linear function of particle size (66). Bachalo and Hauser (66) have described the fundamentals of the so-called phase-Doppler anemometry (PDA) technique in detail, and therefore, only a simplified explanation is provided here. The equipment for developing a series of interference fringes is basically the same as that already described in connection with laser interferometry. However, in addition, several detectors arranged at different scattering angles are used to sample slightly different spatial portions of the scattered light signal per particle (Fig. 12). In a basic two-detector system, the phase shift between detectors conveys information about particle diameter, refractive index, and receiver geometry.
Fig. 12.
Current three-detector PDA system
PDA has a wide dynamic size range, typically from about 0.3 μm to 8 mm with accuracy of 5% for a particular optical configuration. Since the technique is an extension of laser Doppler anemometry, particle velocity can also be measured in the range from 1 to 200 m s−1 in two or three dimensions with accuracy typically of 1% (65). However, care has to be exercised in setting up the technique, especially to ensure that the criteria used to validate particle transition correctly across the measurement zone are appropriately chosen so as to ensure representative measurement of the whole population of the size distribution.
In terms of applications for OINDP aerosol measurement, PDA has traditionally been applied to the study of unconfined atomizer sprays and has thus far not widely been used. Table VI lists advantages and disadvantages, based on the limited knowledge currently available.
Table VI.
Advantages and Limitations of PDA Analysis
| Advantage | Importance | Disadvantage | Importance |
|---|---|---|---|
| Relatively rapid compared with CI, but care needed with setup | High | Lack of API specificity | High |
| Wide dynamic size range similar to single-particle light scattering systems | High | Valid particle transition across measurement zone selection criteria are severe and can limit size of sample sized | High |
| Non-invasive | High | Expensive | High |
| Count- rather than mass-weighted data | Moderate | ||
| Particle sphericity assumed | High for DPIs; otherwise low |
API active pharmaceutical ingredient, DPI dry powder inhaler
Two of the more important drawbacks are that this technique provides number- rather than mass-weighted size distribution data, and no API assay is undertaken. Furthermore, the assumption of particle sphericity associated with the Lorenz–Mie solution to predict the phase shift as a function of particle size limits its application to droplet rather than dry powder particle sizing. Thus, Stapleton et al. (67) successfully used PDA to measure droplet size distributions produced by jet nebulizers, as it was possible to make accurate and non-invasive size measurements at the immediate exit of the devices before the aqueous droplets were able to evaporate significantly in the ambient environment. More recently, Dunbar et al. (68) were able to obtain particle size distribution data from CFC-propelled pMDI formulations, locating the measurement zone as close as 25 mm from the actuator orifice in order to investigate aerosol plume development under room ambient conditions. However, measurements by that group were undertaken as part of formulation development rather than as a means of characterizing the likely behavior of the particles when inhaled. The ability to acquire simultaneously particle velocity and size information has been taken advantage of in the development of novel pMDI actuators (69), as well as for the determination of plume velocity/droplet size characteristics (70). These research studies represent particularly useful applications for this technology.
To the authors’ knowledge, Corcoran et al. have provided the only systematic comparison to date between PDA- (Aerometrics, Sunnyvale, CA, USA), LD-, and TOF-measured size distribution data, based on aqueous and relatively non-volatile propylene glycol droplets produced by two commercially available jet nebulizers (71). In general, for aqueous droplets, they found a good agreement in both MMAD and size corresponding to the 90th volume-weighted percentile of the size distribution (d90) estimated by PDA with the LD techniques that utilize the Lorenz–Mie light scattering model. Thus, their LD-reported values (Spraytec, Malvern Instruments UK) of MMAD and d90 of 5.0 and 10.9 μm, respectively, for nebulizer 1, were compared with corresponding PDA-measured values (Aerometrics Inc., Sunnyvale, CA, USA) of 4.9 and 10.5 μm. In the case of their second nebulizer, the LD-determined values of MMAD and d90 were 3.4 and 7.8 μm, respectively, with the corresponding PDA-determined values being 3.7 and 8.1 μm. However, such agreement might be anticipated considering that a Lorenz–Mie solution was also applied in their PDA system. They further observed that TOF analyzer measured narrower volume-weighted size distributions compared with the other techniques, so that MMAD and d90 values for nebulizer 1 were 6.4 and 9.6 μm, respectively, and the corresponding results for nebulizer 2 were 5.4 and 8.3 μm. However, they were unable to assign a cause for this behavior. Interestingly, they were able to detect a small population of larger droplets (15–20 μm) by PDA with the nebulizer-produced propylene glycol droplets (data not shown here) that were not observed by the other techniques.
Currently, no systematic comparison between PDA- and CI-measured size distributions of inhaler aerosols is available. However, it is reasonable to anticipate fair agreement between these techniques, at least for aqueous solution-based aerosols that are homogeneous in their composition, on the basis of the findings of Corcoran et al. (71), as well as the similarity between LD- and CI-measured data already discussed for nebulizer-produced droplets (when precautions are taken to minimize evaporation).
Microscopy-Automated Image Analysis with RCI
Microscopy is a large and wide-ranging method of particle size analysis for particles presented in all types of format (liquid, gel, solid, etc.), and an in-depth description of all the available techniques is outside the scope of this review. Given that the focus of this article is on the in vitro particle size characterization of aerosols from OINDPs, emphasis is placed on the preparation and study of aerosol particles. Although basic optical or electron microscopic techniques are labor-intensive and do not directly relate size metrics to the aerodynamic diameter scale without additional information on particle density and shape, this mode of particle size analysis should not be neglected, since it provides the only direct method of viewing particles with sufficient resolution to study shape and surface structure. For pMDIs and DPIs, the US FDA recognizes the advantage of this technique because it can provide information on the presence of large particles, changes in morphology of the particles containing API, presence of agglomerates, crystal growth, and presence of foreign particulate matter (72).
Nowadays, microscopy is almost always combined with automated image analysis in order to reduce the labor content and minimize operator bias associated with manual inspection methods. The basic guidelines for particle size analysis by microscopy image analysis are given in ISO 13322-Part 1:2004 (static image analysis methods) (73) and ISO 13322-Part 2:2006 (dynamic image analysis methods) (74). A full description of optical microscopy for particle characterization is also given in part 1 of the Particle Atlas (75), and basic measurement techniques are also described in Microscopy Handbook 23 of the UK Royal Microscopy Society (76). For solid particles, scanning/transmission electron microscopy rather than optical microscopy is the more likely method for acquisition of image-based data. However, the processing of the images into a resulting number-weighted PSD is similar, whichever acquisition technique is used.
Optical and electron microscopy are still probably the most valuable techniques for general particle size distribution analysis because these types of measurement relate directly to the physical dimensions of the particles. Importantly, information about surface texture and shape can also be deduced from a careful study of good quality micrographs with sharply defined particle boundaries capable of being produced by current state-of-the-art microscopy image analysis systems. Optical techniques are confined by the limit imposed on resolution due to the finite wavelength of the interrogating light source, i.e., images of particles ca. <2 μm diameter cannot be acquired with adequate resolution. Smaller particles can be sized using electron microscopic techniques, but such methods, in general, operate in vacuo and are inappropriate for volatile particles without specialized ancillary equipment such as a cryogenic stage.
The acquisition of a representative number of particles is an important requirement for accurate determination of PSD by all microscopy-based sizing methods. Whichever method is used to collect the particles (most commonly by sampling onto a filter medium having a contrasting background image), a key concern is to obtain representative numbers of particles for the required size resolution. As a minimum, between 300 and 1,000 particles may need to be sized to obtain representative data, and this process may require the sizing of as many as 100 images. If an automated image analyzer is used, care is required to ensure that the particles are always in focus and that the discrimination techniques used to define the edges of each particle do not introduce systematic biases. As a general rule, particles located on the boundary of the image should be eliminated and most image analyzers are equipped with software to perform this function automatically. Example recommended magnifications based on the expression are as follows for particle sizes in the range of interest in OINDP aerosol size classification:
0.25 μm particle size viewed at ×10,000 magnification provides a field area of 1.0 × 10⁻⁶ cm2, representing 9.9 × 10⁵ fields/cm2
1.0 μm particle size viewed at ×2,500 magnification provides a field area of 1.0 × 10⁻⁵ cm2, representing 6.2 × 10⁴ fields/cm2
4.0 μm particle size viewed at ×600 magnification provides a field area of 2.8 × 10⁻⁴ cm2, representing 3.6 × 10³ fields/cm2
These values are based on the general expression:
 |
where N is the total number of particles forming the size distribution, Nm is the number of particles counted per micrograph, mm is the calibrated length of the micron-scale marker on the micrograph (micrometers), 1m is the actual length of this marker in centimeters, Lm and Wm are the length and width, respectively, in centimeters of the micrograph, nm is the number of micrographs examined, and Af is the collection area (square centimeters) of the filter used to capture the aerosol particles. In the examples given above, no particle image will appear smaller than 2 mm in the micrograph.
A variety of automated image analysis equipment can be used to process micrographs; examples are listed in the study by Chambers et al. (77), in connection with a multi-center precision and accuracy comparison for the assessment of objects used to simulate exit profiles from cascade impactor nozzles in the context of impactor qualification. Although the objective of their study, being cascade impactor-focused, is outside the scope of this review, the information obtained about the size-resolving capability, measurement precision, and accuracy of the various types of image analysis equipment in use is pertinent. Furthermore, the nature of the measurement process is equally pertinent to the process of converting images of different sized particles into PSD data.
Combination particle sizing techniques, such as microscopy image analysis for determining particle size and surface topology and LD for rapid assessment of particle size distribution after controlled dispersion in either a liquid or gas, have been used to assess the effects of making changes to particle surfaces, such as the addition of coatings (78). Here, there is no need to relate the two measurements to a common size scale, such as aerodynamic diameter; the shape-related information from microscopy is correlated to the powder dispersion behavior, based on the fineness of the LD-determined size distributions. This combination of two sizing techniques has obvious application in formulation development, particularly for DPIs, where dispersibility is of critical importance in relation to inhaler performance (79).
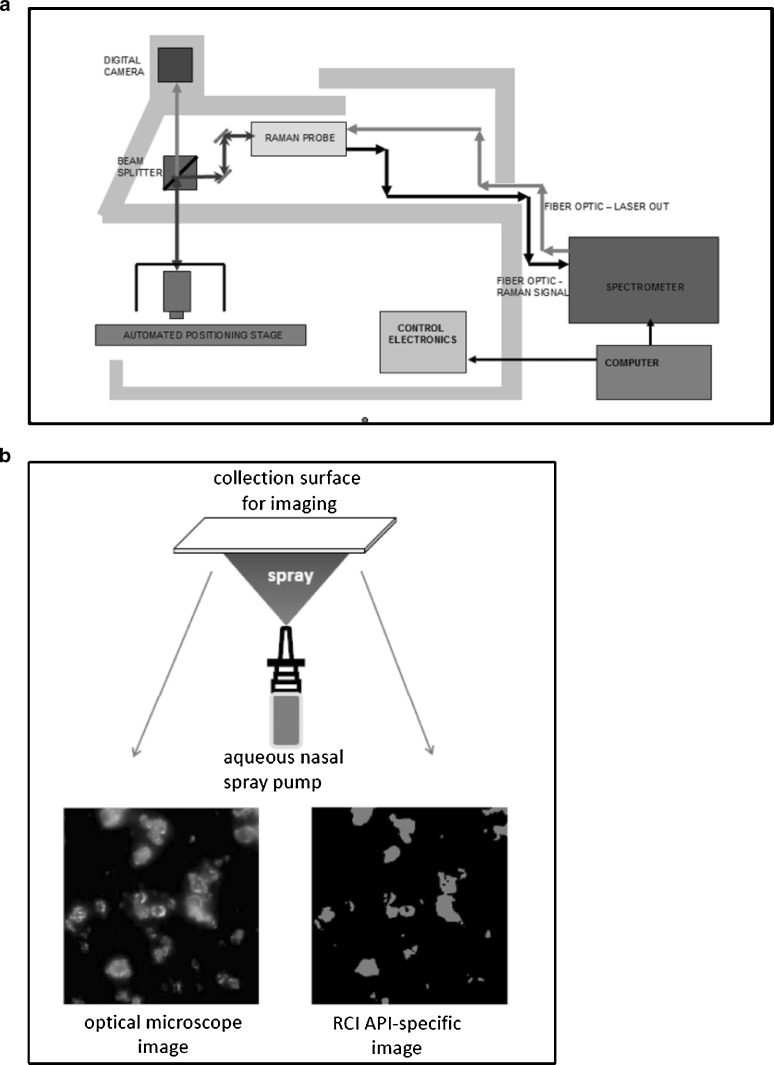
The recently introduced Morphologi® G3 dedicated microscope-automated image analysis system (Fig. 13a) from Malvern Instruments, Malvern, UK (see http://www.malvern.com/common/downloads/MRK978.pdf, visited April 21, 2011) represents the current state-of-the-art in dedicated microscopy-automated image analysis systems for pharmaceutical applications. This system has the built-in capability to determine two-dimensional particle shape from thousands of optical microscope-based image projections in near to real time. Although an obvious use for this equipment is in the size and shape examination of dry powders in early stage DPI development, where it has been used with concurrent RCI (see below) (80), another important application is the characterization of particles in liquid suspensions rather than collected as an aerosol. This method can detect particles larger than 0.5 μm diameter with appropriate setup of the microscope. This type of equipment may be applied widely in the future to formulation development for OINDPs, rather than in finished product QC.
Fig. 13.
Arrangements for microscopy with combined image analysis and chemical species identification by Raman spectroscopy. a Morphologi® particle size and shape measurement system with Raman chemical imaging capability (courtesy of Malvern Instruments Ltd, UK). b Schematic showing microscopy–RCI technique applied to an aqueous nasal spray formulation (from J. Suman—used by permission)
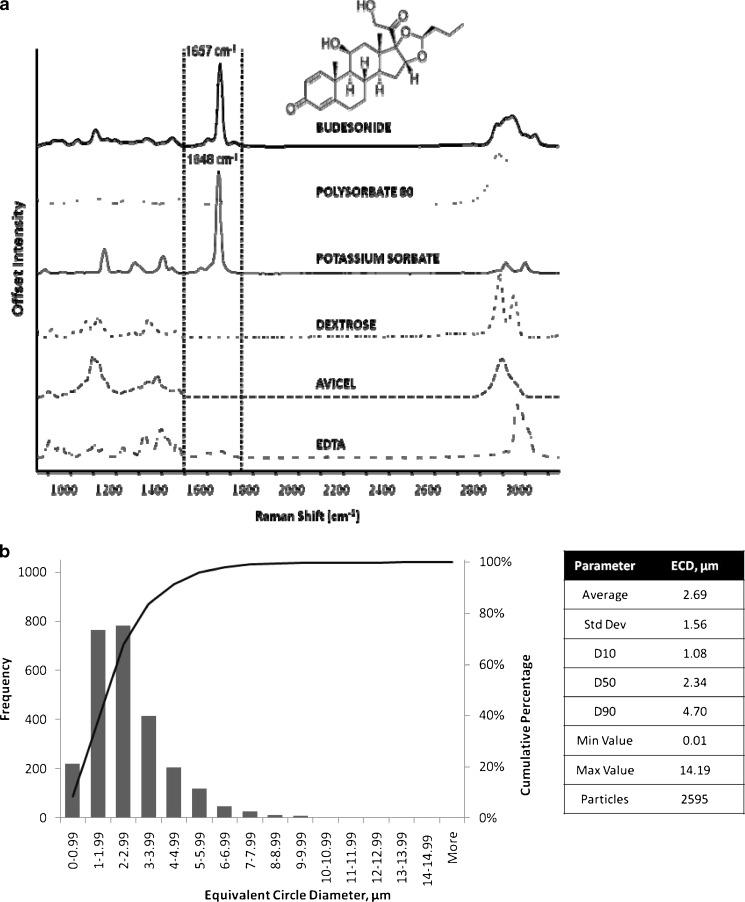
Despite the improvement in automation of these systems, until recently, a major drawback to the acceptance of microscopy image analysis in the assessment of OINDPs was the lack of a direct correlation between mass of API and PSD data generated by these systems (8). However, the advent of RCI, in which spatially resolved images of particles are assayed using their Raman spectra to provide detailed mapping of different chemical species (81–85), may change the picture substantially. RCI functions by identifying API-specific chemical bonding structures from Raman chemical shifts obtained by inelastic scattering from a coherent light source in the near infrared, visible, or near ultraviolet wavelength range. The image analysis component enables the sources of these signals to be precisely located in a two-dimensional image (map) that is based on microscopic observation of a sample of the particles emitted from the inhaler. An example of the visual information that can be obtained is presented in Fig. 13b for Rhinocort® (AstraZeneca), an aqueous suspension of budesonide for nasal delivery by spray pump. Figure 14a illustrates the RCI data for this formulation and the PSD for budesonide content is illustrated in Fig. 14b.
Fig. 14.
Application of Raman chemical imaging to the assessment of a suspension nasal spray product. a RCI shifts identified for each component of Rhinocort® Nasal Spray (courtesy of Oksana Klueva, ChemImage Corporation). b RCI-image analysis-based PSD for budesonide content of Rhinocort® Aqueous Nasal Spray (courtesy of Oksana Klueva, ChemImage Corporation)
Since spectral shifts as small as 2 cm−1 can be detected, the possibility exists to determine polymorphic and hydrated forms of a given API (82). Although it is still early days for this extension of the microscopy-based method for gaining particle size distribution information, applications have been reported for the assessment of combination APIs in both DPI development (83,84) and pMDI development (85,86) and also in the assessment of APIs for use in aqueous nasal spray products (87). However, while it appears that microscopy–RCI may be useful to detect changes in API, e.g., polymorph content, it seems unlikely that it can be used to actually quantify the amount of API in each discrete particle, thereby allowing for a determination of mass as a function of particle size.
PATHWAY FOR COMPENDIAL ADOPTION FOR ALTERNATIVE PARTICLE SIZING METHODS
Currently, only LD and microscopy are recognized as alternative particle sizing methods to cascade impaction for OINDP in the US Pharmacopeia. The guidance concerning instrument setup and operation provided in the chapter 429 covering LD is based on that provided in ISO 13320-1:2009. However, the text is largely non-specific to aerosol or spray characterization and is instead mainly concerned with the determination of particle size distributions of solid suspensions in liquid media (88). There is therefore a need either to make the information contained in this chapter more relevant to OINDPs, and currently, there is a proposal under consideration that Chapter 601, which covers the measurement of APSD for OINDPs, should be revised to include a section specifically concerned with LD (89). This requirement is becoming increasingly urgent with the advent of new chapters defining methods in relation to preparations for nebulization that are currently in process of finalization for both the European (90) and US (91) Pharmacopeias. While acknowledging the fact that LD does not measure the mass of API directly, this technique would be possible for homogeneous solution aerosols and sprays and is therefore permitted to be used if validated against a cascade impactor method.
Optical microscopy is covered in a normative chapter in the US Pharmacopeia (92), but the information provided is general in nature and related largely to the characterization of solid particles having different crystal habits. It does, however, provide definitions for particle diameter for non-circular (non-spherical particle) as well as circular (spherical particle) profiles, as well as guidance on specimen preparation. Scanning electron microscopy also has its own chapter in the US Pharmacopeia (93), but this is a general purpose information monograph on the technique, with little guidance on its application in the context of assessing particle size distributions from OINDPs. In any case, this electron optical imaging technique is inapplicable for the assessment of liquid droplets, making it useful only for the DPI category. Importantly, there is no information currently included in either chapter covering automated image analysis. This accessory is a prerequisite for efficient assessment of a large enough sample of particles or droplets to produce a statistically meaningful size distribution from an OINDP aerosol or spray. Furthermore, RCI is too new as an established API-specific detection technique to have been incorporated into the compendia, so that users of this potentially valuable extension to microscopy image analysis are presently reliant on the manufacturers of the equipment for advice. The inclusion of both improvements to the basic microscopic analysis into the compendia, most likely as informational rather than normative monographs, should therefore be a priority in the next few years, although, given the general applicability of these techniques to the analysis of samples from non-aerosol as well as aerosol-based products, it is likely that information that eventually gets into the compendia will be of general applicability rather than tailored specifically to meet the needs of OINDPs.
The remaining particle sizing techniques that have been reviewed are largely experimental in nature and are therefore likely to remain outside the scope of the compendia, unless there is significant need for their inclusion, supported by well-characterized studies demonstrating their validation and preferably also including information about their limitations in respect to the different classes of OINDPs.
CONCLUSIONS
There are several viable options as alternatives to cascade impaction for the determination of PSDs from all types of OINDPs, and this article has attempted to highlight their features, benefits, and drawbacks. Apart from LD, just about all the techniques are likely to be confined to the characterization of the product in development because they are not recognized by either the compendial or regulatory authorities as having been sufficiently validated that they can be used in a product QC environment. The development of systems that provide chemical speciation directly traceable to the mass of API constituent(s) in the formulation being aerosolized through spectroscopic methods marks an important new capability that is resulting in the availability of new image-analysis-based techniques, either based on sample capture followed by microscopy or more usefully on non-invasive imaging in real time. Such techniques are in their infancy at the present time, so that the prospect exists of their wider application within the scope of OINDP aerosol characterization as experience is gained and the techniques themselves are improved.
ACKNOWLEDGEMENTS
The authors are grateful for the technical advice received from colleagues within the IPAC-RS Cascade Impactor Working Group, as well as recommendations from the IPAC-RS Board of Directors during the internal review process. They also wish to acknowledge helpful scientific discussions with Dr. Julie Suman (NextBreath, LLC) and Mr. William Doub (U.S. FDA, CDER) regarding application of RCI to the study of nasal spray-based formulations.
Footnotes
DISCLAIMER
The mention of any equipment, drug products or companies in this article is for informational purposes only and does not constitute an endorsement of those products or companies by the authors or by any organization with which the authors are affiliated.
REFERENCES
- 1.Mitchell JP, Nagel MW. Cascade impactors for the size characterization of aerosols from medical inhalers. Their uses and limitations. J Aerosol Med. 2003;16(4):341–77. doi: 10.1089/089426803772455622. [DOI] [PubMed] [Google Scholar]
- 2.Christopher D, Curry P, Doub W, Furnkranz K, Lavery M, Lin K, et al. Considerations for the development and practice of cascade impaction testing including a mass balance failure investigation tree. J Aerosol Med. 2003;16(3):235–47. doi: 10.1089/089426803769017604. [DOI] [PubMed] [Google Scholar]
- 3.Bonam M, Christopher D, Cipolla D, Donovan B, Goodwin D, Holmes S, et al. Minimizing variability of cascade impaction measurements in inhalers and nebulizers. AAPS PharmSciTechnol. 2008;9(2):404–13. doi: 10.1208/s12249-008-9045-9. [DOI] [PMC free article] [PubMed] [Google Scholar]
- 4.US Food Drug Administration. Guidance for Industry: Quality Systems Approach to Pharmaceutical CGMP Regulations. September 2006. Available at: http://www.fda.gov/downloads/Drugs/GuidanceComplianceRegulatoryInformation/Guidances/ucm070337.pdf. Accessed 2 Nov 2010.
- 5.Suman JD, Laube BL, Dalby R. Comparison of nasal deposition and clearance of aerosol generated by a nebulizer and an aqueous spray pump. Pharm Res. 1999;16:1648–52. doi: 10.1023/A:1011933410898. [DOI] [PubMed] [Google Scholar]
- 6.Marple VA, Rubow KL, Olson BA. Inertial, gravitational, centrifugal, and thermal collection techniques. In: Baron PA, Willeke K, editors. Aerosol measurement: principles, techniques and applications. 2. New York: Wiley Interscience; 2001. pp. 229–60. [Google Scholar]
- 7.Suman JD, Laube BL, Lin T, Brouet G, Dalby R. Relevance of in vitro tests of nasal solutions to predict in vivo deposition. Pharm Res. 2002;19:1–6. doi: 10.1023/A:1013643912335. [DOI] [PubMed] [Google Scholar]
- 8.Mitchell JP, Nagel M. Particle size analysis of aerosols from medicinal inhalers. KONA-Powder and Particle. 2004;22:32–65. [Google Scholar]
- 9.Hinds WC. Properties, behavior, and measurement of airborne particles. 2. New York: Wiley-Interscience; 1999. [Google Scholar]
- 10.Heyder J, Svartengren MU. Basic principles of particle behavior in the human respiratory tract. In: Bisgaard H, O’Callaghan C, Smaldone GC, editors. Drug delivery to the lung. New York: Marcel Dekker; 2002. pp. 21–45. [Google Scholar]
- 11.Adjei AL, Qiu Y, Gupta PK. Bioavailability and pharmacokinetics of inhaled drugs. In: Hickey AJ, editor. Inhalation aerosols: physical and biological basis for therapy. New York: Informa Healthcare; 2007. pp. 187–218. [Google Scholar]
- 12.FDA-CDER. Draft guidance: metered dose inhaler (MDI) and dry powder inhaler (DPI) drug products chemistry, manufacturing and controls documentation. 1998. Docket 98D-0997. http://www.fda.gov/downloads/Drugs/GuidanceComplianceRegulatoryInformation/Guidances/ucm070573.pdf. Accessed 4 Mar 2011
- 13.FDA-CDER. Nasal spray and inhalation solution, suspension, and spray drug products chemistry, manufacturing, and controls documentation. 2002. Docket No. 99D-1454. http://www.fda.gov/downloads/Drugs/GuidanceComplianceRegulatoryInformation/Guidances/ucm070575.pdf. Accessed 4 Mar 2011.
- 14.Fuhrman M, Priore R, Oksana K, Oksana O. Automation of ingredient-specific particle sizing using Raman Chemical Imaging. U.S. Patent Office, January 8, 2010. Patent Application 12/684495.
- 15.Mansour HM, Hickey AJ. Raman characterization and chemical imaging of biocolloidal self-assemblies, drug delivery systems, and pulmonary inhalation aerosols: a review. AAPS PharmSciTechnol. 2007;8(4):Article 99. http://www.aapspharmscitech.org/view.asp?art=pt0804099. Accessed 4 Mar 2011. [DOI] [PMC free article] [PubMed]
- 16.Baron PA, Mazumder MK, Cheng YS. Direct-reading techniques using optical particle detection. In: Willeke K, Baron PA, editors. Aerosol measurement: principles, techniques and applications. New York: Van Nostrand Reinhold; 1993. pp. 381–409. [Google Scholar]
- 17.Mitchell JP, Nagel MW. Time-of-flight aerodynamic particle size analyzers: their use and limitations for the evaluation of medical aerosols. J Aerosol Med. 1999;12(4):217–40. doi: 10.1089/jam.1999.12.217. [DOI] [PubMed] [Google Scholar]
- 18.Chen BT, Cheng YS, Yeh HC. Performance of a TSI aerodynamic particle sizer. Aerosol Sci Technol. 1985;4:89–97. doi: 10.1080/02786828508959041. [DOI] [Google Scholar]
- 19.Harris J, Stein SW, Myrdal PB. Evaluation of the TSI Aerosol Impactor 3306/3321 system using a redesigned impactor stage with solution and suspension metered-dose inhalers. AAPS PharmSciTechnol. 2006; 7(1): Article 20. doi:10.1208/pt070120. [DOI] [PMC free article] [PubMed]
- 20.Tiwari D, Goldman G, Malick WA, Madan PL. Formulation and evaluation of albuterol metered dose inhalers containing tetrafluoroethane (P134a), a non-CFC propellant. Pharm Dev Technol. 1998;3(2):163–74. doi: 10.3109/10837459809028492. [DOI] [PubMed] [Google Scholar]
- 21.Bouchikhi A, Becquemin MH, Bignon, Roy JM, Teillac A. Particle size study of nine metered dose inhalers, and their deposition probabilities in the airways. Eur Resp J. 1988;1:547–52. [PubMed] [Google Scholar]
- 22.Mitchell JP, Nagel MW, Wiersema KJ, Doyle CC. Aerodynamic particle size analysis of aerosols from pressurized metered-dose inhalers: comparison of Andersen 8-stage cascade impactor, Next Generation Pharmaceutical Impactor, and model 3321 aerodynamic particle sizer aerosol spectrometer. AAPS PharmSciTechnol. 2003;4:Article 54. [DOI] [PMC free article] [PubMed]
- 23.Stein SW, Myrdal PB. A theoretical and experimental analysis of formulation and device parameters affecting solution MDI size distributions. J Pharm Sci. 2004;93:2158–75. doi: 10.1002/jps.20116. [DOI] [PubMed] [Google Scholar]
- 24.Terzano C, Mannino F. Aerosol characterization of three corticosteroid MDIs with Volumatic™ holding chamber and MDIs alone at two inspiratory flow rates. J Aerosol Med. 1999;12(4):249–54. doi: 10.1089/jam.1999.12.249. [DOI] [PubMed] [Google Scholar]
- 25.Myrdal PB, Stein SW, Mogalian E, et al. Comparison of the TSI Model 3306 Impactor Inlet with the Andersen cascade impactor: solution metered dose inhalers. Drug Dev. Ind. Pharm. 2004;30:859–68. doi: 10.1081/DDC-200034575. [DOI] [PubMed] [Google Scholar]
- 26.Mogalian E, Myrdal PB. Application of USP inlet extensions to the TSI Impactor System 3306/3320 using HFA 227 based metered dose inhalers. Drug Dev. Ind. Pharm. 2005;31:977–85. doi: 10.1080/03639040500306211. [DOI] [PubMed] [Google Scholar]
- 27.Myrdal PB, Mogalian E, Mitchell JP, Nagel M, Wright C, Kiser B, et al. Application of heated inlet extensions to the TSI 3306/3321 system: comparison with the Andersen cascade impactor and next generation impactor. J. Aerosol Med. 2006;19(4):543–54. doi: 10.1089/jam.2006.19.543. [DOI] [PubMed] [Google Scholar]
- 28.Cheng YS, Yazzie D, Gao J, Muggli D, Etter J, Rosenthanl GJ. Particle characteristics and lung deposition patterns in a human airway replica of a dry powder formulation of polylactic acid produced using supercritical fluid technology. J. Aerosol Med. 2003;16(1):65–73. doi: 10.1089/089426803764928374. [DOI] [PubMed] [Google Scholar]
- 29.Kuehl PJ, Barrett EG, McDonald JD, Rudolph K, Vodak D, Dobry D, Lyon D. Formulation development and in vivo evaluation of a new dry powder formulation of albuterol sulphate in beagle dogs. Pharm Res. 2010;27:894–904. doi: 10.1007/s11095-010-0084-z. [DOI] [PubMed] [Google Scholar]
- 30.Marshall IA, Mitchell JP, Griffiths WD. The behavior of regular-shaped, non-spherical particles in a TSI aerodynamic particle sizer. J Aerosol Sci. 1991;22(1):73–89. doi: 10.1016/0021-8502(91)90094-X. [DOI] [Google Scholar]
- 31.Cheng Y-S, Chen BT, Yeh HC, Marshall IA, Mitchell JP, Griffiths WD. Behavior of compact non-spherical particles in the TSI aerodynamic particle sizer model APS33B: ultra-Stokesian drag forces. Aerosol Sci Technol. 1993;19(3):255–67. doi: 10.1080/02786829308959634. [DOI] [Google Scholar]
- 32.Griffiths WD, Iles PJ, Vaughan NP. The behavior of liquid droplets in an APS3300. J Aerosol Sci. 1986;17(6):921–30. doi: 10.1016/0021-8502(86)90018-2. [DOI] [Google Scholar]
- 33.Cheng Y-S, Chen BT, Yeh HC. A study of density effect and droplet deformation in the TSI aerodynamic particle sizer. Aerosol Sci Technol. 1990;12:278–85. http://www.informaworld.com/smpp/ftinterface∼content=a778641175∼fulltext=713240930∼frm=content. Accessed 9 Feb 2011
- 34.Ho J Y-W. Fluorescent biological particle detection system. US Patent 5701012. 1997.
- 35.Baron PA, Mazumder MK, Cheng Y-S. Direct-reading techniques using particle motion and optical detection. In: Baron PA, Willeke K, editors. Aerosol measurement: principles, techniques, and applications. New York: Wiley; 2001. pp. 495–535. [Google Scholar]
- 36.Ali M. A novel method of characterizing medicinal drug aerosols generated from pulmonary drug delivery devices. PDA J Pharm Sci Technol. 2010;64(4):364–72. [PubMed] [Google Scholar]
- 37.Philip VA, Mehta RC, Mazumder MK, DeLuca PP. Effect of surface treatment on the respirable fractions of PLGA microspheres formulated for dry powder inhalers. Int J Pharm. 1997;151(2):165–74. doi: 10.1016/S0378-5173(96)04879-X. [DOI] [Google Scholar]
- 38.Saini D, Biris AS, Srirama PK, Mazumder MK. Particle size and charge distribution analysis of pharmaceutical aerosols generated by inhalers. Pharm Dev Technol. 2007;12(1):35–41. doi: 10.1080/10837450601166536. [DOI] [PubMed] [Google Scholar]
- 39.Philip VA, Mehta RC, DeLuca PP, Mazumder MK. E-SPART analysis of poly(D, L-lactide-co-glycolide) microspheres formulated for dry powder aerosols. Particulate Sci Technol. 1997;15:303–16. doi: 10.1080/02726359708906773. [DOI] [Google Scholar]
- 40.Ali M, Sharma R, Srirama PK, Mazumder MK. In-vitro studies of nebulizer aerosol particles deposition as a function of aerodynamic size and electrostatic charge in an anatomical throat cast. Presentation at the Frontiers in Aerosol Dosimetry Research Conference, Beckman Center of the National Academies, Irvine, California, USA, October 24–25, 2005.
- 41.International Standards Organization, Geneva, Switzerland, Particle size analysis—laser diffraction methods. ISO 13320; 2009.
- 42.Mitchell JP, Nagel MW, Nichols SC, Nerbrink O. Laser diffractometry as a technique for the rapid assessment of aerosol particle size from inhalers. J Aerosol Med. 2006;19(4):409–33. doi: 10.1089/jam.2006.19.409. [DOI] [PubMed] [Google Scholar]
- 43.Krarup HG, Bumiller M, Stauffer T. The Malvern Spraytec applied to pharmaceutical spray analysis. In: Dalby RN, Byron PR, Peart J, Farr SJ, editors. Respiratory drug delivery VIII. Raleigh: Davis Horwood International; 2002. pp. 505–8. [Google Scholar]
- 44.Kwong WTJ, Ho SL, Coates AL. Comparison of nebulized particle size distribution with Malvern laser diffraction analyzer versus Andersen cascade impactor and low-flow Marple personal cascade impactor. J. Aerosol Med. 2000;13(4):303–14. doi: 10.1089/jam.2000.13.303. [DOI] [PubMed] [Google Scholar]
- 45.Vecellio None L, Grimbert D, Becquemin MH, Boissinot E, LePape A, Lemarié E, Diot P. Validation of a laser diffraction method as a substitute for cascade impaction in the European project for a nebulizer standard. J Aerosol Med. 2001;14(1):107–14. doi: 10.1089/08942680152007954. [DOI] [PubMed] [Google Scholar]
- 46.Clark AR. The use of laser diffraction for the evaluation of the aerosol clouds generated by medical nebulizers. Int J Pharm. 1995;115:69–78. doi: 10.1016/0378-5173(94)00255-4. [DOI] [Google Scholar]
- 47.US Food and Drug Administration. 1993. CDRH reviewer guidance for nebulizers, metered dose inhalers, spacers and actuators. Rockville: FDA. http://www.fda.gov/MedicalDevices/DeviceRegulationandGuidance/GuidanceDocuments/ucm081282.htm. Accessed 4 Mar 2011.
- 48.European Medicines Agency (EMEA). Guideline on the pharmaceutical quality of inhalation and nasal products. 2006; EMEA/CHMP/QWP/49313/2005 Final. London, UK. http://www.ema.europa.eu/docs/en_GB/document_library/Scientific_guideline/2009/09/WC500003568.pdf. Accessed 4 Mar 2011.
- 49.US Food and Drug Administration. CDER draft guidance for industry: bioavailability and bioequivalence studies for nasal aerosols and nasal sprays for local action. Rockville: FDA. 2003. http://www.fda.gov/ohrms/dockets/ac/00/backgrd/3609b1l.pdf. Accessed 4 Mar 2011. [DOI] [PubMed]
- 50.Smart J, Berg E, Nerbrink O, Zuban R, Blakey D, New M. Touchspray™ technology: a comparison of the droplet size measured by cascade impaction and laser diffraction. In: Dalby RN, Byron PR, Peart J, Farr SJ, editors. Respiratory drug delivery VIII. Raleigh: Davis Horwood International; 2002. pp. 525–7. [Google Scholar]
- 51.Moslemi P, Najafabadi AR, Tajerzadeh H. Evaluations of different parameters that affect droplet size distribution of nasal gel sprays. In: Dalby RN, Byron PR, Peart J, Farr SJ, editors. Respiratory drug delivery VIII. Raleigh: Davis Horwood International; 2002. pp. 619–22. [Google Scholar]
- 52.De Boer AH, Gjaltema G, Witt W, Frijlink HW. The use of laser diffraction technique for the characterization of the aerosol cloud from inhalation devices. In: Dalby RN, Byron PR, Farr SJ, Peart J, editors. Respiratory drug delivery VII. Raleigh: Serentec; 2000. pp. 585–7. [Google Scholar]
- 53.Zeng X-M, MacRitchie HB, Marriott C, Martin GP. Correlation between inertial impaction and laser diffraction sizing data for aerosolized carrier-based dry powder formulations. Pharm Res. 2006;23(9):2200–9. doi: 10.1007/s11095-006-9055-9. [DOI] [PubMed] [Google Scholar]
- 54.Stevens S, Shrimpton J, Palmer M, Prime D, Johal B. Accuracy assessments for laser diffraction measurements of pharmaceutical lactose. Meas Sci Technol. 2007;18:3697–706. doi: 10.1088/0957-0233/18/12/004. [DOI] [Google Scholar]
- 55.Etzler FM, Deanne R. Particle size analysis: a comparison of various methods. Part Part Syst Char. 1997;14:278–82. doi: 10.1002/ppsc.19970140604. [DOI] [Google Scholar]
- 56.Gebhart J. Optical-direct reading techniques: light intensity systems. In: Baron PA, Willeke K, editors. Aerosol measurement: principles, techniques, and applications. New York: Wiley; 2001. pp. 313–44. [Google Scholar]
- 57.Mitchell J, Ashcroft J, Fromentin A, Holmes R, Marsault P, McAughey JJ, et al. Laboratory intercomparison of Polytec optical aerosol analyzers. In: Masuda S, Takahashi K, et al., editors. Proc. 3rd Int. Aerosol Conf. Kyoto, Japan. Oxford: Pergamon; 1990. pp. 643–6. [Google Scholar]
- 58.Umhauer H. Particle size distribution analysis by scattered light measurements using an optically defined measuring volume. J Aerosol Sci. 1983;14:765–70. doi: 10.1016/0021-8502(83)90060-5. [DOI] [Google Scholar]
- 59.Jaenicke R. The optical particle counter: cross-sensitivity and coincidence. J Aerosol Sci. 1972;3(2):95–111. doi: 10.1016/0021-8502(72)90147-4. [DOI] [Google Scholar]
- 60.Rader DJ, O’Hern TJ. Optical direct-reading techniques: in situ sensing. In: Willeke K, Baron PA, editors. Aerosol measurement: principles, techniques and applications. New York: Van Nostrand Reinhold; 1993. pp. 345–80. [Google Scholar]
- 61.Mitchell JP, Nichols AL, Van Santen A. The characterisation of water-droplet aerosols by polytec optical particle analysers. Part Part Syst Charact. 1989;6:119–23. doi: 10.1002/ppsc.19890060120. [DOI] [Google Scholar]
- 62.Loffert DT, Ikle D, Nelson HS. A comparison of commercial jet nebulizers. Chest. 1994;106:1788–92. doi: 10.1378/chest.106.6.1788. [DOI] [PubMed] [Google Scholar]
- 63.Jaeger R, Schmidt M, Weiss M. Inhalation aerosol spectrometry (INAS®) for the real-time evaluation of particle size distribution and inhaled drug concentration in therapeutic and toxicologic research. In: Dalby RN, Byron PR, Peart J, Suman JD, Farr SJ, Young PM, editors. Respiratory drug delivery—2010. River Grove: Davis Healthcare Int.; 2010. pp. 489–93. [Google Scholar]
- 64.Farmer WM. Measurement of particle size, number density and velocity using a laser interferometer. Appl Optics. 1972;11:2603–12. doi: 10.1364/AO.11.002603. [DOI] [PubMed] [Google Scholar]
- 65.Negus CR, Drain LE. Mie calculations of the scattered light from a spherical particle traversing a fringe system produced by two intersecting laser beams. J Phys D: Applied Physics. 1982;15:375–402. doi: 10.1088/0022-3727/15/3/003. [DOI] [Google Scholar]
- 66.Bachalo WD, Hauser MJ. Phase/Doppler spray analyzer for simultaneous measurements of drop size and velocity distributions. Opt Eng. 1984;23(5):583–90. [Google Scholar]
- 67.Stapleton KW, Finlay WH, Zuberbuhler P. An in-vitro method for determining regional dosages delivered by jet nebulizers. J Aerosol Med. 1994;7:325–44. doi: 10.1089/jam.1994.7.325. [DOI] [PubMed] [Google Scholar]
- 68.Dunbar CA, Watkins AP, Miller JF. An experimental investigation of the spray issued from a pMDI using laser diagnostic techniques. J Aerosol Med. 1997;10(4):351–68. doi: 10.1089/jam.1997.10.351. [DOI] [PubMed] [Google Scholar]
- 69.Kakade PP, Versteeg HK, Hargrave GK, Genova P, Williams RC, Deaton D. Design optimization of a novel pMDI actuator for systemic drug delivery. J Aerosol Med. 2007;20(4):460–74. doi: 10.1089/jam.2007.0595. [DOI] [PubMed] [Google Scholar]
- 70.Ranucci JA, Chen FC. Phase Doppler anemometry: a technique for determining aerosol plume-particle size and velocity. Pharm Technol. 1993;17:62. [Google Scholar]
- 71.Corcoran TE, Hitron R, Humphrey W, Chigier N. Optical measurement of nebulizer sprays: a quantitative comparison of diffraction, phase Doppler interferometry, and time of flight techniques. J Aerosol Sci. 2000;31(1):35–50. doi: 10.1016/S0021-8502(99)00030-0. [DOI] [Google Scholar]
- 72.US Food and Drug Administration . CDER guidance for industry: nasal spray and inhalation solution, suspension and spray drug products—chemistry, manufacturing and controls documentation. Rockville: FDA; 2002. [Google Scholar]
- 73.ISO 13322-1 . Particle size analysis—image analysis methods—part 1: static image analysis methods. Geneva: International Standards Organization; 2004. [Google Scholar]
- 74.ISO 13322-2 . Particle size analysis—image analysis methods—part 2: dynamic image analysis methods. Geneva: International Standards Organization; 2006. [Google Scholar]
- 75.McCrone WC, Delly JG. The particle atlas: volume 1, principles and techniques. Chicago: McCrone Research Institute; 1992. [Google Scholar]
- 76.Bradbury S. Basic measurement techniques for light microscopy, microscopy handbook 23. Oxford: Royal Microscopy Society, Oxford University Press; 1991. [Google Scholar]
- 77.Chambers F, Ali A, Mitchell J, Shelton C, Nichols S. Cascade impactor (CI) mensuration—an assessment of the accuracy and precision of commercially available optical measurement systems. AAPS PharmSciTechnol. 2010;11(1):472–84. doi: 10.1208/s12249-010-9405-0. [DOI] [PMC free article] [PubMed] [Google Scholar]
- 78.Raula J, Lähde A, Kauppinen EI. Aerosolization behavior of carrier-free L-leucine coated salbutamol sulphate powders. Int J Pharm. 2009;365:18–25. doi: 10.1016/j.ijpharm.2008.08.017. [DOI] [PubMed] [Google Scholar]
- 79.Dalby RN, Tiano SL, Hickey AJ. Medical devices for the delivery of therapeutic aerosols to the lungs. In: Hickey AJ, editor. Inhalation aerosols: physical and biological basis for therapy. New York: Informa Healthcare; 2007. pp. 417–44. [Google Scholar]
- 80.Kidder LH, Haber KS, Dubois J, Lewis EN. An analysis of agglomeration: morphologically directed Raman microscopy to characterize a dry powder inhaler. In: Dalby RN, Byron PR, Peart J, Suman JD, Farr SJ, Young PM, editors. Respiratory drug delivery—2010. River Grove: Davis Healthcare Int.; 2010. pp. 633–5. [Google Scholar]
- 81.Shekounov BY, Chattopadhyay P, Tong HHY, Chow AHL. Particle size analysis in pharmaceutics: principles, methods and applications. Pharm Res. 2007;24(2):203–27. doi: 10.1007/s11095-006-9146-7. [DOI] [PubMed] [Google Scholar]
- 82.Priore RJ, Olkhovyk O, Klueva O, Fuhrman M. Automation of ingredient-specific particle sizing employing Raman chemical imaging. In: Dalby RN, Byron PR, Peart J, Suman JD, Young PM, editors. Respiratory drug delivery Europe 2009. River Grove: Davis Healthcare Int.; 2009. pp. 275–8. [Google Scholar]
- 83.Getting to know Advair. ChemImage Pharma Focus: February Issue 2010. http://www.chemimage.com/news/newsletter/pharma_focus/feb2010.aspx. Accessed 4 Mar 2011.
- 84.Sasic S, Harding L. Global illumination Raman chemical imaging of a combination dry powder formulation. In: Dalby RN, Byron PR, Peart J, Suman JD, Farr SJ, Young PM, editors. Respiratory drug delivery—2010. River Grove: Davis Healthcare Int.; 2010. pp. 729–32. [Google Scholar]
- 85.Valet O, Lankers M, Adi H, Traini D. Young PM. In: Dalby RN, Byron PR, Peart J, Suman JD, Farr SJ, Young PM, editors. Respiratory drug delivery—2010. River Grove: Davis Healthcare Int.; 2010. pp. 763–6. [Google Scholar]
- 86.Priore RJ, Klueva O, Olkhovyk O, Fuhrman M. Ingredient-specific particle sizing of Combivent® metered dose inhaler. In: Dalby RN, Byron PR, Peart J, Suman JD, Farr SJ, Young PM, editors. Respiratory drug delivery—2010. River Grove: Davis Healthcare Int.; 2010. pp. 499–502. [Google Scholar]
- 87.Doub W, Adams WP, Spencer JA, Buhse LF, Nelson MP, Treado PJ. Raman chemical imaging for ingredient-specific particle size characterization of aqueous suspension nasal spray formulations: a progress report. Pharm Res. 2007;24(5):934–45. doi: 10.1007/s11095-006-9211-2. [DOI] [PubMed] [Google Scholar]
- 88.US Pharmacopeia . <429> Light diffraction measurement of particle size. USP33, NF28. Rockville: US Pharmacopeial Convention; 2003. [Google Scholar]
- 89.US Pharmacopeia. In-process revision to Chapter <601> Aerosols, Nasal Sprays, Metered-Dose Inhalers, and Dry Powder Inhalers. Pharm.Forum. 2011;37(4). http://www.usppf.com/pf/pub/data/v374/CHA_IPR_374_c601.xml. Accessed 18 July 2011.
- 90.European Directorate for Quality in Medicines and Healthcare (EDQM) Preparations for nebulisation: characterisation, general chapter 2.9.44. Pharmeuropa. 2006;18(2):280–2. [Google Scholar]
- 91.United States Pharmacopeial Convention In process revision. <1601> Products for nebulization—characterization tests. Pharm Forum. 2010;36(2):534–9. [Google Scholar]
- 92.United States Pharmacopeia . <776> Optical microscopy. USP33, NF28. Rockville: US Pharmacopeial Convention; 2009. [Google Scholar]
- 93.United States Pharmacopeia . <1181> Scanning electron microscopy. USP33, NF28. Rockville: US Pharmacopeial Convention; 2009. [Google Scholar]


