Abstract
The aim of this study was to investigate the influence of experimental conditions on levothyroxine sodium release from two immediate-release tablet formulations which narrowly passed the standard requirements for bioequivalence studies. The in vivo study was conducted as randomised, single-dose, two-way cross-over pharmacokinetic study in 24 healthy subjects. The in vitro study was performed using various dissolution media, and obtained dissolution profiles were compared using the similarity factor value. Drug solubility in different media was also determined. The in vivo results showed narrowly passing bioequivalence. Considering that levothyroxine sodium is classified as Class III drug according to the Biopharmaceutics Classification System, drug bioavailability will be less sensitive to the variation in its dissolution characteristics and it can be assumed that the differences observed in vitro in some of investigated media probably do not have significant influence on the absorption process, as long as rapid and complete dissolution exists. The study results indicate that the current regulatory criteria for the value of similarity factor in comparative dissolution testing, as well as request for very rapid dissolution (more than 85% of drug dissolved in 15 min), are very restricted for immediate-release dosage forms containing highly soluble drug substance and need further investigation. The obtained results also add to the existing debate on the appropriateness of the current bioequivalence standards for levothyroxine sodium products.
KEY WORDS: bioequivalence, dissolution, immediate release, levothyroxine sodium, solubility
INTRODUCTION
Levothyroxine sodium (L-Na) is a drug used as the replacement therapy in primary hypothyroidism (1). It is commercially available from a number of sources, but therapeutic equivalence and interchangeability of various brands remain questionable even if bioequivalence is proven (2). One of the main obstacles for determining L-Na products bioequivalence is that exogenous levothyroxine cannot be distinguished from the endogenously produced hormone. Current European Medicines Agency guideline for drug bioequivalence studies states that for endogenous substances, the sampling schedule should allow characterization of the endogenous baseline profile for each subject in each period (3). Often, a baseline is determined from two to three samples taken before the drug products are administered. The pharmacokinetic evaluation should be performed using baseline correction so that the calculated pharmacokinetic parameters refer to the additional concentrations provided by the treatment. Administration of supra-therapeutic doses can be considered in bioequivalence studies of endogenous drugs, provided that the dose is well tolerated, so that the exogenous concentrations over baseline provided by the treatment may be reliably determined. Rarely, baseline correction may not be needed if substantial increases over baseline endogenous levels are obtained (4). The Food and Drug Administration (FDA) issued the guidance for in vivo pharmacokinetic and bioavailability studies and in vitro dissolution testing of L-Na tablets in 2000 (5). However, the adequacy of the proposed bioequivalence standards for levothyroxine products has been discussed in a number of reports (6–8). The limitations refer to the fact that: (1) levothyroxine is endogenous substance and the administered drug is not the only source of the hormone measured; (2) its concentration is regulated by the dynamic feedback system via the hypothalamic–pituitary–thyroid gland axis; (3) lack of sensitivity of the analytical techniques available and (4) the need for high dose administration associated with the inherent risk for the development of adverse reactions.
There are also reports indicating that therapeutic inequivalence of L-Na products resulted from an inadequate drug content and/or dissolution from the dosage form; it has been observed that the therapeutic failures resulting from the generic levothyroxine product administration were caused by its content being 25–30% less than that of labelled drug (9–11). Being an extremely low-dose drug, levothyroxine tablets were reported to exhibit lot-to-lot content variability because of poor homogenisation. Consequently, a more tightened potency range has been recently approved by the FDA (12).
L-Na is an amphoteric molecule with three pKa values: 2.2, 6.7 and 10.1 (13). Solubility of L-Na is pH dependent, and the reported solubility of L-Na in water at 25°C is 0.15 mg/mL (14,15). There are no literature data for the pH-solubility profile of L-Na at 37°C in aqueous media important for the Biopharmaceutics Classification System (BCS) class determination, but it can be found in several works that L-Na is classified as Class III—high-solubility and low-permeability drug (16,17). In accordance with the concept of the BCS, there are regulatory guidelines recommending that in certain situations, similarity of in vitro dissolution profiles demonstrated in three different pH media could be used as the in vitro surrogate for the in vivo bioequivalence testing of BCS Class I and Class III drugs (3,18,19). Thus, the use of reliable and discriminatory dissolution test is of major importance. Interestingly, shortly after the revision of bioequivalence requirements, also the United States Pharmacopoeia (USP) dissolution specification for levothyroxine sodium tablets was revised in 2002: previously used USP phosphate buffer pH 7.4 was substituted by 0.01 M HCl with 0.2% sodium lauryl sulphate (SLS), and the recommended paddle rotation speed was altered from 100 to 50 rpm (20,21). The USP 32 gives more flexible recommendations involving the use of both 50 and/or 75 rpm paddle speed, 0.01 M HCl with or without surfactant and either 500 or 900 mL media, depending on the drug dosage (22).
The aim of the present study was to evaluate the effect of various experimental conditions on levothyroxine release from two drug products which passed the standard requirements for the bioequivalence study. In order to give an improvement in the biopharmaceutical characterization of this drug, the pH-solubility profile of L-Na at 37°C, obtained in aqueous media over the pH range of 1.2–7.4 is also presented in this study.
MATERIALS AND METHODS
Materials
Two immediate-release tablet formulations, containing 100 μg of L-Na, were evaluated throughout the study. Test formulation was Tivoral® tablets (Galenika ad., Serbia, batch 2696, expiry date September 2011) and the reference formulation was Euthyrox® tablets (Merck, Germany, batch 5543502, expiry date December 2010). L-Na drug substance was obtained from Peptido GmbH, Germany.
Drug release media and buffers for solubility determination were prepared using potassium chloride (JT Baker, The Netherlands), hydrochloric acid (Merck), glacial acetic acid (Merck), potassium dihydrogenphosphate (JT Baker), sodium acetate (JT Baker), sodium hydroxide (Merck) and sodium lauryl sulphate (Sigma, USA). All chemicals used in HPLC analysis were analytical or HPLC reagent grade.
In Vivo Study
Patients and Study Design
The in vivo study was designed as an open-label, randomised, single-dose, two-way cross-over bioequivalence study performed on 24 healthy subjects of both genders. A total of 22 subjects completed the study. Their ages ranged from 24 to 56 years (33.33 ± 9.70; mean ± SD) and their body mass index from 19.53 to 33.46 kg/m2 (24.59 ± 3.73; mean ± SD). Two subjects decided not to continue the study due to headache just after the drug administration in the first period of the study. The study was performed in accordance with the principles enunciated in the Declaration of Helsinki (Edinburgh 2000) and the ICH harmonised tripartite guideline regarding Good Clinical Practice (23). The protocol was approved by the Ethics Review Board. All subjects gave consent to participate in the study by signing the informed consent form. In each period of the study, subjects were housed from the 12-h pre-drug administration till the 12-h blood sampling. The reference and the test drugs were given in a single oral dose of 600 μg (six 100 μg tablets), according to the randomization list, with the washout period of 35 days. The tablets were given under fasting conditions, orally, with 240 mL of water. Blood samples were taken at the following intervals: 30 min, 15 min and immediately before dosing, 0.33, 0.67, 1, 1.33, 1.67, 2, 2.5, 3, 4, 6, 9, 12, 24 and 48 h after dosing.
Analytical Method
The serum concentrations of levothyroxine and triiodothyronine were determined through the use of commercial chemiluminescent competitive immunoassay (Immulite 2000 Total T4 and Immulite 2000 Total T3, Siemens Medical Solutions Diagnostics, Los Angeles, CA, USA). The calibration ranges for the measurement of levothyroxine and triiodothyronine were 10 to 240 ng/mL and 0.4 to 6.0 ng/mL, respectively. The intra-assay coefficients of variation (CVs) for two levothyroxine quality control samples (theoretical concentration of 82.4 and 124 ng/mL) were 4.2% and 8.0%, respectively. The corresponding inter-assay CVs were 5.0% and 5.5%. The intra-assay CVs for two triiodothyronine quality control samples (theoretical concentration of 1.6 and 3.4 ng/mL) were 4.9% and 5.3%, respectively, while the inter-assay CVs were 5.6% and 6.9%. The analytical sensitivity for levothyroxine was 3.0 ng/mL and for triiodothyronine was 0.2 ng/mL.
Pharmacokinetic and Statistical Analysis
Pharmacokinetic analysis was performed according to the requirements for bioequivalence studies (3). Differences between the obtained and the pre-dose concentrations (the average value of the first three samples) for each subject, sampling time and formulation were used as a basis for the calculations of the main pharmacokinetic parameters and statistical analysis. As the level of levothyroxine started to rise in about half of the subjects as a consequence of the physiological response, the time limit for the analysis was 9 h post-administration. The following parameters were derived from the serum concentrations time profiles: the area under the serum concentration vs. time curve up to sampling time (AUC0–t), the area under the serum concentration vs. time curve to infinity (AUC0–∞), the maximum serum concentration (Cmax), the time at which the maximum serum concentration is attained (Tmax), the half time of elimination (T1/2) and the elimination rate constant (Kel). The Cmax and Tmax were determined from the concentration–time profile. The AUC0–t was calculated using the trapezoidal rule from point 0 up to 9 h. The AUC0–∞ was calculated from the equation: AUC0–∞ = AUC0–t + Cn/Kel, where Cn is the last serum sample concentration, and T1/2 was calculated from the equation T1/2 = ln2/Kel. The bioavailability comparison was carried out on AUC0–t, AUC0–∞ and Cmax (primary pharmacokinetic parameters). The bioequivalence acceptance interval was set to 80–125% as justified in the protocol of the study. The 90% confidence intervals (CI) for the ratio between drug formulations least squares means were derived from the analyses of the log-transformed parameters AUC0–t, AUC0–∞ and Cmax. All pharmacokinetic and statistical analyses were performed using the EquivTest 2.0 statistical programme.
Solubility Measurement
The solubility of L-Na was determined in USP hydrochloric acid buffer pH 1.2, USP acetate buffers pH 4.5 and pH 5.5 and USP phosphate buffers pH 6.8 and pH 7.4. An excess of L-Na drug substance was added into 10 mL of the medium in glass vials. The sealed vials were shaken continuously for 24 h in shaking water bath (Haake, Germany) at 37 ± 1°C and then stored for a further 24 h without agitation. In each case, sediment on the bottom of the vial was observed and separated by centrifugation. The supernatants were filtered through the glass microfiber filters (Macherey-Nagel, Germany). The L-Na concentration in the saturated solution was determined by HPLC analysis.
In Vitro Study
The dissolution tests were performed with both test and reference formulations that had been used in the bioequivalence study. The studies were conducted using rotating paddle and rotating basket method (Erweka DT 80, Germany). The following media were used: USP hydrochloric acid buffer pH 1.2, USP acetate buffer pH 4.5 and USP phosphate buffer pH 6.8. The medium volume used was 500 mL. The rotating speed was 100 rpm in the rotating basket apparatus, 50 rpm and 75 rpm in the rotating paddle apparatus. The influence of agitation intensity was tested in pH 6.8 dissolution medium. The dissolution tests were also carried out according to the USP 32 monograph for L-Na tablets (22), with 50 rpm rotating paddle apparatus and 500 mL of 0.01 M HCl with 0.2% SLS and according to the USP 24 monograph for L-Na tablets (20), with 100 rpm rotating paddle apparatus and 500 mL of phosphate buffer pH 7.4. All tests were performed with 12 tablets of each formulation, and the results presented here are their mean values. The 15.0-mL aliquots were withdrawn at 10, 15, 20, 30, 45 and 60 min from the beginning of the tests and replaced with the same volume of the fresh medium.
Analytical Method
The percent of L-Na dissolved in samples was determined by HPLC analysis with an HP1100 chromatograph (Agilent Technologies, Palo Alto, CA, USA) equipped with HP1100 binary pump, UV–visible detector and autosampler. Data were acquired with Agilent Chemstation software. The determinations were done on Zorbax SB-C18 analytical column (250 × 4.6 mm, macropore size 5 μm). The mobile phase was a mixture of 0.34% (m/v) tetrabutylammonium hydrogen sulphate aqueous solution and acetonitrile, starting with 35% of acetonitrile for the first 10 min and with the flow rate 1.0 mL/min and then increasing acetonitrile level to 70% till the end of analysis. The wavelength of the detector was set to 225 nm. The injection volume was 100 μL. The method was linear over L-Na concentration range of 0.10–0.31 μg/mL, and the coefficient of correlation was 0.995%. RSD values for intra-day and for inter-day precision were less than 2%.
The L-Na release profiles obtained in vitro in various test conditions were compared according to the similarity factor value (f2) (24).
RESULTS
In Vivo Study
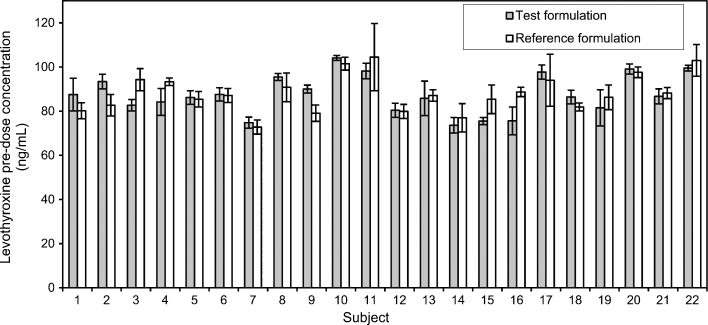
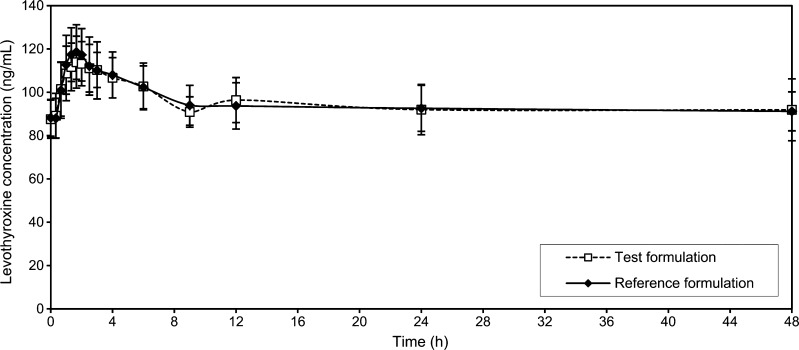
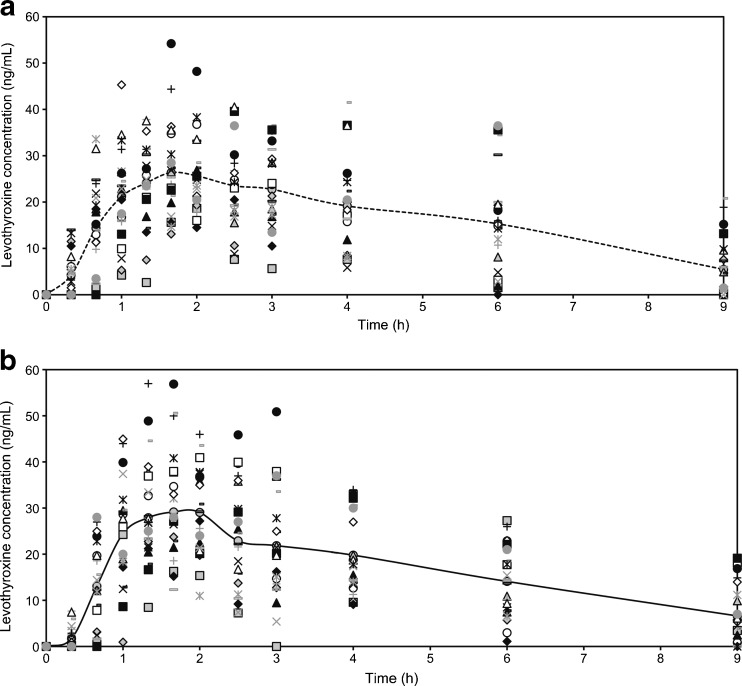
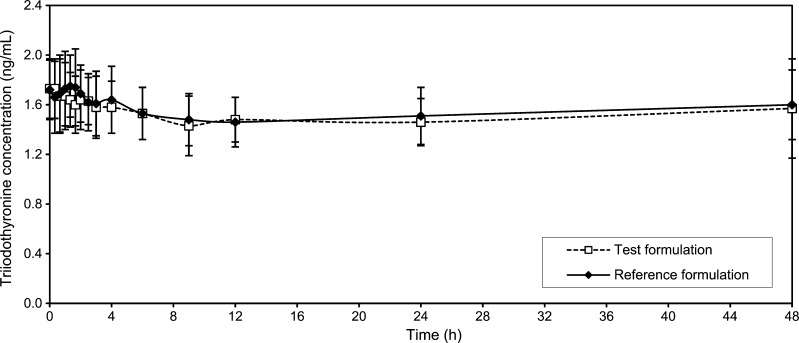
The mean values of the levothyroxine serum concentration in blood samples taken 30 min, 15 min and immediately before drug administration were considered in the study as pre-dose level of levothyroxine (Fig. 1). Mean levothyroxine serum concentrations vs. time without adjustment for baseline levels of endogenous levothyroxine are shown in Fig. 2, while individual levothyroxine concentrations with baseline correction can be seen in Fig. 3. Table I shows levothyroxine pharmacokinetic parameters after administration of the test and the reference formulations. Calculation of pharmacokinetic parameters and statistical analysis were performed using values obtained as difference between the obtained concentration of levothyroxine at the time point and pre-dose level of levothyroxine, due to the reason that the measured level was the result of sum of endogenous and exogenous levothyroxine levels. The calculations of the log-transformed data of the main pharmacokinetic parameters AUC0–t, AUC0–∞ and Cmax, as well as statistical testing of the differences between them according to analysis of variance test (ANOVA), showed that there were no significant differences in those parameters (Table II). The study also showed no differences in concentrations of triiodothyronine after administration of levothyroxine (Fig. 4); the maximum triiodothyronine levels obtained after administration of the test and the reference formulations were 1.86 ± 0.24 and 1.87 ± 0.22 ng/mL, respectively.
Fig. 1.
The pre-dose level of levothyroxine in subjects before administration of the test formulation (grey bar) and the reference formulation (white bar). Data are mean ± SD (n = 3)
Fig. 2.
Mean levothyroxine concentration (±SD)–time profiles after administration of six 100-μg tablets of the test and the reference formulations uncorrected for endogenous levothyroxine baseline level
Fig. 3.
Individual levothyroxine concentration–time profiles, corrected for the endogenous levothyroxine baseline level: a after the test drug administration and b after the reference drug administration
Table I.
Descriptive Statistical Analysis of the Pharmacokinetic Parameters for the Test and the Reference Formulations
| Parameter | Test formulation | Reference formulation | ||
|---|---|---|---|---|
| ±SD | CV (%) | ±SD | CV (%) | |
| AUC0–t (ngh/mL) | 140 ± 64.6 (40.5–271) | 46.2 | 145 ± 58.9 (64.7–265) | 40.6 |
| AUC0–∞ (ngh/mL) | 188 ± 103 (42.4–422) | 54.5 | 194 ± 95.8 (66.6–372) | 49.4 |
| C max (ng/mL) | 33.2 ± 9.17 (18.6–54.2) | 27.6 | 36.2 ± 6.95 (23.3–57.0) | 26.6 |
| T max (h) | 1.96 ± 0.820 (0.670–4.00) | 41.8 | 1.99 ± 1.18 (1.00–6.00) | 59.1 |
| K el (1/h) | 0.29 ± 0.17 (0.10–0.70) | 58.4 | 0.27 ± 0.18 (0.10–0.72) | 65.3 |
| T 1/2 (h) | 3.12 ± 1.49 (0.990–6.73) | 47.6 | 3.44 ± 1.66 (0.960–6.98) | 48.3 |
AUC the area under the serum concentration vs. time curve, C max the maximum serum concentration, T max the time of maximum concentration, K el the elimination rate constant, T 1/2 the half time of elimination, SD the standard deviation, CV the coefficient of variation
Table II.
The 90% Confidence Intervals for the Levothyroxine Treatment
| AUC0–t (ngh/mL) | AUC0–∞ (ngh/mL) | C max (ng/mL) | |
|---|---|---|---|
| Point estimate | 0.932 | 0.938 | 0.921 |
| Lower limit | 0.801 | 0.800 | 0.847 |
| Upper limit | 1.09 | 1.16 | 1.00 |
| Bioequivalency | BE | BE | BE |
AUC the area under the serum concentration vs. time curve, C max the maximum serum concentration, BE bioequivalence
Fig. 4.
Mean triiodothyronine concentration (±SD)–time profiles after administration of six 100-μg tablets of the test and the reference formulations
Solubility Studies
The drug equilibrium solubility results (Table III) indicate that L-Na solubility decreases with an increase in pH, goes through a minimum at around pH 4–5 and increases again with further increase in pH. The dose/solubility ratios, calculated using solubility value at each pH for the three doses of L-Na, show that L-Na fails to meet the dose/solubility ratio criterion of below 250 ml for drug substance to be classified as highly soluble only for the 600 μg dose between pH 4.5 and pH 6.8 (3,18).
Table III.
Solubility and Dose/Solubility Ratio at 37°C of the Three Strengths of Levothyroxine sodium in Different Media
| pH | Solubility (μg/ml) | Dose (μg) | ||
|---|---|---|---|---|
| 100 | 150 | 600 | ||
| Dose/solubility ratio | ||||
| pH 1.2 | 7.10 | 14.1 | 21.1 | 84.5 |
| pH 4.5 | 0.92 | 108.7 | 163.0 | 652.2 |
| pH 5.5 | 0.94 | 106.4 | 159.6 | 638.3 |
| pH 6.8 | 1.90 | 52.6 | 78.9 | 315.8 |
| pH 7.4 | 2.80 | 35.7 | 53.6 | 214.3 |
In Vitro Study
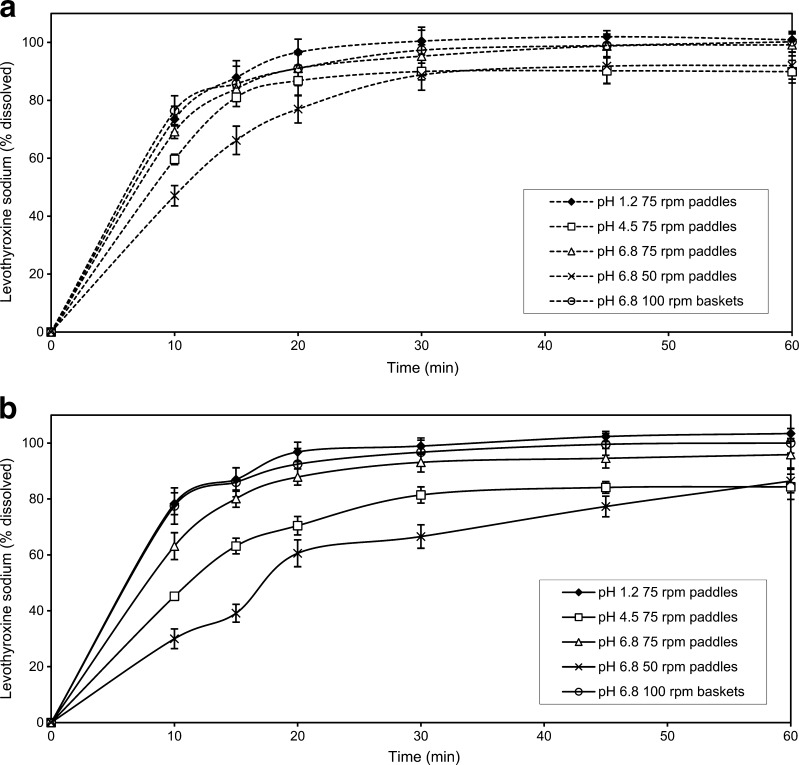
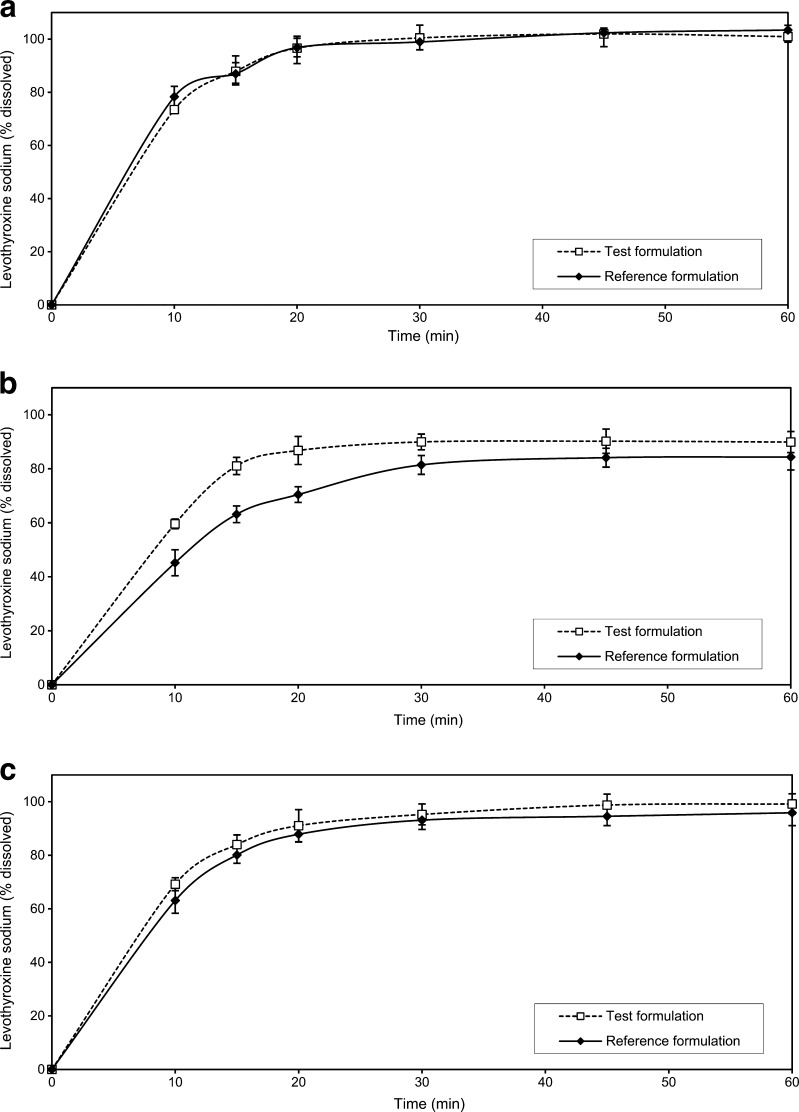
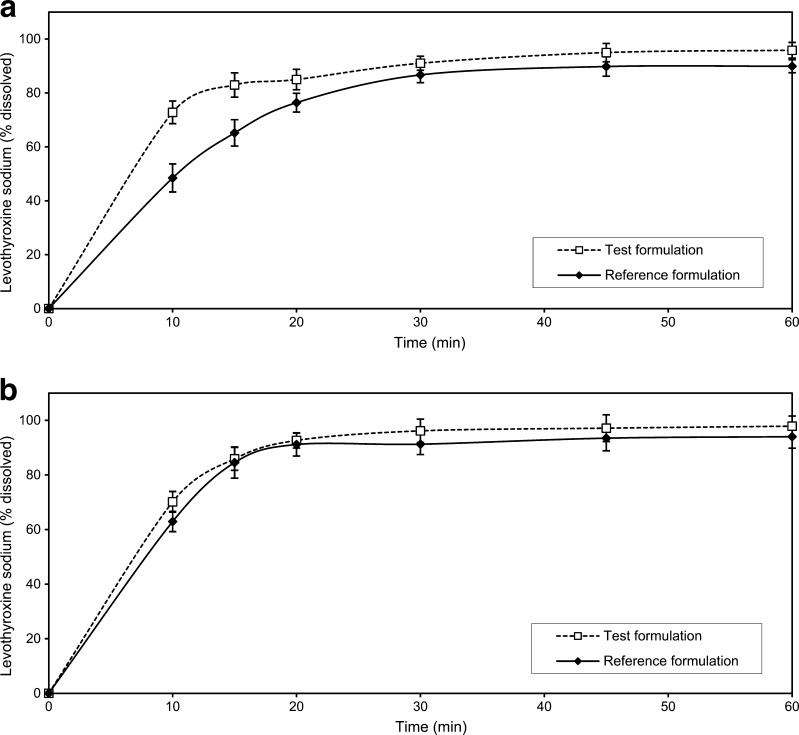
The dissolution profiles of the investigated formulations obtained under various experimental conditions are presented in Fig. 5a, b. For both drug formulations, the fastest dissolution was obtained in pH 1.2 medium, using the rotating paddle apparatus at 75 rpm. The slowest drug dissolution was observed in the phosphate buffer pH 6.8, using the rotating paddle apparatus at 50 rpm. Comparative dissolution data for the test and the reference formulations in media with different pH values, as well as under the compendially recommended experimental conditions given in the USP 24 (old method) and in the USP 32 (new method), are given in Figs. 6 and 7. Relevant similarity factor (f2) values are given in Table IV.
Fig. 5.
The influence of experimental conditions on L-Na dissolution from tablets: a test formulation and b reference formulation. Data are mean ± SD (n = 12)
Fig. 6.
Comparative dissolution data of the test and the reference formulations in: a hydrochloric acid buffer pH 1.2, b acetate buffer pH 4.5 and c phosphate buffer pH 6.8. Data are mean ± SD (n = 12)
Fig. 7.
Comparative dissolution data of the test and reference formulations in: a phosphate buffer pH 7.4 at paddle rotation speed of 100 rpm (old USP method), b 0.01 M HCl with 0.2% SLS at paddle rotation speed of 50 rpm (actual USP method). Data are mean ± SD (n = 12)
Table IV.
Similarity Factor Values
| Media | f 2 |
|---|---|
| pH 1.2 | NA |
| pH 4.5 | 45.2 |
| pH 6.8 | 66.6 |
| USP 24 | 40.1 |
| USP 32 | 67.6 |
f 2 the similarity factor, NA not applicable (very rapid drug dissolution)
DISCUSSION
In Vivo Study
This bioequivalence study was conducted in accordance with the current bioequivalence guidelines (3,5). After oral administration of both formulations under fasting conditions, levothyroxine underwent rapid absorption from the gastrointestinal tract. The highest concentration both for the test and the reference formulations was observed in the majority of subjects 1.66 h after administration. The activation of the strong physiological feedback system which regulates the secretion of the endogenous levothyroxine was seen about 9 h after drug administration: levothyroxine values began to rise. Therefore, in the pharmacokinetic and statistical analysis, only first 9 h was taken into account because only during this time period, the levels of levothyroxine corresponded to the administered formulation (Fig. 3). The serum concentrations of triiodothyronine, the main active metabolite of levothyroxine (25), after administration of the test formulation were comparable to those obtained after administration of the reference product and did not show significant statistical differences. Taking into consideration the baseline level of levothyroxine in the pharmacokinetic and statistical analysis and correcting the observed values with its pre-dose level are discussed by many authors (4,6,26). The endogenous levels of levothyroxine in our subjects were variable and higher than presented in the bioequivalence study of Di Girolamo et al. (26). The closer the baseline level to the total concentration of levothyroxine, the greater its influence on the estimation of bioequivalence. The relatively high baseline level of levothyroxine observed in our study could cover the differences between studied formulations, so correcting for baseline improved the sensitivity of bioequivalence assessment. Eventually, it might be possible to explore by means of population pharmacokinetics the influence of the baseline level of levothyroxine on the kinetic parameters in order to choose subjects with lower, but still physiological, endogenous levels. This will also result with fewer adverse reactions. The FDA-recommended dose of 600 μg for levothyroxine bioequivalence studies is much higher than therapeutic dose, but it is recommended due to the opinion that lower doses, with relatively high baseline levels, result in greater variation and difficulties in proving bioequivalence (4). The observed Cmax values in our study were similar to those presented in other bioequivalence studies for L-Na tablets (26,27). The 90% CI for the log-transformed main pharmacokinetic parameters passed the standard requirements for bioequivalence studies, but it was on the lower limit of acceptability for AUC0–t and AUC0–∞. The bioequivalence was demonstrated in 22 healthy subjects (two subjects did not complete the study), which is in accordance with the previously published report by Dong et al., who also showed bioequivalence between generic and brand-name L-Na products in a group of 22 euthyroid individuals (28). Although the FDA defines L-Na as Narrow Therapeutic Index (NTI) drug, the acceptance interval remains the same like for non-NTI drugs and there is no recommendation for its narrowing (5). The question of levothyroxine being an NTI drug is controversial (29). In the clinical practice, it is perceived as NTI drug. The secretion of levothyroxine is precisely regulated through the physiological feedback system, and it shows great interindividual variability; the substitution therapy can easily cause a problem and bring patient to hyperthyreotic or hypothyreotic condition. That is why it must be correctly dosed and monitored in order to achieve the positive outcome. On the other hand, L-Na does not fit the NTI drug definition as a drug where the ratio of the lowest concentration at which clinical toxicity occurs, to the median concentration providing a therapeutic effect, is less than or equal to 2 (30). The recommended use of such large dose in the bioequivalence study, much larger than used clinically, cannot be considered safe for one NTI drug. So, until the controversy about L-Na designation as NTI drug is solved, the standard criteria for bioequivalence assessment should be used. It is obvious that a further research in the field of design of a study for investigating bioequivalence of L-Na formulations needs to be done in the future. This standard average bioequivalence method could be substituted with the scaled average bioequivalence approach; the bioequivalence limits could be adjusted by scaling to the within-subject variability of the reference product in the study (31,32).
Solubility Studies
The drug equilibrium solubility of L-Na between pH 4.5 and 6.8 indicates that it does not meet the current BCS criteria for high-solubility drug only for the 600-μg dose. Such a large dose of L-Na, recommended for the use in the bioequivalence studies for L-Na tablets, will never be used clinically. The average full replacement dose of L-Na is 100–150 μg/daily for adult person, and larger doses are seldom required (25). For those doses, L-Na meets the criterion for highly soluble drug.
In Vitro Study
The Influence of Experimental Conditions on Dissolution Test Results
Due to the chemical structure of L-Na and the presence of two acidic and one basic group, pH value can have an impact on the solubility of this substance and, consequently, on drug dissolution from tablets. Dissolution profiles obtained in various pH media were indicative of this effect. The highest dissolution rate and complete release was achieved in pH 1.2 medium for both the test and the reference formulations, with more than 85% of L-Na dissolved for 15 min. In the acetate buffer pH 4.5, the amounts of drug released were the lowest for both formulations, due to the lower L-Na solubility in the pH range 4–5. In the phosphate buffer pH 6.8, drug dissolution increased, resulting in more than 85% of L-Na dissolved from both formulations in the time interval from 15 to 20 min. Differences between dissolution profiles obtained in different media were notable at the early time points (i.e. 10 and 15 min).
The intensity of agitation and the nature of the stirrer affect hydrodynamics of the complex dissolution system (33). Low rotational speeds affect the reproducibility of the hydrodynamics; on the other hand, high rotating speed may cause turbulence. The influence of agitation intensity on drug dissolution was particularly pronounced in the case of the reference formulation where the lower rotating speeds resulted in slow and incomplete drug dissolution. It can be seen that dissolution profiles of the test formulation were slightly faster than those of the reference and, in spite of certain differences, less affected by the experimental conditions applied (Fig. 5). In all investigated cases, L-Na dissolution from the test formulation was rapid, resulting in more than 85% dissolved in 30 min. Drug dissolution profiles from the reference formulation were more diverse, indicating that both media composition and agitation intensity may influence. This is in accordance with the results reported by Pabla et al. who showed that dissolution of the generic formulation was less susceptible to the media pH when compared to the reference drug (34).
Comparative Dissolution Testing
It is not unusual that dissolution test conditions and requirements given in pharmacopoeias and regulatory guidelines are not adequate for estimating correlation between the in vitro and in vivo drug behaviour. Some differences observed in vitro may be over discriminatory and may not reflect the in vivo drug availability; on the other side, some tests may be under discriminatory and may hide important facts. According to the current regulatory guidelines (3,18), in certain cases, the in vitro dissolution testing might serve as a surrogate for the in vivo bioequivalence studies if comparative dissolution profiles gathered at three different pH values are shown to be similar. In the present study, similarity of dissolution profiles for the investigated formulations was obtained in the pH 1.2 and pH 6.8 media. However, some differences between the two formulations were observed when dissolution testing was carried out in the acetate buffer (pH 4.5), characterised by the similarity factor value of 45.2 (Table IV). The differences were more pronounced at the early time points, with more than 85% of L-Na dissolved after 20 min in the case of the test formulation and after 30 min in the case of the reference formulation. In all the investigated cases, L-Na release was faster from the test formulation (Fig. 6). The investigated formulations had different dissolution behaviour when dissolution testing was carried out under the old USP conditions, too. The release of L-Na for both the test and the reference formulations was greater in the 0.01 M HCl with surfactant addition with the saturation level achieved after 15–20 min. The use of pH 7.4 phosphate buffer gave lower level of L-Na dissolved, with more than 85% of L-Na dissolved after 20–30 min in the case of the test formulation and after 30 min in the case of the reference formulation. The presence of surfactant in acidic dissolution medium brought significant increase in the percentage of L-Na dissolved, which can be profoundly seen in the case of the reference formulation. This is in accordance with the results reported by Volpato et al. (35). The f2 value of 67.6 shows that profiles obtained should be regarded as similar, while the same formulations tested with the old USP method would be described as dissimilar (Table IV).
Formulation factors certainly play an important role in drug dissolution. The presence of a superdisintegrant in the formulation can have a great impact on drug release from solid dosage form. Crosscarmelose sodium is a type of superdisintegrant, which is generally used in smaller concentrations than conventional disintegrants and it is present in both the test and the reference formulations (36,37). It has fibrous nature and great ability to swell in contact with water, causing rapid tablet disintegration. Crosscarmelose sodium is probably responsible for good and rapid dissolution of L-Na from the investigated formulations under suitable conditions. The use of the same excipients in both formulations is in accordance with the current regulatory recommendations that the test and the reference formulations should be similar in quality, and, as much as possible, in quantity (3). The in vivo study showed that the test and the reference formulations narrowly passed the standard requirements for bioequivalence; the values of AUC0–t, AUC0–∞ and Cmax were slightly lower for the test than for the reference formulation. Dissolution studies were performed with single 100-μg tablet units which represent the average therapeutic dose. The similarity of dissolution profiles of studied formulations was confirmed in pH 1.2 and pH 6.8 media and in 0.01 M HCl with 0.2% SLS. The use of the old USP method (phosphate buffer pH 7.4) resulted in evident differences among the release profiles obtained for the investigated formulations. The release of L-Na from the reference formulation was slower and more gradual than in the case of the test formulation. The observed differences were more pronounced at the early time points, but after 30 min, more than 85% of L-Na was dissolved from both formulations. The in vitro drug product performance in various dissolution media can reveal certain differences which are not reflected in vivo. There are numerous reports demonstrating that drug formulations with proven bioequivalence show significant differences among the in vitro drug release profiles as measured by the f2 values (35,38,39). In the study of Volpato et al. (35), the old USP method demonstrated significant differences between the two L-Na formulations which were found to be bioequivalent in vivo, while the profiles obtained using the current USP method were almost superimposable. Based on the literature data, L-Na belongs to the BCS Class III group (16,17). Our solubility tests results show that L-Na meets the criterion for highly soluble drug at the therapeutic doses and fails to meet this criterion only for the dose used in the bioequivalence study. L-Na presents very specific case of a drug where bioequivalence of different tablet formulations is determined with the test dose much larger than clinical doses in order to reduce the impact of endogenous levothyroxine level on the bioequivalence estimation. Such a large dose will never be used clinically, so, in terms of therapeutic use, L-Na can be regarded as highly soluble and, considering the data on its oral absorption and permeability, it may fit into BCS class III, which is in accordance with the literature data. Thus, the rate and extent of absorption of this drug are limited by its permeability and not its solubility or dissolution rate, providing that drug release is rapid and complete. It can be expected that the solid dosage forms of BCS Class III active substances will show the same in vivo behaviour like oral solutions, for which bioavailability is considered self-evident (40,41). Furthermore, there are several studies in the literature reporting bioequivalence between levothyroxine tablets and oral levothyroxine solution (42,43). The current regulatory recommendations for very rapid dissolution (more than 85% in 15 min) and the value of similarity factor greater than 50 for the comparative dissolution testing might be too restrictive for BCS Class III drugs (3). The critical f2 value of 50 is obtained from the similarity of dissolution profiles based on the average difference of 10% at sampling time points (44). The general question is how large could be the difference between the drug mean dissolution profiles before the difference is likely to impact on the in vivo performance. Considering that L-Na is BCS Class III high-solubility and low-permeability drug, it is probable that small differences observed in the in vitro drug release do not have significant linkage to the in vivo performance, providing that drug release is sufficiently rapid. Considering that all calculated f2 values were greater than 40, opportunity might therefore exist to utilise less restrictive criteria in assessing the similarity between formulations. Our results raise the debate on the validity of using current f2 criteria for the comparative dissolution testing of rapidly dissolving immediate-release dosage forms. Substantial additional data will however need to be gathered for a range of drugs and formulations before the reality of this opportunity can truly be assessed.
CONCLUSION
The test formulation met the standard regulatory criteria for bioequivalence to the reference formulation when the bioequivalence study was conducted according to the current guidelines, although the results narrowly passed bioequivalence limits. On the in vitro side, both drug products exhibited rapid drug dissolution under the majority of experimental conditions studied. Drug dissolution from the test formulation was less susceptible to the effect of experimental conditions when compared to the reference formulation. The investigated drug products were shown to be similar under the experimental conditions currently recommended by the USP, as well as in the pH 1.2 and pH 6.8 dissolution media, while the differences between products were observed in the acetate buffer pH 4.5 and under the old USP experimental conditions. The results obtained indicate that the current regulatory recommendations for very rapid dissolution (more than 85% of drug dissolved in 15 min) and the f2 value greater than 50 may be too restrictive for biowaiver application in the case of immediate-release dosage forms containing highly soluble drug substance and need to be additionally discussed. The results of this study also contribute to the existing debate on the appropriateness of the current bioequivalence standards for levothyroxine sodium products.
ACKNOWLEDGEMENTS
This study was conducted as a part of the projects (OI 175023 and TR 23015) funded by the Ministry of Science and Technological Development, Republic of Serbia.
REFERENCES
- 1.Green WL. New questions regarding bioequivalence of levothyroxine preparations: a clinician’s response. AAPS J. 2005;7:E54–E58. doi: 10.1208/aapsj070107. [DOI] [PMC free article] [PubMed] [Google Scholar]
- 2.Hennessey JV. Levothyroxine dosage and the limitations of current bioequivalence standards. Nat Clin Pract Endocrinol Metab. 2006;2:474–475. doi: 10.1038/ncpendmet0273. [DOI] [PubMed] [Google Scholar]
- 3.European Medicines Agency. Guideline on the investigation of bioequivalence. CPMP/EWP/QWP/1401/98. Rev.1, January 2010. London: European Medicines Agency; 2010.
- 4.Bolton S. Bioequivalence studies for levothyroxine. AAPS J. 2005;7:E47–E53. doi: 10.1208/aapsj070106. [DOI] [PMC free article] [PubMed] [Google Scholar]
- 5.FDA. Guidance for industry: levothyroxine sodium tablets—in vivo pharmacokinetic and bioavailability studies and in vitro dissolution testing. U.S. Department of Health and Human Services, CDER/FDA; 2000.
- 6.Blakesley VA. Current methodology to assess bioequivalence of levothyroxine sodium products is inadequate. AAPS J. 2005;7:E42–E46. doi: 10.1208/aapsj070105. [DOI] [PMC free article] [PubMed] [Google Scholar]
- 7.Baskin HJ, Cobin RH, Duick DS, Gharib H, Guttler RB, Kaplan MM, Segal RL, American Association of Clinical Endocrinologists American Association of Clinical Endocrinologists medical guidelines for clinical practice for the evaluation and treatment of hyperthyroidism and hypothyroidism. Endocr Pract. 2002;8:457–469. [PubMed] [Google Scholar]
- 8.Eisenberg M, Distefano JJ. TSH-based protocol, tablet instability, and absorption effects on L-T4 bioequivalence. Thyroid. 2009;19:103–110. doi: 10.1089/thy.2008.0148. [DOI] [PMC free article] [PubMed] [Google Scholar]
- 9.Sawin CT, Susks MI, London M, Ranganathan C, Larsen PR. Oral thyroxine: variation in biological action and tablet content. Ann Intern Med. 1984;100:641–645. doi: 10.7326/0003-4819-100-5-641. [DOI] [PubMed] [Google Scholar]
- 10.Dong BJ, Brown CH. Hypothyroidism resulting from test levothyroxinefailure. J Am Board Fam Pract. 1991;4:167–170. [PubMed] [Google Scholar]
- 11.Copeland PM. Two cases of therapeutic failure associated with levothyroxine brand interchange. Ann Pharmacother. 1995;29:482–485. doi: 10.1177/106002809502900505. [DOI] [PubMed] [Google Scholar]
- 12.FDA: Levothyroxine sodium product information. http://www.fda.gov/Drugs/DrugSafety/PostmarketDrugSafetyInformationforPatientsandProviders/ucm161257.htm (2010). Accessed 24 Apr 2010
- 13.Pierres C, Gaugain-Hamidi A: Concentrated liquid thyroid hormone composition, US Patent application number: 20090270507. http://www.faqs.org/patents/app/20090270507 (2010). Accessed 13 May 2010.
- 14.Won CM. Kinetics of degradation of levothyroxine in aqueous solution and in solid state. Pharm Res. 1992;9:131–137. doi: 10.1023/A:1018952415732. [DOI] [PubMed] [Google Scholar]
- 15.Budavari S. The Merck Index. 13. Whitehouse Station: Merck&Co; 2001. p. 1678. [Google Scholar]
- 16.Lindenberg M, Kopp S, Dressman JB. Classification of orally administered drugs on the World Health Organization model list of essential medicines according to the Biopharmaceutics Classification System. Eur J Pharm Biopharm. 2004;58:265–278. doi: 10.1016/j.ejpb.2004.03.001. [DOI] [PubMed] [Google Scholar]
- 17.Pabla D, Akhlaghi F, Zia H. Intestinal permeability enhancement of levothyroxine sodium by straight chain fatty acids studied in MDCK epithelial cell line. Eur J Pharm Sci. 2010;40:466–472. doi: 10.1016/j.ejps.2010.05.002. [DOI] [PubMed] [Google Scholar]
- 18.FDA. Guidance for industry: waiver of in vivo bioavailability and bioequivalence studies for immediate-release solid oral dosage forms based on a Biopharmaceutics Classification System. U.S. Department of Health and Human Services, CDER/FDA; 2003.
- 19.FDA. Guidance for industry: dissolution testing of immediate release solid oral dosage forms. U.S. Department of Health and Human Services, CDER/FDA; 2003.
- 20.USP 24. The United States Pharmacopoeia 24th ed. Rockville: The United States Pharmacopoeial Convention, Inc; 2000, p. 969.
- 21.USP 25. The United States Pharmacopoeia. 25th ed. Rockville: The United States Pharmacopoeial Convention, Inc; 2002, p. 1002.
- 22.USP 32. The United States Pharmacopoeia. 32nd ed. Rockville: The United States Pharmacopoeial Convention, Inc; 2003, p. 2779.
- 23.ICH. Note for guidance on good clinical practice. CPMP/ICH/135/95; 2002.
- 24.Moore JW, Flanner HH. Mathematical comparison of curves with an emphasis on in vitro release profiles. Pharm Tech. 1996;20:64–74. [Google Scholar]
- 25.Sweetman S, editor. Martindale: the extra pharmacopoeia. 36. London: The Pharmaceutical Press; 2009. pp. 2171–2174. [Google Scholar]
- 26.Di Girolamo G, Keller GA, de Los Santos AR, Schere D, Gonzalez CD. Bioequivalence of two levothyroxine tablet formulations without and with mathematical adjustment for basal thyroxine levels in healthy Argentinian volunteers: a single-dose, randomized, open-label, crossover study. Clinical Ther. 2008;30:2015–2023. doi: 10.1016/j.clinthera.2008.11.005. [DOI] [PubMed] [Google Scholar]
- 27.Yannovits N, Zintzaras E, Pouli A, Koukoulis G, Lyberi S, Savari E, Potamianos S, et al. A bioequivalence study of levothyroxine tablets versus an oral levothyroxine solution in healthy volunteers. Eur J Drug Metab Pharmacokinet. 2006;31:73–78. doi: 10.1007/BF03191122. [DOI] [PubMed] [Google Scholar]
- 28.Dong BJ, Hauck WW, Gambertoglio JG, Gee L, White JR, Bubp JL, Greenspan FS. Bioequivalence of generic and brand-name levothyroxine products in the treatment of hypothyroidism. JAMA. 1997;277:1205–1213. doi: 10.1001/jama.277.15.1205. [DOI] [PubMed] [Google Scholar]
- 29.Health Canada: Expert Advisory Committee on Bioavailability. Record of proceedings. April 16, 2003. http://www.hc-sc.gc.ca/hpfbdgpsa/tpd-dpt/2003-04-16_e.html (2003). Accessed 1 Oct 2010.
- 30.Food and Drug Administration. Code of Federal Regulations. Title 21, Part 320: bioavailability and bioequivalence requirements. Section 320.33(c). http://www.accessdata.fda.gov (2003). Accessed 1 Oct 2010.
- 31.Baek IH, Lee BY, Kang W, Kwon KI. Comparison of average, scaled average, and population bioequivalence methods for assessment of highly variable drugs: an experience with doxifluridine in beagle dogs. Eur J Pharm Sci. 2010;39:175–180. doi: 10.1016/j.ejps.2009.11.013. [DOI] [PubMed] [Google Scholar]
- 32.Haidar SH, Makhlouf F, Schuirmann DJ, Hyslop T, Davit B, Conner D, Yu LX. Evaluation of a scaling approach for the bioequivalence of highly variable drugs. AAPS J. 2008;10:450–454. doi: 10.1208/s12248-008-9053-4. [DOI] [PMC free article] [PubMed] [Google Scholar]
- 33.McCarthy LG, Bradley G, Sexton JC, Corrigan OI, Healy AM. Computational fluid dynamics modeling of the paddle dissolution apparatus: agitation rate, mixing patterns, and fluid velocities. AAPS PharmSciTech. 2004;5:e31. doi: 10.1208/pt050231. [DOI] [PMC free article] [PubMed] [Google Scholar]
- 34.Pabla D, Akhlaghi F, Zia H. A comparative pH-dissolution profile study of selected commercial levothyroxine products using inductively coupled plasma mass spectrometry. Eur J Pharm Biopharm. 2009;72:105–110. doi: 10.1016/j.ejpb.2008.10.008. [DOI] [PubMed] [Google Scholar]
- 35.Volpato NM, Silva RL, Brito AP, Gonçalves JC, Vaisman M, Noël F. Multiple level C in vitro/in vivo correlation of dissolution profiles of two l-thyroxine tablets with pharmacokinetics data obtained from patients treated for hypothyroidism. Eur J Pharm Sci. 2004;21:655–660. doi: 10.1016/j.ejps.2004.01.006. [DOI] [PubMed] [Google Scholar]
- 36.Zhao N, Augsburger LL. Functionality comparison of 3 classes of superdisintegrants in promoting aspirin tablet disintegration and dissolution. AAPS PharmSciTech. 2005;6:E634–E640. doi: 10.1208/pt060479. [DOI] [PMC free article] [PubMed] [Google Scholar]
- 37.Carmella C, Ferrari F, Bonferroni MC, Ronchi M. Disintegrants in solid dosage forms. Drug Dev Ind Pharm. 1990;16:2561–2577. doi: 10.3109/03639049009058547. [DOI] [Google Scholar]
- 38.Homsek I, Parojcic J, Dacevic M, Petrovic L, Jovanovic D. Justification of metformin hydrochloride biowaiver criteria based on bioequivalence study. Arzneimittelforschung. 2010;60:553–559. doi: 10.1055/s-0031-1296324. [DOI] [PubMed] [Google Scholar]
- 39.Flores-Murrieta FJ, Toledo A, del Carmen Carrasco-Portugal M, Reyes-García G, Rodríguez-Silverio J, Medina-Santillán R, Herrera JE. Comparative bioavailability of two oral formulations of ranitidine. Biopharm Drug Dispos. 2006;27:23–27. doi: 10.1002/bdd.477. [DOI] [PubMed] [Google Scholar]
- 40.Blume HH, Schug BS. The biopharmaceutics classification system (BCS): Class III drugs-better candidates for BA/BE waiver? Eur J Pharm Sci. 1999;9:117–121. doi: 10.1016/S0928-0987(99)00076-7. [DOI] [PubMed] [Google Scholar]
- 41.Tsume Y, Amidon GL. The biowaiver extension for BCS class III drugs: the effect of dissolution rate on the bioequivalence of BCS class III immediate-release drugs predicted by computer simulation. Mol Pharm. 2010;7:1235–1243. doi: 10.1021/mp100053q. [DOI] [PubMed] [Google Scholar]
- 42.Koytchev R, Lauschner R. Bioequivalence study of levothyroxine tablets compared to reference tablets and an oral solution. Arzneimittelforschung. 2004;54:680–684. doi: 10.1055/s-0031-1297021. [DOI] [PubMed] [Google Scholar]
- 43.Grussendorf M, Vaupel R, Wegscheider K. Bioequivalence of L-thyroxine tablets and a liquid L-thyroxine solution in the treatment of hypothyroid patients. Med Klin (Munich) 2004;99:639–644. doi: 10.1007/s00063-004-1096-4. [DOI] [PubMed] [Google Scholar]
- 44.Shah VP, Tsong Y, Sathe P, Liu JP. In vitro dissolution profile comparison-statistics and analysis of the similarity factor, f2. Pharm Res. 1998;15:889–896. doi: 10.1023/A:1011976615750. [DOI] [PubMed] [Google Scholar]


