

Abstract
Meningiomas are one of the most common adult brain tumors. For most patients, surgical excision is curative. However, up to 20% recur. Currently, the molecular determinants predicting recurrence and malignant transformation are lacking. We performed retrospective global genetic and genomic analysis of 85 meningioma samples of various grades. Copy number alterations were assessed by 100K single‐nucleotide polymorphism arrays and correlated with gene expression, proliferation indices and clinical outcome. In addition to chromosome 22q loss, which was detected in the majority of clinical samples, chromosome 6q and 14q loss was significantly more common in recurrent tumors and was associated with anaplastic histology. Five “classes” of meningiomas were detected by gene expression analysis that correlated with copy number alterations, recurrent status and malignant histology. These classes more accurately identified recurrent tumors relative to Ki‐67 index and extent of surgical resection, and highlight substantial expression heterogeneity between meningiomas. These data offer the most complete description of the genomic landscape of meningiomas, and provide broad genomic information that may be used to further stratify meningioma patients into prognostic risk groups.
Keywords: Affymetrix, BioDiscovery, brain tumor, dChip, GeneChip Human Mapping 100K Array, genomics, Human Genome U133 Plus 2.0 Array, meningioma, microarray, Nexus, SNP
INTRODUCTION
Meningiomas are solid tumors of the central nervous system that originate from the arachnoidal cap cells, which cover the brain and spinal cord. Meningeal tumors represent 25% to 30% of all primary brain tumors with estimated annual incidence ranging between four and six per 100 000 individuals 29, 36. The current World Health Organization (WHO) classifications for meningiomas specify three grades in the following proportions: 80% are benign (grade I), 15% are atypical (grade II) and 5% are anaplastic (grade III) (23). Histological grade and extent of surgical resection serve as the two most important prognostic variables (23). Among WHO I meningiomas, 5% recur within 5 years of gross total resection, while 40% of WHO II meningiomas have recently been reported to recur within 5 years (29).
The current standard of care for meningioma are surgical resection and postsurgical radiation for anaplastic meningiomas and/or unresectable high‐grade recurrent tumors 17, 19. Chemotherapy has been largely ineffective despite clinical trials involving temozolomide (5), hydroxyurea (16) and RU‐486 (35). Limited prognostic tools for predicting relapse exist, and for unresectable tumors no effective therapies exist. Genomic characterization of meningiomas may lead to improved prognostic markers and is an efficient route to improved understanding of the underlying causes that are a necessary step in the design of rational treatments. The applications of microsatellite, cytogenetic fluorescence in situ hybridization, comparative genomic hybridization (CGH) and array‐based CGH (aCGH) methods have allowed numerous investigators to report deletions of various genetic regions in different grades of meningiomas. The most common genetic aberration of meningiomas is the monosomic loss of chromosome 22, which occurs in the majority of tumors (27). However, a broad array of chromosome losses have been reported on 1p, 3q, 6q, 9p, 10q, 14q, 17p, 18p, 18q and 22q (13), and are correlated with higher grades of meningiomas. The loss of 1p in particular has been suggested as a decisive step for meningioma progression (33). At the gene level, the mutational profile of meningiomas has been dominated by reports of inactivating NF2 mutations which occur in 33% to 50% of monosomic 22 tumors (27) on the retained allele. Three percent of meningiomas appear to harbor the identical mutation in exon 9 of INI1 (2). Candidate tumor suppressor genes have been studied including DAL‐1, BAM22, MN1 and LARGE (29), but no mutations have been identified 9, 14, 24, 25, 30.
Meningioma classification is based on histological criteria, and predicting which tumors may recur after surgery from those that do not remains difficult. Initial genomic characterizations of meningiomas have been performed which indicate heterogeneity of gene expression and substantial genomic aberrations 4, 36. Because of the large heterogeneity between meningiomas, we have sought to generate a larger data set to permit the identification of cryptic gene expression or chromosome aberration‐based groupings to further correlate findings between chromosomal loss patterns and gene expression. To accomplish this, we have generated the largest and most comprehensively analyzed meningioma data set to date, which is made public to permit downstream multigroup meta‐analyses to dissect meningiomas. In this process, we note several novel features of the molecular landscape of meningiomas, including chromosomal aberration correlates with sex of the affected, chromosomal loss hierarchies, identification of gene expression‐based subgroups of meningioma and delineation of meningioma overexpressed genes, and we apply the data to highlight candidate tumor suppressor genes. Further, the data are used to identify molecular gene expression correlates and chromosomal loss correlates of recurrence.
MATERIALS AND METHODS
Tumor and patient clinical characteristics
Tumor biopsies from 53 female and 32 male subjects with sporadic meningioma were identified from the UCLA Neuro‐oncology Program Tissue Bank through institutional review board‐approved protocols. The 85 tumors were selected on the basis of sufficiently large tissue available for DNA and RNA extraction that yielded clean RNA and DNA. All grade I, II and III samples available within the UCLA brain tumor bank at the time of initiation were included. Time of survival, sex, age, recurrence and positive mean Ki‐67 levels were recorded (see Supporting Information Table S1). Subject age at time of diagnosis ranged from 31 to 89 years. None of the patients had neurofibromatosis. Pathological assessment of WHO grading was determined clinically with the UCLA Neuropathology service. Fifty‐seven tumors were designated “benign” WHO I, 20 tumors were “atypical” WHO II and eight were “anaplastic” WHO III.
Single‐nucleotide polymorphism (SNP) analysis
DNA extraction was performed from 10 to 20 mg of tumor pieces using the Gentra Puregene™ Tissue kit from Qiagen (Valencia, CA) according to the supplied protocol. Genomic DNA (250 ng) was used for each of the microarray assays of the Affymetrix (Santa Clara, CA) GeneChip® Human Mapping 100K Arrays. All assays were performed per the Affymetrix GeneChip® Mapping 100K Assay Manual using the resources of the UCLA DNA Microarray facility (http://microarray.genetics.ucla.edu/). All microarrays were scanned using the Affymetrix GeneChip® 3000 scanner. All images were manually examined to determine that none had surface defects and all had proper grid placement. Of 88 tumor sample hybridizations, three were removed from analysis because of low call rate. Raw probe intensity values in a .CEL format were generated for analysis using the Affymetrix GenoType (GTYPE) calling algorithm. All SNP.CEL files are available for retrieval from the Gene Expression Omnibus (accession no. GSE16584).
Gene expression analysis
RNA was extracted from 20 to 50 mg tumor pieces using Qiagen RNA easy mini kits per manufacturer's protocols. Of 85 total biopsies, 71 samples had a 28s/18s ratio of 1.0 to 2.0 with minimal evidence of degradation or contamination, and were selected for gene expression analysis. The extracted total RNA was assessed for integrity using the 2100 Bioanalyzer by Agilent Technologies (Santa Clara, CA).
Total RNA (1 µg) was used for single‐round biotinylated probe synthesis using the Affymetrix Array Station device made by Caliper Life Sciences (Hopkinton, MA) according to the manufacturer's protocols. Labeled and sheared cRNA was manually applied to Affymetrix Human Genome U133 Plus 2.0 Arrays. All microarrays were scanned using the Affymetrix GeneChip® 3000 scanner. Images were manually examined to determine that none had surface defects and all had proper grid alignment. Of 71 tumor sample hybridizations, three were removed from analysis because of artificially high overall array brightness. Raw probe intensity values in a .CEL format were generated for analysis using the Affymetrix Gene Chip Operating System. Generated .CEL files were deposited into the Celsius microarray database (6) (http://celsius.genomics.ctrl.ucla.edu/), and this system was used to normalize relative to other microarrays of the same Affymetrix platform using RMA with default settings from the Bioconductor R library 3, 8. All expression .CEL files are available for retrieval from the Gene Expression Omnibus (accession no. GSE16584).
To validate the presence of our gene expression‐based classifier, additional meningioma microarray samples available on the Affymetrix U133 Plus 2.0 platform were collected from GEO. Fifty‐six meningioma microarrays (grade I: n = 32, grade II: n = 20, grade III: n = 3, grade unknown: n = 1) were collected from GEO accession series GSE4780. Of these 56 microarrays, 46 were derived from primary meningiomas (grade I: n = 26, II: n = 19, III: n = 1, unknown: n = 1), and nine were derived from recurrent meningiomas (grade I: n = 6, II: n = 1 and III: n = 2) (Supporting Information Table S1). Finally, a set of 31 meningioma microarrays (grade unknown) were collected from GEO accession series GSE9438. All 31 of these microarrays were derived from primary meningioma tumors.
Copy number analysis
Copy number calls were generated using the Affymetrix GTYPE CNAT version 3.0 algorithm using default manufacturer‐recommended standard parameters. CNAT version 3.0 compared the tumor arrays against the proprietary embedded reference data file based on 100 normal reference individuals that produced copy number calls in resulting .CNT files (32). .CNT files were also analyzed by BioDiscovery Nexus 3.0™ professional edition (El Segundo, CA) for copy number and LOH analysis using default parameters to define and visualize chromosome gains or losses with the BioDiscovery “rank segmentation” algorithm (http://www.biodiscovery.com). All copy number analyses were referenced to Human Genome build 36.1. Evaluation of large‐scale chromosomal loss events was performed by analyzing the frequency plot output from the Nexus “rank segmentation” algorithm visualization with the percent threshold of one group of tumors with aberrations set to at least 35%, and t‐test P value threshold set at 0.05 in the Nexus 3.0 software. The 100K SNP arrays have an average mean inter‐SNP distance of 23.6 kb and median inter‐SNP distance of 8.5 kb which can typically provide sub‐megabase resolution of chromosomal deletions. By default, five probes were required for a minimum call as published studies demonstrated that five consecutive SNPs on the 100K platform were required to call with 95% confidence (10). This results in an average minimal deletion detection size of 120 kb on average throughout the genome. The default number of probes was duly required to exceed a “rank segmentation” significance threshold of 1.0 × 10⁶ based on BioDiscovery's Nexus program. The minimum copy number/log2 ratio change required for a call was 0.2. Supervised comparisons investigating chromosomal aberrations between the different meningioma grades or their five group memberships were executed through selected pair‐wise comparisons with the difference in percent between the two groups being compared set at 25% and the P value set at 0.05. Significant regions of chromosomal losses defined by Nexus 3.0's Fisher's exact test statistical comparison were subsequently tallied and computed for minimal overlap determination.
Expression analysis
Gene expression data were analyzed with DNA‐Chip Analyzer (dChip) (http://www.dchip.org). Briefly, unsupervised clustering of samples and genes was performed on a filtered gene list. Filtering consisted of selecting those genes with coefficient of variation (CV) greater than 1.0, and with expression values greater than 20 in at least 20% or more of the total microarrays. This filtering generated a list of 1747 probe sets corresponding to 1316 unique genes which defined three differentially expressed groups by unsupervised hierarchical agglomerative clustering. The meningiomas within the first two of three sample branches revealed highly cohesive and intense expression clusters, while the third cluster of samples contained tumors that exhibited an independent clustering signature with less intense, but distinct expression across the 1747 probe sets. To identify the underlying genetic signature of this third sample cluster, we applied an ad hoc secondary filtering CV greater than 0.8 to these samples, and identified 3237 probe sets (2299 genes) identifying three child subgroups within this third branch by supervised hierarchical agglomerative clustering. These methods identified a total of five gene expression subgroups based on distinct gene expression profiles. Analysis settings were set at default unless otherwise specified. Distances were set to be “precalculated,” and a “1‐correlation” distance metric was employed using “centroid” as the linkage method. Expression data from samples that demonstrated chromosomal loss or retention over minimal loss regions according to Nexus 3.0 analyses were subsequently analyzed by dChip software using two group comparisons over the genomic areas of interest. Common losses observed only in a specific grade of tumors were determined; subsequently, the expression of the genes within these regions was compared between tumors of matched grade with and without the deletion of the specified region. The identical analysis method was repeated for common losses observed only in grade III and grade II tumors, and finally repeated for common losses observed only in grade II and grade I tumors. “Lower expressing genes” were identified as those demonstrating greater than a 1.2 decrease in expression difference with t‐test P value thresholds ≤0.05 and false discovery rate (FDR) ≤10% after 100 permutations. Pearson correlation coefficients were calculated using chromosome retention/loss calls generated by Nexus 3.0 in conjunction with the expression values exported from dChip. Gene lists were tested for enriched functional and biological themes using the MetaCore pathway web application by GeneGO, Inc. (http://www.genego.com/). The most significant biological gene network themes were calculated by identifying node genes present from our differential expression analyses uploaded to MetaCore pathway analysis. Returned network themes were rank ordered by their hypergeometric P values calculated during output list production. The resulting data with significance values and enrichment ratios are included in file Supporting Information Table S3.
Ki‐67 labeling
Ki‐67 expression was determined by examining 379 samples of human meningioma applied onto tissue microarrays from 125 cases of 106 patients. Seventy‐two cases were WHO grade I (benign), 35 were grade II (atypical) and 18 were grade III (malignant–anaplastic). Two duplicate arrays were stained for Ki‐67. Three hundred seventy of 379 spots were informative for the marker on both slides. There was good agreement across both slides (Pearson correlation = 0.93). Scores for both were averaged for analysis. Using the mean percent of positive nuclear Ki‐67 staining, 18% of cases were totally negative. While 82% of cases were positive, most of these had very low, but detectable, staining. Further, 18% had negative staining in all observed cells, 64% had staining between 0 and 1% and 18% had Ki‐67 staining in >1% of the tumor cells.
Comparison group data
A panel of U133A and U133 Plus 2.0 .CEL files were available within the Celsius database (6). These were collected using RNA from normal body tissues (n = 144: adult tissue n = 88, fetal tissue n = 14, adult brain n = 30, fetal brain n = 12), and other brain tumors [n = 454: medulloblastomas n = 5, schwannomas n = 5, ependymomas n = 3, grade II gliomas n = 16, pilocytic tumors n = 2, grade III gliomas n = 69 (AA n = 34, AMG n = 19, AO n = 16), gliosarcomas n = 5, glioblastomas n = 284, meningiomas n = 65) (Supporting Information Table S5). These samples were selected as a comparison group to identify meningioma‐specific genes. All comparisons were performed on probe sets shared between the U133A and U133 Plus 2.0 arrays for these analyses. Meningioma‐specific genes were stringently identified based on 10‐fold or higher expression in the meningioma group relative to the comparison of all normal body tissues and other brain tumors with a pair‐wise t‐test P value less than 0.01. FDR was estimated in dChip by permuting the sample names 100 times.
RESULTS
Eighty‐five meningiomas were successfully analyzed using the Affymetrix Human Mapping 100K SNP arrays, and 68 meningiomas were successfully hybridized independently onto U133 Plus 2.0 expression arrays. Sixty‐five meningiomas had data generated from both assays.
Chromosomal abnormalities are more common in higher‐grade meningiomas
The vast majority of chromosomal aberrations consisted of whole chromosome arm losses. Of the 85 tumors, 32% (27/85) had no observed chromosomal arm losses, and 68% (58/85) of these meningiomas revealed significant genomic abnormalities of one or more whole chromosomal arm losses. Consistent with previous descriptions, there was a strong association of increasing frequency of chromosomal losses with increasing histological grade (Figure 1A) (22). Of grade I meningiomas, 44% had no evidence of any chromosomal arm loss, while 56% (32/57) had at least one whole arm loss. Among the grade I tumors, 33% (19/57) had a single chromosome arm loss, 9% (5/57) had two losses and 14% (8/57) had three losses or more. In contrast, only 10% of grade II meningiomas had no detectable losses (2/20). Further, if a grade II tumor had a chromosomal loss (18/20), all had more than one chromosomal arm loss: 25% (5/20) had two chromosomal arm losses, while 65% (13/20) of the grade II tumors had three chromosomal arm losses or more. All of the grade III meningiomas had three or more whole chromosomal arm losses. In aggregate, grade I meningiomas had a median of 1.0 chromosomal arm loss per tumor, grade II tumors had 3.0 chromosomal arm losses and grade III tumors had a median of 9.5 chromosomal arm losses per sample demonstrating a strong correlation of genomic losses with increasing grade. Pair‐wise Kruskal–Wallis rank sum tests confirmed significant differences in chromosomal arm losses between grade I vs. II (P value = 1.36 × 10⁻⁵), grade II vs. III (P value = 4.07 × 10⁻³) and grade I vs. III (P value = 1.39 × 10⁻⁵).
Figure 1.
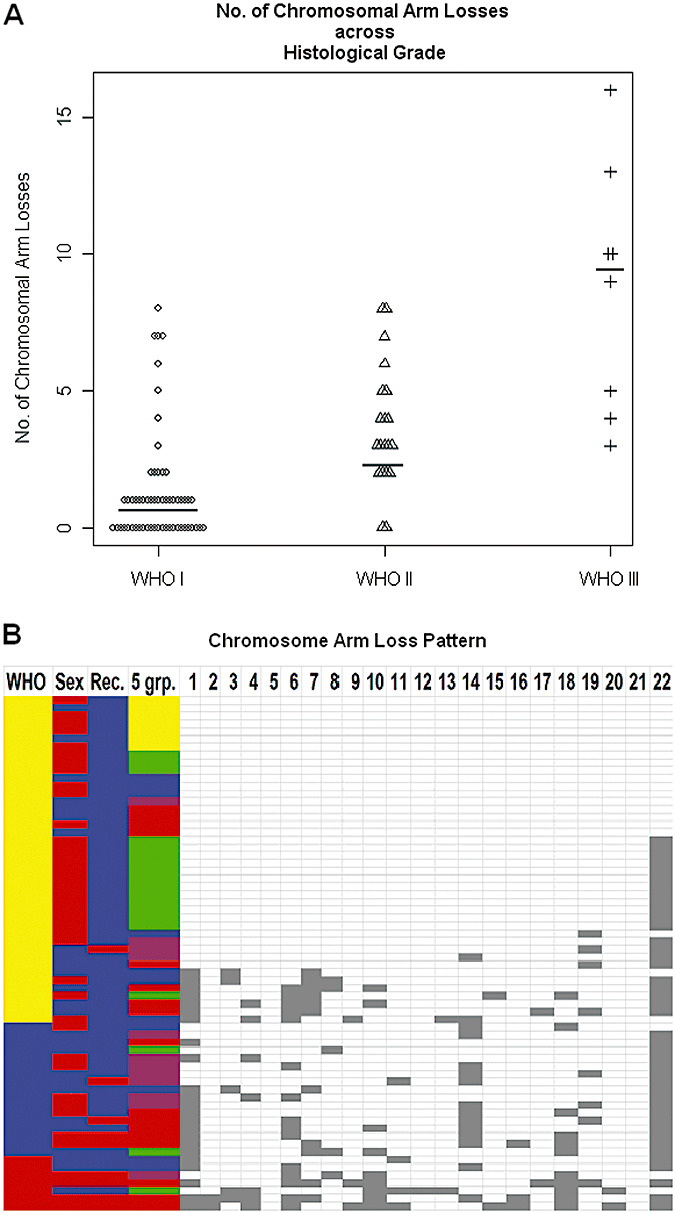
Chromosomal arm losses are more common in higher‐grade meningiomas. A. Plots of the number of whole arm losses per sample (y‐axis) for each of the three histological groups (x‐axis). Grade I samples (n = 57) have a median chromosome loss = 1.0, grade II samples (n = 20) have a median chromosome loss = 3.0 and grade III samples (n = 8) have a median chromosome loss = 9.5. Horizontal lines indicate median chromosomal arm losses across histological grade. B. Plots of the distribution of chromosome arm losses. Chromosome number is listed across the top, and a chromosome loss is depicted as a gray square. Each row represents one tumor sample. Tumor samples are ordered by the World Health Organization grade: grade I (yellow), grade II (blue) and grade III (red). Gender is color labeled male (blue); female (red). Tumor presentations are color labeled by type: initial presentation (blue); recurrent presentation (red). The five expression groups are color labeled by number: group 1 (yellow), group 2 (green), group 3 (blue), group 4 (purple) and group 5 (red). The most frequent chromosomal losses were of entire arms, and are listed only by chromosome number. Common arm losses include: 22q, 14q, 1p, 18q, 6q, 10q, 11p, 7p and 4p.
From these data, a pattern of molecular hierarchy is suggested in which increased aggressiveness of the meningiomas is caused by yet undetermined genes within the large chromosomal losses. The pattern of loss while not uniform reveals general patterns, and reveals the relative importance of specific chromosomal loss events. Of the grade I tumors, the only recurring chromosome loss was the loss of chromosome 22q that was detected in 49% (Figure 1B). Grade II meningiomas displayed a higher frequency of chromosome 22q monosomy (85%), but additionally accumulated frequently recurring losses on 14q (60%) and 1p (55%). Grade III meningiomas acquired a much more diverse chromosome arm loss pattern, but retained the core features of grade II tumors with frequent losses on 22q (75%), 1p (75%) and 14q (38%). Moreover, frequent losses of 18q (75%), 6q (63%), 10q (63%), 11p (50%), 7p (38%) and 4p (38%) were observed which were either not observed among the lower grades or were substantially more frequently appearing in the grade III tumors. The nonrandom nature of the chromosomal losses highlights these chromosomes for further genetic analysis in meningiomas, and implies that multiple genetic events are necessary in the generation of grade III meningiomas. Further, a common mutational mechanism is whole chromosomal arm loss implying the sequential loss of function of specific genes. Unfortunately, insufficient smaller chromosomal arm losses were observed to resolve the location of these genes. Moreover, there were no statistically significant associations detected between genetics and location (frontal, parietal, occipital, et al, etc.) or side (left, right, bottom). In aggregate, these observations indicate a mutational hierarchy with chromosome 22q loss occurring as the primary event followed by chromosome 1p and/or 14q loss, and then mutations of genes on 18q, 6q, 10q, 11p, 7p and 4p. The cumulative genetic mutations that lead to grade III histological features and higher propensity for recurrence are thus multiple.
Molecular correlates of recurrent meningiomas
Given the retrospective nature of the current study and insufficient length of follow‐up of individual patients (post‐gross or subtotal resections), we are not able to comment meaningfully on true predictors of recurrence. However, we were able to compare tumors observed to be recurrent to those tumors at first presentation which identified a higher number of total chromosomal arm losses among recurrent tumors relative to newly diagnosed tumors (Kruskal–Wallis P value = 7.7 × 10⁻³). Only eight primary samples analyzed in this data set were sampled from patients who had a later recurrence. None of the recurrent biopsies were available for analysis. After comparing these eight primary samples with the remaining set of primary tumors that did not yet relapse, none of the specific chromosomal losses that we found among our recurrent tumors were determined to be significantly enriched among these eight primary tumors over the 17 primary tumors that did not recur (Fisher's exact test P value > 0.05). These results suggest that chromosomal losses observed to be more common in the recurrent tumors may be acquired during disease progression rather than being present at the time of initial diagnosis.
Within our data set and as expected, Ki‐67 labeling was highly related to the WHO grade. Ki‐67 expression is defined as percentage of positive cells. The mean and median expressions of Ki‐67 in WHO grade I were 0.27 and 0.17, respectively. The mean and median expressions of Ki‐67 in WHO grade II were 1.19 and 0.53, respectively. The mean and median expressions of Ki‐67 in WHO grade III were 5.21 and 3.25, respectively. There was a statistically significant difference between the Ki‐67 expression across the three meningioma grades. Also as expected, there was a significant correlation between Ki‐67 positivity and recurrence [n = 85 tumors, Kruskal–Wallis (χ2 = 11.9256, d.f. = 1, P value = 5.5 × 10⁻⁴)]. High or medium Ki‐67 expression was significantly more common in the recurrent tumors relative to the newly diagnosed meningiomas (n = 85 tumors, P value = 4.0 × 10⁻³). However, when Ki‐67 levels were used to distinguish between grade II and grade III newly diagnosed meningiomas vs. the recurrent meningiomas, Ki‐67 expression failed to classify which of the grade II or III samples were recurrent meningiomas (P value = 0.44). We used this as a proxy of the ability to classify recurrence status to search for evidence of underlying molecular mutations with recurrence. Based on chromosomal loss patterns, recurrent grade II and III meningiomas had an average of 8.3 chromosomal arm losses vs. 3.9 chromosomal losses observed among grade II and III newly resected meningiomas (Kruskal–Wallis P value = 0.0077). Seven chromosomal arm losses were significantly more common in the recurrent meningiomas: 18q (Fisher's exact two‐tailed P value = 0.0002), 6q (P value = 0.0021), 10q (P value = 0.0099), 16q (P value = 0.017), 2p (P value = 0.017), 14q (P value = 0.017) and 18p (P value = 0.03). In order to assess if the great increase in chromosomal anomalies in the recurrent samples was potentially caused by artifacts of brain irradiation‐induced chromosomal loss, we compared recurrent tumors that had not received radiation with nonrecurrent tumors not treated with radiation, and identified that 6q loss was enriched in recurrent samples (P value = 8.0 × 10⁻⁴), and 14q loss was enriched in recurrent samples (P value = 2.8 × 10⁻³). This indicates that some of the genetic abnormalities in the recurrent tumors are not artifacts introduced by radiation. These data suggest that chromosomal arm loss of a series of specific chromosomes is a more reliable indicator of recurrence than Ki‐67 staining.
To further explore the unique aspects of the recurrent meningiomas, we filtered genes that were differentially expressed between the recurrent tumors and those of comparable grade at first diagnosis. The recurrent samples significantly overexpressed four cell cycle genes (MLF1IP, CKS2, CDC2 and PRC1) (68 tumors, fold change ≥ 2.0, P value ≤ 0.01, FDR 7.1%), while the newly diagnosed tumors significantly overexpressed 116 other genes (Figure 2). However, network analysis did not produce significantly enriched map elements nor networks consistent for any significant functional theme (significance threshold 0.01, P value = 0.05; Supporting Information Table S2). As Ki‐67 is an excellent marker of proliferation, we also used the genome‐wide expression data to search for genes correlated with Ki‐67 levels in meningiomas. Ten genes were significantly overexpressed in the mid and high Ki‐67‐positive meningiomas that were significantly overrepresented with cell cycle‐related genes RRM2, NCAPG, MLF1IP, CCNB1, CKS2, CDC2, BUB1B, NUSAP1 and PRC1 (data not shown). Conversely, there were only three genes (FZD7, AASS and C11orf41) that were significantly overexpressed in the low Ki‐67‐positive tumor samples.
Figure 2.
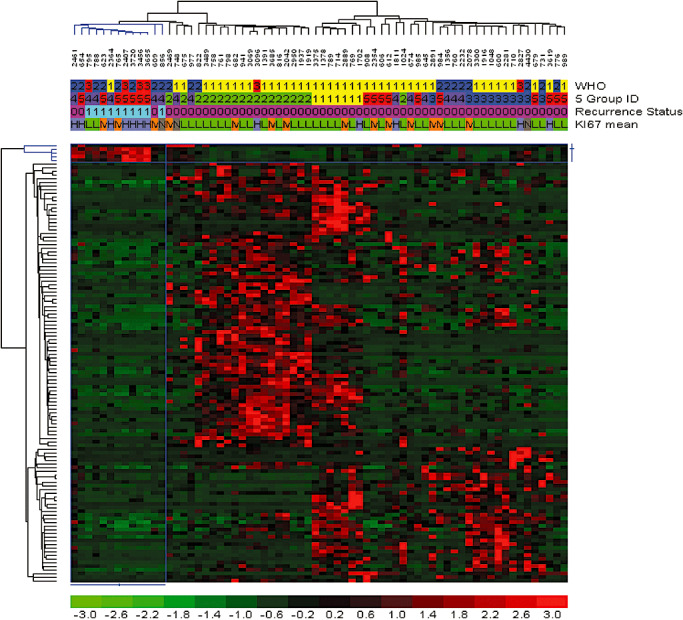
Identification of gene expression correlated with recurrent meningioma. Recurrent meningiomas (n = 8) were compared against newly diagnosed meningiomas with a twofold difference and a significance threshold of P value = 0.01, which found 120 unique genes with a false discovery rate of 6.9%. Genes and samples were hierarchically clustered, and the relative gene expression values were plotted in color. Red is increased expression relative to the overall set of samples, and green is lower expression relative to all of the samples. Header tracks: World Health Organization grade I (yellow), grade II (blue) and grade III (red). Meningioma five groups: 1 (yellow), 2 (green), 3 (blue), 4 (purple) and 5 (red). Recurrence status: newly diagnosed meningioma (codified value = 0), recurrent meningioma (codified value = 1). Ki‐67 mean: low Ki‐67 labeling (codified value = L), midrange (codified value = M) and high (codified value = H). The color bar below maps the relative differences in expression converted to log base 2 values.
Tumor chromosome 18q loss is more common in women with meningiomas than in men
With the clinically observed higher frequency of meningiomas in women relative to men, we explored if there were any significant chromosomal loss differences in the tumors from women vs. men. Chromosome 18q loss was detected in 8 of 16 women, and 2 of 18 men in samples with a chromosomal deletion not solely restricted to 22 monosomy (Fisher's exact test P value = 0.02). These data may indicate alternate pathways of tumorigenesis in meningiomas dependent on the sex of the affected individual for yet undetermined reasons.
Gene expression analysis identifies five main types of meningiomas that correlate broadly with histological grade and chromosomal loss
Meningiomas are histologically quite varied in appearance even within histological grades. We sought to identify underlying molecular themes in an unsupervised manner to reveal the complexity of meningiomas even within this modest sample set. For these analyses, we included all 68 samples for which gene expression data were generated. Then, 1316 genes were produced from the high CV (≥1.0) filtering criteria for expression values greater than the lowest quartile in 20% or more of the samples. Unsupervised clustering of the 68 meningiomas revealed three branches of samples organized by their gene co‐expression in a hierarchical clustering dendrogram. The first two sample branches revealed highly cohesive expression clusters, while the third sample branch was more heterogeneous and the samples only loosely related to each other. Thus, we reanalyzed the samples in the third branch by hierarchical clustering of probe sets that had high CV (≥0.8) with expression values greater than 20 in at least 20% or more of these samples. Three distinct hierarchical subgroups were identified within this third branch based on gene expression. The first two sample branches are labeled “group 1” and “group 2,” while the remaining three sample branches are labeled “group 3,”“group 4” and “group 5.” An aggregate set of 355 probe sets (302 genes) were identified (Supporting Information Table S3) and combined to form a five‐group expression signature panel (Figure 3A). In order to determine how the 302 genes from our five‐group expression panel compared to previously published studies, we found that 26/55 genes up‐regulated in grade III over grade I meningiomas from Carvalho et al were found among our five‐group expression classifier (hypergeometric P value = 0.01) (Supporting Information Table S3). In addition, 24/62 genes down‐regulated in grade III over grade I meningiomas were also found among our five‐group expression classifier (hypergeometric P value = 0.0096). Carvalho et al did not identify specific grade II meningioma expression signatures over grade I or grade III tumors because of what they explained as heterogeneity among grade 2 meningioma genomic expression. We concur that grade II meningiomas display broad expression heterogeneity as the majority of our grade 2 meningiomas (9/14 = 64%) comprise the bulk of expression groups 3, 4 and 5 which prompted our ad hoc secondary analysis. To further confirm the presence of five gene expression‐based groups among meningiomas, we collected publicly available meningioma microarray samples to see if our 302 differentially expressed genes could identify the five meningioma groups in other studies. Eighty‐seven additional meningioma microarrays of varying grades (WHO I = 32, WHO II = 20, WHO III = 3, WHO unknown = 32; Supporting Information Table S1) were collected from two separate institutional studies (GEO accession GSE4780 and GSE9438), and clustered with our samples based on the five‐group 302 gene panel. Hierarchical agglomerative clustering was able to confirm the presence of five distinct expression groups (Supporting Information Table S6).
Figure 3.
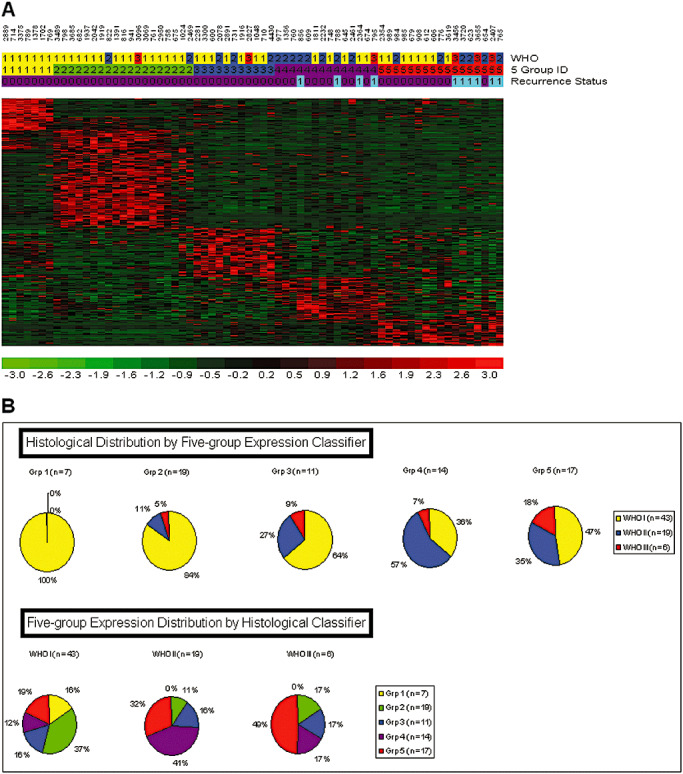
Five‐group gene expression‐based categorization of meningiomas. A. Five group meningioma profiles identified by whole‐genome expression comparisons. The five‐group expression classifier is composed of 302 unique genes that classify each meningioma (N = 68) into one of the five groups. Header tracks: World Health Organization grade I (yellow), grade II (blue) and grade III (red). Meningioma five groups: 1 (yellow), 2 (green), 3 (blue), 4 (purple) and 5 (red). Recurrence status: newly diagnosed meningioma: (codified value = 0); recurrent meningioma: (codified value = 1). B. Top pie charts indicate the relative portion of each of the three histological grades in each of the five gene expression‐based groups, and the bottom pie charts illustrate the distribution of the five different gene expression‐based groups within the three histological grades.
The five gene expression‐based meningioma groups correspond with histological grade (Kruskal–Wallis P value = 3.6 × 10⁻³); however, samples did not track precisely with ascending grade and ascending gene expression group assignment (Figure 3B). Expression groups 1 and 2 were predominantly populated by grade I samples (30/42), while group 3 was much more heterogeneous and highly enriched in grade II and grade III tumors (17/23). In particular, group 1 consisted solely of grade I tumors (WHO I: 100%), while group 2 contained grade I tumors by a large majority (WHO I: 84%) in addition to minor amounts of higher‐grade samples (WHO II: 11%, WHO III: 5%). Group 3 was more heterogeneous with respect to histological grade as it contained fewer grade I tumors than in groups 1 and 2 (70% vs. 100% and 84%, respectively), and more grade II (20%) and grade III (10%) meningiomas. Group 4 predominantly contained grade II meningiomas (58%), and minor populations of grade I (33%) and grade III (8%) tumors. Finally, group 5 had the largest proportion of grade III meningiomas (18%), and a substantial number of grade I (47%) and grade II (35%) tumors. Thus, while a trend was evident, there was no perfect correspondence of higher‐grade tumors with the gene expression categories (Supporting Information Table S1). However, while there existed no significant correlation between ascending gene expression categories with age (Kendall's rank correlation P value = 0.86), a significant correlation was found with ascending gene expression categories and gender. Lower gene expression categories appeared to demonstrate bias toward female tumor enrichment, while male tumors appeared more frequently in higher gene expression categories after controlling for initial gender selection bias [group 1 (female : male ratio = 2:1), group 2 (female : male ratio = 3:1), group 3 (female : male ratio = 1:1.6), Kendall's rank correlation P value = 0. 01].
MetaCore network pathway analysis identified 30 significant networks among the 168 genes distinctly expressed in groups 1 and 2, with the 129 genes distinctly expressed in group 3 (hypergeometric P value range: 2.04 × 10–39 to 9.69 × 10⁻⁴; Supporting Information Table S3). Almost one quarter of these networks (23%) were found to involve a kinase signaling pathway where group 1 and 2 meningiomas were found to express a different set of kinase pathway members (MYLK, PRKD1, NTRK2, ROR1, TNIK and PRKG1) than those expressed by group 3 meningiomas (EPHA3, DCLK1, PDK1, MET, EPHA7, INSR and ABP1). Moreover, the remaining 23 networks demonstrated GO processes spanning cancer‐related themes: regulation of cell death (11/50, hypergeometric P value = 8.7 × 10⁻⁸) and regulation of cell proliferation (20/50, P value = 3.5 × 10⁻¹⁵); developmental regulation: anatomical structure morphogenesis (11/50, P value = 1.5 × 10⁻¹¹), nervous system development (22/50, P value = 1.2 × 10⁻⁶) and organ development (8/50, P value = 8.8 × 10⁻¹⁹); and several metabolic processes: protein amino acid O‐linked glycosylation via threonine (7/50, P value = 1.8 × 10⁻³), regulation of adenylate cyclase activity (14/50, P value = 1.7 × 10⁻¹⁰) and fatty acid biosynthetic process (11/50, P value = 2.6 × 10⁻⁸).
The expression‐based groups also clustered all of the recurrent meningiomas among group 3 (Fisher's exact P value = 3.0 × 10⁻⁴); however, this is likely caused by the preponderance of higher‐grade tumors clustering among this expression group as 8/9 recurrent tumors were grade II or grade III from the outset. Among the five gene expression‐based groups, the chromosomal loss patterns observed across the groups were strikingly different (Figure 4). In aggregate, the median number of chromosome arms lost per group was significantly smaller in group 1, and significantly higher in group 3 than the others (group 1 = 0, group 2 = 1.0, group 3 = 2.5, group 4 = 2.5 and group 5 = 6.0; Kruskal–Wallis rank sum test P value = 1.2 × 10⁻³).
Figure 4.
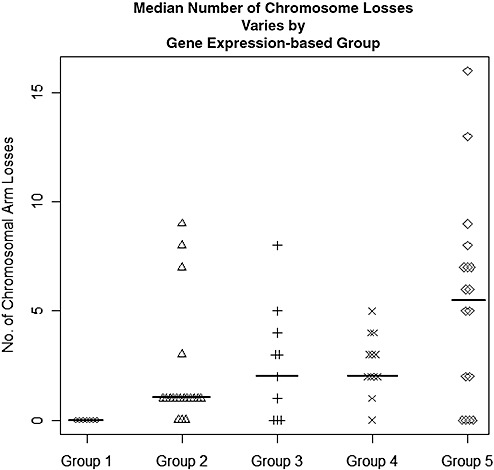
Median number of chromosome losses varies by gene expression‐based group. The y‐axis plots the number of whole arm losses per sample for each of the five gene expression‐based groups. Group 1 samples (n = 7) have median chromosome loss = 0, group 2 samples (n = 19) have median chromosome loss = 1.0, group 3 samples (n = 10) have median chromosome loss = 2.5, group 4 samples (n = 13) have median chromosome loss = 2.5 and group 5 samples (n = 17) have median chromosome loss = 6.0.
Combined use of gene expression data and chromosomal loss data to identify potential tumor suppressors
We attempted to use the combined SNP/gene expression data to suggest candidate tumor suppressor genes within the more commonly deleted chromosomes other than chromosome 22. First, we determined the minimal regions of common loss on the commonly deleted chromosomal regions among the grade III samples, the grade III and II samples and grade II and grade I samples using the “minimal loss rank ordering” and “drill down” features systematically with Nexus copy number analysis software. Shared minimal loss regions were easily identified through Nexus's output files (Supporting Information Table S4). We then hypothesized that the causative genes that are mutational targets are more likely to be down‐regulated in expression either by mutations on the nondeleted chromosome (that would lead to a premature stop and lower the mRNA abundance through nonsense mediated decay) or by smaller‐scale deletions/mutations invisible by the SNP arrays that lead to complete lack of the mRNA. Using this combination approach, we highlight a series of genes within the chromosomal regions more frequently deleted in the grade III tumors (Supporting Information Table S4). As an example, the minimal region of loss on 11q (11q23.1‐q23.2) contains 42 genes. However, only one of these genes, TIMM8B, was lower in expression in the three deleted samples than in the other nondeleted grade III tumors. No mutations of this gene in meningioma have yet been described. Similarly, 20p was deleted in three of the grade III tumors and contained 21 genes, but only one, C20orf7, was down‐regulated in the grade III samples relative to the lower‐grade samples. Using this approach to search for mutated genes, we looked at genes that may be highlighted by comparing chromosome losses between expression group profiles which highlighted CDC14A at 1p21 in a deleted interval between 1p36.13 and 1p36.11. Decreased expression of CDC14A was identified from comparing expression differences among the 44 genes at this locus between group 4 and 5 samples carrying the deletion (12/17), and group 4 and 5 samples (5/17) lacking the deletion. This is an attractive candidate tumor suppressor in meningiomas based on previously published functional data (18).
Identification of meningioma‐specific genes
The determination of five separate expression‐based subclasses and the tremendous variability of chromosomal losses between meningiomas analyzed here highlight the diversity of molecular types of meningiomas, and prompted us to determine if there were features shared in common across all meningiomas relative to other brain cancer types and normal brain and nonbrain tissues. We thus compared the 65 meningioma expression samples to available data from 533 other expression samples that consisted of various glioma samples from prior published work of ours and other colleagues 7, 20, 21, 26, 28, 31, which are available and co‐normalized within the Celsius database. Comparing meningiomas to this panel of 389 gliomas and 144 normal tissues revealed a large set of genes, which can robustly differentiate all of the meningiomas from any of the other neoplastic and non‐neoplastic tissues. There are a surprisingly large number of genes (n = 4912) that were identified as higher expressed in meningiomas than in normal tissues and gliomas (fold change = 2.0, P value = 0.05) with an overall FDR of 0.1%. In order to identify genes strongly and specifically correlated with meningiomas, regardless of grade, genes were filtered based on a fold increased expression in meningiomas of at least 10 and P value less than 0.001. These criteria identified 130 highly meningioma‐specific genes (FDR 0%) relative to all of the other tissues (Supporting Information Table S5). These genes were consistently expressed across all 65 meningiomas indicating many common features of the histologically and genetically diverse panel of meningiomas (Figure 5). To better characterize this observation, these genes were analyzed to identify enriched biological themes using the network analysis mining tool available through MetaCore. One hundred thirty MetaCore objects were recognized, and 13 annotated map themes contained statistically significant ontological terms among these genes. Prominent themes consisted of development: WNT signaling pathway (5/53 map objects; hypergeometric P value = 1.69 × 10⁻²); cytoskeleton remodeling: role of PDGFs in cell migration (3/21 map objects; P value = 2.12 × 10⁻²) and GTP metabolism (4/40 map objects; P value = 2.66 × 10⁻²). Finally, transcripts that encoded known secreted proteins were identified as potential targets for blood‐based diagnostics and are listed in Supporting Information Table S5.
Figure 5.

Directed comparison of all meningioma samples relative to combined glioma and normal tissues identifies meningioma‐specific genes. Normal tissues (n = 144) and gliomas (n = 389) were compared against meningiomas (n = 65) with a 10.0‐fold and significance threshold P value = 0.01, which found 130 unique genes expressed in meningiomas with a false discovery rate of 0.0%. Header track: normal tissue (green), gliomas (blue) and meningiomas (red).
DISCUSSION
Meningiomas, like many histologically defined tumors, are not a homogeneous set of cancers. Meningiomas vary in histological characteristics, chromosomal aberration profiles and gene expression programs. Histologically, while meningioma lesions are categorized into three WHO grades, there are 15 histological variants of meningiomas spread across the three grades (WHO I: nine subclasses; WHO II: three subclasses; WHO III: three subclasses) (29). By our molecular analyses, it is evident that there are three to four subpopulations of WHO I meningiomas based on their various chromosomal loss profiles: a majority that does not experience chromosome deletions by the time of surgical resection, a secondary population with 22 monosomy alone, a group that loses 22q in conjunction with 1p and a group that loses chromosome 1p but not 22q. Karyotypic abnormalities are also known to be more extensive in atypical and anaplastic meningiomas, and this is supported by our data (1). For instance, only 10% of the grade II meningiomas had no detectable aneuploidy, while 44% of the grade I samples had no aneuploidy. All grade III tumors had multiple whole chromosome arm losses. The genome‐wide SNP assessment is generally concordant with previous reports which indicate that the most frequent losses in grade II tumors are 22q, 1p, 6q and 18, followed by 6p and 14q in that order 12, 22. However, in our data set of grade II tumors, we observed a different rank order where 22q deletions remain the most frequent genetic aberration (85%), followed by 14q (60%), 1p (55%), 6q (25%) and 18q (20%). Thus, chromosomal‐scale abnormalities are a major mechanism of mutation in meningiomas, but with unclear basis at the individual gene level at this time.
To provide insight at the individual gene level, we used the whole‐genome expression data to identify expression patterns in meningiomas of different grade and with different chromosomal loss patterns, and note that these categories correspond well with recurrent or nonrecurrent meningioma, and thus we propose that an expression‐based classifier may ultimately be able to better identify which meningiomas are more likely to recur, but these studies will require prospective analysis of individual patient samples at the time of initial diagnosis with sufficient follow‐up such that the observed chromosomal losses would be detected at recurrence.
The integration of high‐resolution chromosome loss data with whole‐genome expression data provides the opportunity to explore these joint data sets to highlight potential tumor suppressor genes in loss regions in which the candidate genes on the remaining allele have been silenced either through inactivating mutations, epigenetic silencing or nonsense mutations that lead to lower mRNA abundance. We suggest a series of genes that may act as tumor suppressors based on their location within commonly lost genomic intervals and decreased expression in subsets of the meningiomas. For instance, within the common loss regions in the grade III tumors, two of the down‐regulated genes TRIB2 (2p25.1‐p24.3) and ADI1 (2p25.3) may contribute to the malignancy of grade III meningiomas by evading apoptosis. TRIB2 and ADI1 are pro‐apoptotic molecules whose normal expression induces apoptosis (15). However, ADI1 is an invasion suppressor that has been seen to be down‐regulated in tumors (34). Further, cyclin‐dependent kinase inhibitor 1C (CDKN1C) (p57, Kip2) (11p15.5 ) is a noteworthy tumor suppressor candidate in meningioma based on the genetic experiments performed here. Decreased expression of CDKN1C has been associated with the occurrence and progression of pancreatic cancer (37). However, the mechanism for decreased expression detected in the meningiomas warrants further study as decreased expression has been reported because of aberrant methylation in lung, breast and malignant mesotheliomas (11), and de novo mutations in sporadic cancers in Beckwith–Wiedemann syndrome.
CONCLUSIONS
Our analysis assembled the largest set of biopsied meningiomas for combined whole‐genome copy number and expression studies to date. Whole‐genome copy number arrays with over 100 000 SNPs per microarray on 85 patient unique biopsies identified a comprehensive series of large‐scale chromosomal deletions that occurred increasingly in higher‐grade samples with varying profiles. The combination of these data highlights various genes of interest, and provides a clearer picture of the molecular landscape of meningiomas.
Supporting information
Table S1. Patient and biopsy information: time of survival (days), sex, age, recurrence, Ki‐67, etc. Additionally collected meningioma microarray samples GSE4780 and GSE9438.
Table S2. Recurrent vs. newly diagnosed meningioma differentially expressed genes. Grade‐based loss regions.
Table S3. Five group expression gene list tables. MetaCore gene list map elements. Differentially expressed kinase lists. Carvalho et al shared genes.
Table S4. Minimal overlap loss regions and down‐regulated genes by grade. Minimal overlap loss regions and down‐regulated genes by expression group.
Table S5. Meningioma‐specific gene lists. MetaCore gene list map elements. Secreted protein transcript list.
Table S6. Combined UCLA and publicly collected microarrays clustered by five‐group gene expression classifier. Header tracks: World Health Organization grade I (yellow), grade II (blue), grade III (red) and unknown (codified = N, sample numbers highlighted in blue). Meningioma five groups: 1 (yellow), 2 (green), 3 (blue), 4 (purple) and 5 (red). Recurrence status: newly diagnosed meningioma: (codified value = 0), recurrent meningioma: (codified value = 1), unknown status (codified = N). GEO accession source: UCLA (n = 68, GSE16584, orange), (n = 56, GSE4780, gray), (n = 31, GSE9438, dark blue).
Please note: Wiley‐Blackwell are not responsible for the content or functionality of any supporting materials supplied by the authors. Any queries (other than missing material) should be directed to the corresponding author for the article.
Supporting info item
Supporting info item
Supporting info item
Supporting info item
Supporting info item
Supporting info item
ACKNOWLEDGMENTS
The authors wish to thank the UCLA subjects for their participation in this study. The work was supported by the NIH Neuroscience Microarray Consortium UCLA Site (U24NS052108), the UCLA Gene Expression Shared Resource of the Jonsson Comprehensive Cancer Center, the Singleton Brain Tumor Program and the Wilson Meningioma Fund.
REFERENCES
- 1. Al‐Mefty O, Kadri PA, Pravdenkova S, Sawyer JR, Stangeby C, Husain M (2004) Malignant progression in meningioma: documentation of a series and analysis of cytogenetic findings. J Neurosurg 101:210–218. [DOI] [PubMed] [Google Scholar]
- 2. Ammerlaan A, Houben M, Tijssen CC, Wesseling P, Hulsebos TJ (2008) Secondary meningioma in a long‐term survivor of atypical teratoid/rhabdoid tumour with a germline INI1 mutation. Childs Nerv Syst 24:855–857. [DOI] [PMC free article] [PubMed] [Google Scholar]
- 3. Bolstad BM, Irizarry RA, Astrand M, Speed TP (2003) A comparison of normalization methods for high density oligonucleotide array data based on variance and bias. Bioinformatics 19:185–193. [DOI] [PubMed] [Google Scholar]
- 4. Carvalho LH, Smirnov I, Baia GS, Modrusan Z, Smith JS, Jun P et al (2007) Molecular signatures define two main classes of meningiomas. Mol Cancer 6:64. [DOI] [PMC free article] [PubMed] [Google Scholar]
- 5. Chamberlain MC, Tsao‐Wei DD, Groshen S (2004) Temozolomide for treatment‐resistant recurrent meningioma. Neurology 62:1210–1212. [DOI] [PubMed] [Google Scholar]
- 6. Day A, Carlson MR, Dong J, O'Connor BD, Nelson SF (2007) Celsius: a community resource for Affymetrix microarray data. Genome Biol 8:R112. [DOI] [PMC free article] [PubMed] [Google Scholar]
- 7. Freije WA, Castro‐Vargas FE, Fang Z, Horvath S, Cloughesy T, Liau LM et al (2004) Gene expression profiling of gliomas strongly predicts survival. Cancer Res 64:6503–6510. [DOI] [PubMed] [Google Scholar]
- 8. Gentleman RC, Carey VJ, Bates DM, Bolstad B, Dettling M, Dudoit S et al (2004) Bioconductor: open software development for computational biology and bioinformatics. Genome Biol 5:R80. [DOI] [PMC free article] [PubMed] [Google Scholar]
- 9. Gutmann DH, Donahoe J, Perry A, Lemke N, Gorse K, Kittiniyom K et al (2000) Loss of DAL‐1, a protein 4.1‐related tumor suppressor, is an important early event in the pathogenesis of meningiomas. Hum Mol Genet 9:1495–1500. [DOI] [PubMed] [Google Scholar]
- 10. Hehir‐Kwa JY, Egmont‐Petersen M, Janssen IM, Smeets D, Van Kessel AG, Veltman JA (2007) Genome‐wide copy number profiling on high‐density bacterial artificial chromosomes, single‐nucleotide polymorphisms, and oligonucleotide microarrays: a platform comparison based on statistical power analysis. DNA Res 14:1–11. [DOI] [PMC free article] [PubMed] [Google Scholar]
- 11. Kobatake T, Yano M, Toyooka S, Tsukuda K, Dote H, Kikuchi T et al (2004) Aberrant methylation of p57KIP2 gene in lung and breast cancers and malignant mesotheliomas. Oncol Rep 12:1087–1092. [PubMed] [Google Scholar]
- 12. Lamszus K, Kluwe L, Matschke J, Meissner H, Laas R, Westphal M (1999) Allelic losses at 1p, 9q, 10q, 14q, and 22q in the progression of aggressive meningiomas and undifferentiated meningeal sarcomas. Cancer Genet Cytogenet 110:103–110. [DOI] [PubMed] [Google Scholar]
- 13. Lee JY, Finkelstein S, Hamilton RL, Rekha R, King JT, Jr , Omalu B (2004) Loss of heterozygosity analysis of benign, atypical, and anaplastic meningiomas. Neurosurgery 55:1163–1173. [DOI] [PubMed] [Google Scholar]
- 14. Lekanne Deprez RH, Riegman PH, Groen NA, Warringa UL, Van Biezen NA, Molijn AC et al (1995) Cloning and characterization of MN1, a gene from chromosome 22q11, which is disrupted by a balanced translocation in a meningioma. Oncogene 10:1521–1528. [PubMed] [Google Scholar]
- 15. Lin KR, Lee SF, Hung CM, Li CL, Yang‐Yen HF, Yen JJ (2007) Survival factor withdrawal‐induced apoptosis of TF‐1 cells involves a TRB2‐Mcl‐1 axis‐dependent pathway. J Biol Chem 282:21962–21972. [DOI] [PubMed] [Google Scholar]
- 16. Loven D, Hardoff R, Sever ZB, Steinmetz AP, Gornish M, Rappaport ZH et al (2004) Non‐resectable slow‐growing meningiomas treated by hydroxyurea. J Neurooncol 67:221–226. [DOI] [PubMed] [Google Scholar]
- 17. Lusis E, Gutmann DH (2004) Meningioma: an update. Curr Opin Neurol 17:687–692. [DOI] [PubMed] [Google Scholar]
- 18. Mailand N, Lukas C, Kaiser BK, Jackson PK, Bartek J, Lukas J (2002) Deregulated human Cdc14A phosphatase disrupts centrosome separation and chromosome segregation. Nat Cell Biol 4:317–322. [DOI] [PubMed] [Google Scholar]
- 19. McMullen KP, Stieber VW (2004) Meningioma: current treatment options and future directions. Curr Treat Options Oncol 5:499–450. [DOI] [PubMed] [Google Scholar]
- 20. Mischel PS, Shai R, Shi T, Horvath S, Lu KV, Choe G et al (2003) Identification of molecular subtypes of glioblastoma by gene expression profiling. Oncogene 22:2361–2373. [DOI] [PubMed] [Google Scholar]
- 21. Nutt CL, Mani DR, Betensky RA, Tamayo P, Cairncross JG, Ladd C et al (2003) Gene expression‐based classification of malignant gliomas correlates better with survival than histological classification. Cancer Res 63:1602–1607. [PubMed] [Google Scholar]
- 22. Ozaki S, Nishizaki T, Ito H, Sasaki K (1999) Comparative genomic hybridization analysis of genetic alterations associated with malignant progression of meningioma. J Neurooncol 41:167–174. [DOI] [PubMed] [Google Scholar]
- 23. Perry A, Gutmann DH, Reifenberger G (2004) Molecular pathogenesis of meningiomas. J Neurooncol 70:183–202. [DOI] [PubMed] [Google Scholar]
- 24. Peyrard M, Pan HQ, Kedra D, Fransson I, Swahn S, Hartman K et al (1996) Structure of the promoter and genomic organization of the human beta′‐adaptin gene (BAM22) from chromosome 22q12. Genomics 36:112–117. [DOI] [PubMed] [Google Scholar]
- 25. Peyrard M, Seroussi E, Sandberg‐Nordqvist AC, Xie YG, Han FY, Fransson I et al (1999) The human LARGE gene from 22q12.3‐q13.1 is a new, distinct member of the glycosyltransferase gene family. Proc Natl Acad Sci U S A 96:598–603. [DOI] [PMC free article] [PubMed] [Google Scholar]
- 26. Phillips HS, Kharbanda S, Chen R, Forrest WF, Soriano RH, Wu TD et al (2006) Molecular subclasses of high‐grade glioma predict prognosis, delineate a pattern of disease progression, and resemble stages in neurogenesis. Cancer Cell 9:157–173. [DOI] [PubMed] [Google Scholar]
- 27. Ragel BT, Jensen RL (2005) Molecular genetics of meningiomas. Neurosurg Focus 19:E9. [DOI] [PubMed] [Google Scholar]
- 28. Rich JN, Hans C, Jones B, Iversen ES, McLendon RE, Rasheed BK et al (2005) Gene expression profiling and genetic markers in glioblastoma survival. Cancer Res 65:4051–4058. [DOI] [PubMed] [Google Scholar]
- 29. Riemenschneider MJ, Perry A, Reifenberger G (2006) Histological classification and molecular genetics of meningiomas. Lancet Neurol 5:1045–1054. [DOI] [PubMed] [Google Scholar]
- 30. Schmitz U, Mueller W, Weber M, Sévenet N, Delattre O, Von Deimling A (2001) INI1 mutations in meningiomas at a potential hotspot in exon 9. Br J Cancer 84:199–201. [DOI] [PMC free article] [PubMed] [Google Scholar]
- 31. Shai R, Shi T, Kremen TJ, Horvath S, Liau LM, Cloughesy TF et al (2003) Gene expression profiling identifies molecular subtypes of gliomas. Oncogene 22:4918–4923. [DOI] [PubMed] [Google Scholar]
- 32. Slater HR, Bailey DK, Ren H, Cao M, Bell K, Nasioulas S et al (2005) High‐resolution identification of chromosomal abnormalities using oligonucleotide arrays containing 116,204 SNPs. Am J Hum Genet 77:709–726. [DOI] [PMC free article] [PubMed] [Google Scholar]
- 33. Sulman EP, White PS, Brodeur GM (2004) Genomic annotation of the meningioma tumor suppressor locus on chromosome 1p34. Oncogene 23:1014–1020. [DOI] [PubMed] [Google Scholar]
- 34. Uekita T, Gotoh I, Kinoshita T, Itoh Y, Sato H, Shiomi T et al (2004) Membrane‐type 1 matrix metalloproteinase cytoplasmic tail‐binding protein‐1 is a new member of the cupin superfamily. A possible multifunctional protein acting as an invasion suppressor down‐regulated in tumors. J Biol Chem 279:12734–12743. [DOI] [PubMed] [Google Scholar]
- 35. Ware ML, Larson DA, Sneed PK, Wara WW, McDermott MW (2004) Surgical resection and permanent brachytherapy for recurrent atypical and malignant meningioma. Neurosurgery 54:55–63; discussion 4. [DOI] [PubMed] [Google Scholar]
- 36. Wrobel G, Roerig P, Kokocinski F, Neben K, Hahn M, Reifenberger G, Lichter P (2005) Microarray‐based gene expression profiling of benign, atypical and anaplastic meningiomas identifies novel genes associated with meningioma progression. Int J Cancer 114:249–256. [DOI] [PubMed] [Google Scholar]
- 37. Yue H, Jiang HY (2005) Expression of cell cycle regulator p57kip2, cyclinE protein and proliferating cell nuclear antigen in human pancreatic cancer: an immunohistochemical study. World J Gastroenterol 11:5057–5060. [DOI] [PMC free article] [PubMed] [Google Scholar]
Associated Data
This section collects any data citations, data availability statements, or supplementary materials included in this article.
Supplementary Materials
Table S1. Patient and biopsy information: time of survival (days), sex, age, recurrence, Ki‐67, etc. Additionally collected meningioma microarray samples GSE4780 and GSE9438.
Table S2. Recurrent vs. newly diagnosed meningioma differentially expressed genes. Grade‐based loss regions.
Table S3. Five group expression gene list tables. MetaCore gene list map elements. Differentially expressed kinase lists. Carvalho et al shared genes.
Table S4. Minimal overlap loss regions and down‐regulated genes by grade. Minimal overlap loss regions and down‐regulated genes by expression group.
Table S5. Meningioma‐specific gene lists. MetaCore gene list map elements. Secreted protein transcript list.
Table S6. Combined UCLA and publicly collected microarrays clustered by five‐group gene expression classifier. Header tracks: World Health Organization grade I (yellow), grade II (blue), grade III (red) and unknown (codified = N, sample numbers highlighted in blue). Meningioma five groups: 1 (yellow), 2 (green), 3 (blue), 4 (purple) and 5 (red). Recurrence status: newly diagnosed meningioma: (codified value = 0), recurrent meningioma: (codified value = 1), unknown status (codified = N). GEO accession source: UCLA (n = 68, GSE16584, orange), (n = 56, GSE4780, gray), (n = 31, GSE9438, dark blue).
Please note: Wiley‐Blackwell are not responsible for the content or functionality of any supporting materials supplied by the authors. Any queries (other than missing material) should be directed to the corresponding author for the article.
Supporting info item
Supporting info item
Supporting info item
Supporting info item
Supporting info item
Supporting info item