

Abstract
Proton diffusion along membrane surfaces is thought to be essential for many cellular processes such as energy transduction. Commonly, it is treated as a succession of jumps between membrane-anchored proton-binding sites. Our experiments provide evidence for an alternative model. We released membrane-bound caged protons by UV flashes and monitored their arrival at distant sites by fluorescence measurements. The kinetics of the arrival is probed as a function of distance for different membranes and for different water isotopes. We found that proton diffusion along the membrane is fast even in the absence of ionizable groups in the membrane, and it decreases strongly in D2O as compared to H2O. We conclude that the fast proton transport along the membrane is dominated by diffusion via interfacial water, and not via ionizable lipid moieties.
Keywords: chemiosmotic theory, fluorimetry, planar bilayer, proton-collecting antenna
Proton diffusion along membrane surfaces is thought to provide an efficient link between sites of proton release and proton consumption (1). Membrane surfaces seem to interact with membrane-bound protein to increase proton-delivery rates to buried intraprotein sites. For example, wiring of the membrane-bound proton pump cytochrome c oxidase via specific amino acid residues to the membrane surface enables fast proton transfer to the catalytic site (2). Similarly, proton shuttling along the membrane from the mouth of the monocarboxylate transporter to neighboring carbonic anhydrase molecules was reported to be essential for an efficient lactate import via the cotransporter (3, 4).
The mechanism that is responsible for the two-dimensional confinement of protons to the membrane surface is unclear. According to molecular dynamics simulations, phosphate and carbonyl groups stabilize the hydrated excess proton. However, proton release from these groups was so slow that the hydrated proton essentially followed the lipid motion (5).
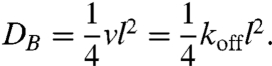
This observation agrees well with theoretical predictions of the lateral proton (or hydroxyl ion) diffusion constant DB. Commonly the lateral proton movement along the membrane surface is treated as a succession of multiple binding events, each followed by proton release. Because of the short distances between the ionizable membrane-anchored groups B, DB is entirely determined by the reaction constants of B. The protonation of most ionizable groups is diffusion limited, so that kon is in the range of 2 × 10¹⁰ s-1 M-1 (6). Consequently, the equilibrium constant determines the dissociation rate koff. For example, the pK ∼ 9.6 (7) of phosphatidylethanolamine (PE) corresponds to a koff = 2 × 10(10-pK) s-1 ≈ 5 s-1. Because koff sets the upper limit to the number of jumps v per unit time, DB is equal to (8)
 |
[1] |
Assuming that the average length l of a hop is equal to the distance between two PE molecules (approximately  ), we arrive at DB ∼ 10-14 cm2 s-1. Because the diffusion constant of a lipid molecule is orders of magnitude larger (9), excess proton and lipid move together.
pK ∼ 2.2 of phosphatidylcholine (PC) (6) corresponds to koff ≈ 2 × 10(10-2.2) s-1 ≈ 1.3 × 10⁸ s-1. Accordingly, Eq. 1 predicts that substitution of membrane PE by PC speeds up diffusion by seven orders of magnitude. But with DB ∼ 10-7 cm2 s-1, the time interval τb ∼ δ2/4DB, which the surface proton requires to cross the distance δ between two spots on the membrane is at least an order of magnitude larger than the respective time interval τc ∼ δ2/6DC of a bulk proton. Assuming that the diffusion coefficient DC of the proton carrier in the bulk is approximately 5 × 10⁻⁶ cm2 s-1 or higher, we arrive at a ratio τb/τc > 75. That is, the surface proton would be unable to compete with the faster bulk protons, and the contribution of the surface proton to processes such as energy consumption would be physiologically irrelevant.
We conclude that there is a discrepancy between the biological significance attributed to the surface proton and the current concept of its movement along the membrane. In addition, we found that DB on PC membranes is orders of magnitude larger (10–12) than suggested by the “jump” model (Eq. 1). The goal of the present work was to solve the conundrum. Therefore, we tested the jump model of lateral proton diffusion by changing the lipid composition of freestanding planar membranes. The observed independence of DB on proton release rates from ionizable lipids indicated that the jump model is invalid. A lateral proton transport mechanism must exist, which is independent from jumps between ionizable membrane moieties.
Theoretical Model
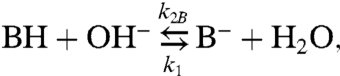
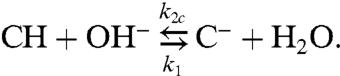
The immobile buffer molecules B imbedded in the membrane compete with mobile buffer molecules C in the aqueous solutions for the proton:
 |
[2] |
 |
[3] |
In addition, transfer reactions between the mobile and immobile buffer molecules should be considered:
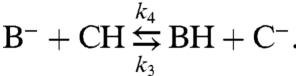 |
[4] |
The differential equations for the combined processes of diffusion and chemical reactions (formulas 2–4) adopt the following form (13):
 |
[5] |
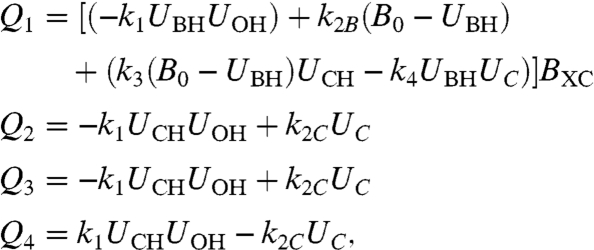
where U is the concentration of the ith species. i = 1, 2, 3, and 4 denotes the protonated fixed buffer BH, the protonated soluble pH buffer, CH; the hydroxyl anion, OH-; and the deprotonated soluble pH buffer, C-, respectively. Proton movement along the surface is characterized by the diffusion coefficient DB. It is described as a one-dimensional process because H+ release from a long stripe allowed reduction of system dimensionality (Fig. 1). The rates of expenditure Qi of the ith species were calculated from formulas 2–4:
 |
[6] |
where B0 = UB- + UBH is the total concentration of the immobile buffer. Because mobile buffer molecules outnumber B0 by orders of magnitude, Eq. 4 may be neglected in Q2 and Q4. All rate constants are known (compare Table S1). Thus, the model contained only two variable (unknown) parameters, the surface diffusion coefficient DB and the probability BXC of proton release from the surface into the bulk, which were both varied to fit the model to the experimental results. According to BXC = exp(-ΔG/RT), BXC may serve as a rough measure of the energy barrier ΔG to proton surface to bulk release. A solution for the system of partial differential equations (PDEs) (Eqs. 5 and 6) as obtained via an adaptive-grid finite-difference solver for time-dependent parabolic two-dimensional PDEs (14).
Fig. 1.

Scheme of the experiments carried out on a planar bilayer lipid membrane. A UV flash releases protons from (6,7-dimethoxycoumarin-4-yl)methyl (DMCM) caged diethyl phosphate in the rectangular area (red stripe). A photodiode detects the arrival of the protons in the blue square. Therefore, a pH probe [fluorescein phosphatidylethanolamine (FPE)] is exited in the green square. An example of the time course of fluorescence changes is given (Inset). τmax is the time interval between proton release and appearance of fluorescence minimum in the observation area.
Results
First we tested whether lateral proton diffusivity between the site of release and the site of measurement (Fig. 1) depended on the choice of the lipid. We used glycerolmonoleate (GMO), diphytanoyl phosphatidylcholine (DPhPC), or diphytanoyl phosphatidylethanolamine (DPhPE). A UV flash released the protons in less than 2 ns from membrane-bound (6,7-dimethoxycoumarin-4-yl)methyl (DMCM) caged diethyl phosphate (11), which was adsorbed to freestanding horizontal planar lipid bilayers. The resulting decrease of membrane surface pH was indicated by the decrease of FPE fluorescence (Fig. 1). For all three lipids the time τmax (compare Fig. 1 Inset) between the flash and the subsequent appearance of the maximum of the pH shift was equal to roughly 0.24 s (Fig. 2). Assuming a point-like H+ source and a dimensionless measurement spot, τmax, of approximately 0.24 s allows calculation of an apparent diffusion coefficient Dapp ≈ s2/4τmax ∼ 5 × 10⁻⁵ cm2 s-1 for all three lipid membranes, where s = 70 μm is the distance between the site of release and the measurement spot.
Fig. 2.

Kinetics of proton release from ionizable groups of three different lipids (Top) and kinetics of fluorescence changes on top of three different lipid bilayers due to lateral proton migration (Bottom). The observation area was located at a distance of 70 μm from the area of proton release. Because all FPE molecules are surrounded by DPhPC or DPhPE molecules, they are anticipated to accept protons, which are released from these molecules. GMO does not possess ionizable moieties so that in the case of two-dimensional diffusion, proton release from one FPE molecule seems to be required before the next FPE molecule may pick up the proton. Despite the huge differences in proton release rates from the different lipids, τmax for all three lipid bilayers was similar. That is, lateral proton diffusivity is independent of the choice of the lipid. The buffer contained 0.1 mM Capso (pH 9.0) and 100 mM NaCl.
For a more sophisticated analysis, we fitted the PDE system (Eqs. 5 and 6) to the experimental traces (Fig. 2). The effective surface area per proton-binding site S0 and the thickness Y0 = 20 Å of the layer containing the proton acceptor molecules enabled calculation of B0: B0 = (NAY0S0)-1. We assumed surface areas per GMO, DPhPE, or DPhPC molecule of 38 Å2, 67 Å2, and 71 Å2, respectively. Because GMO itself does not contain ionizable moieties, S0 ∼ 4,000 Å2 was derived from the relative FPE concentration.
For GMO membranes, BXC ∼ 3 × 10⁻⁶ resulted in a reasonable fit for times t ∼ τmax. Such BXC corresponds to an energy barrier of approximately 13 RT (where R is the gas constant and T is the temperature). In case of smaller barriers, the protons were all lost into the bulk before arriving at the measurement site. For DPhPC and for DPhPE membranes, BXC was even smaller (Fig. 2). The increased barrier for proton surface to bulk release reflects the availability of membrane-anchored buffer molecules. Most importantly, Fig. 2 also shows that the jump model is invalid. In contrast to the seven orders of magnitude difference predicted for proton diffusion along the three lipids, a single DB value of about (5 ± 1) × 10-5 cm2 s-1 allowed fitting of all experimental traces for t ≤ τmax. For t > τmax the theoretical H+ concentrations decayed back to baseline faster than the experimental traces. Most conceivably, the discrepancy was due to the fact that the model did not take into account the minor fraction of protons, which was released from caged compounds dissolved in the bulk. Their presence cannot be completely avoided even by focusing the UV flash onto a small membrane spot and using hydrophobic caged protons. These “bulk” protons did not confound our theoretical analysis because (i) they were outnumbered by “membrane” protons and (ii) they arrived at the measurement site after the membrane protons due to the larger travel distance.
Proton diffusion through the bulk is not compatible with the observed τmax of approximately 0.24 s because (i) the mobile buffer Capso (3-(cyclohexylamino)-2-hydroxy-1-propanesulfonic acid) would have carried approximately 2/3 of the bulk protons and because the characteristic time of Capso’s diffusion over a distance of 70 μm would have been ≈s2/6D2 ∼ 1.2 s. To arrive at these numbers, we first estimated buffer capacity β:
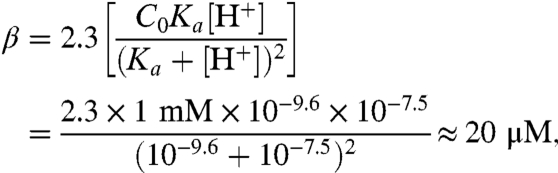 |
where C0 = UC- + UCH was the total Capso concentration. The respective diffusion coefficients D2 and D4 were both equal to about 7 × 10⁻⁶ cm2 s-1. We assumed that a spatially invariant β may be used, which was calculated for an average pH of 7.5, although pH increased from 7.0 in the area where the proton is uncaged (index u) to pH 8.0 in the observation area (index o). The superposition of H+, of OH-, and of buffer fluxes result in the total flux J:
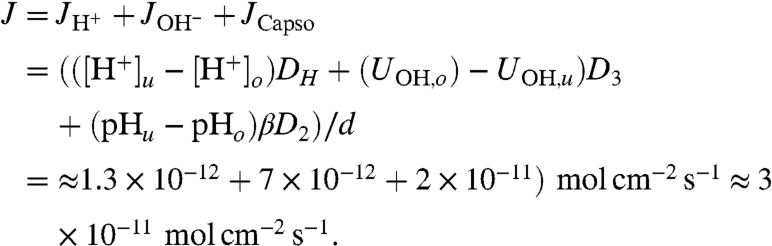 |
Because H+ and OH- diffusion contributed less than 30% to J, τmax of approximately 0.24 s (Fig. 2) must be the result of proton migration along the membrane surface.
We figured that an increase in mobile buffer concentration eventually leads to a situation where all excess protons are captured by buffer molecules and thus reach the measurement spot by bulk diffusion. Indeed at 1.2 mM Capso τmax was equal to 1.02 s on a GMO membrane (Fig. 3). This observation indicated that in case of large β-surface proton diffusion was negligible. Vice versa, it confirmed that in case of small β (Fig. 2), the proton diffused laterally along the membrane.
Fig. 3.

The increase in mobile buffer concentration shifts the proton pathway from surface to bulk diffusion. Shown are representative time traces obtained for proton migration between two spots on a GMO bilayer that are 70 μm apart. The buffer concentration increased from 0.1 mM Capso to 1.2 mM Capso as indicated. All other conditions were as in Fig. 2. The corresponding τmax increased from 0.24 to 1.02 s. The former value is incompatible with charge transport through the bulk. In contrast, the latter value meets the theoretical expectation for a mix of charge transport by Capso and OH- diffusion (see text).
To increase the accuracy of Dapp and DB determination, we recorded families of traces where all conditions but s were kept constant. Making a global fit of the PDEs to such complete sets of experimental traces revealed DB ≈ 3.5 × 10⁻⁵ cm2 s-1 and BXC ≈ 3 × 10⁻⁶ for GMO membranes (Fig. 4). Using these model parameters, we calculated a time series of signal amplitudes as a function of the distance the area of proton release (Fig. S1). For the reasons outlined above, the model described the experiment satisfactorily only for t ≤ τmax. Plotting τmax versus s2 (Fig. 4 Inset) returned Dapp ≈ 4 × 10⁻⁵ cm2 s-1. Thus, Dapp and DB are in reasonable agreement with each other (Table S2).
Fig. 4.

Kinetics of proton diffusion over different distances s (45, 55, 70, 82, 95, and 120 μm) along a GMO membrane. The buffer contained 0.1 mM Capso (pH 9.0) and 100 mM NaCl. The black lines show a fit of the set of differential equations for diffusion and chemical reactions to the experimental profiles with DB = 3 × 10⁻⁵ cm2 s-1 and BXC = 3 × 10⁻⁶. (Inset) The dependence of τmax on s2 for GMO (green line) and DPhPC (black line) membranes. The data for proton diffusion along a DPhPC membrane were taken from a previous publication (10).
To confirm that BXC is a meaningful quantity, we carried out a model independent analysis. We estimated that surface pH increased from 7.3 at time point τmax ,o1 at the first site (so1 = 45 μm) to 8.1 at τmax ,o2 at the second site (so2 = 55 μm). Assuming (i) that all protons arrived exclusively due to surface diffusion at both the first and at the second sites and (ii) that this diffusion is due to hops of a unitary length of approximately 0.25 nm allowed calculation of the apparent probability Bapp of proton surface to bulk release during a single hop:
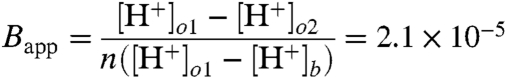 |
where n and [H+]b denote the number of proton hops and the proton bulk concentration, respectively. Because Bapp ignores the finite sizes of release and of measurement areas as well as proton bulk diffusion, it may be considered to be in reasonable agreement with BXC. BXC and Bapp suggest that the energy barrier to proton release from a GMO membrane amounts to about 11–13 RT.
Carrying out the same analysis for proton diffusion along DPhPC membranes revealed BXC ≈ 5.5 × 10⁻⁷ and a DB of 2.5 × 10⁻⁵ cm2 s-1 (data were taken from ref. 10). Calculation of the time series of the signal amplitudes as a function of the distance visualizes that (i) the excess proton stays longer at the surface (Fig. S1) and that lateral migration is slower than on a GMO membrane (Fig. S2). Recalculation of Dapp (with s taken as the distance between the midpoints of uncaging and measurement areas) led to 2.5 × 10⁻⁵ cm2 s-1. Because pH at the corresponding τmax decreased from 8.4 to 8.2 for so1 = 57 μm and so2 = 76 μm, respectively, we arrive at Bapp ≈ 5.5 × 10⁻⁶. Accordingly, the barrier responsible for retarded proton release from a DPhPC membrane is in the range of 12–16 RT.
From the pK of FPE, which is equal to approximately 8.5, follows that koff = 2 × 10(10-8.5) s-1 ≈ 63 s-1; i.e., it takes FPE 16 ms to receive a proton from another FPE molecule. Because FPE is the sole proton-binding moiety in our GMO membranes, Eq. 1 predicts DB ∼ of 10-13 cm2 s-1. That is, if proton surface diffusion was due to jumps between binding sites, the proton should travel six orders of magnitude faster along the PC membrane as compared to GMO membranes. In contrast, the difference between the DB (Dapp) values obtained for GMO and DPhPC was equal or smaller than two.
We varied the surface density of ionizable residues to probe the relative contributions of diffusion via lipids and via water. For each concentration of PE and lipid bound dye molecules in GMO bilayers we carried out experiments similar to the one in Fig. 4. Instead of observing a 3.2-fold difference in proton diffusivity due to the decrease in l, Dapp decreased only 2-fold upon a 10-fold increase of immobile buffer concentration (Fig. S3). Moreover, the effects observed upon introducing PE or FPE molecules were similar, despite their different pK values of 8.4 and 9.6. It is worth noting that even at the lowest UB0 value, the time required to cross the distance between fixed buffer sites by diffusion is orders of magnitude smaller than the time required to release the proton from any of these sites. That is, according to Eq. 1 release times > 0.1 s have to be compared with τD ≈ s2/4Dapp ≤ (3 nm)2/4 × 2 × 10-9 m2 s-1 ∼ 1 ns.
If the residence time of a proton on the immobile buffer does not correlate with its mobility on the membrane surface, a mechanism that is different from the jump model should exist. We substituted H2O for D2O and measured DB again to test whether the proton (i) migrates along the surface by a mechanism similar to the one in bulk water, in which the rate-determining step is hydrogen-bond cleavage or (ii) moves along hydrogen-bonded chains where the fast proton displacement within an individual H bond from the donor to the acceptor is rate limiting. In the latter case, we expected an isotope effect ranging from 2.5 to 7 (15). In the former case, the kinetic isotope effect should be approximately  (16). To account for the effect that the reading taken from a glass pH electrode deviates from the true pD of D2O solutions by 0.4 units (17), we carried out our D2O experiments at pD 9.4. Because deuterons generally are held more tightly than protons, we solved our system of PDEs assuming that pK of all fixed and mobile buffers increased by 0.5 units in D2O (17).
We obtained Dapp ∼ 10-5 cm2 s-1 for both GMO and DPhPC membranes in heavy water (Fig. 5). Most notably, the barrier for proton surface to bulk release decreased. Fitting the PDEs to the time traces with DPhPC was possible with rather small DB (approximately 4 × 10⁻⁶ cm2 s-1). This result suggests that surface diffusion did not make a significant contribution to the overall proton transport in D2O.
Fig. 5.

Kinetics of charge diffusion in heavy water over different distances s (55, 70, 95, and 110 μm) along a GMO membrane (Upper) and a DPhPC membrane (Lower). Apparently, the kinetics of D+ diffusion is similar for both membranes. The buffer contained 0.1 mM Capso (pH 9.4) and 100 mM NaCl. The black lines show a fit of the set of differential equations for diffusion and chemical reactions to the experimental profiles. Fitting was possible with DB ranging from 3 × 10⁻² cm2 s-1 to 1 × 10⁻⁵ cm2 s-1 and BXC values between 4 × 10⁻³ and 10-5, indicating that the contribution of surface diffusion to the overall transport rate was rather small. In view of the large error for DB, the isotope effect was determined from Dapp. The two- or fourfold steeper slope for experiments carried out in H2O as compared to D2O indicates that proton surface migration is subject to a large isotope effect.
If the vast majority of protons reach the measurement spot via bulk diffusion, an increase in mobile buffer concentration should have only a small effect on τmax. In line with these considerations, running the experiment of Fig. 3 in D2O revealed a 10% increase of τmax (from 1.13 to 1.24 s) upon a 12-fold increase of β (Fig. 6). The contrast to the 5-fold increase of τmax in normal water confirms that the pathways of a proton and a deuterion are very different: While the former moves preferentially along the membrane surface, the latter is transported via the bulk solution.
Fig. 6.

The increase in mobile buffer concentration has little effect on the pathway of charge transport in heavy water. Shown are representative time traces obtained for D+ migration between two spots on a GMO bilayer that were 70 μm apart. The buffer concentration increased from 0.1 mM Capso to 1.2 mM Capso. All other conditions were as in Fig. 2. The corresponding τmax increased from 1.13 to 1.24 s. Both values are compatible with charge transport via bulk. A small contribution of surface diffusion in the former case may explain the difference in kinetics.
The lack of surface diffusion hampered the calculation of Bapp in D2O. Judging from Dapp, the isotope effect varies between two and four for DPhPC membranes and GMO membranes, respectively. The “true” isotope effect may be much larger. Its calculation would require the exact value of DB to be known. However, under conditions where surface diffusion is not the rate limiting step, determination of DB is subject to extremely large errors.
Discussion
Our experiments have shown that proton movement along the surface of planar membranes does not involve jumps between membrane-anchored proton-binding sites. We obtained four lines of evidence:
With approximately 4 × 10⁻⁵ cm2 s-1 the experimentally observed proton diffusivity is orders of magnitude faster then expected (compare Eq. 2) from any of the proton release constants from PE or PC headgroups or from the lipid anchored fluorescent dye (Fig. 2).
If proton release (i.e., breakage of hydrogen bonds) was the rate limiting step, interfacial diffusion in D2O was expected to be
 slower than in H2O. However, the observed isotope effect is at least twice as large.
Except the rare FPE molecules, GMO does not offer proton-binding sites, yet long-range lateral proton migration occurs.
If fixed membrane buffers were involved in lateral proton migration, the difference in proton release rates would require that interfacial proton diffusion along PC membranes (approximately 10-7 cm2 s-1) is seven orders of magnitude faster than diffusion along PE membranes (approximately 10-14 cm2 s-1). In contrast, we did not detect a significant difference between the interfacial proton mobilities for the two lipids. The same holds if OH- (instead of H+) accomplishes charge transport. Although the equation for koff = 2 × 10(10-(14-pK)) s-1 is different, Eq. 1 would still predict DB values that are seven orders apart for PE and PC.
Calculation of koff from lipid pK and the diffusion-controlled on rate is valid for a group in equilibrium with the solution. At close distance, i.e., in the case of neighboring lipids with just one or two intervening water molecules, proton transfer may occur along preexisting hydrogen bonds. In contrast to the equilibrium situation, the time constant for (PC)PE-hydroxide-PE(PC) or (PC)PE-hydronium-PE(PC) proton transfer does not depend on pKa. Calculation according to Marcus theory reveals that the apparent intrinsic barrier ΔG≠ for the bimolecular proton transfer with one intervening water molecule is typically about 5 kcal/mol (18). In case of two intervening water molecules it increases to 7–12 kcal/mol. Interestingly, Marcus theory also reveals that the intrinsic barrier ΔG≠ for this kind of proton transfer reactions is approximately 1 kcal/mol (18). This value is well compatible with (i) the observed DB on both PE and PC membranes. However, on a GMO membrane proton acceptor and proton donor are separated by approximately 14 water molecules. Bimolecular proton transfer with 14 intervening water molecules seems to be unrealistic, because it would require extremely high values of ΔG0. Thus, the nonequilibrium approach reveals the same result as the equilibrium assumption: The proton migration along the surface does not involve jumps between membrane-anchored proton-binding sites.
If proton-binding sites are not a prerequisite for proton movement along the membrane surface, the origin of the energetic barrier for proton surface to bulk release is unclear. According to molecular dynamics simulations, phosphate groups may stabilize the hydrated excess proton (19). However, proton release was so slow that the hydrated proton essentially followed the lipid motion (5). Because such a slow lateral migration is in contrast to our experimental results, phosphate groups cannot hold to be responsible for the retarded surface to bulk transfer. Moreover, GMO does not contain phosphate moieties and yet lateral diffusion occurs.
Alternatively, computer simulations suggest that the barrier is due to the structure of the excess proton. It donates three hydrogen bonds to water molecules, but accepts none. As it strains the hydrogen-bond pattern of the surrounding liquid, this configuration is less stable in the bulk liquid (20). The resulting barrier was determined to be approximately 6 RT adjacent to membranes made of carbon nanotubes (20). This observation does not explain why the barrier adjacent to GMO membranes (8.8–10 RT) is smaller than that in the vicinity of DPhPC membranes (12–16 RT).
However, in the basic pH experimental environment charge transport is likely to be accomplished by the hydroxyl ion. In contrast to the Eigen cation, the “active” OH- adopts a tetrahedral OH-(H2O)3 configuration closely resembling that of a bulk water molecule (21). That is, OH-(H2O)3 does not strain bulk water structure as does the Eigen cation  , and therefore structural considerations do not suggest a surface location. Rather, electrostatic attraction keeps OH- close to the surface. The most likely source of this attraction is the membrane dipole potential φD. For GMO membranes φD is about 100 mV (22–24) with an orientation such that the membrane interior is positive. For the hydroxyl anion, φD corresponds to an energy barrier of ΔGD = zFφD ≈ 4 RT. Besides, the presence of carbonyl groups in DPhPC augments φD to about 220 mV (24, 25), so that ΔGD would be equal to 8.8 RT. That is, the higher φD of phospholipid membranes could explain the increased energy barrier to hydroxyl anion release, which we observed close to PE and PC bilayers. However, so far experimental proof for φD’s contribution to the energy barrier is missing.
Both hydroxyl ion mobility and proton diffusivity are dominated by second-shell hydrogen-bond cleavage, and the isotope effect in the two cases is limited to 1.4–1.7 (26). The larger isotope effect observed in our experiment would be in line with the idea that proton transfer within the H bond is rate limiting, i.e., it is compatible with the view that lateral transport along the membrane water interface occurs along extended hydrogen bonded chains. These chains do not necessarily include ionizable groups on the membrane surface. Rather water structuring at the interface seems to be mandatory for both providing the pathway and for generating the energy barrier opposing hydroxyl anion surface to bulk release.
Materials and Methods
Planar Membranes.
Horizontal planar bilayer lipid membranes were formed from DPhPC (Avanti Polar Lipids), DPhPE (Avanti Polar Lipids) and GMO (Sigma-Aldrich) dissolved at 20 mg/mL or alternatively at 100 mg/mL for GMO in n-decane (Merck). The membrane-forming solution additionally contained from 0.5 to 3.5 mol % of FPE (Molecular Probes). The formation of the membrane was performed by spreading this solution across a circular aperture 0.2–0.3 mm in diameter in a diaphragm separating two aqueous phases of Teflon chamber. Top and lower aqueous phases had volumes of 0.5 mL and 2 mL, respectively.
The aqueous phase located directly under the membrane was about 100 μm in height and confined by a lucent basement (Seal View, Roth). The aqueous salt solution (100 mM NaCl) inside the chamber was buffered at pH 9 with 0.1 mM Capso (Sigma-Aldrich) if not stated otherwise.
Kinetic Measurements.
The hydrophobic caged proton, (6,7-dimethoxycoumarin-4-yl)methyl diethyl phosphate (11) released protons, 6,7-dimethoxy-4-(hydroxymethyl)coumarin, and a diethyl phosphate anion in a region of interest when exposed to UV light emitted by a xenon flash lamp (Rapp Opto Electronics). For fluorescent excitation of the pH indicator FPE in a second region of interest, we used a 150-W xenon lamp, connected via a monochromator to an inverse microscope (20× objective). A photodiode collected the fluorescent light that went backward into the objective. After being passed to a current amplifier (Heka, EPC9) the signal was digitized and stored in a personal computer for further analysis. Three sets of diaphragms were used (compare Fig. 1) to define the rectangular-shaped stripe for proton release, the quadratic area of fluorescence excitation, and quadratic area of emission measurements (10). The distance between the areas of release and measurement varied between about 45 μm and 130 μm, respectively.
Supplementary Material
Acknowledgments.
Financial support by the Deutsche Forschungsgemeinschaft (Po 533/5 to P.P.) is gratefully acknowledged.
Footnotes
The authors declare no conflict of interest.
This article is a PNAS Direct Submission.
This article contains supporting information online at www.pnas.org/lookup/suppl/doi:10.1073/pnas.1107476108/-/DCSupplemental.
References
- 1.Williams RJP. Proton circuits in biological energy interconversions. Annu Rev Biophys Biophys Chem. 1988;17:71–97. doi: 10.1146/annurev.bb.17.060188.000443. [DOI] [PubMed] [Google Scholar]
- 2.Ojemyr LN, Lee HJ, Gennis RB, Brzezinski P. Functional interactions between membrane-bound transporters and membranes. Proc Natl Acad Sci USA. 2010;107:15763–15767. doi: 10.1073/pnas.1006109107. [DOI] [PMC free article] [PubMed] [Google Scholar]
- 3.Becker HM, Deitmer JW. Nonenzymatic proton handling by carbonic anhydrase II during H+-lactate cotransport via monocarboxylate transporter 1. J Biol Chem. 2008;283:21655–21667. doi: 10.1074/jbc.M802134200. [DOI] [PubMed] [Google Scholar]
- 4.Becker HM, Klier M, Schüler C, McKenna R, Deitmer JW. Intramolecular proton shuttle supports not only catalytic but also noncatalytic function of carbonic anhydrase II. Proc Natl Acad Sci USA. 2011;108:3071–3076. doi: 10.1073/pnas.1014293108. [DOI] [PMC free article] [PubMed] [Google Scholar]
- 5.Yamashita T, Voth GA. Properties of hydrated excess protons near phospholipid bilayers. J Phys Chem B. 2010;114:592–603. doi: 10.1021/jp908768c. [DOI] [PubMed] [Google Scholar]
- 6.Gutman M, Nachliel E. The dynamic aspects of proton transfer processes. Biochim Biophys Acta. 1990;1015:391–414. [Google Scholar]
- 7.Tsui FC, Ojcius DM, Hubbell WL. The intrinsic pKa values for phosphatidylserine and phosphatidylethanolamine in phosphatidylcholine host bilayers. Biophys J. 1986;49:459–468. doi: 10.1016/S0006-3495(86)83655-4. [DOI] [PMC free article] [PubMed] [Google Scholar]
- 8.Branden M, Sanden T, Brzezinski P, Widengren J. Localized proton microcircuits at the biological membrane-water interface. Proc Natl Acad Sci USA. 2006;103:19766–19770. doi: 10.1073/pnas.0605909103. [DOI] [PMC free article] [PubMed] [Google Scholar]
- 9.Horner A, Antonenko YN, Pohl P. Coupled diffusion of peripherally bound peptides along the outer and inner membrane leaflets. Biophys J. 2009;96:2689–2695. doi: 10.1016/j.bpj.2008.12.3931. [DOI] [PMC free article] [PubMed] [Google Scholar]
- 10.Serowy S, et al. Structural proton diffusion along lipid bilayers. Biophys J. 2003;84:1031–1037. doi: 10.1016/S0006-3495(03)74919-4. [DOI] [PMC free article] [PubMed] [Google Scholar]
- 11.Geissler D, et al. (Coumarin-4-yl)methyl esters as highly efficient, ultrafast phototriggers for protons and their application to acidifying membrane surfaces. Angew Chem Int Ed Engl. 2005;44:1195–1198. doi: 10.1002/anie.200461567. [DOI] [PubMed] [Google Scholar]
- 12.Antonenko YN, Pohl P. Microinjection in combination with microfluorimetry to study proton diffusion along phospholipid membranes. Eur Biophys J. 2008;37:865–870. doi: 10.1007/s00249-008-0295-y. [DOI] [PubMed] [Google Scholar]
- 13.Cherepanov DA, Junge W, Mulkidjanian AY. Proton transfer dynamics at the membrane/water interface: Dependence on the fixed and mobile pH buffers, on the size and form of membrane particles, and on the interfacial potential barrier. Biophys J. 2004;86:665–680. doi: 10.1016/S0006-3495(04)74146-6. [DOI] [PMC free article] [PubMed] [Google Scholar]
- 14.Blom JG, Trompert RA, Vewer JG. Algorithm 758: VLUGR2: A vectorizable adaptive-grid solver for PDEs in 2D. ACM Trans Math Softw. 1996;22:302–328. [Google Scholar]
- 15.Karpefors M, Adelroth P, Brzezinski P. The onset of the deuterium isotope effect in cytochrome c oxidase. Biochemistry. 2000;39:5045–5050. doi: 10.1021/bi9925221. [DOI] [PubMed] [Google Scholar]
- 16.le Coutre J, Gerwert K. Kinetic isotope effects reveal an ice-like and a liquid-phase-type intramolecular proton transfer in bacteriorhodopsin. FEBS Lett. 1996;398:333–336. doi: 10.1016/s0014-5793(96)01254-9. [DOI] [PubMed] [Google Scholar]
- 17.DeCoursey TE, Cherny VV. Deuterium isotope effects on permeation and gating of proton channels in rat alveolar epithelium. J Gen Physiol. 1997;109:415–434. doi: 10.1085/jgp.109.4.415. [DOI] [PMC free article] [PubMed] [Google Scholar]
- 18.Guthrie JP. Intrinsic barriers for proton transfer reactions involving electronegative atoms, and the water mediated proton switch: An analysis in terms of Marcus theory. J Am Chem Soc. 1996;118:12886–12890. [Google Scholar]
- 19.Smondyrev AM, Voth GA. Molecular dynamics simulation of proton transport near the surface of a phospholipid membrane. Biophys J. 2002;82:1460–1468. doi: 10.1016/S0006-3495(02)75500-8. [DOI] [PMC free article] [PubMed] [Google Scholar]
- 20.Dellago C, Hummer G. Kinetics and mechanism of proton transport across membrane nanopores. Phys Rev Lett. 2006;97:245901. doi: 10.1103/PhysRevLett.97.245901. [DOI] [PubMed] [Google Scholar]
- 21.Tuckerman ME, Marx D, Parrinello M. The nature and transport mechanism of hydrated hydroxide ions in aqueous solution. Nature. 2002;417:925–929. doi: 10.1038/nature00797. [DOI] [PubMed] [Google Scholar]
- 22.Pickar AD, Benz R. Transport of oppositely charged lipophylic probes in lipid bilayer membranes having various structures. J Membr Biol. 1978;44:353–376. [Google Scholar]
- 23.Gawrisch K, et al. Membrane dipole potentials, hydration forces, and the ordering of water at membrane surfaces. Biophys J. 1992;61:1213–1223. doi: 10.1016/S0006-3495(92)81931-8. [DOI] [PMC free article] [PubMed] [Google Scholar]
- 24.Peterson U, et al. Origin of membrane dipole potential: Contribution of the phospholipid fatty acid chains. Chem Phys Lipids. 2002;117:19–27. doi: 10.1016/s0009-3084(02)00013-0. [DOI] [PubMed] [Google Scholar]
- 25.Pohl P, Rokitskaya TI, Pohl EE, Saparov SM. Permeation of phloretin across bilayer lipid membranes monitored by dipole potential and microelectrode measurements. Biochim Biophys Acta. 1997;1323:163–172. doi: 10.1016/s0005-2736(96)00185-x. [DOI] [PubMed] [Google Scholar]
- 26.Agmon N. Mechanism of hydroxide mobility. Chem Phys Lett. 2000;319:247–252. [Google Scholar]
Associated Data
This section collects any data citations, data availability statements, or supplementary materials included in this article.