

Abstract
The sense of hearing depends on the faithful transmission of sound information from the ear to the brain by spiral ganglion (SG) neurons. However, how SG neurons develop the connections and properties that underlie auditory processing is largely unknown. We catalogued gene expression in mouse SG neurons from embryonic day 12, when SG neurons first extend projections, up until postnatal day 15, after the onset of hearing. For comparison, we also analyzed the closely related vestibular ganglion (VG). Gene ontology analysis confirmed enriched expression of genes associated with gene regulation and neurite outgrowth at early stages, with the SG and VG often expressing different members of the same gene family. At later stages, the neurons transcribe more genes related to mature function, and exhibit a dramatic increase in immune gene expression. Comparisons of the two populations revealed enhanced expression of TGFβ pathway components in SG neurons and established new markers that consistently distinguish auditory and vestibular neurons. Unexpectedly, we found that Gata3, a transcription factor commonly associated with auditory development, is also expressed in VG neurons at early stages. We therefore defined new cohorts of transcription factors and axon guidance molecules that are uniquely expressed in SG neurons and may drive auditory-specific aspects of their differentiation and wiring. We show that one of these molecules, the receptor guanylyl cyclase Npr2, is required for bifurcation of the SG central axon. Hence, our dataset provides a useful resource for uncovering the molecular basis of specific auditory circuit assembly events.
Introduction
The ability to perceive sound depends on spiral ganglion (SG) neurons, which are the sole conduit for signals passing from the cochlea to the brain. In addition to transmitting frequency information, SG neurons must preserve the fine structure of sound stimuli, code signals with sub-millisecond precision, and transmit signals of varying intensity in a sustained manner. As a result, the auditory circuit has acquired specialized features, such as stereotyped axon bifurcations for parallel processing and large specialized synapses, including end bulbs of Held, for rapid synaptic transmission. Understanding how these features develop is a key question in auditory neuroscience, especially since the success of cochlear implants requires functional SG neurons. Currently, little is known about how auditory circuitry is assembled, in part because the ear is housed in a tiny, bony capsule that makes access and tissue collection difficult. With the advent of new genetic tools, however, interest in the molecular mechanisms of auditory system development is growing. Indeed, the past few years have witnessed significant advances in our understanding of hair cell development and function (Kelly and Chen, 2009; Matthews and Fuchs, 2010; Fritzsch et al., 2011). In contrast, how SG neurons acquire the ability to transmit sound information remains poorly understood.
Circuit assembly involves a coordinated series of events, from the initial outgrowth and guidance of axons to the final maturation of functional synapses. In mice, SG neurons are born between embryonic day 9 (E9) and E12 and quickly extend peripheral projections toward hair cells in the cochlea and central projections into the eighth nerve (Appler and Goodrich, 2011). Centrally, all auditory axons project into the brainstem and bifurcate, sending one branch to the anteroventral cochlear nucleus (AVCN) and the other to the posteroventral cochlear nucleus (PVCN) and dorsal cochlear nucleus (DCN). Each branch then finds its proper tonotopic location and arborizes to form synapses, ranging from giant end bulbs of Held that envelop spherical bushy cells in AVCN to small bouton synapses with cells in DCN (Ryugo and Parks, 2003; Rubel et al., 2004). Synapses acquire their final morphology and become functional over the first two postnatal weeks, and hearing begins at postnatal day 12 (P12).
The incomplete knowledge of the molecular mechanisms that drive circuit assembly in SG neurons has slowed the discovery of new players, left researchers with few tools to detect or describe auditory phenotypes, and hampered efforts to convert stem cells into bona fide SG neurons. To fill this gap in knowledge, we catalogued gene expression in SG neurons as they progress from axon guidance stages to the onset of hearing. Parallel studies of the closely related vestibular ganglion (VG) facilitated identification of genes directing auditory-specific programs of development. This comparison established improved markers for SG and VG neurons, revealed a potential role for immune system genes during late stages, and identified new regulators for early SG specification and wiring, one of which we showed is required for axon bifurcation. These data offer a useful resource for investigating any aspect of auditory circuit assembly and for optimizing stem cell-based methods for the treatment of deafness.
Materials and Methods
Mice
Mice were kindly provided by Qiufu Ma, Harvard Medical School, Boston, MA (Rnx-Cre) (Xu et al., 2008), Satoru Takahashi, University of Tsukuba, Tsukuba, Japan (MafB-GFP) (Moriguchi et al., 2006), and Susan Dymecki, Harvard Medical School, Boston, MA (RC::rePe) (unpublished reagent). RC::rePe mice express red fluorescent protein in the absence of Cre and green fluorescent protein after Cre-mediated recombination. Z/EG, R26R, and Npr2cn mice were obtained from Jackson Laboratories. Rnx-Cre genotyping was performed using Cre-specific primers (CATTTGGGCCAGCTAAACAT and CCCGGCAAAACAGGTAGTTA), Z/EG genotyping was performed using GFP-specific primers (TACGGCAAGCTGACCCTGAAGTTC and AAGTCGATGCCCTTCAGCTCGATG), MafB-GFP animals were identified by green fluorescence, RC::rePe animals were identified by red fluorescence, and Npr2cn genotyping was performed as previously described (Schmidt et al., 2007). For embryonic collections, noon on the day of the plug was considered E0. For postnatal collections, the day of birth was called P0. In all cases, embryos and pups used were of either sex. Animals were maintained and handled according to protocols approved by the Institutional Animal Care and Use Committee at Harvard Medical School.
Microdissection of ganglia
E12 and E13 Rnx-Cre;Z/EG cochlear-vestibular ganglia were dissected in ice-cold sterile PBS with 2% glucose and 2% BSA (PBS/glucose/BSA) under an epifluorescence stereomicroscope. The SG and VG were separated from one another using a microblade, taking care to discard the region where the ganglia contact one another to avoid cross-contamination. Ganglia were rinsed in fresh PBS/glucose/BSA and transferred to a microcentrifuge tube with 900 μl of PBS with 10% BSA and 100 μl of 0.5 m EDTA, with a mouth pipette fitted with a sterile pulled glass Pasteur pipette. Samples were centrifuged for 10 min at 4°C at 800 × g, PBS/glucose/BSA was removed, and samples were quickly frozen in liquid nitrogen, where they were stored until RNA isolation. Inferior VG from E16, P0, P6, and P15 Rnx-Cre;Z/EG animals were dissected in PBS with 0.5% glucose, then collected into PBS/glucose/BSA, briefly centrifuged, decanted, and frozen in liquid nitrogen.
Fluorescence-activated cell sorting of SG neurons
Cochleae from 2–4 litters from CD1 × MafB-GFP−/+ matings were dissected in ice-cold sterile PBS with 0.5% glucose under an epifluorescence stereomicroscope, rinsed in fresh PBS with 0.5% glucose, and transferred into a 1.5 ml tube on ice containing 1 ml of PBS with PBS/glucose/BSA. Nonfluorescent wild-type littermates (from 3–5 animals) were processed at the same time as controls to facilitate gating for FACS. Samples were centrifuged for 10 min at 4°C at 800 × g. PBS/glucose/BSA was pipetted off and dissociation solution was added. E16 SG samples were dissociated in ∼10 μg/ml each of collagenase type 4, papain (Worthington), and dispase (Invitrogen), and 2800 U/ml DNase (Worthington) in 1 ml of PBS, while P0–P15 SG samples were dissociated in 0.05% trypsin, 1% chicken serum, 0.37 mm EDTA, ∼5 μg/ml each of collagenase type 4, papain, and dispase, and 2800 U/ml DNase in PBS. Tubes were rotated at 37°C for 45 min, with gentle trituration 5–10 times every 15 min using a filtered P1000 tip. At the end of 45 min, tissue was again triturated 5–10 times. Cells were centrifuged for 10 min at 4°C at 800 × g. Dissociation medium was pipetted off and cells were resuspended gently in 1 ml of ice-cold PBS/glucose/BSA. To generate a single cell suspension, samples were passed through a 40 μm cell strainer (BD Biosciences Falcon) into a sterile 5 ml round-bottom tube (BD Biosciences Falcon) on ice. Cells were sorted on a Beckman Coulter MoFlo machine at the Dana Farber Cancer Institute Flow Cytometry Core using a chilled sample chamber and collection chamber with a sheath pressure of 24 psi, through a 100 μm nozzle at 500–1000 events/s. Gating was set by first running nonfluorescent littermate controls on the machine, followed by a small amount of MafB-GFP−/+ sample, and then choosing cells present only in the MafB-GFP−/+ sample. The yield of GFP-positive cells was as follows: E16, 4591–46,036 cells/sample; P0, 10,889–57,160 cells/sample; P6, 13,069–125,070 cells/sample; P15, 8653–33,247 cells/sample. Cells were sorted into a chilled microcentrifuge tube with ice-cold 450 μl PBS with 10% BSA and 50 μl of 0.5 m EDTA. Samples were centrifuged for 15 min at 4°C at 1100 × g. The PBS/BSA was removed, and samples were quick frozen in liquid nitrogen, where they were stored until RNA isolation.
RNA isolation/amplification and microarray hybridization
Microdissected samples were thawed and pooled such that ∼15–20 E12 or E13 SG or VG, or ∼10–12 E16–P15 VGs were processed for each of three replicates. For FACS samples, between 4591 and 125,070 cells were processed for each of four replicates. RNA was extracted using the Arcturus PicoPure RNA kit (Applied Biosystems), according to the manufacturer's instructions. Samples were stored at −80°C until needed. RNA was amplified using the Arcturus RiboAmp Plus 1.5 round RNA amplification kit (Applied Biosystems), according to the manufacturer's instructions. Amplified RNA (aRNA) was biotin labeled using the Enzo BioArray High Yield RNA Transcript Labeling Kit (T7), according to the manufacturer's instructions, then fragmented by adding 15 μg of aRNA in a volume of 40–10 μl of 5× fragmentation buffer (200 mm Tris acetate, pH 8.1, 150 mm MgOAc, 500 mm KOAc) and incubating at 95°C for 35 min. Fragmented, labeled probes were hybridized to Affymetrix Mouse 430 2.0 GeneChips using standard protocols at the Dana Farber Cancer Institute Microarray Core.
Microarray data normalization
We used the July 13, 2009 build of dChip and the July 1, 2009 Affymetrix gene information for MOE430v2 for normalization and modeling. Normalization parameters were invariant set and running median smoothing, and the baseline array was P0 SG1 (313, 46.6%). The expression signal was obtained using the model-based expression method and mismatch probe (PM/MM) difference as background. Note that two chips (E16 SG 4 and P15 SG 2) had significantly lower intensity than the rest. Affymetrix data files for all samples can be found at accession no. GSE29766, NCBI GEO (Gene Expression Omnibus) (http://www.ncbi.nlm.nih.gov/geo/).
Hierarchical clustering analysis
A total of 45,102 probe sets were reduced to 28,345 by eliminating those with a preponderance of Affymetrix “Absent” calls not related to the experimental design, i.e., by excluding those for which the following conditions were met: (1) the probe set was called “Absent” for 30 or more of the 40 arrays; and (2) the nominal p value from Fisher's exact test comparing the probability of an “Absent” call across 12 tissue/time points was >0.2.
Following the method of Mitiku and Baker (2007), we sought clusters of probe sets based on standardized mRNA expression across the 40 samples. Although metric (nonparametric) hierarchical clustering is a well characterized method, it does not scale to tens of thousands of cases; consequently, we used a Gaussian variant of the recursively partitioned mixture model (RPMM), a hierarchical mixture-model algorithm described by Houseman et al. (2008) and implemented in the R library RPMM (http://cran.r-project.org/web/packages/RPMM/index.html). A total of 28,345 probe sets were clustered via RPMM according to 11 orthogonal contrasts of 40 mean-centered (but not SD-scaled), log-transformed normalized expression values, as described below. Thus, the probes were hierarchically clustered based on their pattern of absolute variation, with respect to cell type and developmental age, around a common expression level (i.e., the geometric mean). The resulting hierarchy of classes was pruned to 5 binary levels, resulting in 25 = 32 clusters of probe sets. After obtaining cluster labels for each probe set, geometric means were obtained for each cluster and each tissue/time point combination. Note that we compared the consistency of RPMM clustering to that of metric clustering (using Euclidean distance with Ward's linkage) by pairwise analysis of 50 resampling experiments. We sampled 1000 probe sets at a time for each experiment, and on a pairwise basis between sampling runs, used the adjusted Rand Index (Rand, 1971) to compare the consistency of the clustering of probe sets that were sampled in both runs. Mean adjusted Rand Index for RPMM was 0.419 (SD = 0.0094), while for metric hierarchical clustering, it was 0.273 (SD = 0.0063). Thus, RPMM also appeared to provide more consistent clustering than the more common nonparametric approach.
Details on orthogonal contrast
To capture relevant time-trajectory profiles in the clustering algorithm, orthogonalized contrasts were used instead of raw log-expression values. This follows a similar strategy used previously (Houseman et al., 2006) for incorporating linear relationships among genetic probes in a clustering algorithm, and is motivated by the wavelet decompositions used, for example, by Morris et al. (2003). First, normalized expression values were log transformed and centered around the geometric mean:
 |
where Eig is the normalized expression value for array i and probe set g. The first contrast was defined as:
 |
where the α constants are chosen to produce unit norm, i.e.:
 |
Thus, the first contrast captures differences in overall expression between SG and VG. Similarly, four other contrasts representing tissue-specific “late” (P6 and P15) versus “mid” (E16 and P0) contrasts and “mid” versus “early” (E12 and E13) contrasts were constructed as follows:
 |
 |
 |
 |
with α constants chosen to produce unit norm. Finally, six additional contrasts representing tissue-specific age contrasts with early, middle, and late (i.e., P6 vs P15, P0 vs E16, and E.12 vs E13) were constructed. These 11 contrasts were used as inputs to the RPMM algorithm.
Gene ontology analysis
Due to the large number of genes in the dataset, 10% of the 28,345 genes on the “Present” list were selected at random for gene ontology annotation. These genes were annotated for function by searching three databases (NCBI OMIM, http://www.ncbi.nlm.nih.gov/omim; NCBI Gene, http://www.ncbi.nlm.nih.gov/gene; and IHOP http://www.ihop-net.org/UniPub/iHOP/). When gene function was unclear, examination of relevant literature abstracts or papers was performed using PubMed (http://www.ncbi.nlm.nih.gov/pubmed). Genes were scored according to whether they fell into any of the following 60 categories: Transcription factor, chromatin modification, methylation, other transcription, RNA binding/processing, ubiquitination, ubiquitin-like modification, transmembrane, secreted or GPI-linked, cytoplasmic, cytoskeleton associated, nuclear, nuclear/hormone receptor signaling, intracellular trafficking, ER/Golgi, carbohydrate metabolism, lipid metabolism, phospholipid metabolism/signaling, glycosylation/glycoprotein, mitochondrial, filopodia/lamellipodia, axon guidance/outgrowth, dendrite growth/morphogenesis, cell cycle/division/proliferation, cilia, cell motility/migration, cell adhesion, cell junction, GTPase signaling, TGFβ family signaling, Notch signaling, EGF signaling, Wnt signaling, prostaglandin signaling, centrosome, peroxisome, proteoglycan, lysosome, proteasome, exocytosis, endosome/endocytosis, solute carrier, insulin signaling, extracellular matrix, channels, synaptic molecules, myelination, immune genes, interleukin signaling, interferon signaling, MHC molecule, complement cascade, vitamin metabolism, zinc transport, apoptosis, phosphatase, kinase, sperm/spermatogenesis, mouse deafness, and human deafness/auditory disorder.
χ2 tests were performed using SAS to test whether genes in “early” clusters fell into different categories from those in “late” clusters. For this analysis, “early” clusters were defined as those in which gene expression was present at E12 or E13 and then decreased in either or both populations at later stages. “Late” clusters were defined as those in which gene expression was low at E12 and E13 and then was upregulated between E16 and P15. These included genes upregulated late in the SG or VG alone, or in both populations. χ2 tests were also performed to test SG (“both early + SG late” and “SG late”) versus VG (“both early + VG late” and “VG late”) clusters.
Pairwise comparisons
Generation of differentially expressed gene list.
We used dChip to generate a filtered gene list (∼33,000 probe sets) with a 5% Affymetrix P call (gene must be deemed “present” in at least 2 of the 40 chips), and then imported these values into MeV (http://www.tm4.org/mev/). We used the SAM (Statistical Analysis of Microarrays) application to perform pairwise comparisons for all 66 possible unique comparisons from the 12 data points. We then chose the top ∼200 genes using a secondary >1.5-fold difference cutoff (i.e., the top 200 most differentially expressed genes in each pairwise comparison were chosen, but any genes that did not meet the 1.5-fold difference criteria were excluded). Of the 66 unique pairwise comparisons, 57 had a median false discovery rate (FDR) of 0.000%, 5 had a FDR between 0.001–1%, and 4 had a FDR >1%. We combined the probe identifications (IDs) from all 66 pairwise comparisons into one file, removed duplicated probe IDs, and reduced genes with multiple probe ID hits to one representative probe ID hit. We then excluded genes for which the Affymetrix P call was not “present” for at least two samples from the same tissue/age, as well as genes for which the Affymetrix P call was not “present” in at least two samples from the same tissue/age with the highest normalized expression. This resulted in a list of 3070 genes.
Categorization of genes.
We categorized genes according to age (early, mid, or late) and tissue specificity (SG, VG, or both) of expression as follows. We identified the peak expression values for a given gene for both the VG and SG. If these values were <1.5-fold different, the gene was classified as “both”; if >1.5-fold different, the gene was classified as VG or SG, depending on which had higher expression. If the peak expression value was at E12, it was defined as “early”; if it was at P15, it was defined as “late”; if it was E13–P6, it was defined as “mid.”
Identification of axon branching candidates
Normalized dChip files were imported into MeV. Setting the median false discovery rate to 0.000%, we used SAM to do the following pairwise comparisons: E12 SG vs E16 SG, E12 VG, and E13 VG; E13 SG vs E16 SG, E12 VG, and E13 VG; E12 SG and E13 SG vs E16 SG, E12 VG, and E13 VG. We also performed a similar analysis using Rosetta Resolver and kept the genes that resulted from both analyses and were enriched an average of >2-fold. Genes encoding transmembrane proteins were identified by entering each sequence into the SMART domain architecture analysis tool (http://smart.embl-heidelberg.de/). After eliminating duplicates, the list of candidate genes was reduced to 72 genes.
In situ hybridization and RT-PCR
Section in situ hybridization was performed as previously described (Abraira et al., 2008). For whole-mount in situ hybridization, P6 cochleae were dissected in ice-cold sterile PBS, removing the bony capsule of the ear, and fixed in 4% PFA in PBS overnight at 4°C, then processed for whole-mount in situ hybridization. P15 animals were perfused with 4% PFA in PBS, and the cochleae were dissected out with the bony capsule still intact, and fixed in 4% PFA in PBS overnight at 4°C. The bone surrounding the cochlea and in the modiolus was dissected away, and the tissue was processed for whole-mount in situ hybridization. For RT-PCR, P6 and P15 SGs were isolated from MafB-GFP−/+ animals, and P0 and P15 VGs were collected from Rnx-Cre;Z/EG animals as described for the microarray analysis. RNA was extracted by TRIzol, and cDNA was synthesized using SuperScript III (Invitrogen). Tafa2 primers (GATGGAGCTGTTCCTCTGGA and TGTTGTGAGCCAAGCGTTAG) were used to amplify a 294 bp band using the following cycling conditions: 36 cycles of 95°C for 15 s, 56°C for 30 s, and 68°C for 45 s. Gapdh primers (CTCATGACCACAGTCCATGC and GCACGTCAGATCCACGAC) were used in parallel as a positive control.
Visualization of axonal projections
To determine the timing of SG axon branching, E11.5, E12, and E14 Gata3tauLacZ/+ embryos were fixed and stained with X-gal as previously described (Abraira et al., 2008). The hindbrain region connected to the cochlea was isolated by dissection and was flat-mounted on a glass slide to visualize projections. In addition, the extent of VG axon branching at E12 was determined by DiI injection into the VG of fixed CD1 embryos, followed by flat mounting and visualization by fluorescence microscopy. For visualization of sparsely labeled SG projections, E12.5 Neurog1-CreERT2/+;RC::rePe or Npr2cn/cn;Neurog1-CreERT2/+;RC::rePe embryos were fixed for 4 h in 4% PFA in PBS, embedded in 5% agarose, and cut into 250-μm-thick sagittal sections using a vibratome, followed by immunostaining for GFP (see below, Immunofluorescence). Tissue was mounted onto slides, and axons were visualized by confocal microscopy (Zeiss LSM 510 META). Z-stacks were projected into a single image using LSM Image Browser software (Zeiss).
Immunofluorescence
For Gata3 and GFP double immunofluorescence, sections through an E11 ear were digested for 5 min in 0.01% trypsin (Invitrogen) in 0.1 m CaCl2, pH 7.4, blocked for 30 min in blocking solution (1% BSA, 0.1% Triton X-100, 0.02% SDS, 50 μg/ml DNase I in PBS), and incubated in 1:500 mouse anti-GFP (Invitrogen) and 1:500 goat anti-Gata3 (R&D Systems) antibody in blocking solution overnight at 4°C. Secondary antibodies (Alexa Fluor 488-conjugated donkey anti-mouse and Alexa Fluor 647-conjugated donkey anti-goat) were used at 1:1000 in blocking solution.
For GFP immunofluorescence on vibratome sections, tissue was blocked in 5% normal donkey serum in PBS with 0.1% Triton X-100 and incubated at 1:500 with rabbit anti-GFP antibody (Invitrogen) and at 1:1000 with Alexa Fluor 488-conjugated donkey anti-rabbit secondary antibody (Invitrogen).
For NF and GFP immunofluorescence on dissociated and FACS-sorted SG cells, cells were pelleted, resuspended in Matrigel (BD Biosciences), and then solidified on a microscope slide warmed to 37°C. Then they were fixed in 4% PFA and blocked in 3% BSA, 1% normal donkey serum in PBS overnight at 4°C, followed by incubation in 1:500 goat anti-GFP (Abcam) and 1:500 mouse anti-Neurofilament, 2H3 concentrated (Developmental Studies Hybridoma Bank, University of Iowa, Iowa City, IA) in 3% BSA, 1% normal donkey serum, 0.1% Triton X-100 in PBS overnight at 4°C. Secondary antibodies (Alexa Fluor 488-conjugated donkey anti-goat and Alexa Fluor 594-conjugated donkey anti-mouse) were used at 1:750 in 3% BSA, 1% normal donkey serum, 0.1% Triton X-100 in PBS for 2 h at room temperature. DAPI staining was performed by incubating tissue or cells with 1:10,000 DAPI in PBS for 15 min before mounting.
Results
Isolation of tissue for microarrays
To identify genes involved in SG axon guidance and branching, target selection, synaptogenesis, synaptic refinement, and synaptic function, we collected SG at E12 and E13, E16, P0, P6, and P15 (Fig. 1A). We also collected VG at the same time points. Like their auditory counterparts, VG neurons are born in the otic vesicle and send central projections through the eighth nerve. However, unlike SG neurons, they innervate hair cells of the vestibular sensory epithelia in the ear and the vestibular nuclei in the hindbrain. Hence, comparison of SG neurons to VG neurons should reveal cell type-specific factors that underlie these unique circuit assembly decisions.
Figure 1.
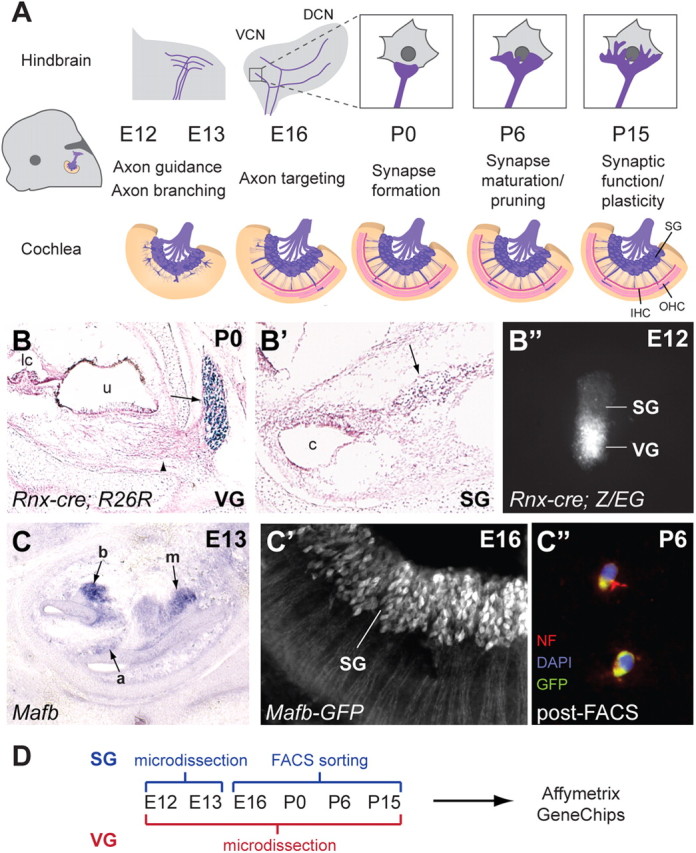
Generation of a gene expression catalog for inner ear neurons during circuit assembly. A, The progression of auditory circuit assembly peripherally (bottom) and centrally (top) from early (E12) to late (P15) time points. At early stages, SG neurons send projections toward the cochlea and hindbrain (axon guidance). The central projection bifurcates to send branches to the DCN and VCN (axon branching). Both peripheral and central projections subsequently find synaptic targets (axon targeting) and form synapses (synapse formation) that mature (synapse maturation/pruning) and become functional (synaptic function/plasticity). IHC, Inner hair cells; OHC, outer hair cells. B–B″, Genetic labeling of the VG using Rnx-Cre. Rnx-Cre drives R26R reporter expression in the VG (arrow in B) but not the SG (arrow in B′), as shown by X-gal staining (blue) at P0 (sections are counterstained with Nuclear Fast Red). Note the peripheral processes extending from the VG toward the utricle (u) (arrowhead in B). lc, Lateral crista; c, cochlea. A microdissected cochlear-vestibular ganglion from an E12 Rnx-Cre;Z/EG embryo shows GFP expression in the VG but not the SG (B″). C–C″, Genetic labeling of the SG using Mafb-GFP mice. Section by in situ hybridization for Mafb at E13 (C) shows strong SG staining in the base of the cochlea (b), weaker staining in the mid-turn (m), and very faint signal in the apex (a). Examination of GFP expression in whole-mount Mafb-GFP cochlea at E16 confirms expression in SG neurons (C′). This expression persists and can be used to isolate SG neurons, as illustrated by immunostaining dissociated P6 Mafb-GFP SG neurons after FACS (C″). The GFP-positive cells (green) also express the neuronal marker Neurofilament (red). DAPI-stained nuclei are in blue. D, A summary of the methods used to isolate SG and VG neurons for Affymetrix Gene Chip analysis at the six chosen stages.
Previous developmental microarray studies of the inner ear have typically used the entire cochlea (Chen and Corey, 2002; Sajan et al., 2007), which contains many different cell types in addition to SG neurons, including hair cells and supporting cells. This is likely due to the difficulty of isolating the different cell types and the tiny amounts of tissue that can be harvested from a single animal. However, this approach has the drawback of diluting the expression data and increasing the complexity of data analysis (Hildebrand et al., 2007). To overcome these obstacles, we genetically labeled ganglia with GFP and then isolated the tissue by careful microdissection or by FACS.
The transcription factor Rnx (also known as Tlx3) is expressed at E12 and E13 in the VG but not the SG (data not shown). Hence, when Rnx-Cre knock-in mice (Xu et al., 2008) are crossed with Rosa26 conditional reporter mice (Soriano, 1999), only VG (Fig. 1B) and not SG (Fig. 1B′) neurons are X-gal labeled at P0, indicating that Rnx-Cre expression is a reliable indicator of the vestibular fate. Therefore, we crossed Rnx-Cre mice to GFP conditional reporter (Z/EG) mice (Novak et al., 2000) to fluorescently label the VG, which aided in microdissection of the SG and VG at E12 (Fig. 1B″) and E13. At these early stages, the ganglia are still attached to one another, so we carefully separated them using a microblade and collected the tissue. Approximately 15–20 ganglia were pooled for each sample, and three replicate samples were processed for each tissue/time point. For the E16–P15 time points, VGs were also microdissected from Rnx-Cre;Z/EG animals; only inferior VGs were collected to avoid introducing additional heterogeneity into the vestibular samples. Approximately 10–12 ganglia were pooled for each sample, and three replicate samples were processed for each time point. Since the SG is difficult to isolate quickly and cleanly by microdissection at later stages due to the complex architecture of the cochlea, E16–P15 SGs were isolated from MafB-GFP knock-in animals (Moriguchi et al., 2006) by FACS. MafB is a transcription factor that is first expressed around E13, most strongly in the earliest-born SG neurons in the base of the cochlea, but only weakly in the later born apical SG neurons (Fig. 1C), and is subsequently upregulated throughout the SG (Fig. 1C′). FACS-sorted GFP-positive cells expressed the axonal marker neurofilament (NF) (note the labeling of severed projections), confirming successful purification of SG neurons (Fig. 1C″). Four replicates were processed for each tissue/time point for FACS-sorted samples. RNA was then isolated from samples, linearly amplified, and used to generate probes for Affymetrix Mouse 430 2.0 GeneChips (Fig. 1D). The raw microarray data are available for download online (http://www.ncbi.nlm.nih.gov/geo/). In addition, we have generated an online database that allows one to search for genes or categories of interest and to view microarray expression patterns in graphical or tabular format (http://goodrich.med.harvard.edu/) (Fig. 4C).
Figure 4.

Statistical analysis of microarrays to identify developmentally relevant genes. A, Genes that are significantly enriched in one tissue (Spatial) or that change over time (Temporal) were identified by pairwise comparisons between all tissues and time points, compiled into a signature gene list, and categorized according to their spatiotemporal patterns of expression. B, A screen shot of the searchable online signature gene database. Expression data can be viewed in graphical or tabular (data not shown) format. The complete microarray database is also available in searchable form online (C).
Hierarchical clustering and gene ontology analysis of microarray data
These studies generated an enormous amount of data, with expression profiles for 45,102 probe sets corresponding to ∼25,000 genes in both the SG and VG at six different developmental time points. To categorize genes in as unbiased a manner as possible, we first performed hierarchical clustering analysis of the ∼28,000 probe sets that showed expression above background (Fig. 2A). This enabled us to group genes according to their spatiotemporal patterns of expression and to identify broad trends in the data. To reveal what kinds of genes are contained within each cluster, we performed a gene ontology analysis. Due to the incompleteness of many online gene ontology databases, we performed our own analysis by randomly choosing 10% of the genes in the dataset (∼2800) and annotating their function through manual gene database and literature searches. Genes were scored based on evidence that they were associated with any of 60 different functional categories. We then compared the representation of each category in the early vs late gene clusters using χ2 tests (Fig. 2B).
Figure 2.

Trends in gene expression revealed by hierarchical clustering and gene ontology analyses. A, Hierarchical clustering of microarray data. A heat map showing 28,345 probe sets with Affymetrix “present” calls as columns, with SG expression in the lower half and VG expression in the upper half. Replicates for a given tissue and time point are indicated by brackets, and average expression within a given cluster is indicated, with red corresponding to high levels and green to low levels of expression. The width of the color-coded rectangles represents the proportion of probe sets falling into that cluster. Genes in the clusters on the left side are expressed in both populations at early stages (both early). In some “both early” clusters, genes are subsequently maintained only in SG (+SG late) or VG neurons (+VG late). Genes in the clusters on the right side are expressed at late stages of circuit assembly (E16 and later). Some clusters consist of genes expressed in both neuronal populations (both late), while others are characterized by enriched expression in the SG (SG late) or VG (VG late). B, A summary of gene ontology categories that are overrepresented at early (E12 and E13) vs late (E16 and later) stages of development or in SG vs VG neurons at any stage. p values were obtained using χ2 tests.
Our analysis confirmed that inner ear neurons experience the same general trends in gene expression observed in other developing neuronal populations. For instance, early gene clusters (E12 and E13) contain genes associated with neurogenesis and differentiation, including genes involved in transcriptional and cell cycle regulation, RNA binding/processing, ubiquitination, axon guidance, and dendrite morphogenesis. Genes involved in Notch signaling, which is known to be involved in neurogenesis (Kageyama et al., 2009), and Wnt and GTPase signaling, which play important roles in axon guidance (Sánchez-Camacho and Bovolenta, 2009; Hall and Lalli, 2010), were also enriched early. In contrast, late stages (E16–P15) were characterized by expression of genes associated with mature neuronal function. For instance, the neurons begin to express many more cell adhesion and extracellular matrix (ECM) molecules, as well as genes involved in lipid, carbohydrate, and vitamin metabolism, and mitochondrial function. We also found that genes involved in prostaglandin signaling, which is involved in the inflammatory response and has been proposed to play a neuroprotective role in the cochlea (Nakagawa, 2011), are enriched in more mature neurons. Thus, our results indicate that our microarray database reflects, at least on a broad scale, the appropriate developmental changes that would be expected in these neurons.
In addition to these anticipated trends, this analysis revealed a striking late-stage enhancement for genes normally associated with immune system function. For example, many MHC class I genes (H2-D1, H2-K1, H2-L, H2-Q7, H2-T23) are strongly upregulated in the SG at postnatal stages and are >2-fold enriched in the SG compared with the VG at P15, while another MHCI gene, H2-T10, appears to be upregulated in both the SG and VG at postnatal stages (Fig. 3A). The first two postnatal weeks witness a decrease in the number of SG neurons, an increase in soma size, and the activity-dependent refinement of SG central projections, likely triggered by purinergic signaling from hair cells (Leake et al., 2002; Tritsch et al., 2007; Tritsch and Bergles, 2010). This is also a critical period for afferent-dependent AVCN neuron survival (Harris and Rubel, 2006). MHC class I molecules are involved in remodeling of retinal ganglion cell axons, activity-dependent synaptic plasticity in the hippocampus, and motor neuron synapse organization (Shatz, 2009; Thams et al., 2009), as well as NMDA receptor activity and AMPA receptor trafficking (Fourgeaud et al., 2010). The timing of expression that we observe suggests the intriguing possibility that MHC class I molecules regulate synaptic development and refinement during auditory circuit assembly as well. Several MHC class II genes (H2-Aa, H2-Ab1, H2-DMa, H2-Ea, H2-Eb1, and H2-Ob) are also upregulated in SG neurons (Fig. 3B), but the potential functions of these genes in the nervous system remain unclear.
Figure 3.

Postnatal expression of MHC and complement genes in the SG. In all panels, expression levels for each gene (y-axis) are plotted logarithmically from early (E12) to late (P15) stages of development (x-axis). Each log2 unit reflects a twofold change in expression. Data for the SG are in blue, and data for the VG are in red. A–D, Graphs for genes encoding MHC class I receptors (A), MHC class II receptors (B), and complement pathway components (C, D) are shown. Some complement pathway genes are enriched in the SG (C), while others are present in both ganglia (D).
The increase in MHC class I and class II gene expression is accompanied by strong upregulation of many complement pathway genes. Some are strongly enriched in the SG compared with the VG (Fig. 3C), while others are present in both types of neurons at late stages (Fig. 3D). In mutant mice lacking C1q, retinal ganglion cells fail to properly prune their synapses, indicating a role for complement pathway genes in synaptic refinement (Stevens et al., 2007). The temporal pattern of complement pathway gene expression in SG neurons raises the possibility that they may be involved in similar processes during the maturation of auditory circuits.
To learn more about the programs of gene expression specifically associated with auditory circuit assembly, we compared SG neurons to VG neurons, which also arise from the anteroventral quadrant of the otic vesicle and mediate the sense of balance (Appler and Goodrich, 2011). Consistent with their common origin and closely related functions, SG and VG neurons express many of the same genes throughout development (Fig. 2A, “both early” and “both late”). This underscores the fact that the same basic molecular toolbox is used across the nervous system. However, there are also some notable differences. For example, among the genes expressed in both populations at early stages (Fig. 2A, “both early”) were clusters of genes that were later downregulated in one population and maintained in the other (“+SG late” and “+VG late”). In addition, a large proportion of late genes specific to either the SG (“SG late”) or VG (“VG late”) were also evident. This gradual divergence fits with what has been observed in the cerebral cortex, for example, where subtypes of projection neurons transiently coexpress common transcription factors that are subsequently maintained in one population or the other (Azim et al., 2009).
Aside from these general changes in gene expression, we unexpectedly found that the SG is enriched for genes involved in TGFβ family member signaling, while the VG is enriched for genes involved in EGF signaling. Since both TGFβ and EGF signaling have been implicated in a variety of developmental processes, including neurogenesis, neurite outgrowth, and synaptogenesis (García-Alonso et al., 2000; Wong and Guillaud, 2004; Salinas, 2005; Sánchez-Camacho and Bovolenta, 2009), it is possible that the two populations respond differentially to these two families of secreted signaling molecules during circuit assembly.
Since the gene ontology analysis did not reveal any other global differences between SG and VG across time, we performed a pairwise comparison of SG and VG at E12 to gain a better sense of how these two populations differ at one specific stage of development. This analysis yielded 103 genes that were enriched by at least twofold in SG neurons and 156 genes enriched in VG neurons (p < 0.01) (Table 1). Consistent with our initial cluster analysis, many genes on both lists play known roles in neuronal development, including many transcription factors and cell surface receptors. However, each population often expresses a unique family member. For instance, SG neurons show enriched expression of FGF5, while VG neurons express FGF12 and FGF18. Similarly, SG and VG neurons show differential expression of Wnt receptors (Fzd5 vs Fzd8) and of members of the protocadherin gene family (Pcdh17 in SG vs Pcdh8 in VG). In addition, VG neurons express more genes associated with differentiation than the SG neurons do, likely reflecting the fact that SG neurons are born after VG neurons (Ruben, 1967; Koundakjian et al., 2007). This highlights the need to examine gene expression at multiple time points when seeking meaningful differences.
Table 1.
SG- and VG-enriched genes at E12
| SG |
VG |
|||||||||||||
|---|---|---|---|---|---|---|---|---|---|---|---|---|---|---|
| Gene | Fold diff | p value | Gene | Fold diff | p value | Gene | Fold diff | p value | Gene | Fold diff | p value | Gene | Fold diff | p value |
| Fgf5 | 56.9 | 0.000 | Igsf21 | 3.4 | 0.006 | Rgs8 | 40.6 | 0.000 | Aldh1a1 | 5.6 | 0.001 | Me1 | 3.0 | 0.002 |
| Prox1 | 30.3 | 0.000 | Mtap9 | 3.4 | 0.005 | Tbx20 | 40.3 | 0.007 | Kit | 5.4 | 0.001 | Cytl1 | 3.0 | 0.000 |
| Insm2 | 29.9 | 0.003 | Coro2a | 3.4 | 0.000 | Aldh1a7 | 36.7 | 0.002 | Adcy1 | 5.2 | 0.000 | Cxcl4 | 2.9 | 0.000 |
| Mab21l1 | 17.9 | 0.001 | Rgmb | 3.3 | 0.000 | Wif1 | 32.4 | 0.001 | Cxcl12 | 5.0 | 0.001 | Atp1a2 | 2.9 | 0.000 |
| Shh | 17.6 | 0.001 | Enah | 3.3 | 0.003 | Bnc2 | 32.4 | 0.000 | Slc25a2 | 4.9 | 0.000 | Odz2 | 2.8 | 0.000 |
| Neurod6 | 16.7 | 0.000 | Clip1 | 3.3 | 0.004 | Kazald1 | 26.8 | 0.000 | Ptprd | 4.9 | 0.001 | Cd93 | 2.8 | 0.001 |
| Ndrg1 | 15.2 | 0.002 | Cth | 3.2 | 0.000 | Hs3st2 | 26.5 | 0.000 | Ppp2r2b | 4.9 | 0.000 | Dtnb | 2.7 | 0.000 |
| Epha5 | 11.0 | 0.000 | Pcdh10 | 3.1 | 0.001 | Mal | 24.8 | 0.002 | Scn1a | 4.8 | 0.000 | Cd83 | 2.7 | 0.000 |
| Myo6 | 11.0 | 0.000 | Tmem132d | 3.1 | 0.000 | Kcnq5 | 24.0 | 0.001 | Tpd52l1 | 4.8 | 0.000 | Maf | 2.7 | 0.000 |
| Zfpm2 | 11.0 | 0.000 | Pcdh7 | 3.1 | 0.000 | Diras2 | 21.5 | 0.000 | Scn9a | 4.8 | 0.000 | Abcg4 | 2.7 | 0.004 |
| Efnb2 | 10.3 | 0.000 | Anxa4 | 3.1 | 0.003 | Pax3 | 18.7 | 0.007 | Plekha4 | 4.8 | 0.000 | Wnt5a | 2.7 | 0.005 |
| Art5 | 9.3 | 0.003 | Ntrk3 | 3.1 | 0.000 | Onecut1 | 18.6 | 0.000 | Clstn2 | 4.7 | 0.000 | Dhh | 2.7 | 0.003 |
| Grem2 | 8.7 | 0.000 | Rasef | 3.1 | 0.001 | Gda | 17.9 | 0.000 | Rab15 | 4.5 | 0.000 | Greb1 | 2.6 | 0.000 |
| Mfng | 8.7 | 0.000 | Hspa2 | 3.1 | 0.003 | Angpt1 | 16.3 | 0.005 | Tgfa | 4.5 | 0.000 | Bmp7 | 2.6 | 0.000 |
| Slco4a1 | 8.6 | 0.000 | Tgfb2 | 3.0 | 0.000 | Ngef | 16.1 | 0.000 | Kcnj10 | 4.4 | 0.001 | Edg3 | 2.6 | 0.000 |
| Kcnip4 | 8.4 | 0.001 | Stt3b | 3.0 | 0.000 | Lin7a | 14.4 | 0.000 | Pde8a | 4.3 | 0.000 | Lancl3 | 2.5 | 0.001 |
| Pcdh17 | 8.2 | 0.001 | Bmper | 3.0 | 0.000 | Ptpn3 | 14.4 | 0.001 | Col1a2 | 4.2 | 0.000 | Afap1l2 | 2.4 | 0.001 |
| Lrrtm4 | 8.2 | 0.002 | Tbx18 | 3.0 | 0.000 | Cartpt | 13.0 | 0.000 | Rgs7bp | 4.1 | 0.000 | Cntnap4 | 2.4 | 0.001 |
| Snca | 7.8 | 0.003 | Robo2 | 2.9 | 0.000 | Cbln4 | 12.9 | 0.006 | Tmod1 | 4.1 | 0.000 | Kdr | 2.4 | 0.001 |
| Neurog1 | 7.3 | 0.002 | Tph1 | 2.9 | 0.007 | Fgf12 | 12.4 | 0.008 | Vtn | 4.1 | 0.000 | Cpeb3 | 2.4 | 0.000 |
| Fzd5 | 7.3 | 0.000 | Stbd1 | 2.8 | 0.005 | Tbx3 | 12.3 | 0.000 | Socs2 | 4.0 | 0.001 | Nfe2l3 | 2.4 | 0.000 |
| Calml4 | 7.3 | 0.005 | Padi2 | 2.7 | 0.002 | Pappa | 10.8 | 0.001 | Chrna5 | 4.0 | 0.007 | Abat | 2.4 | 0.000 |
| Zmat4 | 7.2 | 0.000 | Bmp2 | 2.7 | 0.000 | Pcdh8 | 10.6 | 0.000 | Gprc5b | 4.0 | 0.000 | Camk1d | 2.4 | 0.008 |
| Shox2 | 7.2 | 0.000 | Etv1 | 2.7 | 0.000 | Gabrg2 | 9.8 | 0.002 | Ppargc1a | 3.9 | 0.005 | Bai3 | 2.4 | 0.001 |
| Rmst | 7.1 | 0.001 | Efcbp2 | 2.6 | 0.001 | Ablim1 | 9.4 | 0.000 | Nol4 | 3.9 | 0.006 | Pcsk5 | 2.4 | 0.005 |
| Ntng1 | 6.9 | 0.000 | Rnpep | 2.6 | 0.001 | Gria3 | 9.2 | 0.000 | Adcyap1 | 3.9 | 0.005 | Mbp | 2.3 | 0.000 |
| Galnt3 | 6.8 | 0.000 | Mbnl3 | 2.6 | 0.002 | Arpp21 | 8.7 | 0.000 | Vsnl1 | 3.9 | 0.000 | Itih5 | 2.3 | 0.000 |
| Rhbdl3 | 6.6 | 0.004 | Calb1 | 2.6 | 0.001 | Prss12 | 8.6 | 0.000 | Mpz | 3.9 | 0.000 | Cobll1 | 2.3 | 0.000 |
| Tgm2 | 6.4 | 0.000 | Ptger4 | 2.6 | 0.000 | Kcnip2 | 8.6 | 0.001 | Rspo2 | 3.8 | 0.000 | Tnfrsf19 | 2.3 | 0.000 |
| Bmpr1b | 6.2 | 0.001 | B3gnt2 | 2.5 | 0.000 | Thbd | 8.3 | 0.002 | Psd2 | 3.8 | 0.002 | Vamp1 | 2.3 | 0.000 |
| Pdlim5 | 6.2 | 0.001 | Flrt2 | 2.5 | 0.002 | Lepr | 8.3 | 0.005 | Slit3 | 3.8 | 0.003 | Igf1 | 2.3 | 0.008 |
| Fat4 | 6.0 | 0.000 | Ccnb1 | 2.5 | 0.001 | Wipf3 | 7.9 | 0.000 | Tmcc3 | 3.7 | 0.003 | Ctsb | 2.3 | 0.001 |
| Nptx1 | 5.9 | 0.000 | Chodl | 2.4 | 0.001 | Lrrtm1 | 7.8 | 0.003 | Scn7a | 3.6 | 0.004 | Dcc | 2.2 | 0.006 |
| Jph1 | 5.6 | 0.000 | Mpped2 | 2.4 | 0.007 | Fzd8 | 7.8 | 0.000 | Dab1 | 3.5 | 0.001 | Sh3md4 | 2.2 | 0.000 |
| Nedd1 | 5.5 | 0.000 | Cklf | 2.4 | 0.000 | Myom2 | 7.7 | 0.000 | Sparcl1 | 3.5 | 0.002 | Gpr135 | 2.2 | 0.005 |
| Irx3 | 5.5 | 0.000 | Socs4 | 2.4 | 0.000 | Pappa2 | 7.6 | 0.005 | Smad7 | 3.3 | 0.000 | Nos1 | 2.2 | 0.000 |
| Abcc4 | 5.4 | 0.000 | Cldn9 | 2.4 | 0.001 | Rasgrp2 | 7.6 | 0.000 | Syt4 | 3.3 | 0.002 | Sh2d5 | 2.2 | 0.002 |
| Htra1 | 5.3 | 0.001 | Ccdc88c | 2.3 | 0.000 | P4ha3 | 7.5 | 0.003 | Sfrp1 | 3.3 | 0.002 | Ramp2 | 2.2 | 0.003 |
| Pira1 | 5.3 | 0.000 | Auts2 | 2.3 | 0.000 | Olfm3 | 7.3 | 0.006 | Tmem16d | 3.3 | 0.000 | Smpdl3a | 2.2 | 0.000 |
| Sema3a | 4.9 | 0.001 | Mpzl2 | 2.3 | 0.002 | Fgf18 | 7.2 | 0.000 | Ugt8a | 3.3 | 0.004 | Prickle2 | 2.2 | 0.002 |
| Ror1 | 4.8 | 0.000 | Cib2 | 2.3 | 0.000 | Bcan | 7.0 | 0.000 | Col1a1 | 3.3 | 0.004 | Dbp | 2.2 | 0.000 |
| Rassf3 | 4.8 | 0.000 | Osbpl3 | 2.2 | 0.008 | Tle2 | 7.0 | 0.001 | Rims1 | 3.2 | 0.000 | Spata13 | 2.1 | 0.005 |
| Zfp106 | 4.4 | 0.001 | Dach1 | 2.2 | 0.005 | Apcdd1 | 6.9 | 0.000 | Dock3 | 3.2 | 0.001 | Ptx3 | 2.1 | 0.001 |
| Cecr2 | 4.4 | 0.000 | Cyp51 | 2.2 | 0.001 | Mfap3l | 6.7 | 0.002 | Sox17 | 3.2 | 0.000 | Col18a1 | 2.1 | 0.001 |
| Cerkl | 4.2 | 0.000 | Zfp608 | 2.1 | 0.000 | Mme | 6.4 | 0.001 | Mmd2 | 3.2 | 0.000 | Ccnd2 | 2.1 | 0.000 |
| Plxdc2 | 4.0 | 0.000 | Gpr123 | 2.1 | 0.001 | Gfra2 | 6.1 | 0.001 | Aldh1a3 | 3.1 | 0.009 | Lamb11 | 2.1 | 0.000 |
| Lmo1 | 3.8 | 0.000 | Isoc1 | 2.1 | 0.000 | Sytl2 | 6.1 | 0.000 | Lmo2 | 3.1 | 0.000 | Angptl4 | 2.1 | 0.001 |
| Btg2 | 3.7 | 0.000 | Tbl1xr1 | 2.1 | 0.003 | Agtrl1 | 6.0 | 0.006 | Ccdc68 | 3.0 | 0.000 | Lrrc4c | 2.1 | 0.001 |
| Samd5 | 3.7 | 0.001 | Rnasep1 | 2.1 | 0.000 | Cdh8 | 5.9 | 0.001 | Cldn11 | 3.0 | 0.006 | Hbbbh1 | 2.1 | 0.000 |
| Art1 | 3.6 | 0.000 | Wdr37 | 2.1 | 0.004 | Syt17 | 5.7 | 0.004 | Sorbs1 | 3.0 | 0.000 | Kcnab2 | 2.1 | 0.001 |
| Gadd45a | 3.6 | 0.001 | Nudcd2 | 2.0 | 0.000 | Cux2 | 5.6 | 0.000 | Angpt2 | 3.0 | 0.003 | Gab2 | 2.1 | 0.002 |
| Cxcr4 | 3.5 | 0.000 | Amigo2 | 5.6 | 0.005 | Lum | 3.0 | 0.003 | Paqr4 | 2.1 | 0.000 | |||
A complete list of the 259 genes that were differentially expressed in SG versus VG neurons at E12. There were 103 genes enriched by >2-fold in SG neurons and 156 genes enriched by >2-fold in VG neurons (p < 0.01). Genes are identified by official gene names and are ranked by the average fold difference (Fold diff). The p value for that difference, as determined by comparing expression levels in three biological replicates for each tissue type, is also reported.
Pairwise analysis of microarray data
Although microarray studies offer a rapid and convenient way to reveal broad trends in gene expression, it is challenging to identify individual genes associated with specific functions within such a large dataset. For instance, hierarchical clustering may group genes with highly variable expression together with those that are expressed more reproducibly. Moreover, a simple pairwise comparison provides only a snapshot of gene expression and fails to take into account important differences over time. For instance, among the clusters exhibiting early expression, none showed enriched expression in the SG or VG at early stages. Nonetheless, we know that such genes exist, one of which (Rnx) we took advantage of for genetic labeling of the VG at E12 and E13. Conversely, the pairwise comparison of SG and VG at E12 revealed differential expression of Neurog1, which we know is in fact expressed by VG neurons at earlier stages (Koundakjian et al., 2007). Therefore, we reanalyzed the data to define those genes that exhibit the most statistically significant changes in expression over time or between the two tissue types (Fig. 4A). We performed 66 pairwise comparisons between the two populations and across all the time points, chose the top 200 most reliably differentially expressed genes from each comparison, with a minimum 1.5-fold expression level change, and then combined all the genes from the 66 comparisons into one list. Since many genes came up repeatedly from multiple comparisons, we were able to hone the list to 3070 genes. Thus, the final “signature gene list” consists of genes whose expression levels differ significantly between the SG and VG and/or change significantly over time. We then categorized each gene according to whether it was expressed in both the SG and VG, or enriched (>1.5-fold higher) in one population or the other, and according to whether peak expression was reached at the early (E12), mid (E13-P6), or late (P15) time points. Table 2 shows a selection of genes from the signature gene list that are enriched in the mid and late SG. Notably, these include a number of transcription factors and axon guidance molecules, as well as immune and other interesting genes, paralleling the trends observed in the hierarchical cluster analysis. The signature gene list is also available for download and as a searchable database online (http://goodrich.med.harvard.edu/) (Fig. 4B).
Table 2.
SG-enriched genes at mid and late developmental stages
| SG-enriched genes | |
|---|---|
| Mid | |
| Avian musculoaponeurotic fibrosarcoma v-maf oncogene homolog (c-Maf) | Platelet-derived growth factor receptor-like (Pdgfrl) |
| BMP-binding endothelial regulator (Bmper) | Plexin D1 (Plxnd1) |
| Bone-morphogenetic protein 2 (Bmp2) | Proprotein convertase subtilisin/kexin type 5 (Pcsk5) |
| Cerebral cavernous malformation 2 homolog (Ccm2) | Regulator of G-protein signaling 3 (Rgs3) |
| Chromodomain helicase DNA binding protein 4 (Chd4) | Sodium channel, voltage-gated, type II, beta (Scn2b) |
| Cytokine like 1 (Cytl1) | Synaptotagmin-like 2 (Sytl2) |
| Fras1-related extracellular matrix protein 2 (Frem2) | Synaptotagmin XVII (Syt17) |
| Insulin-like growth factor-binding protein 7 (Igfbp7) | T-box18 (Tbx18) |
| Leucine-rich repeat-containing G-protein-coupled receptor 5 (Lgr5) | Transcription factor 25 (basic helix-loop-helix) (Tcf25) |
| Lin-7 homolog A (Lin7a) | Transforming growth factor, beta 2 (Tgfb2) |
| Lipid phosphate phosphatase-related protein type 4 (Lppr4) | Tumor necrosis factor receptor superfamily, member 19 (Tnfrsf19) |
| Low-density lipoprotein receptor-related protein 10 (Lrp10) | v-maf musculoaponeurotic fibrosarcoma oncogene family, protein B (Mafb) |
| MAP kinase-activated protein kinase 2 (Mapkapk2) | Zinc finger and BTB domain containing 48 (Zbtb48) |
| Late | |
| C1q and tumor necrosis factor-related protein 5 (C1qtnf5) | Interferon (alpha and beta) receptor 2 (Ifnar2) |
| CCAAT/enhancer-binding protein (C/EBP), alpha (Cebpa) | Interferon gamma-induced GTPase (Igtp) |
| CCAAT/enhancer-binding protein (C/EBP), delta (Cebpd) | Interferon-induced transmembrane protein 3 (Ifitm3) |
| Chemokine (C-X-C motif) ligand 14 (Cxcl14) | MACRO domain containing 1 (Macrod1) |
| Complement component 1, q subcomponent, beta polypeptide (C1qb) | Matrix metallopeptidase 13 (Mmp13) |
| Hippocalcin (Hpca) | Nuclear receptor subfamily 1, group H, member 2 (Nr1h2) |
| Histocompatibility 2, class II, locus DMa (H2-DMa) | Nuclear receptor subfamily 4, group A, member 1 (Nr4a1) |
| Histocompatibility 2, K1, K region (H2-K1) | Potassium channel, subfamily T, member 1 (Kcnt1) |
| Histocompatibility 2, T region locus 10 (H2-T10) | Prostaglandin E receptor 4 (subtype EP4) (Ptger4) |
| Histocompatibility 2, T region locus 23 (H2-T23) | Secreted frizzled-related protein 2 (Sfrp2) |
| Insulin-like growth factor 1 (Igf1) | Slit homolog 3 (Slit3) |
| Interferon activated gene 204 (Ifi204) | Stabilin 1 (Stab1) |
| Stabilin 2 (Stab2) | |
A representative subset of genes from the signature gene list with mid and late SG-enriched expression, arranged alphabetically. Mid SG genes include transcription factors, cell surface molecules and channels, and secreted growth factors, as well as intracellular signaling molecules. Late SG genes include transcription factors, secreted factors, ECM and other cell surface molecules, and immune genes.
Validation of spatiotemporal expression patterns
We generated the signature gene list with the goal of having a biologically accurate fingerprint of gene expression in SG neurons at any stage of development, information that is crucial for discovering genes associated with specific stages of auditory circuit assembly, for analyzing phenotypes in mutant mice, and for assessing the identity of SG neurons generated from stem cells in vitro. However, microarray studies are often compromised by biological and technical variables, such as genetic background and the strength of probe hybridization. Therefore, to verify that genes on the signature list reflect actual expression patterns in the inner ear, we performed a series of validation experiments. First, to confirm changes in gene expression over time, we chose an “early” and “late” SG gene and performed in situ hybridization at multiple time points. Natriuretic peptide receptor 2 (Npr2), a transmembrane receptor for the C-type natriuretic peptide, shows peak microarray expression levels at E12, with expression tapering off at mid stages and increasing modestly at later stages (Fig. 5A). In situ hybridization confirmed these trends, with strong expression of Npr2 in the SG at E12 and continued expression at E16 and P15. Similarly, prostaglandin D2 synthase (Ptgds), which shows very low microarray expression levels at early stages but reaches peak levels at P15, was undetectable by in situ hybridization at E12 and E16, but was strongly expressed at P15 (Fig. 5B).
Figure 5.

Validation of spatiotemporal gene expression profiles. Genes with temporal (A, B) or spatial (C, D) differences in expression were selected from the signature gene list and confirmed by in situ hybridization (A–D) or RT-PCR (D) at the stages indicated. Gene expression profiles are plotted as in Figure 3. E12, E15, and E16 embryos were sectioned transverse to the ear; mid-modiolar sections are shown for E15 and E16. P6 and P15 cochleae were processed for whole-mount in situ hybridization and flat mounted, with the SG at the bottom and the organ of Corti at the top. In all panels, the SG is indicated by black arrowheads and the VG by open arrowheads. The arrow in B indicates positive signal for Ptgds outside of the ear, confirming that the experiment was successful. For the RT-PCR, Gapdh was used as a positive control to confirm the presence of cDNA. D, Dorsal; L, lateral; *, cochlear duct; hb, hindbrain; u, utricle. Scale bars: (A) 100 μm for E12 and E16, 20 μm for P15; (D) 50 μm.
Next, we examined whether the reported differences in tissue-specific expression are also physiologically relevant. Specific and reliable genetic markers for tissues or cell populations provide important tools for studying those cells. For example, the identification of Rnx and MafB as markers for the VG and SG, respectively, permitted us to cleanly isolate tissue for these experiments. However, since Rnx is downregulated in the VG after E13 (Fig. 4C), and MafB expression does not begin in the SG until E13 (Fig. 1C), we looked for genes that are enriched in the SG or VG at all of the time points in our dataset. We found that Netrin-G1 (Ntng1), a GPI-linked protein related to the Netrin family of axon guidance molecules, is enriched in the SG at all stages (Fig. 5C). In situ hybridization confirmed that at E12, Ntng1 is expressed in the SG, but not the VG (Fig. 5C). This expression persists at P6 and P15, as revealed by whole-mount in situ hybridization (Fig. 5C). Conversely, the microarray data indicated that the secreted cytokine Tafa2 (also known as Fam19a2) is strongly enriched in the VG (Fig. 5D). We confirmed by in situ hybridization that at E12 and E15, Tafa2 is indeed expressed in the VG, but not the SG (Fig. 5D; data not shown). RT-PCR confirmed sustained expression of Tafa2 in the VG at P0 and P15; no Tafa2 was detected in the postnatal SG. Therefore, expression of Ntng1 and Tafa2 can be used to distinguish auditory and vestibular neurons at any stage of development.
Overall, we have performed in situ hybridization at one or more time points for >50 genes from our microarray data, and observed the expected pattern in the vast majority of cases. Thus, we are confident that our dataset is reliable and accurately reflects spatiotemporal gene expression.
Identification of early SG- or VG-specific transcription factors
To use our data to gain insights into mechanisms of auditory circuit assembly, we focused on the earliest stages of development, when SG neurons are specified and begin to make their initial wiring decisions. Both the hierarchical clustering analysis and pairwise comparisons showed that SG and VG neurons are initially quite similar, but then diverge as they mature. These results suggest that common transcriptional networks regulate general programs of neuronal specification, while cell type-specific transcription factors coordinate the differential expression of downstream targets as the neurons mature. Indeed, both SG and VG neuron progenitors initially express the transcription factor Neurogenin-1 (Neurog1), delaminate, and then express another transcription factor, NeuroD (Appler and Goodrich, 2011). However, little is known about the transcription factors that act subsequently to promote auditory-specific features of development in SG neurons.
Previous studies implicated the transcription factor Gata3 as a likely regulator of early SG neuron development. In support of this idea, Gata3 protein was reported to mark SG but not VG neurons in E13 mouse embryos (Lawoko-Kerali et al., 2004) and also in chick embryos (Jones and Warchol, 2009). Moreover, there is a severe reduction in the size of the cochlear-vestibular ganglion in Gata3 mutant mice, a finding interpreted to reflect a specific loss of SG neurons (Karis et al., 2001). Our microarray data indicate a dynamic profile of Gata3 expression, with levels varying between cell types and over time (Fig. 6A). Unexpectedly, Gata3 showed similar levels of expression in the SG and VG at E12. Expression was maintained at high levels in the SG through P0, but rapidly declined in the VG, such that it was >2-fold lower in the VG compared with the SG at E13 and absent from the VG by E16.
Figure 6.

Dynamic expression patterns of Gata3 in the SG and VG. A, Graph showing microarray expression of Gata3 in the SG and VG, plotted as in Figure 3. At E12, Gata3 is <1.5-fold enriched in the VG. Based on the Affymetrix presence call (data not shown), Gata3 is still present in the VG at E13, but is absent from the VG from E16–P15, while it is present in the SG through P0. B–B″, Multiple sections through a single E12 ear showing in situ hybridization signal for Gata3. Expression is evident in the SG (blue dotted line), but is also strong in a subset of VG cells (red dotted line). C, C′, Gata3 (red) and GFP (green) immunofluorescence in an E11 Rnx-Cre;Z/EG embryo. The VG is indicated by the white dotted line demarcating the GFP-positive region (C). A magnified image of the boxed area in C is shown in C′. Gata3 signal is evident in the nuclei of some GFP-positive cells (yellow arrowhead), but not of other GFP-positive cells (white arrowhead), indicating that Gata3 is expressed in a subset of VG neurons (C′).
To determine whether the early presence of Gata3 in the VG reflects actual expression patterns, we performed in situ hybridization for Gata3. We found strong Gata3 expression in a subset of VG neurons, as shown in multiple sections through a single inner ear at E12 (Fig. 6B–B″). This corroborates previous work showing that Gata3 transcripts can be detected in scattered cells in the VG at E14 (Lillevali et al., 2004). We also examined Gata3 protein expression by immunofluorescence in E11 Rnx-Cre;Z/EG embryos, in which the VG is labeled with GFP (Fig. 6C). Gata3 signal was observed in the nuclei of some GFP-positive cells (Fig. 6C′, yellow arrowhead), but not of other GFP-positive cells (Fig. 6C′, white arrowhead), confirming that Gata3 is expressed in a subset of VG neurons. Since VG neurons must innervate the sensory epithelia of the three semicircular canals, the utricle, and the saccule, one possibility is that Gata3 marks a subpopulation of VG neurons that innervate a particular vestibular organ or target particular types of hair cells.
To identify other transcription factors that may direct the divergence of SG and VG neurons, we mined the signature gene list for transcription factors that are enriched in early SG or VG neurons. Of the 113 “early” genes annotated as transcription factors, 96 showed microarray expression in both the SG and VG, while 12 were SG-enriched and five were VG-enriched. We verified the expression of two SG-enriched and two VG-enriched transcription factors by in situ hybridization (Fig. 7). At early stages, Prox1 (Fig. 7A,A′) and Zfpm2 (Fig. 7B,B′) are expressed in the SG but not the VG, while Tbx3 (Fig. 7C,C′) and Runx1 (Fig. 7D,D′) are enriched in the VG compared with the SG. Moreover, mice lacking Prox1 exhibit disorganized peripheral innervation of the cochlea, confirming the importance of this SG-enriched factor for auditory circuit assembly (Fritzsch et al., 2010). A more complete understanding of the transcriptional networks that underlie SG development and differentiation awaits analysis of additional mouse mutants and identification of target genes by microarray analysis and chromatin immunoprecipitation.
Figure 7.

Early SG- and VG-specific transcription factors. A–D, Transcription factors with enriched expression in auditory (A, B) or vestibular (C, D) neurons at the earliest time point (E12) were identified by analysis of microarray data, plotted as in Figure 3. The predicted cell type-specific expression in SG (black arrowheads) or VG (open arrowheads) is seen by in situ hybridization at E12 (A′–D′). Sections are in the transverse plane; dorsal is up and lateral is right. Scale bar, 100 μm.
The SG and VG express different members of the same family of transmembrane proteins
One of the primary functions for early-acting transcription factors in neurons is to control expression of axon guidance receptors and other transmembrane proteins that direct early wiring events. However, apart from the neurotrophins and their receptors, few molecules have been implicated in auditory- or vestibular-specific guidance events (Fekete and Campero, 2007). Such information is critical for designing strategies to encourage growth of SG axons following injury and for integration of implanted stem cells into the auditory circuit. We therefore asked which transmembrane proteins are restricted to auditory or vestibular ganglion neurons during initial stages of outgrowth. A handful of genes encoding known axon guidance molecules, including Bmpr1b and EphA5, were enriched in the early SG (Fig. 8A,B). Eph signaling has been implicated in SG axon outgrowth in vitro and in auditory circuit assembly in the hindbrain (Brors et al., 2003; Cramer, 2005). However, while Bmp signaling is known to be crucial for patterning of the inner ear (Ohta et al., 2010; Ohyama et al., 2010), no role in SG axon guidance has been described.
Figure 8.
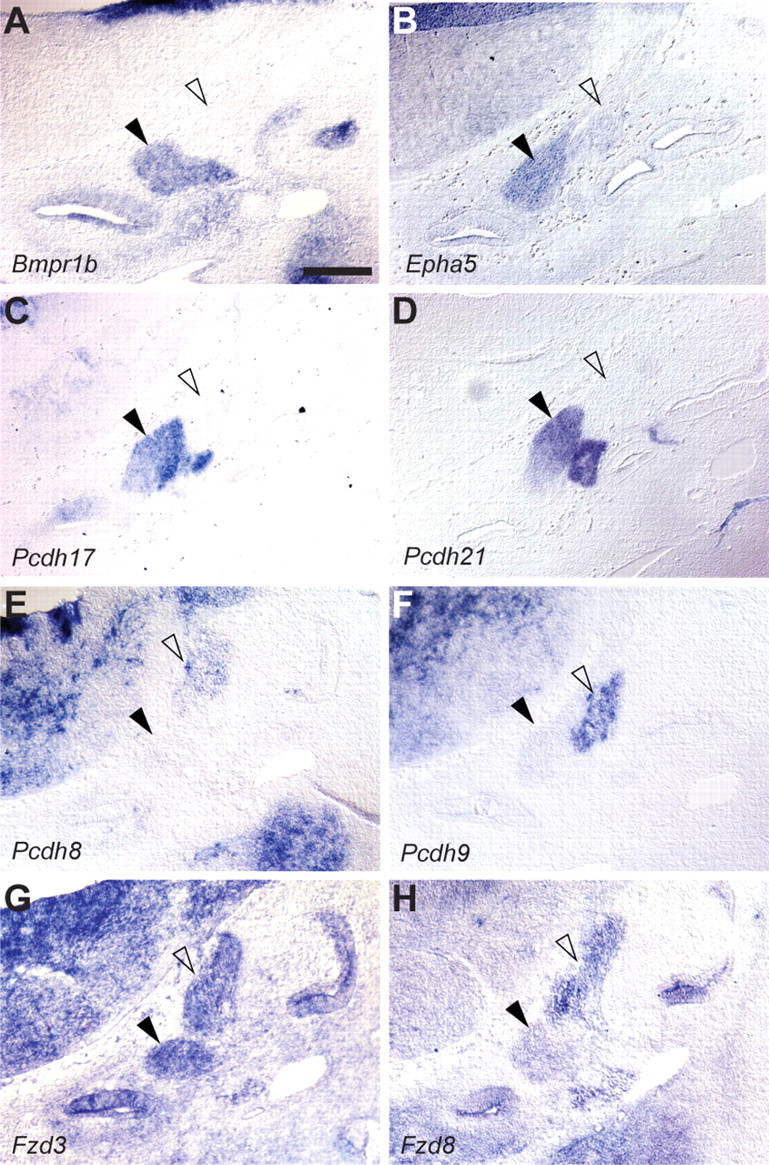
Early differential expression of cell surface proteins. A–H, During axon guidance stages of development, SG and VG neurons express different combinations of cell surface receptors, as revealed by in situ hybridization to E12 embryos sectioned in the transverse plane. For instance, expression of BMP receptor 1b (A) and EphA5 receptor (B) is enriched in SG (black arrowheads) compared with VG neurons (open arrowheads). In addition, the SG and VG express different members of the protocadherin (Pcdh) family of cell surface proteins (C–F) as well as unique combinations of the Frizzled (Fzd) receptors (G, H). Dorsal is up and lateral is right. Scale bar, 100 μm.
Closer examination of the list of cell surface proteins revealed that the SG and VG often express different members of a given family of transmembrane proteins. For example, the SG and VG express different members of the large protocadherin family of genes (Fig. 8C–F), which have been implicated in neuronal survival (Lefebvre et al., 2008), axon outgrowth (Uemura et al., 2007), and target selection (Hasegawa et al., 2008; Katori et al., 2009). The SG expresses Pcdh17 and Pcdh21 (Fig. 8C,D), while the VG expresses Pcdh8 and Pcdh9 (Fig. 8E,F). Similarly, while the Wnt receptor Fzd3 is expressed in both the SG and VG at E12 (Fig. 8G), a different family member, Fzd8, is more strongly expressed in the VG compared with the SG (Fig. 8H). These data suggest that these two closely related populations of neurons may be able to use common downstream signaling machinery to respond differentially to environmental cues that direct such processes as axon outgrowth and guidance. Together, our findings indicate that subtle differences in the types of transcription factors and guidance molecules expressed by SG and VG may be sufficient to initiate development of nonoverlapping circuits that mediate entirely distinct neuronal functions.
Identification of a SG axon branching gene, Npr2
During development, SG neurons make a series of decisions that ultimately result in the assembly of precisely wired circuits. Our data suggest that many of these events are relatively generic and depend on general programs of neurogenesis, while others are more specific to auditory neurons, as highlighted by the presence of several auditory-specific transcription factors and guidance molecules. To learn how individual genes contribute to SG development, we focused on one specific feature of the final wiring diagram, namely the bifurcation of SG axons as they project into the auditory brainstem. This bifurcation is a fundamental feature of auditory circuits that likely enables parallel processing of auditory stimuli in the brainstem. However, little is known about when or how SG neurons branch or how the presence of this branch point influences the perception of sound.
To determine when this event occurs, we visualized developing auditory and vestibular nerves using Gata3 promoter-driven taulacZ (van Doorninck et al., 1999) and fluorescent dye labeling. We found that SG axons are actively branching at E12 and E13 (Fig. 9A), also confirmed using Cre-mediated expression of conditional reporters and dye labeling (Fig. 9D; data not shown), while this process is essentially finished in VG axons by E12 (Fig. 9B). Therefore, we reasoned that the expression of likely branching factors would be enhanced in the SG at early stages. We also predicted that branching would be initiated by transmembrane proteins capable of sensing cues in the environment. With these criteria in mind, we set parameters to find genes with predicted transmembrane domains that were enriched by twofold in SG neurons during axon branching stages (E12, E13) compared with stages when branching is complete in SG neurons (E16) or in VG neurons (E12, E13) (Fig. 9C).
Figure 9.

Identification of Npr2 as a SG axon branching gene. A, B, A diagram of the SG and its projections early in embryogenesis. To determine when SG axons branch, embryos expressing the axonal marker tauLacZ under the control of the Gata3 promoter were collected at E11.5, E12, and E14, stained for β-galactosidase activity, and flat mounted. Images correspond to the boxed area. Visualization of X-gal-stained projections shows that bifurcation begins after E11.5, with a few ascending and descending branches (arrowheads) apparent at E12. By E14, many more branched axons are present. In contrast, VG axon branches have already formed by E12, as revealed by anterograde labeling with DiI (B). C, Twenty candidate axon branching genes were defined based on their expression profiles in SG (blue) and VG (red) neurons, their predicted structures, and their in situ hybridization expression patterns. D, Individual axon branches (white arrowheads) and their branch points (yellow arrowheads) can be visualized in Neurog1-CreERT2;RC::rePe mice, which express GFP in a sparse population of SG neurons. E, In Npr2cn homozygous mutants, axons turn (yellow arrowhead) but do not bifurcate, leaving single branches that extend in both directions (white arrowheads). Scale bar, 50 μm.
We identified 72 candidate genes, and performed in situ hybridization at E12 to screen through these candidates. Candidate genes were prioritized based on known functions and the availability of mutants, and the top 25 genes were examined by in situ hybridization. Of these, 20 showed expression in the SG but not in the VG at E12, further underscoring the reliability of our dataset (data not shown). Of the five genes that did not show the expected expression pattern, two were indeed in the SG, but were also in a subset of VG neurons, in the region that was likely discarded during microdissection. The remaining three were in the surrounding mesenchyme or epithelium, indicating modest contamination with surrounding tissue. Among the 20 candidate genes, Npr2 stood out due to its striking expression pattern (Fig. 5A) and known involvement in axon branching in dorsal root ganglion neurons (Schmidt et al., 2007, 2009).
To test whether Npr2 is required for auditory circuit assembly, we obtained a previously characterized mutant strain (Schmidt et al., 2007) and examined the central SG projections. To assess branching, we took advantage of the fact that sparse, leaky recombination of the RC::rePe GFP reporter allele is driven by the Neurog1-CreERT2 transgene (Koundakjian et al., 2007), even in the absence of tamoxifen. This made it possible to trace the trajectories of individual SG axons and their branches. While neurons in littermate controls showed normal branching (Fig. 9D), Npr2cn/cn mutant axons did not form two well developed processes, but instead extended one branch that turned either rostrally or caudally (Fig. 9E). Future analysis of how Npr2 mutant animals perceive sound offers the exciting opportunity to determine the functional significance of this stereotyped branching present in all auditory afferents connecting the cochlea to the brain. This highlights the usefulness of our microarray resource for the discovery of genes required for hearing.
Discussion
SG neurons share many features with other sensory neurons, but ultimately integrate into circuits dedicated to the perception of sound. Here, we used microarrays to define the programs of gene expression associated with these events. We found that SG and VG neurons express genes associated with neurogenesis at early stages and then transition to expression of genes important for mature function. In parallel, each population gradually expresses more cell type-specific genes. Aside from enhanced expression of TGFβ and EGF signaling components in the SG and VG, respectively, these differences do not fall into obvious categories. Moreover, genes that are “auditory-specific” at one time point, such as Gata3, can be expressed by vestibular neurons at other stages. We therefore defined new cohorts of transcription factors and axon guidance molecules that are restricted to SG or VG neurons during early wiring. We propose that these and other SG-enriched genes govern auditory-specific features of circuit assembly. Indeed, mutations in one SG-enriched gene, Npr2, prevent SG axon bifurcation and fundamentally alter the auditory wiring diagram. Together, these studies highlight the complexity of auditory circuit assembly, demonstrate a role for a newly identified SG-enriched gene for auditory wiring, and provide a useful molecular toolbox for studying mechanisms of auditory development and function.
The primary concern in any microarray study is whether the data reflect true trends in gene expression in vivo. Several results confirm the biological relevance of our data. First, the clustering analysis revealed expected trends in gene expression over time. For instance, young SG and VG are enriched for genes associated with cell fate determination events, such as gene regulation, while older neurons express more genes linked to mature function, such as metabolic genes. Second, in situ hybridization analysis of >50 genes validated the predicted spatiotemporal expression patterns. Third, by defining additional criteria, we were able to use this dataset to identify a candidate branching factor and show that it is indeed required for SG axon bifurcation. Thus, we are confident that these data will be a useful resource for auditory neuroscientists.
Nevertheless, some caveats apply. First, because our studies included such a wide range of time points, it was necessary to use multiple genetic backgrounds and techniques to isolate tissue, potentially introducing additional variability into our data. For example, the microdissected samples may include glia, whereas the FACS-sorted samples likely do not. Similarly, although we did our best to purify the SG and VG, a small proportion of genes may be expressed in surrounding populations. Hence, individual candidate genes should be confirmed using independent methods such as RT-PCR or in situ hybridization. Ultimately, while our data offer a good starting point to identify potential players and generate new hypotheses, functional experiments must be performed for any gene of interest, as we have for Npr2.
Although previous microarrays have examined adult SG neurons or compared closely related CNS populations (Arlotta et al., 2005; Lobo et al., 2006; Cahoy et al., 2008; Marsh et al., 2008; Shah et al., 2009), our study is distinctive in the breadth of time points it encompasses. Such a broad overview of gene expression highlights the complexity of the molecular programs associated with auditory circuit assembly over time. For instance, expression is temporally dynamic and few genes are restricted to one population at all stages of development. Hence, binary comparisons at one time point may reveal misleading differences in gene expression. For instance, although Gata3 was previously reported to be expressed in SG but not VG neurons (Lawoko-Kerali et al., 2004; Jones and Warchol, 2009), our data reveal a more complex picture, with transient but strong expression in a subset of VG neurons. Since the cochlea is thought to be an evolutionary derivative of the saccule (Beisel et al., 2005), SG neurons innervating the cochlea may share a common origin with the Gata3-positive VG neurons. Moreover, Gata3 has dose-dependent effects (Van Esch et al., 2000; van Looij et al., 2005), emphasizing the fact that protein levels also matter. In addition, factors common to the SG and VG may play fundamentally distinct roles due to the availability of specific cofactors in one population or the other. Thus, while differences exist, understanding the biological significance of such differences will require a concerted research effort.
The complexity of the molecular differences between SG and VG neurons has important implications for efforts to piece together the road map necessary to coax stem cell-derived neurons to differentiate as SG neurons and integrate properly into auditory circuits. For example, the fact that SG and VG neurons often express the same genes but at different times suggests that a carefully timed combination of transcription factors and culture conditions may be needed to steer stem cells reliably toward the auditory rather than the vestibular fate. Previously, induction of Neurog1 expression in ES cells was shown to result in expression of downstream genes such as NeuroD and Brn3a, both of which are transiently expressed in VG neurons (Reyes et al., 2008), as well as Gata3, which we have shown is also expressed in VG neurons. Moreover, implanted neurons did not appear to integrate into the circuit. One possibility is that early-acting transcription factors cooperate with later-acting transcription factors to control the terminal differentiation of SG neurons. Indeed, a handful of transcription factors are enriched in the late SG (Cebpa, Cebpd, Ifi204, Marcod1, Nr1h2, and Nr4a1) and might play important roles in auditory function. In addition, the effects of any one transcription factor may be influenced by the general culture conditions. Our data reveal an enrichment for TGFβ family member signaling in the SG, as confirmed by expression of Bmpr1b. If this differential sensitivity is physiologically relevant, these pathways may offer a useful point of entry for nudging stem cells toward the auditory fate.
Our results also emphasize the need for more comprehensive evaluation of the SG fate both in vitro and in vivo. Previously, reliable markers for auditory and vestibular neurons have not been available, making it difficult to assess the effectiveness of any attempt to induce auditory neurons in vitro. Our results suggest that Ntng1 and Tafa2 may fill this gap; moreover, researchers will be able to probe the molecular status of newly generated neurons by comparing results from their own microarray studies to our data. The availability of a broader panel of markers will also improve phenotypic studies of mutant mouse models. For instance, in the absence of useful markers, the nature of the neurons that remain in the Gata3 mutant mouse is unclear (Karis et al., 2001). Our observation that Gata3 is indeed present in VG neurons suggests that this phenotype should be revisited.
Although we have focused on genes involved in early circuit assembly events, our data also revealed several surprising trends that will inform future studies of other aspects of auditory development. For example, a large number of immune genes are upregulated in the SG at early postnatal stages, including MHC class I and class II and complement genes. Given the growing evidence for immune gene function during synaptic refinement in the visual system (Shatz, 2009), it is possible that similar pathways underlie activity-dependent synaptic remodeling in SG neurons. Cat SG projections to the cochlear nucleus exhibit coarser tonotopy at neonatal stages than in the adult (Leake et al., 2002), suggesting that refinement does occur. Another interesting observation was the expression of several synaptic genes, such as synaptotagmin-2, as early as E12, well before synaptogenesis (data not shown). A similar finding was described in migrating interneurons (Marsh et al., 2008). Notably, synaptophysin-GFP localizes to axonal branch points in zebrafish retinal ganglion neurons (Meyer and Smith, 2006), suggesting that synaptic proteins may participate in cellular events before synaptogenesis, such as vesicle trafficking or adhesion.
In addition to the trends uncovered by our own analysis, these data can be used by other researchers to identify still more markers and candidate genes for auditory system development and function. For example, within any given frequency region, SG neuron fibers fall into one of three categories: high, medium, and low spontaneous discharge rate (Liberman, 1978; Taberner and Liberman, 2005). The identification of molecular markers distinguishing between these different types of SG neurons would aid significantly in studies addressing coding within the SG. In addition, by searching for genes with specific spatiotemporal expression patterns and then cross-referencing to the GENSAT resource (Gong et al., 2003), individual researchers can identify GFP and Cre mouse strains to facilitate their work. Finally, our data offer a new source of candidate genes for human deafness and auditory processing disorders. For example, we found that SG neurons express Mab21l1, a candidate gene for autism and auditory processing deficits (Smith et al., 2002). In addition, we noted that several genes expressed in the SG (e.g., Pdlim5, Bmpr1b, Grid2, Smarcad1, and Unc5c) are clustered in a genomic locus associated with musical aptitude (Pulli et al., 2008). Hence, this catalog will complement ongoing efforts to use mouse genetics to understand more complex aspects of auditory function and dysfunction (Moore, 2006).
Footnotes
Funding was provided by NIH/NIDCD Grant R01 DC009223 (L.V.G.), NIH/NIDCD Grant F32 DC008228 (C.C.L.), March of Dimes Grant 1-FY08-381 (L.V.G.), the National Organization for Hearing Research (C.C.L.), and a Stuart H.Q. and Victoria Quan Fellowship (J.M.A.). We thank S. Darin for assistance with gene ontology statistical analysis; M. Arbeitman for helpful advice; M. Gordon for help with online database construction; and S. Dymecki, Q. Ma, and S. Takahashi for sharing transgenic strains.
References
- Abraira VE, Del Rio T, Tucker AF, Slonimsky J, Keirnes HL, Goodrich LV. Cross-repressive interactions between Lrig3 and netrin 1 shape the architecture of the inner ear. Development. 2008;135:4091–4099. doi: 10.1242/dev.029330. [DOI] [PMC free article] [PubMed] [Google Scholar]
- Appler JM, Goodrich LV. Connecting the ear to the brain: molecular mechanisms of auditory circuit assembly. Prog Neurobiol. 2011;93:488–508. doi: 10.1016/j.pneurobio.2011.01.004. [DOI] [PMC free article] [PubMed] [Google Scholar]
- Arlotta P, Molyneaux BJ, Chen J, Inoue J, Kominami R, Macklis JD. Neuronal subtype-specific genes that control corticospinal motor neuron development in vivo. Neuron. 2005;45:207–221. doi: 10.1016/j.neuron.2004.12.036. [DOI] [PubMed] [Google Scholar]
- Azim E, Shnider SJ, Cederquist GY, Sohur US, Macklis JD. Lmo4 and Clim1 progressively delineate cortical projection neuron subtypes during development. Cereb Cortex. 2009;19(Suppl 1):i62–i69. doi: 10.1093/cercor/bhp030. [DOI] [PMC free article] [PubMed] [Google Scholar]
- Beisel KW, Wang-Lundberg Y, Maklad A, Fritzsch B. Development and evolution of the vestibular sensory apparatus of the mammalian ear. J Vestib Res. 2005;15:225–241. [PMC free article] [PubMed] [Google Scholar]
- Brors D, Bodmer D, Pak K, Aletsee C, Schäfers M, Dazert S, Ryan AF. EphA4 provides repulsive signals to developing cochlear ganglion neurites mediated through ephrin-B2 and -B3. J Comp Neurol. 2003;462:90–100. doi: 10.1002/cne.10707. [DOI] [PubMed] [Google Scholar]
- Cahoy JD, Emery B, Kaushal A, Foo LC, Zamanian JL, Christopherson KS, Xing Y, Lubischer JL, Krieg PA, Krupenko SA, Thompson WJ, Barres BA. A transcriptome database for astrocytes, neurons, and oligodendrocytes: a new resource for understanding brain development and function. J Neurosci. 2008;28:264–278. doi: 10.1523/JNEUROSCI.4178-07.2008. [DOI] [PMC free article] [PubMed] [Google Scholar]
- Chen ZY, Corey DP. Understanding inner ear development with gene expression profiling. J Neurobiol. 2002;53:276–285. doi: 10.1002/neu.10125. [DOI] [PubMed] [Google Scholar]
- Cramer KS. Eph proteins and the assembly of auditory circuits. Hear Res. 2005;206:42–51. doi: 10.1016/j.heares.2004.11.024. [DOI] [PubMed] [Google Scholar]
- Fekete DM, Campero AM. Axon guidance in the inner ear. Int J Dev Biol. 2007;51:549–556. doi: 10.1387/ijdb.072341df. [DOI] [PubMed] [Google Scholar]
- Fourgeaud L, Davenport CM, Tyler CM, Cheng TT, Spencer MB, Boulanger LM. MHC class I modulates NMDA receptor function and AMPA receptor trafficking. Proc Natl Acad Sci U S A. 2010;107:22278–22283. doi: 10.1073/pnas.0914064107. [DOI] [PMC free article] [PubMed] [Google Scholar]
- Fritzsch B, Dillard M, Lavado A, Harvey NL, Jahan I. Canal cristae growth and fiber extension to the outer hair cells of the mouse ear require Prox1 activity. PLoS One. 2010;5:e9377. doi: 10.1371/journal.pone.0009377. [DOI] [PMC free article] [PubMed] [Google Scholar]
- Fritzsch B, Jahan I, Pan N, Kersigo J, Duncan J, Kopecky B. Dissecting the molecular basis of organ of Corti development: Where are we now? Hear Res. 2011;276:16–26. doi: 10.1016/j.heares.2011.01.007. [DOI] [PMC free article] [PubMed] [Google Scholar]
- García-Alonso L, Romani S, Jiménez F. The EGF and FGF receptors mediate neuroglian function to control growth cone decisions during sensory axon guidance in Drosophila. Neuron. 2000;28:741–752. doi: 10.1016/s0896-6273(00)00150-1. [DOI] [PubMed] [Google Scholar]
- Gong S, Zheng C, Doughty ML, Losos K, Didkovsky N, Schambra UB, Nowak NJ, Joyner A, Leblanc G, Hatten ME, Heintz N. A gene expression atlas of the central nervous system based on bacterial artificial chromosomes. Nature. 2003;425:917–925. doi: 10.1038/nature02033. [DOI] [PubMed] [Google Scholar]
- Hall A, Lalli G. Rho and Ras GTPases in axon growth, guidance, and branching. Cold Spring Harb Perspect Biol. 2010;2:a001818. doi: 10.1101/cshperspect.a001818. [DOI] [PMC free article] [PubMed] [Google Scholar]
- Harris JA, Rubel EW. Afferent regulation of neuron number in the cochlear nucleus: cellular and molecular analyses of a critical period. Hear Res. 2006;216–217:127–137. doi: 10.1016/j.heares.2006.03.016. [DOI] [PubMed] [Google Scholar]
- Hasegawa S, Hamada S, Kumode Y, Esumi S, Katori S, Fukuda E, Uchiyama Y, Hirabayashi T, Mombaerts P, Yagi T. The protocadherin-alpha family is involved in axonal coalescence of olfactory sensory neurons into glomeruli of the olfactory bulb in mouse. Mol Cell Neurosci. 2008;38:66–79. doi: 10.1016/j.mcn.2008.01.016. [DOI] [PubMed] [Google Scholar]
- Hildebrand MS, de Silva MG, Klockars T, Campbell CA, Smith RJ, Dahl HH. Gene expression profiling analysis of the inner ear. Hear Res. 2007;225:1–10. doi: 10.1016/j.heares.2007.01.015. [DOI] [PubMed] [Google Scholar]
- Houseman EA, Coull BA, Betensky RA. Feature-specific penalized latent class analysis for genomic data. Biometrics. 2006;62:1062–1070. doi: 10.1111/j.1541-0420.2006.00566.x. [DOI] [PubMed] [Google Scholar]
- Houseman EA, Christensen BC, Yeh RF, Marsit CJ, Karagas MR, Wrensch M, Nelson HH, Wiemels J, Zheng S, Wiencke JK, Kelsey KT. Model-based clustering of DNA methylation array data: a recursive-partitioning algorithm for high-dimensional data arising as a mixture of beta distributions. BMC Bioninformatics. 2008;9:365. doi: 10.1186/1471-2105-9-365. [DOI] [PMC free article] [PubMed] [Google Scholar]
- Jones JM, Warchol ME. Expression of the Gata3 transcription factor in the acoustic ganglion of the developing avian inner ear. J Comp Neurol. 2009;516:507–518. doi: 10.1002/cne.22128. [DOI] [PubMed] [Google Scholar]
- Kageyama R, Ohtsuka T, Shimojo H, Imayoshi I. Dynamic regulation of Notch signaling in neural progenitor cells. Curr Opin Cell Biol. 2009;21:733–740. doi: 10.1016/j.ceb.2009.08.009. [DOI] [PubMed] [Google Scholar]
- Karis A, Pata I, van Doorninck JH, Grosveld F, de Zeeuw CI, de Caprona D, Fritzsch B. Transcription factor GATA-3 alters pathway selection of olivocochlear neurons and affects morphogenesis of the ear. J Comp Neurol. 2001;429:615–630. doi: 10.1002/1096-9861(20010122)429:4<615::aid-cne8>3.0.co;2-f. [DOI] [PubMed] [Google Scholar]
- Katori S, Hamada S, Noguchi Y, Fukuda E, Yamamoto T, Yamamoto H, Hasegawa S, Yagi T. Protocadherin-alpha family is required for serotonergic projections to appropriately innervate target brain areas. J Neurosci. 2009;29:9137–9147. doi: 10.1523/JNEUROSCI.5478-08.2009. [DOI] [PMC free article] [PubMed] [Google Scholar]
- Kelly MC, Chen P. Development of form and function in the mammalian cochlea. Curr Opin Neurobiol. 2009;19:395–401. doi: 10.1016/j.conb.2009.07.010. [DOI] [PMC free article] [PubMed] [Google Scholar]
- Koundakjian EJ, Appler JL, Goodrich LV. Auditory neurons make stereotyped wiring decisions before maturation of their targets. J Neurosci. 2007;27:14078–14088. doi: 10.1523/JNEUROSCI.3765-07.2007. [DOI] [PMC free article] [PubMed] [Google Scholar]
- Lawoko-Kerali G, Rivolta MN, Lawlor P, Cacciabue-Rivolta DI, Langton-Hewer C, van Doorninck JH, Holley MC. GATA3 and NeuroD distinguish auditory and vestibular neurons during development of the mammalian inner ear. Mech Dev. 2004;121:287–299. doi: 10.1016/j.mod.2003.12.006. [DOI] [PubMed] [Google Scholar]
- Leake PA, Snyder RL, Hradek GT. Postnatal refinement of auditory nerve projections to the cochlear nucleus in cats. J Comp Neurol. 2002;448:6–27. doi: 10.1002/cne.10176. [DOI] [PMC free article] [PubMed] [Google Scholar]
- Lefebvre JL, Zhang Y, Meister M, Wang X, Sanes JR. gamma-Protocadherins regulate neuronal survival but are dispensable for circuit formation in retina. Development. 2008;135:4141–4151. doi: 10.1242/dev.027912. [DOI] [PMC free article] [PubMed] [Google Scholar]
- Liberman MC. Auditory-nerve response from cats raised in a low-noise chamber. J Acoust Soc Am. 1978;63:442–455. doi: 10.1121/1.381736. [DOI] [PubMed] [Google Scholar]
- Lillevali K, Matilainen T, Karis A, Salminen M. Partially overlapping expression of Gata2 and Gata3 during inner ear development. Dev Dyn. 2004;231:775–781. doi: 10.1002/dvdy.20185. [DOI] [PubMed] [Google Scholar]
- Lobo MK, Karsten SL, Gray M, Geschwind DH, Yang XW. FACS-array profiling of striatal projection neuron subtypes in juvenile and adult mouse brains. Nat Neurosci. 2006;9:443–452. doi: 10.1038/nn1654. [DOI] [PubMed] [Google Scholar]
- Marsh ED, Minarcik J, Campbell K, Brooks-Kayal AR, Golden JA. FACS-array gene expression analysis during early development of mouse telencephalic interneurons. Dev Neurobiol. 2008;68:434–445. doi: 10.1002/dneu.20602. [DOI] [PubMed] [Google Scholar]
- Matthews G, Fuchs P. The diverse roles of ribbon synapses in sensory neurotransmission. Nat Rev Neurosci. 2010;11:812–822. doi: 10.1038/nrn2924. [DOI] [PMC free article] [PubMed] [Google Scholar]
- Meyer MP, Smith SJ. Evidence from in vivo imaging that synaptogenesis guides the growth and branching of axonal arbors by two distinct mechanisms. J Neurosci. 2006;26:3604–3614. doi: 10.1523/JNEUROSCI.0223-06.2006. [DOI] [PMC free article] [PubMed] [Google Scholar]
- Mitiku N, Baker JC. Genomic analysis of gastrulation and organogenesis in the mouse. Dev Cell. 2007;13:897–907. doi: 10.1016/j.devcel.2007.10.004. [DOI] [PubMed] [Google Scholar]
- Moore DR. Auditory processing disorder (APD)-potential contribution of mouse research. Brain Res. 2006;1091:200–206. doi: 10.1016/j.brainres.2006.01.108. [DOI] [PubMed] [Google Scholar]
- Moriguchi T, Hamada M, Morito N, Terunuma T, Hasegawa K, Zhang C, Yokomizo T, Esaki R, Kuroda E, Yoh K, Kudo T, Nagata M, Greaves DR, Engel JD, Yamamoto M, Takahashi S. MafB is essential for renal development and F4/80 expression in macrophages. Mol Cell Biol. 2006;26:5715–5727. doi: 10.1128/MCB.00001-06. [DOI] [PMC free article] [PubMed] [Google Scholar]
- Morris JS, Vannucci M, Brown PJ, Carroll RJ. Wavelet-based nonparametric modeling of hierarchical functions in colon carcinogenesis. J Am Statist Assoc. 2003;98:573–583. [Google Scholar]
- Nakagawa T. Roles of prostaglandin E2 in the cochlea. Hear Res. 2011;276:27–33. doi: 10.1016/j.heares.2011.01.015. [DOI] [PubMed] [Google Scholar]
- Novak A, Guo C, Yang W, Nagy A, Lobe CG. Z/EG, a double reporter mouse line that expresses enhanced green fluorescent protein upon Cre-mediated excision. Genesis. 2000;28:147–155. [PubMed] [Google Scholar]
- Ohta S, Mansour SL, Schoenwolf GC. BMP/SMAD signaling regulates the cell behaviors that drive the initial dorsal-specific regional morphogenesis of the otocyst. Dev Biol. 2010;347:369–381. doi: 10.1016/j.ydbio.2010.09.002. [DOI] [PMC free article] [PubMed] [Google Scholar]
- Ohyama T, Basch ML, Mishina Y, Lyons KM, Segil N, Groves AK. BMP signaling is necessary for patterning the sensory and nonsensory regions of the developing mammalian cochlea. J Neurosci. 2010;30:15044–15051. doi: 10.1523/JNEUROSCI.3547-10.2010. [DOI] [PMC free article] [PubMed] [Google Scholar]
- Pulli K, Karma K, Norio R, Sistonen P, Göring HH, Järvelä I. Genome-wide linkage scan for loci of musical aptitude in Finnish families: evidence for a major locus at 4q22. J Med Genet. 2008;45:451–456. doi: 10.1136/jmg.2007.056366. [DOI] [PMC free article] [PubMed] [Google Scholar]
- Rand WM. Objective criteria for the evaluation of clustering methods. J Am Statist Assoc. 1971;66:846–850. [Google Scholar]
- Reyes JH, O'Shea KS, Wys NL, Velkey JM, Prieskorn DM, Wesolowski K, Miller JM, Altschuler RA. Glutamatergic neuronal differentiation of mouse embryonic stem cells after transient expression of neurogenin 1 and treatment with BDNF and GDNF: in vitro and in vivo studies. J Neurosci. 2008;28:12622–12631. doi: 10.1523/JNEUROSCI.0563-08.2008. [DOI] [PMC free article] [PubMed] [Google Scholar]
- Rubel EW, Parks TN, Zirpel L. Assembling, connecting and maintaining the cochlear nucleus. In: Parks TN, Rubel EW, Fay RR, Popper AN, editors. Plasticity of the auditory system, Chap2. New York: Springer; 2004. pp. 8–48. [Google Scholar]
- Ruben RJ. Development of the inner ear of the mouse: a radioautographic study of terminal mitoses. Acta Otolaryngol Suppl. 1967;220:221–244. [PubMed] [Google Scholar]
- Ryugo DK, Parks TN. Primary innervation of the avian and mammalian cochlear nucleus. Brain Res Bull. 2003;60:435–456. doi: 10.1016/s0361-9230(03)00049-2. [DOI] [PubMed] [Google Scholar]
- Sajan SA, Warchol ME, Lovett M. Toward a systems biology of mouse inner ear organogenesis: gene expression pathways, patterns and network analysis. Genetics. 2007;177:631–653. doi: 10.1534/genetics.107.078584. [DOI] [PMC free article] [PubMed] [Google Scholar]
- Salinas PC. Signaling at the vertebrate synapse: new roles for embryonic morphogens? J Neurobiol. 2005;64:435–445. doi: 10.1002/neu.20159. [DOI] [PubMed] [Google Scholar]
- Sánchez-Camacho C, Bovolenta P. Emerging mechanisms in morphogen-mediated axon guidance. Bioessays. 2009;31:1013–1025. doi: 10.1002/bies.200900063. [DOI] [PubMed] [Google Scholar]
- Schmidt H, Stonkute A, Jüttner R, Schäffer S, Buttgereit J, Feil R, Hofmann F, Rathjen FG. The receptor guanylyl cyclase Npr2 is essential for sensory axon bifurcation within the spinal cord. J Cell Biol. 2007;179:331–340. doi: 10.1083/jcb.200707176. [DOI] [PMC free article] [PubMed] [Google Scholar]
- Schmidt H, Stonkute A, Jüttner R, Koesling D, Friebe A, Rathjen FG. C-type natriuretic peptide (CNP) is a bifurcation factor for sensory neurons. Proc Natl Acad Sci U S A. 2009;106:16847–16852. doi: 10.1073/pnas.0906571106. [DOI] [PMC free article] [PubMed] [Google Scholar]
- Shah SM, Kang YJ, Christensen BL, Feng AS, Kollmar R. Expression of Wnt receptors in adult spiral ganglion neurons: frizzled 9 localization at growth cones of regenerating neurites. Neuroscience. 2009;164:478–487. doi: 10.1016/j.neuroscience.2009.08.049. [DOI] [PMC free article] [PubMed] [Google Scholar]
- Shatz CJ. MHC class I: an unexpected role in neuronal plasticity. Neuron. 2009;64:40–45. doi: 10.1016/j.neuron.2009.09.044. [DOI] [PMC free article] [PubMed] [Google Scholar]
- Smith M, Woodroffe A, Smith R, Holguin S, Martinez J, Filipek PA, Modahl C, Moore B, Bocian ME, Mays L, Laulhere T, Flodman P, Spence MA. Molecular genetic delineation of a deletion of chromosome 13q12–>q13 in a patient with autism and auditory processing deficits. Cytogenet Genome Res. 2002;98:233–239. doi: 10.1159/000071040. [DOI] [PubMed] [Google Scholar]
- Soriano P. Generalized lacZ expression with the ROSA26 Cre reporter strain. Nat Genet. 1999;21:70–71. doi: 10.1038/5007. [DOI] [PubMed] [Google Scholar]
- Stevens B, Allen NJ, Vazquez LE, Howell GR, Christopherson KS, Nouri N, Micheva KD, Mehalow AK, Huberman AD, Stafford B, Sher A, Litke AM, Lambris JD, Smith SJ, John SW, Barres BA. The classical complement cascade mediates CNS synapse elimination. Cell. 2007;131:1164–1178. doi: 10.1016/j.cell.2007.10.036. [DOI] [PubMed] [Google Scholar]
- Taberner AM, Liberman MC. Response properties of single auditory nerve fibers in the mouse. J Neurophysiol. 2005;93:557–569. doi: 10.1152/jn.00574.2004. [DOI] [PubMed] [Google Scholar]
- Thams S, Brodin P, Plantman S, Saxelin R, Kärre K, Cullheim S. Classical major histocompatibility complex class I molecules in motoneurons: new actors at the neuromuscular junction. J Neurosci. 2009;29:13503–13515. doi: 10.1523/JNEUROSCI.0981-09.2009. [DOI] [PMC free article] [PubMed] [Google Scholar]
- Tritsch NX, Bergles DE. Developmental regulation of spontaneous activity in the mammalian cochlea. J Neurosci. 2010;30:1539–1550. doi: 10.1523/JNEUROSCI.3875-09.2010. [DOI] [PMC free article] [PubMed] [Google Scholar]
- Tritsch NX, Yi E, Gale JE, Glowatzki E, Bergles DE. The origin of spontaneous activity in the developing auditory system. Nature. 2007;450:50–55. doi: 10.1038/nature06233. [DOI] [PubMed] [Google Scholar]
- Uemura M, Nakao S, Suzuki ST, Takeichi M, Hirano S. OL-Protocadherin is essential for growth of striatal axons and thalamocortical projections. Nat Neurosci. 2007;10:1151–1159. doi: 10.1038/nn1960. [DOI] [PubMed] [Google Scholar]
- van Doorninck JH, van Der Wees J, Karis A, Goedknegt E, Engel JD, Coesmans M, Rutteman M, Grosveld F, De Zeeuw CI. GATA-3 is involved in the development of serotonergic neurons in the caudal raphe nuclei. J Neurosci. 1999;19(RC12):1–8. doi: 10.1523/JNEUROSCI.19-12-j0002.1999. [DOI] [PMC free article] [PubMed] [Google Scholar]
- Van Esch H, Groenen P, Nesbit MA, Schuffenhauer S, Lichtner P, Vanderlinden G, Harding B, Beetz R, Bilous RW, Holdaway I, Shaw NJ, Fryns JP, Van de Ven W, Thakker RV, Devriendt K. GATA3 haplo-insufficiency causes human HDR syndrome. Nature. 2000;406:419–422. doi: 10.1038/35019088. [DOI] [PubMed] [Google Scholar]
- van Looij MA, van der Burg H, van der Giessen RS, de Ruiter MM, van der Wees J, van Doorninck JH, De Zeeuw CI, van Zanten GA. GATA3 haploinsufficiency causes a rapid deterioration of distortion product otoacoustic emissions (DPOAEs) in mice. Neurobiol Dis. 2005;20:890–897. doi: 10.1016/j.nbd.2005.05.025. [DOI] [PubMed] [Google Scholar]
- Wong RW, Guillaud L. The role of epidermal growth factor and its receptors in mammalian CNS. Cytokine Growth Factor Rev. 2004;15:147–156. doi: 10.1016/j.cytogfr.2004.01.004. [DOI] [PubMed] [Google Scholar]
- Xu Y, Lopes C, Qian Y, Liu Y, Cheng L, Goulding M, Turner EE, Lima D, Ma Q. Tlx1 and Tlx3 coordinate specification of dorsal horn pain-modulatory peptidergic neurons. J Neurosci. 2008;28:4037–4046. doi: 10.1523/JNEUROSCI.4126-07.2008. [DOI] [PMC free article] [PubMed] [Google Scholar]