


Abstract
In the human genome, it has been estimated that considerably more sequence is under natural selection in non-coding regions [such as transcription-factor binding sites (TF-binding sites) and non-coding RNAs (ncRNAs)] compared to protein-coding ones. However, less attention has been paid to them. To study selective pressure on non-coding elements, we use next-generation sequencing data from the recently completed pilot phase of the 1000 Genomes Project, which, compared to traditional methods, allows for the characterization of a full spectrum of genomic variations, including single-nucleotide polymorphisms (SNPs), short insertions and deletions (indels) and structural variations (SVs). We develop a framework for combining these variation data with non-coding elements, calculating various population-based metrics to compare classes and subclasses of elements, and developing element-aware aggregation procedures to probe the internal structure of an element. Overall, we find that TF-binding sites and ncRNAs are less selectively constrained for SNPs than coding sequences (CDSs), but more constrained than a neutral reference. We also determine that the relative amounts of constraint for the three types of variations are, in general, correlated, but there are some differences: counter-intuitively, TF-binding sites and ncRNAs are more selectively constrained for indels than for SNPs, compared to CDSs. After inspecting the overall properties of a class of elements, we analyze selective pressure on subclasses within an element class, and show that the extent of selection is associated with the genomic properties of each subclass. We find, for instance, that ncRNAs with higher expression levels tend to be under stronger purifying selection, and the actual regions of TF-binding motifs are under stronger selective pressure than the corresponding peak regions. Further, we develop element-aware aggregation plots to analyze selective pressure across the linear structure of an element, with the confidence intervals evaluated using both simple bootstrapping and block bootstrapping techniques. We find, for example, that both micro-RNAs (particularly the seed regions) and their binding targets are under stronger selective pressure for SNPs than their immediate genomic surroundings. In addition, we demonstrate that substitutions in TF-binding motifs inversely correlate with site conservation, and SNPs unfavorable for motifs are under more selective constraints than favorable SNPs. Finally, to further investigate intra-element differences, we show that SVs have the tendency to use distinctive modes and mechanisms when they interact with genomic elements, such as enveloping whole gene(s) rather than disrupting them partially, as well as duplicating TF motifs in tandem.
INTRODUCTION
Only 1.5% of the human genome is protein-coding (1), and the vast genomic regions of non-coding DNA have long been thought as ‘junk’ DNA. However, 5% of the human genome is estimated to be under natural selection (2), suggesting that more sequences in non-coding DNA are under selection than protein-coding regions. Moreover, analyses on conserved non-coding elements (CNCs) and genome-wide association studies (GWAS) have shown that non-coding DNA is involved in biological functions and disease associations (3). The recent ENCODE Project (Encyclopedia of DNA Elements) has also elucidated a variety of ways in which non-coding elements can be biochemically active within the genome, such as interacting with transcription factors (TFs) (4,5). Despite the work described above, much less effort has been invested in the functional analysis of non-coding elements, compared to the extensively studied protein-coding regions.
One way to evaluate the functional relevance of non-coding elements is to examine the levels of naturally occurring genomic variations therein (i.e. DNA polymorphism within populations). A reduction of polymorphism in non-coding elements, compared to sequences under neutral evolution, suggests non-coding elements are subject to natural selection or lower mutation rates. Polymorphism naturally co-varies with divergence between species regardless of the mutation rate (6). Thus, to see if varying diversity is a mark of selection, one may test whether it is not varying proportionally to divergence—the regime of the McDonald–Kreitman test (MK test) (7). In addition, selective constraints maintain deleterious mutations at low frequencies in a population, resulting in a skew of the derived allele frequency spectrum towards the low-frequency alleles; whereas positive selection raises advantageous alleles to high frequencies. We have studied these signatures of natural selection using genomic variation data provided by the 1000 Genomes Project (8). The Project has recently completed its pilot phase, in which whole genome next-generation sequencing data of 2–6× of genomic coverage has been generated from 179 unrelated individuals within three population groups. The data include 60 individuals of European ancestry in Utah (CEU), 59 individuals of Yoruban ancestry from Nigeria (YRI) and 60 individuals of Han Chinese ancestry from Beijing and Japanese ancestry from Tokyo (CHBJPT) (8).
There are two major advantages in using this dataset to study the impact of genomic variations on non-coding elements. First, the 1000 Genome Project provides a more comprehensive catalog of genomic variations than previous studies. Previous efforts, such as the HapMap, utilize the array-based single-nucleotide polymorphism (SNP) genotyping method by designing probes at certain genomic loci (9,10). However, this type of study is limited to SNPs already identified previously, and SNPs adjacent to probed SNPs are typically missing [inference through linkage disequilibrium (LD) has limited power for rare variants]. However, using next-generation sequencing technology, the 1000 Genomes Project generates reads from the genome in a relatively unbiased and uniform fashion, allowing for a more complete identification and genotyping of genomic variations. Another type of study exploits Sanger sequencing to obtain genomic variations within targeted local regions in the genome (11). In contrast, the 1000 Genomes Project achieves shotgun sequencing at a genome-wide scale.
A second advantage of the 1000 Genomes data is the discovery of genomic variations spanning a full spectrum, instead of merely SNPs. Variation between two random copies of the human genome was initially estimated to be ∼0.1%, most of which was attributed to SNPs (12). Nonetheless, taking into account SNPs, short deletions and insertions (indels), as well as structural variations (SVs) that include large deletions, duplications, insertions and inversions, two copies of the human genome differ by 0.5% of the DNA sequence (13). Moreover, indels and SVs are also found to contribute considerably to phenotypes and diseases (14–19). In this regard, the 1000 Genomes Project has systematically identified and genotyped all three types of variations—SNPs, indels and SVs. Hitherto, little has been known about the significance of functional relevance of the latter two types of variations. Previously, there have been studies that identify various types of genomic variations in several personal genomes (13,20–22). However, the 1000 Genomes Project has profoundly advanced in SV detection in terms of number, size-range and breakpoint-precision beyond these studies (8,23). In addition, the scale of the 1000 Genomes data enables us to apply population-based approaches in our analyses.
In this study, we examine the functional impact of genomic variations on non-coding elements to elucidate selective pressures acting on them. We investigate this at three progressive levels: comparing classes of elements, comparing subclasses within an element class and inspecting the internal structure of a given element.
Comparing classes of elements
Through studying levels of polymorphism and divergence, as well as the allele frequency spectrum, we find that TF-binding sites and non-coding RNAs (ncRNAs) are less constrained for SNPs than are coding sequences (CDSs), but more constrained than a neutral reference. We also determine that the levels of constraint for the three types of variations (SNPs, indels and SVs) are, in general, correlated, but there is some heterogeneity: counter-intuitively, TF-binding sites and ncRNAs are relatively more selectively constrained for indels than for SNPs, compared to CDSs. Further investigation reveals that this difference is largely attributed to relaxed constraints for in-frame indels in CDSs.
Comparing subclasses within an element class
After examining the overall properties of a class of elements, we analyze the selective pressure upon various subclasses within an element class, and show that the extent of selection can be rationalized in terms of genomic properties of each subclass, e.g. the exact sequences of the TF-binding motifs are under stronger selective pressure than the corresponding peak regions, and ncRNAs with higher expression levels tend to be under stronger purifying selection.
Intra-element differences of a given element
In order to make further statements about the selection on non-coding elements, we have developed element-aware aggregation techniques to investigate the differences across the linear genomic structure of a given element. We find that a similar level of additional selective pressure for SNPs is imposed on TF-binding motifs relative to their surrounding regions. We also demonstrate that substitutions in TF-binding motifs inversely correlate with site conservation, and SNPs unfavorable for motifs are under more selective constraints than favorable SNPs. Moreover, both the micro-RNAs (miRNAs) (particularly the seed regions) and their binding targets are under stronger selective pressure than their surroundings. Finally, we show that SVs have a tendency to use distinctive modes and mechanisms when they interact with genomic elements, such as enveloping whole gene(s) rather than disrupting them partially, as well as duplicating TF motifs in tandem.
MATERIALS AND METHODS
Overall framework for integrating genomic variation data and non-coding elements
We have developed a framework, ncVAR, for an integrative analysis of genomic variation data and non-coding elements (schematics shown in Figure 1A). We first compile datasets of annotations for various types of genomic variations (SNPs, indels and SVs), and datasets of different non-coding elements annotations (TF-binding sites, ncRNAs, pseudogenes, etc.). We further subdivide each class of non-coding elements into subclasses, based on their genomic properties.
Figure 1.

(A) Flowchart for the overall framework, ncVAR, for an integrative analysis of genomic variation data and non-coding elements. (B) Overview of the genomic elements surveyed. The shape and color of the icon preceding each element represents the legend used throughout Figures 1–4 and Supplementary Figures S1–S3. The numbers in parenthesis represent the total number of sequences of each class of elements included in the study. On the right-hand side of each class of elements, the specific features used for their subclassification are shown.
We then carry out integrative analysis of the two data sources using two strategies. In the first strategy, we annotate genomic variations within non-coding elements, and compute population genetics metrics, such as the global mean of nucleotide diversity and divergence, for each class or subclass of elements. This allows comparison of functional impact of various types of genomic variations in different classes or subclasses of genomic elements. In the second strategy, we develop techniques of element-aware aggregations for genomic variations within non-coding elements. This enables evaluation of the functional relevance of the internal structures of each element. Results from the two strategies are represented in the form of X–Y plots and aggregation plots, respectively.
Data preparation for genomic variation
SNP, indel and SV annotations, and allele frequency data are obtained from the pilot release of the 1000 Genomes Project (8) (Supplementary Table S1). Since indels and SVs have only been genotyped for the autosomes, we have carried out all our analyses only on the autosomes. For the 10 871 SVs in the data release, we further limit them to genotyped SVs across all three populations, a non-zero allele frequency, and at least 50% of the individuals passing the genotyping quality filter, which leaves 6379 SVs. Among these SVs, 4470 have been polarized (i.e. inferring the ancestral allele of the variant by comparing to the other primate genomes—also known as rectification) as deletions (8,24).
Data preparation for genomic elements
The non-coding elements we survey include genome-wide annotations of nine TF-binding sites and related sites (i.e. DNase I hypersensitive sites), ncRNAs, pseudogenes and non-coding domains of protein-coding genes, that is, introns, 3′ untranslated regions (3′UTRs) and 5′UTRs (Figure 1B and Supplementary Table S1).
TF-binding sites
For TF-binding sites, we use peak signals from a variety of chromatin immunoprecipitation with sequencing (ChIP-seq) experiments. Although the precision of the ChIP-seq method is no longer limited by the spacing of probes of array-based methods, it has yet to detect the boundaries of TF-binding sites at single-nucleotide resolution. In fact, the ChIP system pulls down DNA, up to hundreds of base pairs, away from the actual interacting sites (25). To better represent the DNA–protein interaction sites, we scan the TF peaks with consensus sequences of corresponding motifs to obtain sites representing TF-binding motifs (Supplementary Data). Eight TF-binding sites and the DNase sites (26) are downloaded from the UCSC genome browser (27). See specific file names and other information at the website to supplement this study http://info.gersteinlab.org/NCVAR. The TF-binding sites include CTCF (26), STAT1 (28), NFκB (29), c-Myc (30), c-Fos (30), c-Jun (30), JunD (30) and PolII (29). The NRSF binding peaks and motifs are obtained from the original publication (31), with genomic coordinates mapped from NCBI build 35 to build 36 using the Liftover tool from the UCSC genome browser. Analyses throughout this study use NCBI build 36 of the human reference genome and the GENCODE gene set version 3b for gene annotations (32). We intersect TF-binding peaks with genes and retain the peak and motif regions that fall into the intergenic regions for analyses, truncating the peaks and discarding the motifs if they partially overlap with genes.
ncRNAs
ncRNAs are genes that are transcribed but not translated into proteins. They have diverse regulatory functions, including regulation of transcription (miRNA), RNA splicing (small nuclear RNA—snRNA), translation (messenger RNA—mRNA, transfer RNA—tRNA and ribosomal RNA—rRNA) and chemical modification of other RNA molecules (small nucleolar RNA—snoRNA) (33). The ncRNA annotations are obtained from Ensembl release 53 (33) and GtRNAdb (34).
Non-coding domains of the protein-coding genes
Non-coding domains of the protein-coding genes may play various regulatory roles. For instance, UTRs contain structured regions, such as the riboswitches and the internal ribosome entry sites (IRES), which modulate gene expression (36,37). 3′UTRs also provide binding sites to miRNAs, which inhibits translation (33). Moreover, introns have been found to harbor sites that are associated with disease (38). CDS, intron and UTR annotations are obtained from the longest transcript of each gene with annotated start and end codons. 5′UTRs are extracted as sequences from the transcription start site (TSS) to the start codon (exclusive). 3′UTRs are extracted as sequences from the stop codon (inclusive) to the transcription end site (TES).
Pseudogenes
Finally, pseudogenes are usually disabled gene homologues, and are thus not functional (39). Hence, we use them as a neutral reference in this study. In addition to pseudogenes, we have considered a number of other candidates as a neutral reference, such as ancestral repeats (ARs) and random intergenic regions. Pseudogene annotations are obtained from the Ensembl 53 build at Pseudogene.org database (40). ARs are obtained by intersecting the repeat elements in the human genome (annotated by the RepeatMasker program) with human–mouse alignments. Both the repeat element and alignment annotations are downloaded from the UCSC genome browser. Those regions that can be aligned and are 100 bp or larger are extracted. A set of random intergenic regions of 500 bp is generated from the intergenic regions of the human reference genome, and 200 kb away from any gene. The set of random regions also excludes annotations of TF-binding sites, ncRNAs, ARs and pseudogenes.
Calculation of population-based statistics
SNP diversity and divergence analysis
The SNP diversity (π) of a region is estimated as the per-site heterozygosity (2pq) across the portion of the region that is ‘accessible’ (passing all the filters for SNP detection, including depth-of-sequence coverage, uniqueness of mapping, and gaps in the human reference genome), where p is the allele frequency, and q = 1−p. The ‘accessible’ genome annotations for the three population groups are obtained from the 1000 Genomes pilot release (8).
Denote d as the number of nucleotide differences per site between the human and the chimp reference genomes, excluding gaps across the accessible and alignable region. Divergence (Dxy) is then obtained by applying to d the Jukes-Cantor correction for multiple hits (6). The human-chimpanzee alignment is between the human build 36 and the chimp panTro2 assembly, and is obtained from the UCSC genome browser.
MK test for neutrality
Polymorphism (P) denotes the number of SNPs across the accessible and alignable region. The number of fixed differences (D) is obtained by computing  followed by the Jukes–Cantor correction, where d is the per-site number of differences between human and chimp, and l is the total length of the accessible and alignable region. To carry out the MK test, a
  contingency table is formed from P and D in a region i under study and a neutral reference n, respectively. Fisher’s exact test is used to assess the significance of the MK test. The neutrality index (NI) is calculated as
Allele frequency spectrum analysis
A derived allele frequency (DAF) is computed for each polarized SNP, indel and SV from the genotyping allele frequency and ancestral allele information. SNPs and indels have been identified and genotyped for each of the three populations separately. Therefore, we assess the allele frequency spectrum for each population. The SVs have been genotyped across all three populations. Thus, we effectively use the average allele frequency of the three populations to evaluate the DAF of an SV (see Supplementary Data for more details).
To quantify the intensity of natural selection using allele frequency, traditional tests such as Tajima’s D and the Fu and Li tests draw comparisons to the standard neutral coalescence model (6). However, due to the low sequence coverage (2−6×) in the 1000 Genomes pilot dataset, there is a severe bias towards common alleles—even neutrally evolving sequences display a depletion of rare variants compared to the standard neutral model. Therefore, to overcome this intrinsic variant detection bias, we have sought to derive a measurement that quantifies the intensity of selection compared to a relative neutral reference. We define the Excess of low-frequency variants within a region relative to a neutral reference as
where Ni is the fraction of variants in the region i that have a DAF < 0.05, and Nn is the fraction of variants in the neutral reference n that have a DAF < 0.05.
Element-aware aggregation of nucleotide diversity
Basic aggregation procedure
In element-aware aggregations, we aggregate both SNP and indel diversity in an element-aware fashion. For simplicity, we just refer to nucleotide diversity, but the same logic applies to indels. To develop the aggregation procedure, each sequence of an element annotation is divided into a fixed number of bins with uniform size. For a given annotation, sequences with different lengths might be chosen to have different bin sizes, but the number of bins is fixed in all the sequences for the annotation. A nucleotide diversity measure for each bin, in each sequence, is calculated as described above. The diversity measures for each bin are then averaged across all the sequences to obtain an overall measure for the bin, which is represented by one data point in the element-aware aggregation plot. An aggregation mean is then calculated from all the data points within an annotation. Sequences shorter than the number of bins are discarded.
Block bootstrapping
To estimate the standard deviation (SD) of the aggregation within an element, we apply bootstrapping methods. In the human genome, neighboring variants can be co-inherited, which results in the association of these variants in the population. This property is termed as LD (41). As a result, the nucleotide diversity we calculate for genomic elements that are sufficiently close to each other can be dependent. To overcome the dependence between the observations, we apply a block bootstrapping procedure to gene annotations and their surrounding regions—a procedure extended from the traditional simple bootstrapping (Supplementary Data).
For each element annotation, we randomly resample n = 1 000 000 blocks from the genome. For each block resampled, the basic aggregation procedure described above is applied to all the sequences of the element within the block. Those blocks for which the nucleotide diversity cannot be calculated are discarded. Denote x1, x2, … , xn as the aggregation mean from resampled blocks 1, 2, … , n, respectively. Let w1, w2, … , wn be the number of sequences of the element within blocks 1, 2, … , n, respectively. Then,
and
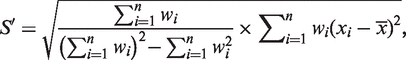 |
where the bootstrapping mean  is calculated as the weighted average of the aggregation means, and
  is an unbiased estimator of the SD (42) for weighted samples of blocks.
  is then renormalized according to the effective genome size G and the block size L to obtain the bootstrapping SD for the whole genome (S):
The effective genome refers to the portion of the genome where resampled blocks contain at least one sequence of the element (i.e. excluding deserts in the genome for the element). A 95% confidence interval (CI) of the aggregation is then calculated from  Since LD extends to up to 1 Mb in the human genome (41), we use 1 Mb as the block size L, which is designed to capture the dependence between the sequences.
Randomization test for SVs interacting with genomic elements
We use the 10 871 SVs with single-nucleotide resolution mentioned in the data preparation section for the randomization test. SV formation mechanisms are classified using the BreakSeq tool (24). The association of SVs with a class of elements is determined by calculating the number of SVs overlapping the elements. The enrichment and P-value for each association are computed from a non-parametric randomization test. A global background is obtained by randomly shuffling the SV locations within the human genome. This procedure is repeated 10 000 times. The enrichment measure is calculated as the ratio of the observed statistic to the average of the statistics taken from the background measures. The P-value is computed by fitting a Gaussian model to the background measures, and calculating the area under the density curve corresponding to Z-scores as extreme as, or more extreme than, the observed one. A local background is obtained by randomly shuffling the SV locations within a 10 Mb window around them. The calculations for the local background that follow are the same as those for the global background. The association is reported to be significant for a P-value <0.05.
RESULTS
Nucleotide diversity, divergence and allele frequency spectrum in non-coding elements
non-coding elements are under selective constraints
First, we examine the levels of SNP diversity within humans and divergence between the human and the chimpanzee genomes in non-coding elements (‘Materials and Methods’ section). We compare the global means of diversity and divergence in non-coding elements to those in the neutral reference and CDSs. We find that, with the exception of diversity in tRNA, non-coding elements exhibit a lower level of diversity and divergence than the neutral reference, and a higher level of both measures than CDSs (Figure 2, Table 1 and Supplementary Table S2). For the CEU population, on an average, SNP diversity in TF-binding sites and ncRNAs is about double that of CDSs (208 and 202% that of CDSs, respectively), and about one-fifth lower than the neutral reference (22 and 24%, respectively); divergence in TF-binding sites and ncRNAs is about double that of CDSs (194 and 193% that of CDSs, respectively), and approximately one-third lower than the neutral reference (33 and 34%, respectively). We interpret these results as a display of purifying selection on non-coding elements. The MK test also shows that, relative to the neutral reference, all non-coding elements are under selective constraints, as indicated by NI > 1, and significant P-values in most classes of elements (Table 1 and Supplementary Table S2). As a control, a set of accelerated elements in human, identified in a previous study (43), shows clear signatures of positive selection in our analysis (i.e. an elevated level of divergence and a reduced level of diversity compared to the neutral reference, NI < 1 and the MK test P-value = 3.6E-57; Figure 2 and Table 1).
Figure 2.

Levels of SNP diversity within humans and divergence between the human and the chimpanzee genomes. The diversity and divergence are calculated only for the accessible and alignable regions. The dashed line represents data points with the same ratio of diversity to divergence as for the neutral reference. Data is shown for CEU.
Table 1.
Diversity, divergence, and test of neutrality in genomic elements in CEU
| Element | SNP diversity (π × 1000) | Divergence (Dxy × 100) | Polymorphism (P) | Number of fixed differences (D) | Neutrality index (NI) | McDonald–Kreitman test P-value |
|---|---|---|---|---|---|---|
| Pseudogene | 1.02 | 2.02 | 46 122 | 206 922 | 1.00 | – |
| CDS | 0.38 | 0.69 | 49 636 | 181 193 | 1.23 | 2.38E-179 |
| Intron | 0.69 | 1.22 | 2 244 675 | 8 610702 | 1.17 | 3.03E-205 |
| 3′UTR | 0.61 | 1.12 | 60 129 | 232 581 | 1.16 | 3.53E-103 |
| 5′UTR | 0.70 | 1.22 | 293 916 | 1 116 579 | 1.18 | 3.78E-202 |
| TF peak | 0.80 | 1.34 | 111 140 | 417 405 | 1.19 | 5.30E-186 |
| TF motif | 0.67 | 1.11 | 2409 | 8545 | 1.26 | 2.13E-22 |
| ncRNA | 0.78 | 1.33 | 2254 | 8023 | 1.26 | 1.42E-20 |
| Accelerated element | 0.60 | 2.30 | 701 | 5656 | 0.56 | 5.07E-55 |
Relative strengths of selective constraints
Since the diversity of indels and SVs is not as straightforward to assess as for SNPs (Supplementary Data), likewise for divergence (due to complications in alignment), we examine another signature of selection—the allele frequency spectrum of SNPs, indels and SVs collectively. In CEU, TF-binding sites and ncRNAs, respectively, display a 4 and 16% excess of low-frequency SNPs (DAF < 0.05) compared to the neutral reference (Wilcoxon rank-sum test P-value = 2.8E-5 and 5.4E-7, respectively), and a 21 and 12% reduction of fraction of low-frequency SNPs compared to CDSs (Wilcoxon test P-value <2.2E-16 and 7.5E-4, respectively, see Figure 3A and Supplementary Table S3). A similar pattern is observed for UTRs and introns (Figure 3A and Supplementary Table S3). This confirms the results from the previous section: the extent of selective constraints on non-coding elements is higher than the neutral reference, but lower than CDSs. Moreover, among the gene domains, 3′UTRs are more selectively constrained than 5′UTRs and introns (Wilcoxon test P-value = 9.4E-23 and 2.5E-28, respectively), but less than CDSs (Wilcoxon test P-value = 5.8E-38), indicating that 3′UTRs might include a larger fraction of functionally important sequences than the other non-coding gene domains. It is also noted that there are no evident elevations of high DAF SNPs (DAF > 0.95) in the allele frequency spectra (Figure 3A), implying that positive selection is not prevalent in non-coding elements in humans.
Figure 3.

The derived allele frequency spectra for (A) SNPs, (B) indels and (C) SVs. SNP and indel allele frequencies are shown for CEU, and SV allele frequencies represent the average of the three populations. Black boxes highlights the low-frequency alleles (DAF < 0.05).
As mentioned previously, we have also considered ancestral repeats and random intergenic regions as candidates for a neutral reference in addition to pseudogenes (‘Materials and Methods’ section). We choose pseudogenes, however, because they show signatures that are the most consistent with neutral sequences. In other words, the alternative candidates still display some signatures of purifying selection compared to pseudogenes (Supplementary Tables S2 and S3). Although pseudogenes have been reported in individual cases to be involved in functionality (44), they are mostly deactivated and nonfunctional gene fossils. Even if some pseudogenes are under slight selective constraints, our analyses of purifying selection in non-coding elements will be conservative.
We have obtained similar results for YRI and CHBJPT populations (Supplementary Figures S1–S3, and Supplementary Tables S2 and S3). Altogether, these results suggest that, in the human genome, non-coding elements are under different levels of selective constraints for SNPs. The constraint levels usually fall between those of neutral sequences and coding regions.
Allele frequency spectrum of indels and SVs, and comparison to SNPs
As previously mentioned, the 1000 Genomes Project provides the first dataset that includes annotations of indels and SVs alongside SNPs at a population level in humans. It is thus appealing to examine the properties of indels, SVs and SNPs simultaneously, and make comparisons. We investigate the allele frequency spectrum for indels in CEU and find that, overall, non-coding elements demonstrate an excess of low-frequency indels compared to the neutral reference (Figure 3B)—a similar finding to that for SNPs. However, the most prominent increase in the fraction of indels in CDSs compared to non-coding elements occurs within a DAF range of 0.05–0.20, whereas that of SNPs occurs within a DAF range of 0–0.05 (Figure 3A and B).
For SVs, pseudogenes no longer show the lowest fraction of low-frequency alleles as for SNPs and indels (Figure 3C). Rather, the fraction of low-frequency SVs in pseudogenes is comparable to, or larger than, that of introns, 5′UTRs and 3′UTRs (Wilcoxon test P-value = 0.37, 0.43 and 0.81, respectively). Why would pseudogenes lose neutrality for SVs? Referring to the formation mechanisms of SVs might provide a clue. SVs formed by the non-allelic homologous recombination mechanism (NAHR) exploit sequences of extensive homologies at the two breakpoints (45). Hence, repeat elements associated with pseudogenes may mediate NAHR events by providing homologous stretches at the breakpoints. Then, selection in sequences around pseudogenes may place the associated SV events under selective constraints.
Figure 4A–C draw pair-wise comparisons of the excess of low-frequency alleles (ε) among SNPs, indels and SVs (‘Materials and Methods’ section). Correlations between the fractions of low-frequency variants are calculated using the data points representing the average for each of the seven major classes of elements: pseudogenes, TF-binding sites, ncRNAs and four gene domains (Correlation = 0.75 between SNP and indel, 0.64 between indel and SV, and 0.11 between SNP and SV). The results show that selective constraints for the three types of variants are, in general, correlated in non-coding elements, especially between SNP and indel, and between SV and indel. Nevertheless, we also see differences.
Figure 4.

Comparison of the excess of low-frequency variants, ε, relative to a neutral reference between (A) SNPs and indels, (B) SNPs and SVs and (C) SVs and indels. (D) Size distribution of indels up to 20 bp in the genomic elements. A tri-nucleotide periodicity for indels in CDSs is shown. The inset shows ε for indels of size 1–3 bp. Digits ‘1’, ‘2’, and ‘3’, respectively, represent 1, 2 and 3 bp indels. The solid circles represent the overall ε of SNPs and indels for a class of elements. Black dashed lines in A–D represent ε = 0. SNP and indel allele frequencies are shown for CEU, and SV allele frequencies represent the average of the three populations. Elements with fewer than five variants for the corresponding variation type are not shown.
Within CDSs, compared to SNPs and in-frame indels that only modify one or two local amino acids, a frame-shift indel alters all the amino acid sequences that follow, and may introduce premature stop codons that truncate the protein products, which is very detrimental to, and therefore expected to be quickly removed from, the genome. Thus, one might expect that selective pressure against indels in CDSs to be stronger than that against SNPs, compared to the other functional elements. To our surprise, we find that TF-binding sites and ncRNAs are, on average, relatively even more constrained for indels than for SNPs, compared to what we observe for CDSs (Figure 4A–C). In fact, the ratio of low-frequency indel fraction to low-frequency SNP fraction is increased by 8 and 22% in TF-binding sites and ncRNAs relative to CDSs, respectively (P-value = 8.9E-2 and 1.1E-1, respectively, by bootstrapping).
To further explore the above observations, we consider the differences between in-frame and frame-shift indels. The size distribution of indels shows a periodic peak of 3 nts for CDSs but not for non-coding elements (i.e. the fraction of indels of size 3, 6, 9 bp… is elevated for CDSs, see Figure 4D). Since the majority of the indels are no larger than 3 bp, we extract the indels of size 1, 2 and 3 bp, and examine the excess of low-frequency indels, respectively. We find that frame-shift indels (1 and 2 bp) have more low-frequency alleles than in-frame indels (3 bp) in CDSs (ε is 160 and 116% higher than 3 bp indels, respectively), consistent with a relaxed constraint for the in-frame indels compared to frame-shift indels (Figure 4D). However, even for 1 bp indels, which introduce frame-shifts, we do not see an elevated level of constraint for indels relative to SNPs in CDSs, compared to non-coding elements (Figure 4D). Therefore, the selective pressure for indels relative to SNPs in TF-binding-sites and ncRNAs is as much as, if not more than, in CDSs. Taken together, comparisons of the allele frequency spectrum between SNPs, indels and SVs reveal heterogeneity in the selective pressure for the three types of variations in non-coding elements, despite an overall correlation.
Differences in selective pressure between subclasses within an element class
Instead of treating each class of elements as a whole as described in the proceeding section, we further analyze the mode and extent of selection with respect to subclasses of elements having different genomic properties, such as the genomic locations, RNA expression levels, number of binding targets, sequence divergence, conservation of secondary structure, etc. (Supplementary Data).
TF-binding sites
Bound versus unbound motifs
We first compare TF-bound motifs (i.e. those motifs within TF peaks from ChIP-seq experiments, thus having physical interaction with TFs) to unbound motifs (i.e. without physical interaction with TFs) in the genome. We find that, in bound motifs, the SNP diversity and divergence are lower than those in unbound motifs (P-value < 1.0E-4, in CEU, see Figure 5A). Moreover, there are also more low-frequency SNPs and SVs in bound motifs compared to unbound motifs (P-value = 1.2E-3 and <1.0E-4, respectively, in CEU). These results suggest that bound motifs are under stronger purifying selection than unbound motifs. This functional importance of bound motifs is consistent with their direct chemical interactions with TFs.
Figure 5.

Comparison of the SNP diversity, divergence and DAF of three types of variations between subclasses of elements with different genomic features. The elements shown include (A) TF-binding sites, (B) miRNAs, (C) 3′-UTRs, and (D) pseudogenes. Feature annotations for the first and second subclasses of each element are separated by a slash in the legends below each bar. The height of each bar represents the bootstrapping mean of the ratio of the corresponding measures in the first subclass to the second subclass (Supplementary Data). The dashed line represents a same level of measurement between the two subclasses. Error bars represents the 95% confidence interval (CI) obtained from the empirical distribution of bootstrapping. The asterisks denote a significant difference in the corresponding measure between the two subclasses of elements (i.e. bootstrapping mean not included in the 95% CI). SNP diversity and divergence are calculated for each region in a subclass of elements (‘Materials and Methods’ section). DAF is obtained from the variants in the union of the regions (no double counting for overlapping regions). The SV allele frequencies shown are the average of the three populations and the other measures are shown for CEU. Element subclasses with fewer than four variants for the corresponding variation type are not shown.
TF-binding motif versus peak
Next, we compare TF-binding motifs to their corresponding broader peak regions. In TF motifs, we find the allele frequency spectra of SNPs, indels and SVs are skewed towards the low-frequency alleles, and the levels of nucleotide diversity and divergence decline, relative to the TF peaks (P-value = 2.1E-2 for SNP DAF, and P-value < 1.0E-4 for diversity and divergence in CEU, see Figure 5A). The results indicate that TF-binding motifs tend to be more selectively constrained than their corresponding peak regions. This suggests that scanning for motifs better pinpoints DNA–protein interacting sites (Supplementary Data).
Proximal versus distal to genes
We then explore TF-binding sites with respect to their proximity to genes. We examine the distance between a TF-binding motif and the TSS of genes, and find that TF-binding motifs proximal to genes show a decreased level of diversity compared to distal motifs (P-value = 4.0E-4 in CEU, see Figure 5A). However, the variant allele frequencies are not significantly different. Positive selection in some sequences in proximal TF-binding motifs might contribute to the pattern for diversity, but it is frequently masked by the prevalent negative selection in the human genome. Alternatively, proximal motifs might be sufficiently close to genes and thus under background selection (i.e. elimination of an allele tightly linked to a deleterious allele), which reduces the level of nucleotide diversity but does not alter variant allele frequencies.
Strong versus weak TF-binding peaks
Next, we explore whether there is difference in selective constraints for TF peak signals with differential strengths (stronger peaks have peak detection P-value <1.0E-4). The variant allele frequencies are comparable between the stronger and weaker peaks (P-value = 0.48, 0.49 and 0.36 for SNP, indel and SV DAF, respectively, in CEU), whereas the diversity and divergence levels are lower in stronger peaks (P-value < 1.0E-4 in CEU, see Figure 5A). These results indicate that stronger peaks might contain a larger fraction of regions with lower mutation rates. Another explanation is that the stronger peaks are more proximal to genes, and are therefore under background selection. In fact, when we examine the distance to the TSS of genes, we find that the stronger peaks are significantly closer to genes than the weaker peaks (P-value = 9.1E-76).
ncRNAs
High- versus low-expression levels
We have shown above that ncRNA regions are, in general, under purifying selection. We now relate the extent of selective constraints in ncRNAs to the expression levels. ncRNAs with higher expression levels tend to have an excess of low-frequency SNPs (P-value < 1.0E-4 in CEU, see Supplementary Figure S4), which suggests a positive correlation between the levels of RNA expression and selective constraints. For protein-coding genes, it has been previously shown that highly expressed genes tend to evolve slowly and are essential for the organism viability (46,47). Here, we demonstrate a parallel pattern for ncRNAs, which is, highly expressed ncRNAs tend to be under more selective pressure and play a more important role in biological function than lowly expressed ncRNAs.
More versus fewer miRNA binding targets
Among ncRNAs, miRNAs have emerged as an important novel silencing mechanism for gene transcription by strongly binding to 3′UTRs of transcripts with their 5′-ends. We predict the miRNA binding targets (Supplementary Data), and discover that those miRNAs with a larger number of binding targets (>500) tend to have a reduced level of nucleotide diversity, an elevated level of nucleotide divergence, and an elevated average DAF of SNPs compared to those with fewer targets (Figure 5B). The MK test further reveals that the miRNAs with more binding targets show signatures of positive selection (NI = 0.31 and P-value = 1.78E-3 in CEU), whereas those with fewer targets are under slight purifying selection (NI = 1.08 > 1 in CEU), although this is not statistically significant (P-value = 0.76). These results indicate that miRNAs with a larger number of binding targets contain more sequences selected for adaptive evolution.
Non-coding gene domains
More- versus Less-structured regions
We have also studied the more and less structured regions in the introns and the UTRs of coding genes by examining the folding energies of secondary structures in the corresponding mRNA sequences (Supplementary Data). We do not see significant differences in the extent of selective constraints between non-coding gene regions with more stable secondary structures (with Z-score <−2) and those with less stable secondary structures (with Z-score ≥−2, see Figure 5C and Supplementary Figure S4), although non-coding gene domains are, on average, under more constraints than the neutral reference (NI = 1.16, and the MK test P-value = 3.5E-103 for 3′UTRs, in CEU). This indicates that the selective constraints in the primary sequences of UTRs and introns do not clearly correlate with the regions of conserved secondary structure.
Pseudogenes
Transcribed versus untranscribed
Although pseudogenes are not translated into functional protein products, some of them retain the machinery to be transcribed into RNA products (48). However, the functional relevance of the transcribed pseudogenes is not well understood. We explore the difference between transcribed and untranscribed processed pseudogenes, and find that transcribed pseudogenes exhibit signatures of stronger selective pressure than untranscribed pseudogenes (lower nucleotide diversity and divergence with P-value = 1.6E-2 and <1.0E-4, respectively, lower average SNP and SV DAF with P-value = 6.0E-3 and <1.0E-4, respectively, in CEU). This result suggests that some transcribed pseudogenes might be involved in coding-independent functions, such as ‘buffering’ the binding of miRNAs to the parent gene transcripts (44).
Old versus young
We further subgroup pseudogenes according to their age (Supplementary Data). We find that older duplicated pseudogenes are more selectively constrained for SNPs compared to younger pseudogenes (P-value = 3.8E-2, <1.0E-4 and = 3.1E-3 for SNP diversity, divergence and DAF in CEU, respectively, see Figure 5D). However, the older duplicated pseudogenes also show higher average indel DAFs (Figure 5D). These differences in variant DAFs between older and younger duplicated pseudogenes may reflect the possibility that, for older pseudogenes, some pseudogenization events may take place far later than the time of the duplication events, whereas young pseudogenes are dead on arrival by definition of pseudogenes. Processed pseudogenes, on the other hand, do not show significant differences between older and younger pseudogenes (Supplementary Figure S4), which is consistent with their formation mechanism that almost renders all of them dead on arrival. Sensitivity analysis further shows that analysis of older/younger duplicated pseudogenes is sensitive to the cutoff used to divide pseudogenes into the two subgroups, and much less so for processed pseudogenes, which further suggests heterogeneity in duplicated pseudogenes (Supplementary Figures S6H and S6I). We have also carried out sensitivity analysis for the other analyses on subclasses within an element class above, and they are not sensitive to the cutoffs that we have chosen (Supplementary Data and Supplementary Figure S6).
Intra-element patterns of selective pressure in non-coding elements
So far, we have shown that the mode and extent of selective pressures are associated with the genomic properties of different classes and subclasses of elements. What we will discuss in the following section is the intra-element patterns of selective forces (i.e. within the internal linear genomic structure of a given element and its immediate surroundings). We first address this by developing element-aware aggregations of SNP and indel diversity across a given element (‘Materials and Methods’ section and Supplementary Data).
Aggregation in protein-coding genes and surrounding regions
Since many non-coding elements are located in, or proximal to, protein-coding genes, it is useful to examine how they are related to each other, along with the spatial information within gene regions. We therefore study the aggregation of the diversity of SNPs and 1 bp indels across protein-coding genes and their surrounding regions (‘Materials and Methods’ section and Supplementary Data). We discover that, within genes, CDSs show the lowest level of SNP diversity, followed by UTRs and introns (Figure 6). In the upstream regions of genes, the average SNP diversity level first increases by 16–22% in upstream 250 bp regions relative to 5′UTRs. In the more distal regions, the average diversity level is reduced by 1–2% in upstream from 250 bp to 2.5 kb relative to 5′UTRs, and is then increased by 28–29% in upstream 2.5–25 kb relative to 5′UTRs. Notably, the TF-binding motifs within each of the three upstream regions show a drop of diversity relative to their surrounding areas. Moreover, although the average level of diversity is largely different in the three upstream regions, the decline in diversity within the motifs relative to their surrounding regions is comparable in the three regions, varying between 7 and 15% (Figure 6). This suggests that a similar level of additional selective pressure for SNPs may be imposed on TF-binding motifs relative to their surrounding regions. At the 3′-ends of genes, the average SNP diversity is 30–56% higher in 3′UTRs relative to the last CDS, rises by 12–34% in the 2.5 kb downstream regions of genes relative to 3′UTRs, and rises further in the more distal regions. Within 3′UTRs, the two terminals of 3′UTRs have a 7–16% lower SNP diversity than the central parts of 3′UTRs, implying the potential of a more active involvement of functionality in the terminal regions of 3′UTRs. We aggregate diversity in 3′UTRs by using one miRNA target site within each of the three parts of 3′UTRs as an anchor locus. The sites in which a miRNA target is predicted typically show a 10–16% reduced average level of SNP diversity relative to the immediate surroundings (except for between the last target anchor and its 5′ neighboring region).
Figure 6.

Aggregation of nucleotide diversity across protein-coding genes and the surrounding regions. Each data point represents the average diversity in a certain bin across all the sequences of an annotation (Supplementary Data). The number of bins within an annotation is constant for all sequences. Solid lines represent bootstrapping means and 95% confidence intervals from the block bootstrapping procedure (‘Materials and Methods’ section). Note that the solid lines for 1-bp indel diversity are scaled by a multiple of 10 relative to the other measures in the aggregation plot (see the legend at the top right corner of the plot). Red boxes compare a section of the aggregation plot produced from the block bootstrapping procedure (main figure) to the simple bootstrapping procedure (the blow-out section, see full plot in Supplementary Figure S7), and show an underestimation of the standard deviation using simple bootstrapping. TSS, transcription start site. TES, transcription end site. m, TF-binding motif. t, miRNA binding target. Data is shown for CEU.
For indels, we argue that it is only meaningful to calculate conventional diversity measure for 1 bp indels (Supplementary Data). Unlike SNPs, the average 1 bp indel diversity does not vary significantly between different upstream regions of genes. In addition, TF-binding motifs only show a significant drop of indel diversity relative to their surroundings within the upstream 250 bp region, but not the further distal regions. Moreover, unlike what we observe for SNPs, indels show a similar level of diversity in 3′UTRs to the downstream regions, and the diversity in miRNA binding targets are slightly elevated or unnoticeable relative to their surroundings.
Overall, we see a low level of SNP diversity within genes, and background selection maintains a lower SNP diversity level in the surrounding regions that are closer to genes. But this effect is less evident for indels. Moreover, we show that SNP diversity within functional elements, such as TF-binding motifs and miRNA target sites, is further reduced relative to this general background. A lower level of nucleotide diversity might suggest higher levels of selective pressure. The results also suggest heterogeneous selection (i.e. different patterns between SNPs and indels) in promotor regions and 3′UTRs of genes.
To estimate the CIs of the aggregations, we have applied both the simple bootstrapping and block bootstrapping procedures to the aggregations within and around gene regions (Figure 6, ‘Materials and Methods’ section and Supplementary Data). The thought process of block bootstrapping has been extensively used in the genome structure correction (GSC) procedure in the ENCODE project (4). Here, we extend block bootstrapping to developing element-aware aggregation techniques. As indicated in the ‘Materials and Methods’ section, block bootstrapping overcomes the dependence between neighboring sequences, whereas simple bootstrapping assumes independence between observations. Therefore, simple bootstrapping tends to underestimate the standard deviation of the aggregations, which is consistent with our observations (Figure 6).
However, note that using block bootstrapping to estimate the standard deviation for aggregations is only suitable for elements that are relatively abundant in the human genome, such as, in this case, genes and surrounding regions (4). With respect to elements that are sparse, such as miRNAs, a large proportion of the sampled blocks may not contain any element annotations. It then imposes problems with the renormalization step. For the following analyses of aggregations in TF-binding motifs and miRNAs, only simple bootstrapping has been carried out.
Aggregation in TF-binding motifs
After obtaining a broad picture of TF-binding motifs with respect to their surrounding areas around genes, we further zoom in to studying the diversity levels within TF motifs. Figure 7A shows the aggregation of the SNP and indel diversity across the STAT1 motifs. We find a notable pattern of anti-correlation between the information content (a measure of conservation) of the STAT1 motifs and the SNP diversity across the element (correlation = −0.63, P-value = 1.9E-3, in CEU). The correlation between the information content and indel diversity is not significant. A similar pattern has been observed for the other six TF motifs (Supplementary Table S4). These results show that the more conserved sites in motifs tend to have lower SNP diversity, and they might undergo stronger positive or negative selection.
Figure 7.

(A) Aggregation of nucleotide diversity across STAT1 motifs. Each data point represents the average diversity at a nucleotide position across all the sequences of the motif (Supplementary Data). The sequence logo of STAT1 motifs is shown at the bottom. The height of the sequence logo at each nucleotide position corresponds to the information content. (B) Derived allele frequency spectrum for the SNPs favorable and unfavorable to the STAT1 motif. (C) Derived allele frequency spectrum for the SNPs favorable and unfavorable to the c-Fos motif. Data is shown for CEU.
We further subgroup SNPs occurring in TF-binding motifs into those that are favorable or unfavorable for the motifs. We define a SNP favorable for a motif as a substitution with the count of the derived allele higher than its ancestral allele in the position weight matrix (PWM) of the motif, and vice versa. We find that the unfavorable SNPs tend to be more selectively constrained than the favorable SNPs, indicated by a lower average DAF (Supplementary Table S4). Moreover, in some motifs, the selective constraints are relaxed for the favorable SNPs relative to the unfavorable SNPs; in other motifs, the favorable SNPs further display signs of positive selection. STAT1 is an example of the former: the favorable and unfavorable SNPs both have a lower average DAF than the neutral reference (Wilcoxon test P-value <2.2E-16), but we find relaxed selective constraints for the favorable SNPs compared to the unfavorable SNPs (Wilcoxon test P-value = 1.7E-2, Figure 7B). c-FOS may be used as an example for the latter situation: the favorable SNPs tend to have a higher average DAF (0.41) than the neutral reference (0.33) (Wilcoxon test P-value = 3.3E-89), and their allele frequency spectrum is skewed towards the high-frequency alleles (Figure 7C), implying positive selection; the unfavorable SNPs tend to have a lower average DAF (0.20) than the neutral reference, and their allele frequency spectrum is skewed towards the low-frequency alleles (Wilcoxon test P-value <2.2E-16, see Figure 7C), which is consistent with signatures of purifying selection.
Hence, a mutation unfavorable for the motif is deleterious and is removed from the population or kept at low frequencies, whereas a mutation favorable for the motif tends to be less selectively constrained and/or positively selected.
Aggregation in miRNA mature sequences and surrounding regions
We have shown in the aggregation within protein-coding genes that miRNA binding targets have a reduced level of SNP diversity relative to their surroundings; now we further explore the regions where miRNA genes are encoded.
Mature miRNAs are ∼22 bp single-stranded RNA molecules that silence gene expression by binding to 3′UTRs. Aggregating across the mature miRNAs and their 2 kb surrounding regions reveals signals of decreased SNP diversity within miRNA sites (by 67% relative to surroundings, see Figure 8). Zooming into the 22 bp mature miRNA sequences, we find that the first 2–8 bp, which is the seed region requiring strong complementary base-pair binding, has a further 53% reduction in the level of average SNP diversity relative to the remaining sites in mature miRNA sequences (Figure 8). The 1 bp indel diversity does not show significant differences across miRNA and surrounding regions (Figure 8).
Figure 8.

Aggregation of nucleotide diversity across mature miRNA sequences and their surrounding 2 kb regions. Each data point represents the average diversity in a given bin across all the sequences of an annotation. The number of bins within an annotation is constant for all sequences. Solid lines represent bootstrapping means and 95% confidence intervals from the simple bootstrapping procedure for upstream 1 kb, mature miRNA and downstream 1 kb, respectively (Supplementary Data). Dashed lines represent bootstrapping means and 95% confidence intervals for the seed regions (2–8 bp) and the remaining sites in the mature miRNA sequence. Data is shown for CEU.
These results suggest that miRNAs, especially their seed regions, play functional roles. Thus far, we have shown that both the miRNAs and their binding targets have lower SNP diversity levels than surrounding areas. The binding interaction between miRNA and its target requires strong base-pair complementarity for relevant functions, which might render substitutions in either site deleterious. On the other hand, there is also the potential for some miRNAs and their targets to undergo positive selection or co-evolution, such as shown in the case of miRNAs with a large number of binding targets (as described above). Both negative and positive selection can result in a decrease in diversity.
Modes and mechanisms of SVs interacting with functional elements
Overview of different modes of interaction and SV formation mechanisms
To further explore the intra-element differences, we investigate the different modes of SVs interacting with each class of non-coding elements. Due to the large variant size, SV have more diverse modes of interaction with an element than SNPs and smaller indels (either within or outside of an element). For instance, an SV can ‘envelop’ a whole element, that is, the element is completely deleted or inserted by the SV and the SV breakpoints do not fall within the element. Alternatively, an SV may partially disrupt an element, with one or both of the breakpoints cutting the element. Furthermore, an SV may overlap with multiple elements simultaneously and with different modes for each element involved. In addition, there are various mechanisms in the formation of SVs, and we have previously developed a computational pipeline for systematically classifying SVs according to their mutational mechanisms (24). These mechanisms include non-allelic homologous recombination (NAHR) mediated by recombination at homologous stretches at the breakpoints, nonhomologous recombination (NHR) mediated by double strand break repair (NHEJ/MMEJ) or replication associated (MMBIR/FoSTeS) processes, variable number of tandem repeats (VNTRs) resulting from the expansion or contraction of simple tandem repeat units, and transposable element insertions (TEIs) involving mostly long and short interspersed elements (LINEs and SINEs) and combinations thereof. In the following section, we analyze the interaction between SVs and the genomic elements, and investigate the modes and mutational mechanisms involved.
Overall interaction of SVs and genomic elements
By randomly shuffling the SVs within the human genome, as well as within their local 10 Mb regions, we assess whether the association between SVs and an element is enriched or depleted compared to this random background (‘Materials and Methods’ section). Note that this background is different from the neutral background that we used in the previous sections. As a baseline, we find that, consistent with previous studies, SVs tend to be depleted from protein-coding genes (Table 2 and Supplementary Table S5) (49). SVs are also depleted from the CDSs and 3′UTRs, whereas introns and 5′UTRs are not significantly associated with SVs (Table 2 and Supplementary Table S5). Therefore, SVs overlapping with CDSs and 3′UTRs are more deleterious than those overlapping other gene domains. Moreover, SVs are significantly depleted from TF-binding motifs, whereas they are not significantly associated with ncRNAs. On the other hand, SVs are enriched in pseudogenes (Table 2 and Supplementary Table S5).
Table 2.
Randomization test for SVs interacting with genomic elements
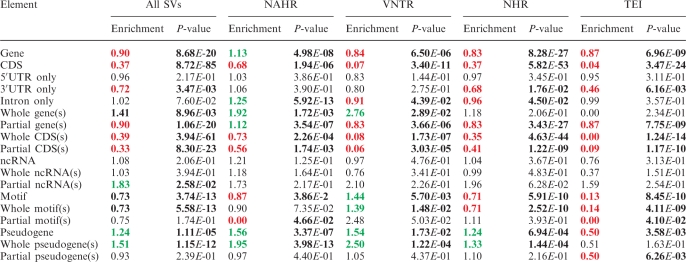 |
SVs are shuffled in the whole genome, i.e. a global background. See Supplementary Table S5 for results in a local background. Significant P-values (<0.05) are represented in bold. Significant enrichments are represented in green. Significant depletions are represented in red. CDS(s) refer to coding exons excluding UTRs.
Modes of interaction between SVs and genomic elements, and in relation to the formation mechanisms
Next, we probe the details of the different modes of SVs interacting with the genomic elements. First, regardless of an overall depletion of SVs in genes, we detect a bias towards SVs interacting with whole gene(s) (enrichment = 1.41 and P-value = 9.0E-3) instead of partially disrupting genes (enrichment = 0.90 and P-value = 1.1E-20), suggesting a relaxed constraint for SVs interacting with whole gene(s). Similar patterns largely follow when we subdivide SV interactions with whole genes into those with a single whole gene or multiple whole genes (2, 3, 4, or ≥5 whole genes) (Supplementary Table S5). This phenomenon, however, is not observed for the non-coding elements or coding exons (Table 2 and Supplementary Table S5). There is even a slight enrichment of SVs interacting with partial ncRNAs (Table 2 and Supplementary Table S5). Nonetheless, TF-binding motifs and ncRNAs are notably distinct from protein-coding genes, in that they have much smaller element sizes. In fact, each of the two classes of elements has only 10 SVs that interact with them partially (Supplementary Table S5). As we obtain substantially more SV annotations in the future, we might be able to assess different interaction modes between SVs and non-coding elements more comprehensively.
As might be expected, we then analyze whole/partial gene interactions against SVs of different formation mechanisms and find that the enrichment for whole-gene interaction is only present for SVs mediated by NAHR and VNTR mechanisms, but not for NHR and TEI mechanisms (Table 2). NAHR and VNTR mechanisms tend to involve genomic regions that are duplicated and repetitive, in which copy numbers frequently exceed two (23,49–51). Moreover, since protein-coding genes tend to contain unique sequences, the homologous sequences at the breakpoints that facilitate formation of NAHR SVs are more likely to be found within the intergenic regions than within the genes themselves. This potentially results in the enrichment of NAHR events for whole-gene interactions.
Interaction between SVs of different formation mechanisms and non-coding elements
Further, in spite of an overall depletion, SVs mediated by VNTR are enriched for TF-binding motifs, but this is not the case for the other mechanisms (Table 2). This suggests that these TF-binding motifs may function together in tandem to enhance the transcription of corresponding genes. ncRNAs are not found to particularly associate with specific formation mechanisms. On the contrary, all mechanisms but TEI are significantly enriched for pseudogenes (Table 2). This characteristic relationship between SVs and pseudogenes may first be explained by referring to the formation mechanisms of pseudogenes: duplicated pseudogenes are created from genomic duplication or unequal crossing-over, and processed pseudogenes are reverse transcribed from mRNA products, which are then inserted into the genome by hijacking the reverse transcription mechanism of LINE elements (53). Hence, the formation of pseudogenes per se involves duplication or insertion of large segments of the genome, which, by definition, are SVs if still segregating in the population. To this end, we have indeed observed instances of three processed pseudogenes still segregating as SVs in humans in a previous study (24). In addition, pseudogenes have been found to be significantly associated with segmental duplications in the human genome (50), which, together with other repeat contents in pseudogenes, may serve as homologous sequences at the breakpoints of SVs mediated by the NAHR mechanism.
DISCUSSION
Using next-generation sequencing technology, the 1000 Genomes Project is pioneering in comprehensively identifying and genotyping a whole spectrum of genomic variations, including SNPs, indels, and SVs, in a genome-wide fashion at the population level. While previous studies have been primarily limited to localized regions or the use of the ‘tagging’ SNPs, the 1000 Genomes Project has allowed us to study the selective pressure on non-coding elements using whole-genome annotations of all three types of genomic variations. Some of our novel findings from quantitative and/or qualitative analyses were not approachable with previous methods. A notable example is the study of the genome-wide properties of TF-binding motifs, miRNAs and their seeds, and miRNA binding sites, which are all non-coding elements of small size (<30 bp). Only when nearly every nucleotide within the elements is surveyed, will we have sufficient number of variants to study their genome-wide properties in a relatively unbiased way. Some other findings have previously been addressed qualitatively, but are only now possible to approach quantitatively. One such example is that the 1000 Genomes data has enabled, for the first time, the calculation of average genome-wide levels of SNP and indel diversity within elements.
In summary, we have developed a framework, ncVAR, for the integrative analysis of three types of genomic variations in a number of different types of non-coding elements (TF-binding sites, ncRNAs, pseudogenes, etc.). We have examined differences between classes of each element, between subclasses within an element class, and between the internal genomic structures of a given element. Overall, our analysis has shown that each of the non-coding elements has a very distinct variation profile.
For TF-binding sites, we find that they are less constrained for SNPs than are CDSs and more constrained than are neutral sequences. However, the selective pressure on TF-binding sites is even stronger for indels than SNPs, compared to what we observed for CDSs, which, after further inspection, is largely due to the relaxed constraints for in-frame indels. Moreover, motifs that are bound by TFs are under stronger purifying selection than unbound motifs. TF-binding motifs are also more constrained than corresponding TF peaks. Within a TF-binding motif, the site conservation is reversely correlated with SNP diversity. SNPs favorable for the motif tend to undergo positive selection or relaxed selective constraints. Lastly, the enrichment of VNTR events for TF-binding motifs reveals a propensity of TF motifs to function in tandem.
For ncRNAs, we find, that they are less constrained for SNPs than CDSs but more constrained, on average, for indels than CDSs. Further, miRNAs that are highly expressed tend to be under stronger purifying selection than the lowly expressed ones. Moreover, miRNAs with a larger number of binding targets tend to be under positive selection. Finally, miRNAs (especially seed regions) and their binding targets are both under more constraints for SNPs relative to surrounding regions.
For the non-coding gene domains, we find that they are more constrained than the neutral reference, with 3′UTRs being more functionally relevant than 5′UTRs and introns. In addition, SVs have a tendency to envelop whole gene(s) instead of partially disrupting them, and this mode of interaction is only enriched for SVs mediated by NAHR and VNTR mechanisms.
For pseudogenes, we find that they lose their neutral property regarding SVs. Although most pseudogenes lack functionality, transcribed pseudogenes, as well as some older pseudogenes, appear to be under constraints and retain certain functional roles.
In recent years, although an increasing number of studies have aimed to detect, genotype, and characterize SVs, technical difficulties remain for identifying and genotyping SVs with high-resolution breakpoints (24). The 1000 Genomes Project pilot phase has identified and genotyped by far the largest set of SVs with single-nucleotide resolution at the population level. Only at this resolution can we reliably study the mode and extent of SVs interacting with genomic elements.
One limitation in using the current 1000 Genomes pilot data is that SNPs and indels have been identified and genotyped only within each population, which precludes the use of allele frequency information from all the populations simultaneously (Supplementary Data). Additionally, different ascertainment biases remain in different variant calling algorithms. For indels and SVs, biases are particularly evident for polarized variants and for large variants. Hence, efforts still need to be made in new algorithms towards minimizing the biases in identifying and genotyping genomic variants from next-generation sequencing data.
Looking to the full production phase of the 1000 Genomes Project, we expect that a more complete catalogue of genomic variations, both in terms of quantity and allele frequency spectrum, will enable a more comprehensive characterization of the nature and strength of selective pressure on non-coding elements (the 1000 Genomes Project aims at detecting variants with a minor allele frequency of > 0.01 in 2500 individuals) (7). Additionally, the ENCODE Project is currently generating a more extensive annotation of the functional elements in the human genome (4). We foresee that, in the near future, there will be a rapid increase in next-generation sequencing data for personal genomes, wherein annotations such as ChIP-seq signals, indels, and SVs will be made available. To this end, this paper presents a prototype for the integrative analyses for population-based studies using a variety of high-throughput data sources.
SUPPLEMENTARY DATA
Supplementary Data are available at NAR Online.
FUNDING
National Institutes of Health and the Albert Lynn Williams Professorship funds. Funding for open access charge: National Institutes of Health.
Conflict of interest statement. None declared.
Supplementary Material
ACKNOWLEDGEMENTS
The authors thank B. Brown, P. Bickel, H. Huang, H. Zhao, A. Molinaro, K. Kidd, L. Habegger, J. Rozowsky, A. Abyzov, E. Khurana, J. Leng, C. Cheng and S. Chong for helpful comments and discussions, and the authors also thank D. Clarke for proofreading the manuscript. The authors acknowledge the 1000 Genomes Project for the datasets.
REFERENCES
- 1.Lander ES, Linton LM, Birren B, Nusbaum C, Zody MC, Baldwin J, Devon K, Dewar K, Doyle M, FitzHugh W, et al. Initial sequencing and analysis of the human genome. Nature. 2001;409:860–921. doi: 10.1038/35057062. [DOI] [PubMed] [Google Scholar]
- 2.Waterston RH, Lindblad-Toh K, Birney E, Rogers J, Abril JF, Agarwal P, Agarwala R, Ainscough R, Alexandersson M, An P, et al. Initial sequencing and comparative analysis of the mouse genome. Nature. 2002;420:520–562. doi: 10.1038/nature01262. [DOI] [PubMed] [Google Scholar]
- 3.Alexander RP, Fang G, Rozowsky J, Snyder M, Gerstein MB. Annotating non-coding regions of the genome. Nat. Rev. Genet. 2010;11:559–571. doi: 10.1038/nrg2814. [DOI] [PubMed] [Google Scholar]
- 4.Birney E, Stamatoyannopoulos JA, Dutta A, Guigo R, Gingeras TR, Margulies EH, Weng Z, Snyder M, Dermitzakis ET, Thurman RE, et al. Identification and analysis of functional elements in 1% of the human genome by the ENCODE pilot project. Nature. 2007;447:799–816. doi: 10.1038/nature05874. [DOI] [PMC free article] [PubMed] [Google Scholar]
- 5.The ENCODE Project Consortium. A User's Guide to the Encyclopedia of DNA Elements (ENCODE) PLoS Biol. 2011;9:e1001046. doi: 10.1371/journal.pbio.1001046. [DOI] [PMC free article] [PubMed] [Google Scholar]
- 6.Hartl DL, Clark AG. Principles of Population Genetics. Sunderland, MA: Sinauer Associations Inc. Publishers; 2007. [Google Scholar]
- 7.McDonald JH, Kreitman M. Adaptive protein evolution at the Adh locus in Drosophila. Nature. 1991;351:652–654. doi: 10.1038/351652a0. [DOI] [PubMed] [Google Scholar]
- 8.The 1000 Genomes Project Consortium. A map of human genome variation from population-scale sequencing. Nature. 2010;467:1061–1073. doi: 10.1038/nature09534. [DOI] [PMC free article] [PubMed] [Google Scholar]
- 9.Frazer KA, Ballinger DG, Cox DR, Hinds DA, Stuve LL, Gibbs RA, Belmont JW, Boudreau A, Hardenbol P, Leal SM, et al. A second generation human haplotype map of over 3.1 million SNPs. Nature. 2007;449:851–861. doi: 10.1038/nature06258. [DOI] [PMC free article] [PubMed] [Google Scholar]
- 10.Altshuler DM, Gibbs RA, Peltonen L, Dermitzakis E, Schaffner SF, Yu F, Bonnen PE, de Bakker PI, Deloukas P, Gabriel SB, et al. Integrating common and rare genetic variation in diverse human populations. Nature. 2010;467:52–58. doi: 10.1038/nature09298. [DOI] [PMC free article] [PubMed] [Google Scholar]
- 11.Quach H, Barreiro LB, Laval G, Zidane N, Patin E, Kidd KK, Kidd JR, Bouchier C, Veuille M, Antoniewski C, et al. Signatures of purifying and local positive selection in human miRNAs. Am. J. Hum. Genet. 2009;84:316–327. doi: 10.1016/j.ajhg.2009.01.022. [DOI] [PMC free article] [PubMed] [Google Scholar]
- 12.Sachidanandam R, Weissman D, Schmidt SC, Kakol JM, Stein LD, Marth G, Sherry S, Mullikin JC, Mortimore BJ, Willey DL, et al. A map of human genome sequence variation containing 1.42 million single nucleotide polymorphisms. Nature. 2001;409:928–933. doi: 10.1038/35057149. [DOI] [PubMed] [Google Scholar]
- 13.Levy S, Sutton G, Ng PC, Feuk L, Halpern AL, Walenz BP, Axelrod N, Huang J, Kirkness EF, Denisov G, et al. The diploid genome sequence of an individual human. PLoS Biol. 2007;5:e254. doi: 10.1371/journal.pbio.0050254. [DOI] [PMC free article] [PubMed] [Google Scholar]
- 14.Chuzhanova NA, Anassis EJ, Ball EV, Krawczak M, Cooper DN. Meta-analysis of indels causing human genetic disease: mechanisms of mutagenesis and the role of local DNA sequence complexity. Hum. Mutat. 2003;21:28–44. doi: 10.1002/humu.10146. [DOI] [PubMed] [Google Scholar]
- 15.Ball EV, Stenson PD, Abeysinghe SS, Krawczak M, Cooper DN, Chuzhanova NA. Microdeletions and microinsertions causing human genetic disease: common mechanisms of mutagenesis and the role of local DNA sequence complexity. Hum. Mutat. 2005;26:205–213. doi: 10.1002/humu.20212. [DOI] [PubMed] [Google Scholar]
- 16.Korbel JO, Tirosh-Wagner T, Urban AE, Chen XN, Kasowski M, Dai L, Grubert F, Erdman C, Gao MC, Lange K, et al. The genetic architecture of Down syndrome phenotypes revealed by high-resolution analysis of human segmental trisomies. Proc. Natl Acad. Sci. USA. 2009;106:12031–12036. doi: 10.1073/pnas.0813248106. [DOI] [PMC free article] [PubMed] [Google Scholar]
- 17.McCarroll SA, Huett A, Kuballa P, Chilewski SD, Landry A, Goyette P, Zody MC, Hall JL, Brant SR, Cho JH, et al. Deletion polymorphism upstream of IRGM associated with altered IRGM expression and Crohn’s disease. Nat. Genet. 2008;40:1107–1112. doi: 10.1038/ng.215. [DOI] [PMC free article] [PubMed] [Google Scholar]
- 18.Gonzalez E, Kulkarni H, Bolivar H, Mangano A, Sanchez R, Catano G, Nibbs RJ, Freedman BI, Quinones MP, Bamshad MJ, et al. The influence of CCL3L1 gene-containing segmental duplications on HIV-1/AIDS susceptibility. Science. 2005;307:1434–1440. doi: 10.1126/science.1101160. [DOI] [PubMed] [Google Scholar]
- 19.de Cid R, Riveira-Munoz E, Zeeuwen PL, Robarge J, Liao W, Dannhauser EN, Giardina E, Stuart PE, Nair R, Helms C, et al. Deletion of the late cornified envelope LCE3B and LCE3C genes as a susceptibility factor for psoriasis. Nat. Genet. 2009;41:211–215. doi: 10.1038/ng.313. [DOI] [PMC free article] [PubMed] [Google Scholar]
- 20.Wheeler DA, Srinivasan M, Egholm M, Shen Y, Chen L, McGuire A, He W, Chen YJ, Makhijani V, Roth GT, et al. The complete genome of an individual by massively parallel DNA sequencing. Nature. 2008;452:872–876. doi: 10.1038/nature06884. [DOI] [PubMed] [Google Scholar]
- 21.Wang J, Wang W, Li R, Li Y, Tian G, Goodman L, Fan W, Zhang J, Li J, Guo Y, et al. The diploid genome sequence of an Asian individual. Nature. 2008;456:60–65. doi: 10.1038/nature07484. [DOI] [PMC free article] [PubMed] [Google Scholar]
- 22.AhnS M, Kim TH, Lee S, Kim D, Ghang H, Kim DS, Kim BC, Kim SY, Kim WY, Kim C, et al. The first Korean genome sequence and analysis: full genome sequencing for a socio-ethnic group. Genome Res. 2009;19:1622–1629. doi: 10.1101/gr.092197.109. [DOI] [PMC free article] [PubMed] [Google Scholar]
- 23.Mills RE, Walter K, Stewart C, Handsaker RE, Chen K, Alkan C, Abyzov A, Yoon SC, Ye K, Cheetham RK, et al. Mapping copy number variation by population-scale genome sequencing. Nature. 2011;470:59–65. doi: 10.1038/nature09708. [DOI] [PMC free article] [PubMed] [Google Scholar]
- 24.Lam HY, Mu XJ, Stutz AM, Tanzer A, Cayting PD, Snyder M, Kim PM, Korbel JO, Gerstein MB. Nucleotide-resolution analysis of structural variants using BreakSeq and a breakpoint library. Nat. Biotechnol. 2010;28:47–55. doi: 10.1038/nbt.1600. [DOI] [PMC free article] [PubMed] [Google Scholar]
- 25.Zhang Y, Liu T, Meyer CA, Eeckhoute J, Johnson DS, Bernstein BE, Nusbaum C, Myers RM, Brown M, Li W, et al. Model-based analysis of ChIP-Seq (MACS) Genome Biol. 2008;9:R137. doi: 10.1186/gb-2008-9-9-r137. [DOI] [PMC free article] [PubMed] [Google Scholar]
- 26.McDaniell R, Lee BK, Song L, Liu Z, Boyle AP, Erdos MR, Scott LJ, Morken MA, Kucera KS, Battenhouse A, et al. Heritable individual-specific and allele-specific chromatin signatures in humans. Science. 2010;328:235–239. doi: 10.1126/science.1184655. [DOI] [PMC free article] [PubMed] [Google Scholar]
- 27.Kent WJ, Sugnet CW, Furey TS, Roskin KM, Pringle TH, Zahler AM, Haussler D. The human genome browser at UCSC. Genome Res. 2002;12:996–1006. doi: 10.1101/gr.229102. [DOI] [PMC free article] [PubMed] [Google Scholar]
- 28.Rozowsky J, Euskirchen G, Auerbach RK, Zhang ZD, Gibson T, Bjornson R, Carriero N, Snyder M, Gerstein MB. PeakSeq enables systematic scoring of ChIP-seq experiments relative to controls. Nat. Biotechnol. 2009;27:66–75. doi: 10.1038/nbt.1518. [DOI] [PMC free article] [PubMed] [Google Scholar]
- 29.Kasowski M, Grubert F, Heffelfinger C, Hariharan M, Asabere A, Waszak SM, Habegger L, Rozowsky J, Shi M, Urban AE, et al. Variation in transcription factor binding among humans. Science. 2010;328:232–235. doi: 10.1126/science.1183621. [DOI] [PMC free article] [PubMed] [Google Scholar]
- 30.Raha D, Wang Z, Moqtaderi Z, Wu L, Zhong G, Gerstein M, Struhl K, Snyder M. Close association of RNA polymerase II and many transcription factors with Pol III genes. Proc. Natl Acad. Sci. USA. 2010;107:3639–3644. doi: 10.1073/pnas.0911315106. [DOI] [PMC free article] [PubMed] [Google Scholar]
- 31.Johnson DS, Mortazavi A, Myers RM, Wold B. Genome-wide mapping of in vivo protein-DNA interactions. Science. 2007;316:1497–1502. doi: 10.1126/science.1141319. [DOI] [PubMed] [Google Scholar]
- 32.Harrow J, Denoeud F, Frankish A, Reymond A, Chen CK, Chrast J, Lagarde J, Gilbert JG, Storey R, Swarbreck D, et al. GENCODE: producing a reference annotation for ENCODE. Genome Biol. 2006;7(Suppl. 1):S4, 1–9. doi: 10.1186/gb-2006-7-s1-s4. [DOI] [PMC free article] [PubMed] [Google Scholar]
- 33.Huttenhofer A, Schattner P, Polacek N. Non-coding RNAs: hope or hype? Trends Genet. 2005;21:289–297. doi: 10.1016/j.tig.2005.03.007. [DOI] [PubMed] [Google Scholar]
- 34.Flicek P, Amode MR, Barrell D, Beal K, Brent S, Chen Y, Clapham P, Coates G, Fairley S, Fitzgerald S, et al. Ensembl 2011. Nucleic Acids Res. 2010;39:D800–D806. doi: 10.1093/nar/gkq1064. [DOI] [PMC free article] [PubMed] [Google Scholar]
- 35.Chan PP, Lowe TM. GtRNAdb: a database of transfer RNA genes detected in genomic sequence. Nucleic Acids Res. 2009;37:D93–D97. doi: 10.1093/nar/gkn787. [DOI] [PMC free article] [PubMed] [Google Scholar]
- 36.Ray PS, Jia J, Yao P, Majumder M, Hatzoglou M, Fox PL. A stress-responsive RNA switch regulates VEGFA expression. Nature. 2009;457:915–919. doi: 10.1038/nature07598. [DOI] [PMC free article] [PubMed] [Google Scholar]
- 37.Pickering BM, Willis AE. The implications of structured 5' untranslated regions on translation and disease. Semin. Cell Dev. Biol. 2005;16:39–47. doi: 10.1016/j.semcdb.2004.11.006. [DOI] [PubMed] [Google Scholar]
- 38.Allen NC, Bagade S, McQueen MB, Ioannidis JP, Kavvoura FK, Khoury MJ, Tanzi RE, Bertram L. Systematic meta-analyses and field synopsis of genetic association studies in schizophrenia: the SzGene database. Nat. Genet. 2008;40:827–834. doi: 10.1038/ng.171. [DOI] [PubMed] [Google Scholar]
- 39.Zhang Z, Gerstein M. Patterns of nucleotide substitution, insertion and deletion in the human genome inferred from pseudogenes. Nucleic Acids Res. 2003;31:5338–5348. doi: 10.1093/nar/gkg745. [DOI] [PMC free article] [PubMed] [Google Scholar]
- 40.Karro JE, Yan Y, Zheng D, Zhang Z, Carriero N, Cayting P, Harrrison P, Gerstein M. Pseudogene.org: a comprehensive database and comparison platform for pseudogene annotation. Nucleic Acids Res. 2007;35:D55–D60. doi: 10.1093/nar/gkl851. [DOI] [PMC free article] [PubMed] [Google Scholar]
- 41.Ardlie KG, Kruglyak L, Seielstad M. Patterns of linkage disequilibrium in the human genome. Nat. Rev. Genet. 2002;3:299–309. doi: 10.1038/nrg777. [DOI] [PubMed] [Google Scholar]
- 42.Galassi M, Davies J, Theiler J, Gough B, Jungman G, Alken P, Booth M, Rossi F. GNU Scientific Library Reference Manual. Bristol, UK: Network Theory Ltd; 2009. [Google Scholar]
- 43.Prabhakar S, Noonan JP, Paabo S, Rubin EM. Accelerated evolution of conserved noncoding sequences in humans. Science. 2006;314:786. doi: 10.1126/science.1130738. [DOI] [PubMed] [Google Scholar]
- 44.Poliseno L, Salmena L, Zhang J, Carver B, Haveman WJ, Pandolfi PP. A coding-independent function of gene and pseudogene mRNAs regulates tumour biology. Nature. 2010;465:1033–1038. doi: 10.1038/nature09144. [DOI] [PMC free article] [PubMed] [Google Scholar]
- 45.Hastings PJ, Lupski JR, Rosenberg SM, Ira G. Mechanisms of change in gene copy number. Nat. Rev. Genet. 2009;10:551–564. doi: 10.1038/nrg2593. [DOI] [PMC free article] [PubMed] [Google Scholar]
- 46.Subramanian S, Kumar S. Gene expression intensity shapes evolutionary rates of the proteins encoded by the vertebrate genome. Genetics. 2004;168:373–381. doi: 10.1534/genetics.104.028944. [DOI] [PMC free article] [PubMed] [Google Scholar]
- 47.Krylov DM, Wolf YI, Rogozin IB, Koonin EV. Gene loss, protein sequence divergence, gene dispensability, expression level, and interactivity are correlated in eukaryotic evolution. Genome Res. 2003;13:2229–2235. doi: 10.1101/gr.1589103. [DOI] [PMC free article] [PubMed] [Google Scholar]
- 48.Harrison PM, Zheng D, Zhang Z, Carriero N, Gerstein M. Transcribed processed pseudogenes in the human genome: an intermediate form of expressed retrosequence lacking protein-coding ability. Nucleic Acids Res. 2005;33:2374–2383. doi: 10.1093/nar/gki531. [DOI] [PMC free article] [PubMed] [Google Scholar]
- 49.Conrad DF, Pinto D, Redon R, Feuk L, Gokcumen O, Zhang Y, Aerts J, Andrews TD, Barnes C, Campbell P, et al. Origins and functional impact of copy number variation in the human genome. Nature. 2010;464:704–712. doi: 10.1038/nature08516. [DOI] [PMC free article] [PubMed] [Google Scholar]
- 50.Kim PM, Lam HY, Urban AE, Korbel JO, Affourtit J, Grubert F, Chen X, Weissman S, Snyder M, Gerstein MB. Analysis of copy number variants and segmental duplications in the human genome: evidence for a change in the process of formation in recent evolutionary history. Genome Res. 2008;18:1865–1874. doi: 10.1101/gr.081422.108. [DOI] [PMC free article] [PubMed] [Google Scholar]
- 51.Korbel JO, Urban AE, Affourtit JP, Godwin B, Grubert F, Simons JF, Kim PM, Palejev D, Carriero NJ, Du L, et al. Paired-end mapping reveals extensive structural variation in the human genome. Science. 2007;318:420–426. doi: 10.1126/science.1149504. [DOI] [PMC free article] [PubMed] [Google Scholar]
- 52.Kidd JM, Cooper GM, Donahue WF, Hayden HS, Sampas N, Graves T, Hansen N, Teague B, Alkan C, Antonacci F, et al. Mapping and sequencing of structural variation from eight human genomes. Nature. 2008;453:56–64. doi: 10.1038/nature06862. [DOI] [PMC free article] [PubMed] [Google Scholar]
- 53.Zhang Z, Gerstein M. Large-scale analysis of pseudogenes in the human genome. Curr. Opin. Genet. Dev. 2004;14:328–335. doi: 10.1016/j.gde.2004.06.003. [DOI] [PubMed] [Google Scholar]
Associated Data
This section collects any data citations, data availability statements, or supplementary materials included in this article.