

Abstract
The authors tested whether the relation between gestational weight gain (GWG) and 5 adverse pregnancy outcomes (small-for-gestational-age (SGA) birth, large-for-gestational-age (LGA) birth, spontaneous preterm birth, indicated preterm birth, and unplanned cesarean delivery) differed according to maternal race/ethnicity, smoking, parity, age, and/or height. They also evaluated whether GWG guidelines should be modified for special populations by studying GWG and risk of at least 1 adverse outcome within different subgroups. Data came from a cohort of 23,362 normal-weight mothers who delivered singletons at Magee-Womens Hospital in Pittsburgh, Pennsylvania (2003–2008). Adequacy of GWG was defined as observed GWG divided by recommended GWG. The synergy analysis found that the combination of smoking, black race/ethnicity, primiparity, or short height with poor GWG was associated with an excess risk of SGA birth, while high GWG combined with each of these characteristics diminished risk of LGA birth in comparison with the same GWG among the women's counterparts. Nevertheless, there were no significant or meaningful differences in the risk of at least 1 adverse outcome between the GWG recommended by the Institute of Medicine in 2009 and the GWG that minimized risk of the composite outcome. These findings do not support the tailoring of GWG guidelines on the basis of a mother's smoking status, race/ethnicity, parity, age, or height among normal-weight women.
Keywords: ethnic groups, gestational age, parity, practice guidelines as topic, pregnancy, smoking, weight gain
In 2009, the Institute of Medicine (IOM) of the National Academy of Sciences published revised recommendations on gestational weight gain (GWG) during pregnancy and highlighted major gaps in knowledge, including a lack of understanding of the extent to which GWG guidelines should vary among subgroups of women (1). For more than 20 years, it has been recognized that optimal GWG varies by prepregnancy body mass index (BMI; weight (kg)/height (m)2) (1–3), yet very little is known about other maternal factors (4–10). The 1990 IOM committee recommended that, to improve birth outcomes, young adolescents (age <16 years) and black women gain weight at the upper end of the range and women of short stature (<157 cm) gain weight at the lower end of their BMI-specific GWG ranges (2). Nevertheless, a paucity of data was available for the 2009 IOM committee to evaluate the appropriateness of these guidelines (1), so the 2009 committee decided to abandon the 1990 recommendations until more research had been conducted. They called for additional study to inform the determination of optimal GWG ranges by race/ethnicity, age, and height, as well as smoking and parity, due to intriguing preliminary findings based on these latter characteristics (1, 5).
Our objective was to test whether, among normal-weight women, maternal race/ethnicity, smoking, parity, age, and/or height modified associations between GWG and the risk of 5 adverse pregnancy outcomes (small-for-gestational-age (SGA) birth, large-for-gestational-age (LGA) birth, spontaneous preterm birth, indicated preterm birth, and unplanned cesarean delivery). We tested for departures from additivity because they are more meaningful for assessing public health and biologic significance than departures from multiplicativity (11–14). However, we recognized that the presence of interaction alone does not necessitate subgroup-specific GWG guidelines and that the development of guidelines is based on a balancing of many outcomes (some of which may involve effect modification and others of which may not). Therefore, we also sought to evaluate whether subgroups of women would benefit from different GWG guidelines by studying the association between GWG and a composite measure of birth outcomes, which takes into account competing risks of low and high gain. In this analysis, we focused on normal-weight women because small sample sizes in other BMI groups prevented the study of some subgroups.
MATERIALS AND METHODS
We used data from the Magee Obstetric Medical and Infant (MOMI) Database. The MOMI Database routinely collects comprehensive information on maternal, fetal, and neonatal outcomes from electronic and medical records on all women delivering at Magee-Womens Hospital in Pittsburgh, Pennsylvania (15, 16). The database is surveyed to maintain its accuracy through random comparison with patient charts and by examining frequencies for variables that contain data outliers, which, once identified, are verified or corrected by means of medical chart review. The correlations between data derived from MOMI and data from chart audits were 0.94 for self-reported prepregnancy weight, 0.99 for self-reported height, 0.93 for last measured pregnancy weight, 0.96 for gestational age at delivery, and 0.98 for birth weight. Personal identifying information in the database was eliminated to ensure confidentiality. The University of Pittsburgh Institutional Review Board approved this study.
There were 47,445 deliveries of live singleton infants without congenital anomalies at 20–42 weeks’ gestation at Magee-Womens Hospital from January 1, 2003, to December 31, 2008. We excluded women whose self-reported race/ethnicity was not non-Hispanic white or non-Hispanic black (n = 2,556), because of small numbers. We also excluded women who were missing data on covariates in the final model (n = 191). Of the remaining deliveries, 10,775 had missing data on prepregnancy BMI and 4,259 had missing data on maternal weight at delivery because of a change in the process used to ascertain data on prepregnancy weight, height, and delivery weight in the electronic medical record from 2006 to 2008 at Magee-Womens Hospital. To address the missing data, we used multiple imputation on prepregnancy weight, height, and delivery weight (described below). After imputation of weight and height variables, there were 2,211 underweight (BMI <18.5), 23,362 normal-weight (BMI 18.5–<25), 10,594 overweight (BMI 25–<29), and 8,531 obese (BMI ≥30) women (17) in the data set. All normal-weight women were included in this analysis.
Exposures
Prepregnancy weight and height were self-reported at the first prenatal visit. We defined adequacy of GWG in terms of the ratio of observed GWG to expected (recommended) GWG, as described previously (16, 18, 19). Observed GWG was calculated as the difference between measured weight at the last prenatal visit and reported prepregnancy weight. Expected GWG was defined as 100% of the 2009 IOM recommendations at the gestational age of delivery (1). We used the following equation: expected GWG = recommended first-trimester total weight gain + (gestational age – 13 weeks) × recommended rate of gain in the second and third trimesters. The range of recommended GWG at term that the IOM stipulates (11.5–16 kg) corresponds to 86%–120% of IOM recommendations.
Outcomes
Gestational age was ascertained from the birth attendant's final estimate on the basis of all available perinatal factors and assessments, including ultrasound reports. Although the database did not indicate how gestational age was specifically determined in each patient, 78% of patients who deliver at Magee have undergone a dating ultrasound by 20 weeks’ gestation (Magee-Womens Hospital quality assurance data, 2006). Preterm birth was defined as delivery of a live infant at 20–<37 completed weeks’ gestation. Spontaneous preterm birth was defined as a preterm delivery occurring after preterm labor with intact membranes or preterm prelabor rupture of the fetal membranes. Indicated preterm births were the remainder of preterm deliveries. SGA birth and LGA birth were defined as the births of live infants whose birth weights were less than the 10th percentile and greater than the 90th percentile, respectively, of ultrasound-based intrauterine fetal weight standards (20). Unplanned cesarean delivery was defined as a cesarean delivery following labor. We also generated a composite measure of these 5 outcomes, a binary variable indicating the presence of no adverse outcomes versus 1 or more.
Covariates
The 5 maternal characteristics we studied were based on maternal self-report: race/ethnicity (non-Hispanic white, non-Hispanic black); smoking status during pregnancy (smoker, nonsmoker); parity (1, ≥2); age (≥20 years, <20 years); and height (≥157 cm, <157 cm). Potential confounders included education, marital status, principal source of payment at delivery, and type of health-care provider.
Statistical analysis
To address the missing data, we created 5 imputed data sets that assumed a multivariable normal assumption with a Markov chain Monte Carlo approach to jointly address the missing data in prepregnancy weight, height, and/or weight at delivery (21, 22). We imputed pregravid weight, height, and delivery weight (all of which were log-transformed to ensure a normal distribution) by including race/ethnicity, parity, smoking, age, education, provider type, delivery year, and all outcomes in the imputation model. The results based on multiple imputation were compared with those generated using the complete data set (n = 17,732).
To determine the extent to which maternal characteristics modified associations between GWG and each birth outcome, we evaluated interaction on the additive scale. We tested for departures from additivity in risk because we wished to measure biologic interaction (11–14). Defining biologic interaction requires that all cases caused by joint exposure to the 2 factors of interest can be divided into the 4 possible classes of causal mechanisms of disease, and its mathematical derivation is based on additivity of risk differences or risk ratios (14). Adjusted absolute risks and 95% confidence intervals were calculated from multivariable logistic regression models and were then plotted. For each model, departures from additive joint effects were determined by calculating the synergy index (23–25) and its confidence interval (26). The synergy index is a test of interaction that evaluates whether the joint effect is greater than the sum of the independent effects of the single factors. When there is no interaction (perfect additivity), the synergy index equals 1 (24). Synergy is indicated by values greater than 1 and antagonism by values less than 1. Unlike other measures used to assess departures from additivity, the synergy index is not misspecified in logistic regression models with additional covariates (25).
To evaluate whether GWG guidelines should differ according to maternal characteristics, we regressed GWG on the composite birth outcome using a separate logistic regression model for each subgroup. We then plotted absolute risks and 95% confidence intervals and determined the point of lowest risk on the GWG-adverse outcome curve. To evaluate whether the optimal gain for each subgroup was different from the overall recommendation, we calculated the absolute risk of any adverse outcome corresponding to the GWG at the nadir of the curve and the absolute risk corresponding to GWG at 100% of the IOM recommendations. We evaluated risk differences and 95% confidence intervals to determine whether subgroup-specific guidelines were justified.
Potential confounders (race/ethnicity, smoking, parity, age, height, education, marital status, delivery year, and provider type) were identified using directed acyclic graphs. To ensure comparability, we included the same covariates in all models. We specified GWG as a restricted cubic spline with 4 knots in all models for comparability and to allow for flexibility in estimating curvilinear relations.
Thirteen percent of women in the final analysis had more than 1 pregnancy in the data set. A comparison of results obtained from models fitted using generalized estimating equations to account for these repeated pregnancies with results generated from models that ignored this clustering showed no meaningful differences; thus, we ignored the clustering.
Stata software, version 11 (Stata Corporation, College Station, Texas), was used for all analyses.
RESULTS
Most normal-weight women in the cohort were white (84%), aged 20–29 years (42%), nonsmokers (87%), and married (65%) and had some college education (51%). Overall, 19%, 31%, and 50% of women gained weight below, within, and above the IOM guidelines, respectively (Table 1). On average, women gained 124% of the guideline weight (the equivalent of 16.5 kg at 40 weeks). Approximately 33% of women had at least 1 adverse birth outcome (27%, 5%, and 0.5% had 1, 2, and 3 adverse outcomes, respectively). Women who were black, smokers, multiparous, under 20 years of age, and under 157 cm in height tended to gain less weight than their counterparts. The proportion of women with at least 1 adverse birth outcome was lowest among multiparous women and highest among short women.
Table 1.
Characteristics of 23,362 Normal-Weight Pregnant Women Delivering Live Infants at Magee-Womens Hospital, Pittsburgh, Pennsylvania, 2003–2008
| Total (n = 23,362) | Smoking |
Race/Ethnicity |
Parity |
Age, years |
Height, cm |
|||||||||||||||||
| No (n = 20,268) |
Yes (n = 3,094) |
White (n = 19,655) |
Black (n = 3,707) |
1 (n = 10,957) |
≥2 (n = 12,405) |
≥20 (n = 21,607) |
13–19 (n = 1,755) |
≥157 (n = 20,949) |
<157 (n = 2,413) |
|||||||||||||
| % | Mean (SE) | % | Mean (SE) | % | Mean (SE) | % | Mean (SE) | % | Mean (SE) | % | Mean (SE) | % | Mean (SE) | % | Mean (SE) | % | Mean (SE) | % | Mean (SE) | % | Mean (SE) | |
| GWG, kg | 15.8 (0.04) | 16.0 (0.04) | 15.4 (0.13) | 16.0 (0.05) | 15.2 (0.12) | 16.5 (0.06) | 15.3 (0.06) | 15.9 (0.04) | 15.5 (0.17) | 16.0 (0.05) | 14.6 (0.12) | |||||||||||
| Adequacy of GWGa, % | ||||||||||||||||||||||
| Inadequate (<IOM range) | 18.5 | 16.7 | 23.3 | 17.2 | 25.0 | 15.3 | 19.5 | 17.1 | 22.9 | 16.9 | 23.2 | |||||||||||
| Adequate (within IOM range) | 31.1 | 32.7 | 27.1 | 32.7 | 27.7 | 30.5 | 33.5 | 32.3 | 28.3 | 31.6 | 35.7 | |||||||||||
| Excessive (>IOM range) | 50.4 | 50.6 | 49.6 | 50.1 | 47.3 | 54.2 | 47.0 | 50.5 | 48.8 | 51.5 | 41.1 | |||||||||||
| Adequacy of GWGa (% of IOM recommendations met) | 124 (0.3) | 125 (0.4) | 121 (0.9) | 125 (0.4) | 121 (0.8) | 120 (0.5) | 124 (0.4) | 123 (1.4) | 125 (0.4) | 115 (0.9) | ||||||||||||
| Adverse birth outcome | ||||||||||||||||||||||
| SGA birth | 9.3 | 7.5 | 19.3 | 7.0 | 8.0 | 10.8 | 7.3 | 8.3 | 17.3 | 8.2 | 15.4 | |||||||||||
| LGA birth | 7.9 | 8.7 | 3.0 | 17.5 | 2.6 | 5.6 | 10.0 | 8.4 | 2.6 | 8.5 | 3.3 | |||||||||||
| Indicated preterm birth | 4.3 | 3.4 | 7.3 | 3.4 | 6.4 | 3.7 | 4.0 | 3.6 | 7.0 | 3.7 | 5.3 | |||||||||||
| Spontaneous preterm birth | 5.8 | 4.7 | 10.7 | 5.1 | 7.3 | 6.0 | 4.9 | 5.3 | 7.2 | 5.1 | 7.6 | |||||||||||
| Unplanned cesarean delivery | 13.1 | 13.1 | 12.1 | 13.1 | 12.5 | 18.0 | 8.1 | 13.2 | 10.6 | 11.8 | 23.5 | |||||||||||
| Composite measure: at least 1 adverse birth outcome | 32.7 | 30.6 | 41.2 | 30.9 | 37.9 | 36.0 | 28.3 | 31.6 | 37.1 | 30.6 | 43.6 | |||||||||||
Abbreviations: GWG, gestational weight gain; IOM, Institute of Medicine; LGA, large-for-gestational age; SE, standard error; SGA, small-for-gestational age.
2009 Institute of Medicine guidelines for normal-weight women (1).
Synergistic effect of GWG and maternal characteristics on risk of adverse birth outcomes
Figure 1, Figure 2, Figure 3, Figure 4, and Figure 5 show, for each subgroup of interest, the adjusted absolute risk of each adverse birth outcome by GWG adequacy. In all subgroups, high GWG was associated with an increased risk of LGA birth and unplanned cesarean delivery, while low GWG was a risk factor for SGA birth, spontaneous preterm birth, and indicated preterm birth. However, the strengths of these associations differed by subgroup.
Figure 1.

Adjusted risk of adverse birth outcomes according to gestational weight gain (GWG) adequacy ratio, by smoking status, among deliveries occurring at Magee-Womens Hospital, Pittsburgh, Pennsylvania, 2003–2008. A) Nonsmokers (n = 20,268); B) smokers (n = 3,094). GWG adequacy ratio is defined as the ratio of observed GWG to expected (recommended) GWG at the gestational age at delivery. Recommended GWG is based on Institute of Medicine guidelines for normal-weight women (1). Solid line with filled circle, small-for-gestational age birth; dashed line with open circle, large-for-gestational age birth; solid line with filled triangle, spontaneous preterm birth; dashed line with open triangle, indicated preterm birth; solid line with filled square, unplanned cesarean delivery.
Figure 2.

Adjusted risk of adverse birth outcomes according to gestational weight gain (GWG) adequacy ratio, by maternal race/ethnicity, among deliveries occurring at Magee-Womens Hospital, Pittsburgh, Pennsylvania, 2003–2008. A) Non-Hispanic white (n = 19,655); B) non-Hispanic black (n = 3,707). GWG adequacy ratio is defined as the ratio of observed GWG to expected (recommended) GWG at the gestational age at delivery. Recommended GWG is based on Institute of Medicine guidelines for normal-weight women (1). Solid line with filled circle, small-for-gestational age birth; dashed line with open circle, large-for-gestational age birth; solid line with filled triangle, spontaneous preterm birth; dashed line with open triangle, indicated preterm birth; solid line with filled square, unplanned cesarean delivery.
Figure 3.

Adjusted risk of adverse birth outcomes according to gestational weight gain (GWG) adequacy ratio, by parity, among deliveries occurring at Magee-Womens Hospital, Pittsburgh, Pennsylvania, 2003–2008. A) Multiparous women (n = 12,405); B) primiparous women (n = 10,957). GWG adequacy ratio is defined as the ratio of observed GWG to expected (recommended) GWG at the gestational age at delivery. Recommended GWG is based on Institute of Medicine guidelines for normal-weight women (1). Solid line with filled circle, small-for-gestational age birth; dashed line with open circle, large-for-gestational age birth; solid line with filled triangle, spontaneous preterm birth; dashed line with open triangle, indicated preterm birth; solid line with filled square, unplanned cesarean delivery.
Figure 4.

Adjusted risk of adverse birth outcomes according to gestational weight gain (GWG) adequacy ratio, by maternal age, among deliveries occurring at Magee-Womens Hospital, Pittsburgh, Pennsylvania, 2003–2008. A) Maternal age ≥20 years (n = 21,607); B) maternal age 13–19 years (n = 1,755). GWG adequacy ratio is defined as the ratio of observed GWG to expected (recommended) GWG at the gestational age at delivery. Recommended GWG is based on Institute of Medicine guidelines for normal-weight women (1). Solid line with filled circle, small-for-gestational age birth; dashed line with open circle, large-for-gestational age birth; solid line with filled triangle, spontaneous preterm birth; dashed line with open triangle, indicated preterm birth; solid line with filled square, unplanned cesarean delivery.
Figure 5.

Adjusted risk of adverse birth outcomes according to gestational weight gain (GWG) adequacy ratio, by maternal height, among deliveries occurring at Magee-Womens Hospital, Pittsburgh, Pennsylvania, 2003–2008. A) Maternal height ≥157 cm (n = 20,949); B) maternal height <157 cm (n = 2,413). GWG adequacy ratio is defined as the ratio of observed GWG to expected (recommended) GWG at the gestational age at delivery. Recommended GWG is based on Institute of Medicine guidelines for normal-weight women (1). Solid line with filled circle, small-for-gestational age birth; dashed line with open circle, large-for-gestational age birth; solid line with filled triangle, spontaneous preterm birth; dashed line with open triangle, indicated preterm birth; solid line with filled square, unplanned cesarean delivery.
Table 2 shows the formal tests of departure from additivity for each association, where low GWG is 50% (vs. 100%) of the IOM guidelines and high GWG is 200% (vs. 100%) of the IOM guidelines. Our analyses of synergy indicated that the combined exposure to smoking and low GWG was associated with excess risks of SGA birth and spontaneous preterm birth that were 1.6 and 1.5 times higher, respectively, than the sum of the independent effects. For black race/ethnicity, primiparity, and short stature, synergy was also noted in the effect of their combined presence with low GWG on risk of SGA birth, whereas the synergy index for SGA birth among young women indicated an effect close to additivity.
Table 2.
Synergy Indexa (S) Values Calculated as a Test of Departure From Additivity by Maternal Race/Ethnicity, Smoking, Parity, Age, or Height in Associations Between Gestational Weight Gain and Adverse Pregnancy Outcomes Among Magee-Womens Hospital Deliveries (n = 23,362), Pittsburgh, Pennsylvania, 2003–2008
| Association | Potential Effect Modifier |
|||||||||
| Smoking |
Black Race/Ethnicity |
Primiparity |
Young Age (13–19 Years) |
Short Stature (<157 cm) |
||||||
| S | 95% CI | S | 95% CI | S | 95% CI | S | 95% CI | S | 95% CI | |
| Low GWG–SGA birth | 1.6* | 1.3, 1.9 | 1.3* | 1.1, 1.5 | 1.3* | 1.1, 1.5 | 1.0 | 0.7, 1.3 | 1.4* | 1.1, 1.8 |
| Low GWG–spontaneous preterm birth | 1.5* | 1.2, 1.8 | 1.5 | 0, 3.6 | 0.5 | 0, 1.3 | 0.3 | 0, 1.7 | 0.9 | 0.3, 1.5 |
| Low GWG–indicated preterm birth | 1.4 | 0.9, 2.0 | 2.0 | 0, 4.0 | 1.1 | 0.3, 1.9 | 0.6 | 0, 2.5 | 1.1 | 0.2, 1.9 |
| High GWG–LGA birth | 0.3* | 0.01, 0.6 | 0.8* | 0.7, 0.9 | 0.5* | 0.3, 0.7 | 1.0 | 0.4, 1.5 | 0.3* | 0.1, 0.5 |
| High GWG–unplanned cesarean delivery | 0.9 | 0.4, 1.4 | 0.9 | 0.5, 1.2 | 1.4* | 1.2, 1.7 | 0.9 | 0.8, 1.1 | 1.2 | 0.9, 1.4 |
Abbreviations: CI, confidence interval; GWG, gestational weight gain; LGA, large-for-gestational age; SGA, small-for-gestational age.
* P < 0.05.
A synergy index of 1.0 implies no interaction (perfect additivity), <1 indicates antagonism, and >1 indicates synergy (24).
For LGA birth, the presence of both high GWG and smoking resulted in a risk of LGA birth that was below the sum of the independent effects (synergy index (S) = 0.3, 95% confidence interval: 0.01, 0.6). Antagonistic effects on LGA birth were also found for the combination of high GWG with black race/ethnicity, primiparity, and short stature. For spontaneous preterm birth and indicated preterm birth, most synergy index values were highly imprecise, and departures from additivity were only significant for spontaneous preterm birth by smoking, as noted above. Lastly, the only synergy noted for unplanned cesarean delivery was for primiparity. The excess risk of unplanned cesarean delivery resulting from combined exposure to high GWG and primiparity was 1.4 times higher than the sum of the independent effects. The departures from additivity that we noted were moderate in strength (25).
Evaluation of the subgroup-specific GWG guidelines
Figure 6 plots, by subgroup, GWG adequacy versus the absolute risk of having at least 1 adverse birth outcome, represented by the composite measure. For nearly all groups, the risk curves were roughly U-shaped, with both poor and excessive GWG being associated with an elevated risk. For smokers, black women, and adolescent mothers, risk curves were shifted to the right, with the lowest risk associated with GWG at 156%, 144%, and 141% of the IOM recommendations, respectively, corresponding to an additional gain of 5.5–6.3 kg at term (Table 3). Nevertheless, for these 3 groups, comparing the risk at the nadir of the curve with the risk at 100% of the IOM guidelines resulted in unadjusted risk differences less than or equal to 4.7% and adjusted risk differences less than or equal to 3.8%. These differences were neither statistically significant nor clinically meaningful. For the remaining subgroups, the lowest risk corresponded with GWG within the IOM-recommended range (86%–120%), and unadjusted and adjusted risk differences were close to 0.
Figure 6.
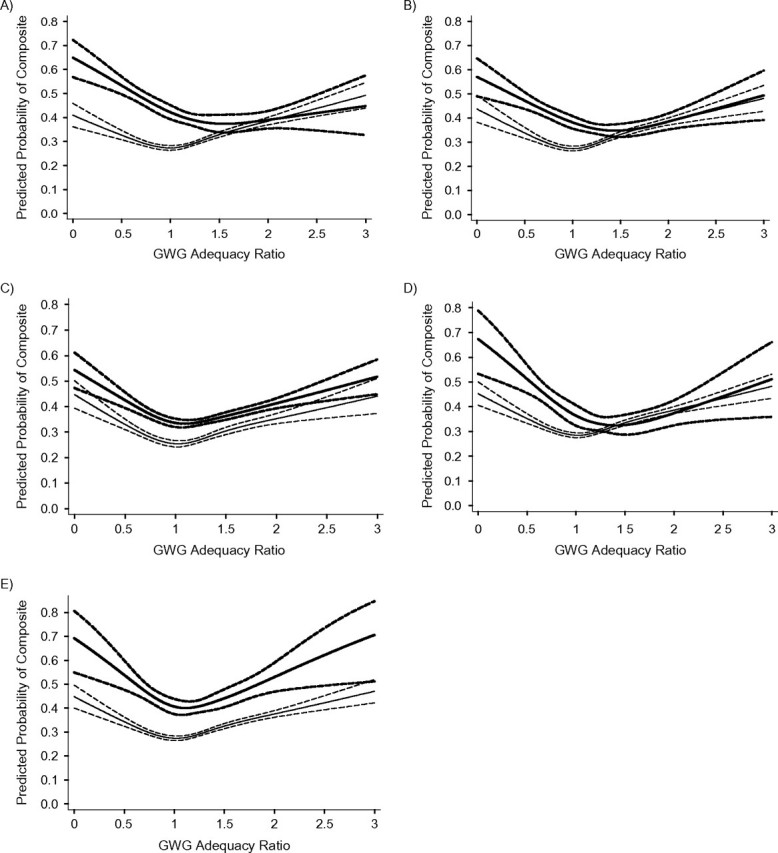
Unadjusted association between gestational weight gain (GWG) adequacy ratio and risk of any adverse birth outcome, by maternal subgroup, among deliveries occurring at Magee-Womens Hospital, Pittsburgh, Pennsylvania, 2003–2008. “Any adverse birth outcome” was a composite measure comprising any 1 of following adverse birth outcomes: small-for-gestational-age birth, large-for-gestational-age birth, indicated preterm birth, spontaneous preterm birth, and unplanned cesarean delivery. A) Smokers (bolded lines) and nonsmokers; B) non-Hispanic black women (bolded lines) and non-Hispanic white women; C) primiparas (bolded lines) and multiparas; D) maternal age 13–19 years (bolded lines) and maternal age ≥20 years; E) maternal height <157 cm (bolded lines) and maternal height ≥157 cm. GWG adequacy ratio is defined as the ratio of observed GWG to expected (recommended) GWG at the gestational age at delivery. Recommended GWG is based on Institute of Medicine guidelines for normal-weight women (1). The solid lines represent the point estimate, and the dashed lines represent the 95% confidence bands.
Table 3.
Risk Difference for at Least 1 Adverse Birth Outcomea in a Comparison of Gestational Weight Gain According to the 2009 Institute of Medicine Recommended Guidelinesb With Gestational Weight Gain at the Nadir of Subgroup Risk Curves Among Magee-Womens Hospital Deliveries (n = 23,362), Pittsburgh, Pennsylvania, 2003–2008
| 2009 IOM Guidelines | Nadir of Risk Curve |
Unadjusted RD | 95% CI | Adjusted RDc | 95% CI | |||||
| % of IOM | GWG, kg | Risk | % of IOM | GWG, kg | Risk | |||||
| Maternal smoking | ||||||||||
| Smoker | 100 | 13.3 | 0.423 | 156 | 20.6 | 0.374 | −0.047 | −0.10, 0.005 | −0.038 | −0.093, 0.017 |
| Nonsmoker | 100 | 13.3 | 0.273 | 100 | 13.3 | 0.273 | 0 | 0 | ||
| Maternal race/ethnicity | ||||||||||
| Black | 100 | 13.3 | 0.383 | 144 | 19.2 | 0.348 | −0.034 | −0.070, 0.003 | −0.029 | −0.067, 0.009 |
| White | 100 | 13.3 | 0.274 | 100 | 13.3 | 0.274 | 0 | 0 | ||
| Parity | ||||||||||
| Primiparous | 100 | 13.3 | 0.337 | 109 | 14.5 | 0.333 | −0.002 | −0.006, 0.001 | −0.001 | −0.005, 0.003 |
| Multiparous | 100 | 13.3 | 0.255 | 103 | 13.7 | 0.254 | 0 | −0.001, 0.001 | 0.001 | −0.001, 0.001 |
| Maternal age, years | ||||||||||
| 13–19 | 100 | 13.3 | 0.365 | 141 | 18.8 | 0.325 | −0.038 | −0.096, 0.019 | −0.029 | −0.079, 0.022 |
| ≥20 | 100 | 13.3 | 0.285 | 102 | 13.6 | 0.285 | 0.001 | −0.001, 0.001 | 0.001 | −0.001, 0.001 |
| Maternal height, cm | ||||||||||
| <157 | 100 | 13.3 | 0.406 | 111 | 14.8 | 0.400 | −0.005 | −0.015, 0.004 | −0.007 | −0.017, 0.003 |
| ≥157 | 100 | 13.3 | 0.274 | 102 | 13.6 | 0.274 | 0.001 | −0.001, 0.001 | 0.001 | −0.001, 0.001 |
Abbreviations: CI, confidence interval; GWG, gestational weight gain; IOM, Institute of Medicine; RD, risk difference.
Composite measure comprising any 1 of the following adverse birth outcomes: small-for-gestational-age birth, large-for-gestational-age birth, indicated preterm birth, spontaneous preterm birth, and unplanned cesarean delivery.
2009 Institute of Medicine guidelines for normal-weight women (1).
Adjusted for maternal race/ethnicity, education, age, height, parity, smoking, type of health-care provider, marital status, and delivery year. The stratifying variable was not included in the model.
The results we generated were not meaningfully different from those based on the subsample with complete BMI and GWG data (see Web Tables 1 and 2, which appear on the Journal’s Web site (http://aje.oxfordjournals.org/)).
DISCUSSION
In this cohort of normal-weight women, we observed moderate deviations (25) from additive joint effects of GWG and maternal characteristics, including smoking, race/ethnicity, parity, and height, on risk of several adverse birth outcomes. Moderate degrees of effect measure modification on the additive scale were noted most consistently for SGA birth and LGA birth. Poor GWG among smokers, black women, primiparous women, and short women was associated with an excess risk of SGA birth, while high GWG in these groups was associated with a diminished risk of LGA birth in comparison with the same GWG among their counterparts. If reducing the risk of fetal growth restriction were the only goal, it is likely that smokers, black women, primiparous women, and short women might benefit from higher GWG because the risk of SGA birth would be minimized.
However, fetal growth is not the only outcome to consider when evaluating optimal GWG. We studied a composite outcome involving SGA birth, spontaneous preterm birth, indicated preterm birth (which are associated with higher risk at low GWG), LGA birth, and unplanned cesarean delivery (which are associated higher risk at high GWG). With these competing outcomes, it is not surprising that we observed roughly U-shaped GWG risk curves for the composite measure in nearly all subgroups. When there are clear trade-offs between gaining low and high on risk of multiple outcomes, the presence of effect measure modification alone cannot dictate whether recommendations should differ on the basis of maternal characteristics. Consider a situation in which strong additive interaction led to very steep slopes in the U-shaped curve for one group and flatter slopes in the U-shaped curve for another group, but the nadir of both curves was the same. The conclusion would be that the same GWG is likely to be optimal in both groups of women. Alternatively, if no effect modification were present and the curves had identical slopes but one curve was shifted to the right or left of the other, different GWG guidelines would be warranted.
In our analysis, there was not a dramatic shift in any of the curves stratified by maternal characteristics. For smokers, black women, and young women, the slight shift of the risk curve to the right did not result in a sufficiently large risk reduction to recommend a higher GWG than current IOM guidelines. For the remaining groups, the risk of any adverse outcome was minimized within the existing IOM-recommended ranges. Nevertheless, it is important to note that our composite measure did not account for key outcomes related to GWG, including postpartum weight retention (which may be more causally related to GWG than adverse birth outcomes) and childhood obesity (1). These outcomes could have an important influence on the determination of optimal GWG in subgroups of women and should be further explored. Our use of the composite measure also relied on the assumption of equal weighting of all outcomes. Unfortunately, the literature lacks a comprehensive risk-benefit analysis with which to value one outcome over another; thus, all current approaches studying many outcomes will rely on some subjective judgment. Given the data available to us, our results do not support the tailoring of GWG guidelines based on a mother's smoking status, race/ethnicity, parity, age, or height among normal-weight women.
The 1990 IOM Committee promoted higher GWG for black and adolescent mothers to offset their lower birth weights, and argued for lower gain in short women to reduce risks of cesarean delivery and subsequent maternal obesity (2). However, a 1997 expert work group expressed “reservations that the recommendations for African-American women, young adolescents, and women of short stature were too specific” (6, p. 4). Both groups called for more research on the topic. Until recently, however, published papers have focused on effect modification of 1 outcome by a selected maternal characteristic (4, 7–9); this approach is limited because it does not simultaneously account for multiple outcomes.
In a recent paper, Nohr et al. (5) used a Danish cohort to investigate whether ideal GWG varied by parity, smoking, height, or age. They studied maternal recall of GWG 6 months postpartum relative to SGA birth, LGA birth, unplanned cesarean delivery, and maternal weight retention at 6 months postpartum. The authors reported that low GWG was associated with a lower risk of SGA birth among multiparous women versus primiparous women, while risk of postpartum weight retention was elevated with high gain in both groups. They concluded that multiparous women may benefit from gaining less weight during pregnancy. Inspection of curves for smokers, young women, and short women led the authors to argue that guidelines should not differ in these groups. Unlike the case in our analysis, the authors did not report tests for effect measure modification by any of the maternal characteristics of interest, calculate risk differences at different gains, or show confidence bands around risk curves. Furthermore, in drawing their conclusions, the investigators “placed great emphasis on the risk of an SGA birth” (5, p. 1293). In contrast, we used a composite measure comprising any adverse event, because consensus on how to weight these outcomes relative to one another is lacking, and the use of this composite prevented outcomes from being counted twice (e.g., a mother with an LGA birth who also had an unplanned cesarean delivery). Our results may also differ because we studied spontaneous preterm birth and indicated preterm birth and lacked data on postpartum weight retention.
Our study can only suggest associations; it cannot determine causality. Some randomized trials have proven that lifestyle interventions help women gain within the IOM-recommended GWG guidelines (1), yet their power to detect effects on birth outcomes is limited. Clearly, large intervention trials are needed to determine whether the GWG-adverse birth outcome associations are causal. A small sample size prevented us from studying young adolescents (age <16 years), who may be at especially high risk because their growth may be competing with that of the fetus (27). Our group of females aged 13–19 years was on average 17.7 years of age, and may have reached their growth potential. Prepregnancy weight and height were based on self-report, and women both under- and overreport these measures (28–30), which may lead to bias in the categorization of both BMI group and GWG (31).
While 78% of the patients who deliver at Magee have undergone a pregnancy-dating ultrasound by 20 weeks, we lacked data on factors (date of the last menstrual period, date of ultrasound, etc.) with which to determine the research gold standard definition of gestational age at delivery. Ultrasonography may systematically underestimate gestational age for small infants, leading to more of these babies being classified as preterm (32). If GWG causes fetal growth restriction before the dating ultrasound and these fetuses have their ages underestimated via ultrasound, this could lead to a spurious association between GWG and preterm birth. A better understanding of the extent to which first-trimester GWG influences fetal size at early ultrasound is needed to determine the extent to which this bias may be influencing our results. A low GWG-spontaneous preterm birth relation may also be induced if women delivering preterm had their weight gain systematically underestimated. This may arise because prenatal visits occur remotely from term less frequently in non-high-risk pregnancies, potentially leading to a larger discrepancy between their last measured prenatal weight and their actual weight at delivery. This bias may be less important for women with an indicated preterm birth because a prenatal visit is more likely to have occurred closer to the time of delivery.
Weight and height data were missing on 22% of our sample. Multiple imputation results agreed with those from the complete-case analysis, which suggests that selection bias was not a major problem. Our results may not be generalizable to all pregnant women in the United States, but we believe that given the size and racial diversity of the cohort, they are useful for similar tertiary-care populations. Our use of a delivery database with detailed clinical data and a GWG adequacy variable that attempted to control for confounding by gestational age and was based on a measured weight before delivery are major strengths. Moreover, assessing departures from additive effects also more directly allows for the evaluation of biologic synergy (11–14).
While it is clear that additional research is needed, we conclude that in this cohort of normal-weight women, tailoring GWG recommendations according to smoking status, race/ethnicity, parity, height, and age may not be necessary. Since fewer than half of all US pregnant women currently gain weight within the IOM-endorsed ranges (1), research is urgently needed to determine effective strategies for assisting women in meeting these recommendations.
Supplementary Material
Acknowledgments
Author affiliations: Department of Epidemiology, Graduate School of Public Health, University of Pittsburgh, Pittsburgh, Pennsylvania (Lisa M. Bodnar); Department of Obstetrics, Gynecology, and Reproductive Sciences, School of Medicine, University of Pittsburgh, Pittsburgh, Pennsylvania (Lisa M. Bodnar, Katherine P. Himes, Hyagriv N. Simhan); Magee-Womens Research Institute, Pittsburgh, Pennsylvania (Lisa M. Bodnar, Katherine P. Himes, Hyagriv N. Simhan); Department of Obstetrics and Gynaecology, Faculty of Medicine, University of British Columbia, Vancouver, British Columbia, Canada (Jennifer A. Hutcheon); Department of Pediatrics and Department of Epidemiology, Biostatistics and Occupational Health, Faculty of Medicine, McGill University, Montreal, Quebec, Canada (Robert W. Platt); and Division of Epidemiology, School of Public Health, University of California, Berkeley, Berkeley, California (Barbara Abrams).
This work was supported by the National Institutes of Health (grant K01 MH074092 to L. M. B.), the Canadian Institutes of Health Research (postdoctoral fellowship award to J. A. H.), and the Michael Smith Foundation for Health Research (research trainee award to J. A. H.). R. W. P. is a Chercheur-Boursier of the Fonds de la Recherche en Santé du Quebec (FRSQ) and is a member of the McGill University Health Centre Research Institute, which receives core funding from the FRSQ.
The authors thank Dr. Jay Kaufman for providing guidance with regard to absolute effect measures and tests of departure from additivity.
Conflict of interest: none declared.
Glossary
Abbreviations
- BMI
body mass index
- GWG
gestational weight gain
- IOM
Institute of Medicine
- LGA
large for gestational age
- MOMI
Magee Obstetric Medical and Infant
- SGA
small for gestational age
References
- 1.Institute of Medicine. Weight Gain During Pregnancy: Reexamining the Guidelines. Washington, DC: National Academies Press; 2009. National Academy of Sciences. [PubMed] [Google Scholar]
- 2.Institute of Medicine. Nutrition During Pregnancy. Washington, DC: National Academy Press; 1990. National Academy of Sciences. [Google Scholar]
- 3.Abrams BF, Laros RK., Jr Prepregnancy weight, weight gain, and birth weight. Am J Obstet Gynecol. 1986;154(3):503–509. doi: 10.1016/0002-9378(86)90591-0. [DOI] [PubMed] [Google Scholar]
- 4.Nielsen JN, O'Brien KO, Witter FR, et al. High gestational weight gain does not improve birth weight in a cohort of African American adolescents. Am J Clin Nutr. 2006;84(1):183–189. doi: 10.1093/ajcn/84.1.183. [DOI] [PubMed] [Google Scholar]
- 5.Nohr EA, Vaeth M, Baker JL, et al. Pregnancy outcomes related to gestational weight gain in women defined by their body mass index, parity, height, and smoking status. Am J Clin Nutr. 2009;90(5):1288–1294. doi: 10.3945/ajcn.2009.27919. [DOI] [PubMed] [Google Scholar]
- 6.Suitor CW. Maternal Weight Gain: A Report of an Expert Group. Arlington, VA: National Center for Education in Maternal and Child Health; 1997. [Google Scholar]
- 7.Caulfield LE, Stoltzfus RJ, Witter FR. Implications of the Institute of Medicine weight gain recommendations for preventing adverse pregnancy outcomes in black and white women. Am J Public Health. 1998;88(8):1168–1174. doi: 10.2105/ajph.88.8.1168. [DOI] [PMC free article] [PubMed] [Google Scholar]
- 8.Pickett KE, Abrams B, Selvin S. Maternal height, pregnancy weight gain, and birthweight. Am J Hum Biol. 2000;12(5):682–687. doi: 10.1002/1520-6300(200009/10)12:5<682::AID-AJHB13>3.0.CO;2-X. [DOI] [PubMed] [Google Scholar]
- 9.Groff JY, Mullen PD, Mongoven M, et al. Prenatal weight gain patterns and infant birthweight associated with maternal smoking. Birth. 1997;24(4):234–239. doi: 10.1111/j.1523-536x.1997.tb00596.x. [DOI] [PubMed] [Google Scholar]
- 10.Viswanathan M, Siega-Riz AM, Moos MK, et al. Outcomes of Maternal Weight Gain. (Evidence Report/Technology Assessment No. 168) Rockville, MD: Agency for Healthcare Research and Quality; 2008. (AHRQ publication no. 08-E009) [Google Scholar]
- 11.Rothman KJ, Greenland S, Walker AM. Concepts of interaction. Am J Epidemiol. 1980;112(4):467–470. doi: 10.1093/oxfordjournals.aje.a113015. [DOI] [PubMed] [Google Scholar]
- 12.Darroch J. Biologic synergism and parallelism. Am J Epidemiol. 1997;145(7):661–668. doi: 10.1093/oxfordjournals.aje.a009164. [DOI] [PubMed] [Google Scholar]
- 13.Rothman KJ, Greenland S, Lash TL, editors. Modern Epidemiology. 3rd ed. Philadelphia, PA: Lippincott Williams & Wilkins; 2008. [Google Scholar]
- 14.Rothman KJ. Epidemiology: An Introduction. New York, NY: Oxford University Press; 2002. [Google Scholar]
- 15.Bodnar LM, Simhan HN. The prevalence of preterm birth and season of conception. Paediatr Perinat Epidemiol. 2008;22(6):538–545. doi: 10.1111/j.1365-3016.2008.00971.x. [DOI] [PMC free article] [PubMed] [Google Scholar]
- 16.Bodnar LM, Siega-Riz AM, Simhan HN, et al. Severe obesity, gestational weight gain, and adverse birth outcomes. Am J Clin Nutr. 2010;91(6):1642–1648. doi: 10.3945/ajcn.2009.29008. [DOI] [PMC free article] [PubMed] [Google Scholar]
- 17.Physical status: the use and interpretation of anthropometry. Report of a WHO Expert Committee. World Health Organ Tech Rep Ser. 1995;854:1–452. [PubMed] [Google Scholar]
- 18.Bodnar LM, Siega-Riz AM, Arab L, et al. Predictors of pregnancy and postpartum haemoglobin concentrations in low-income women. Public Health Nutr. 2004;7(6):701–711. doi: 10.1079/phn2004597. [DOI] [PubMed] [Google Scholar]
- 19.Siega-Riz AM, Adair LS, Hobel CJ. Maternal underweight status and inadequate rate of weight gain during the third trimester of pregnancy increases the risk of preterm delivery. J Nutr. 1996;126(1):146–153. doi: 10.1093/jn/126.1.146. [DOI] [PubMed] [Google Scholar]
- 20.Hadlock FP, Harrist RB, Martinez-Poyer J. In utero analysis of fetal growth: a sonographic weight standard. Radiology. 1991;181(1):129–133. doi: 10.1148/radiology.181.1.1887021. [DOI] [PubMed] [Google Scholar]
- 21.Royston P. Multiple imputation of missing values: further update of ice, with an emphasis on categorical variables. Stata J. 2009;9(3):466–477. [Google Scholar]
- 22.Sterne JA, White IR, Carlin JB, et al. Multiple imputation for missing data in epidemiological and clinical research: potential and pitfalls. BMJ. 2009;338 doi: 10.1136/bmj.b2393. :b2393. doi: 10.1136/bmj.b2393. [DOI] [PMC free article] [PubMed] [Google Scholar]
- 23.Rothman KJ. Synergy and antagonism in cause-effect relationships. Am J Epidemiol. 1974;99(6):385–388. doi: 10.1093/oxfordjournals.aje.a121626. [DOI] [PubMed] [Google Scholar]
- 24.Rothman KJ. The estimation of synergy or antagonism. Am J Epidemiol. 1976;103(5):506–511. doi: 10.1093/oxfordjournals.aje.a112252. [DOI] [PubMed] [Google Scholar]
- 25.Skrondal A. Interaction as departure from additivity in case-control studies: a cautionary note. Am J Epidemiol. 2003;158(3):251–258. doi: 10.1093/aje/kwg113. [DOI] [PubMed] [Google Scholar]
- 26.Zou GY. On the estimation of additive interaction by use of the four-by-two table and beyond. Am J Epidemiol. 2008;168(2):212–224. doi: 10.1093/aje/kwn104. [DOI] [PubMed] [Google Scholar]
- 27.Scholl TO, Hediger ML. A review of the epidemiology of nutrition and adolescent pregnancy: maternal growth during pregnancy and its effect on the fetus. J Am Coll Nutr. 1993;12(2):101–107. doi: 10.1080/07315724.1993.10718289. [DOI] [PubMed] [Google Scholar]
- 28.Brunner Huber LR. Validity of self-reported height and weight in women of reproductive age. Matern Child Health J. 2007;11(2):137–144. doi: 10.1007/s10995-006-0157-0. [DOI] [PubMed] [Google Scholar]
- 29.Gorber SC, Tremblay M, Moher D, et al. A comparison of direct vs. self-report measures for assessing height, weight and body mass index: a systematic review. Obes Rev. 2007;8(4):307–326. doi: 10.1111/j.1467-789X.2007.00347.x. [DOI] [PubMed] [Google Scholar]
- 30.Kuczmarski MF, Kuczmarski RJ, Najjar M. Effects of age on validity of self-reported height, weight, and body mass index: findings from the Third National Health and Nutrition Examination Survey, 1988–1994. J Am Diet Assoc. 2001;101(1):28–34. doi: 10.1016/S0002-8223(01)00008-6. ; quiz 35–36. [DOI] [PubMed] [Google Scholar]
- 31.Bodnar LM, Siega-Riz AM, Simhan HN, et al. The impact of exposure misclassification on associations between prepregnancy BMI and adverse pregnancy outcomes. Obesity (Silver Spring) 2010;18(11):2184–2190. doi: 10.1038/oby.2010.25. [DOI] [PMC free article] [PubMed] [Google Scholar]
- 32.Yang H, Kramer MS, Platt RW, et al. How does early ultrasound scan estimation of gestational age lead to higher rates of preterm birth? Am J Obstet Gynecol. 2002;186(3):433–437. doi: 10.1067/mob.2002.120487. [DOI] [PubMed] [Google Scholar]
Associated Data
This section collects any data citations, data availability statements, or supplementary materials included in this article.