Abstract
Motivation: A key element in understanding the aging of Caenorhabditis elegans is objective quantification of the morphological differences between younger and older animals. Here we propose to use the image texture entropy as an objective measurement that reflects the structural deterioration of the C.elegans muscle tissues during aging.
Results: The texture entropy and directionality of the muscle microscopy images were measured using 50 animals on Days 0, 2, 4, 6, 8, 10 and 12 of adulthood. Results show that the entropy of the C.elegans pharynx tissues increases as the animal ages, but a sharper increase was measured between Days 2 and 4, and between Days 8 and 10. These results are in agreement with gene expression findings, and support the contention that the process of C.elegans aging has several distinct stages. This can indicate that C.elegans aging is driven by developmental pathways, rather than stochastic accumulation of damage.
Availability: The image data are freely available on the Internet at http://ome.grc.nia.nih.gov/iicbu2008/celegans, and the Haralick and Tamura texture analysis source code can be downloaded at http://ome.grc.nia.nih.gov/wnd-charm.
Contact: shamirl@mail.nih.gov
1 INTRODUCTION
While aging is one of the most prevalent biological processes in nature, little is yet known about the mechanisms that affect or cause aging. To effectively study the process of aging, it is required to be able to objectively quantify the age of the studied organism. While the chronological age of an organism is trivial to measure, it provides a weak link to the actual physiological age. Therefore, a quantitative method that can objectively measure the physiological age is required.
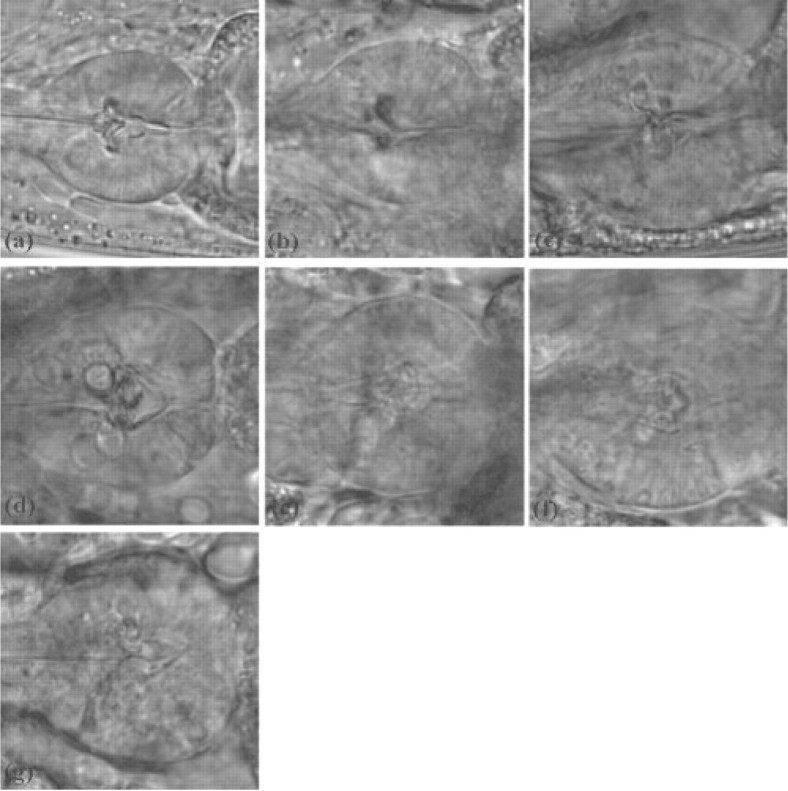
Caenorhabditis elegans is a powerful model for the study of aging (Golden and Melov, 2006). One of the primary advantages of C.elegans as an experimental organism is that during its lifespan of 2–3 weeks, the functional and morphological aging of the muscle tissues can be easily observed through a microscope. These changes can be noticed when observing the pharynx terminal bulb of the C.elegans. Figure 1 shows typical images of the terminal bulb in Days 0, 2, 4, 6, 8, 10 and 12 of adulthood, taken using differential interference contrast (DIC) microscopy with a 40 × objective.
Fig. 1.
Microscopy images of the terminal bulb of C.elegans in (a) Day 0, (b) Day 2, (c) Day 4, (d) Day 6, (e) Day 8, (f) Day 10 and (g) Day 12 of adulthood.
Clearly, the process of aging is accompanied by a noticeable and obvious functional decline, which is particularly reflected by the loss of muscle mass. As Figure 1 shows, in Days 2 and 0, the terminal bulb is noticeably more structured than in Days 10 and 12, where the muscle tissues deteriorate and the entropy increases. The process of muscle mass loss is referred to as sarcopenia. The cause for the structural and functional decline of the C.elegans pharynx and terminal bulb is yet unknown (Wolkow, 2006).
Some attempts have been made to manually score muscle tissue morphology in order to quantify aging (Garigan et al., 2002; Helfrich et al., 2007; Herndon et al., 2002). However, manual scoring of muscle tissues is subjected to the bias introduced by the human decision making, and is limited by what the human eye can perceive. Moreover, even in cases where the unaided human eye can tell between a young and an older muscle tissue, it becomes highly difficult for a person to measure the differences in a quantitative fashion.
A more recent attempt to quantify aging applied an image classifier that utilized several hundreds distinct image features working in concert, and weighted by their statistical discrimination power such that the chronological age was used as the gold standard (Johnston et al., 2008). That experiment showed that the C.elegans pharynx proceeds through several distinct stages during aging.
A different approach to study the process of aging used DNA microarrays to monitor the expression of age-regulated genes (Budovskaya et al., 2008), indicating that the process of aging is driven by developmental pathways rather than accumulation of damage.
Here we propose to quantify the process of the muscle tissue structural deterioration by measuring the texture entropy using microscope images of the C.elegans pharynx. This method can be used to show that distinct states that have been observed by DNA microarray experiments are in agreement with the muscle tissue deterioration reflected by the texture entropy of C.elegans microscopy images. This finding supports the contention that the aging of C.elegans has several distinct states, which are separated by periods of rapid aging.
2 METHODS
The entropy of the images was quantified by using the Haralick texture features (Haralick et al., 1973). The key element of the Haralick features is the gray-level co-occurrence matrix. In the co-occurrence matrix, the entry i,j of the co-occurence matrix Md is the number of occurrences of gray levels i and j such that the distance between them is d pixels. The co-occurrence matrix is described by Equation (1).
| (1) |
where (r, s), (t, v)∈ N × N and (t, v)=(r+dx, s+dy).
The co-occurrence matrix can be used to compute useful texture features (Haralick et al., 1973). In this study, we use the Haralick texture entropy, which quantitatively measures the randomness of the gray-level distribution, and defined by ∑i∑jMd(i,j)logMd(i,j). In the images taken at different time points shown in Figure 1, it can be noticed that the terminal bulb generally becomes less structured and more chaotic as the worm gets older. Therefore, the quantitative measurement of the Haralick texture entropy can reflect the decline of the muscle tissues of the terminal bulb that can be visually observed by using a microscope. In all experiments d was set to 1, and the dynamic range was reduced into 255 gray levels. The implementation of the Haralick texture analysis used for the experiment was taken from the work of Murphy et al. (2001), and is available also as part of the wndchrm image analysis tool (Shamir et al., 2008a).
Another measurement that was used in this study is the directionality element of the Tamura texture (Tamura et al., 1978). The Tamura features reflect textures in a numerical fashion that is based on the human perception, and consist of three primary descriptors, which are the contrast, coarseness and directionality. Coarseness refers to texture granularity, reflected by the size and number of texture primitives. A coarse texture contains a small number of large primitives, while a fine texture contains a large number of small primitives. Contrast refers to the difference in intensity among neighboring pixels. A texture of high contrast has large difference in intensity among neighboring pixels, while a texture of low contrast has small difference. A detailed description of the Tamura texture can be found in Lin et al. (2003) and Tamura et al. (1978).
In this study, we use the directionality element of the Tamura texture, which is a global property of a region that reflects the placement of the texture primitives. A directional texture, in that sense, has one or more recognizable orientations of primitives, while an isotropic texture has no recognizable orientation of its primitives. The directionality can be computed by Equation (2),
| (2) |
where HD is the local direction histogram computed using the Sobel edge operator (Duda and Hart, 1973), np is the number of peaks of HD, ϕp is the p−th peak position of HD and wp is the range of the p-th peak between valleys. In this study, the number of bins for the local direction histogram is 125.
Texture measurement of digital images is a well-studied field, and numerous methods, such as the commonly used Gabor textures (Gabor, 1946), have been proposed. While it can be reasonably assumed that other texture analysis methods can also be informative for this task, we chose to use the Haralick entropy and Tamura directionality, which are intuitive descriptors of the texture structuredness in digital images.
As can be noticed in Figure 1, the straight lines that can be visually seen crossing the terminal bulb become less noticeable as the worm ages, and can barely be seen at all on Day 12. Therefore, the directionality of the texture is expected to change gradually as the C.elegans gets older, reflecting the decline of the muscle tissues in each time point.
The image dataset used for the experiment was acquired by using DIC microscopy and a 40× objective. The dataset included images of the pharynx region of the worms collected at different ages of Days 0, 2, 4, 6, 8, 10 and 12 of adulthood. For each worm, the stage of the microscope was rotated to maintain the same relative orientation in all images. To facilitate production of age-synchronized populations, the worms used in this study carried the fem-1(hc17) mutation blocking spermatogenesis. A detailed description about the images can be found in Johnston et al. (2008), and the dataset can be downloaded freely as part of the IICBU-2008 benchmark suite (Shamir et al., 2008b).
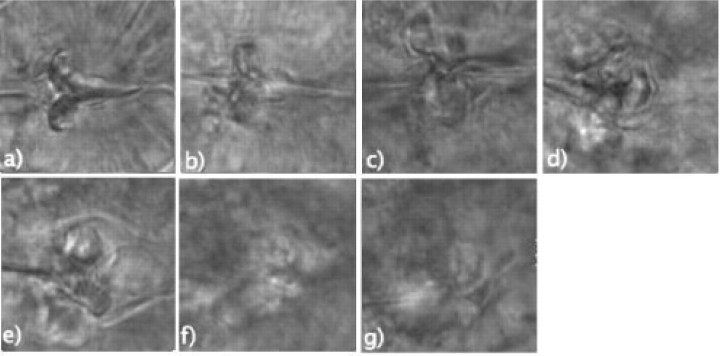
Haralick texture entropy and Tamura texture directionality were computed from a set of 140 × 140 16-bit TIFF images of the center of the C.elegans terminal bulb, such that 50 different images (each image from a different animal) were used in each time point. The center of each terminal bulb in the image was determined manually, and provided a uniform set of terminal bulb center images. Figure 2 shows typical images used in this study, and their computed Haralick entropy and Tamura directionality values.
Fig. 2.
Microscope images of the center of the C.elegans terminal bulb in (a) Day 0 (entropy = 1291 directionality = 7.36), (b) Day 2 (entropy = 1297 directionality = 7.34), (c) Day 4 (entropy = 1338 directionality = 7.07), (d) Day 6 (entropy = 1340 directionality = 7.07), (e) Day 8 (entropy = 1346 directionality = 7.04), (f) Day 10 (entropy = 1420 directionality = 6.75) and (g) Day 12 (entropy = 1431 directionality = 6.68).
3 RESULTS
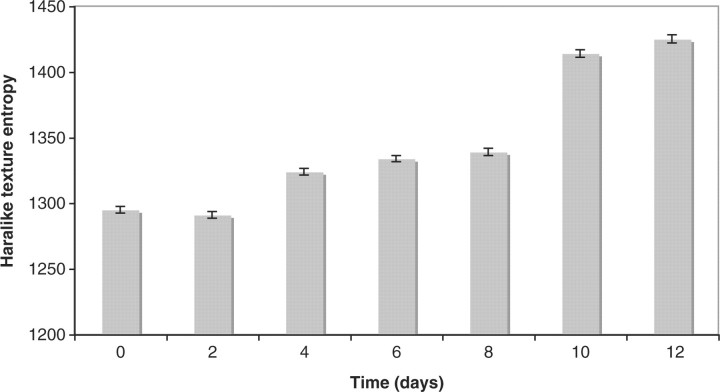
Figure 3 shows the mean and SE of the Haralick texture entropy computed from the terminal bulb images taken on different days of adulthood. The graph is based on measurements from 50 animals in each time point. As the graph shows, the Haralick texture entropy increases with age, indicating that the terminal bulb becomes less structured and more chaotic as the animal ages. The Pearson correlation between the measured texture entropy and the chronological age is ∼0.69 (P<0.001).
Fig. 3.
Haralick texture entropy (50 animals) measured using the terminal bulb in Days 0, 2, 4, 6, 8, 10 and 12 of adulthood. One leap is noticeable between Days 2 and 4, and another leap between Days 8 and 10. The plateau between the two leaps indicate that the muscle decline is slower during that time.
As can be learned from the graph, while the time difference between each pair of neighboring time-points is constant, it is clear that the measured entropy does not increase linearly to the worm age. Clearly, a leap can be noticed between Days 2 and 4, and a larger leap between Days 8 and 10. Days 4–6, and 10–12 show just minor entropy differences, indicating that the C.elegans muscle decline is slower during these periods.
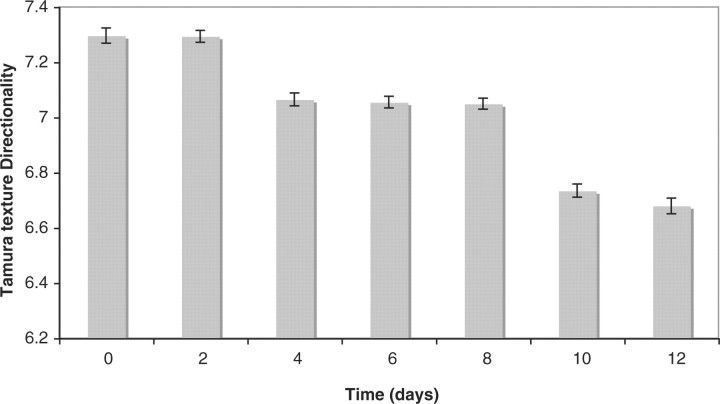
Figure 4 shows the mean of the Tamura texture directionality across the different ages. As before, the values were computed using images of 50 animals for each chronological age. Clearly, the Tamura texture directionality decreases as the worm gets older, showing that the texture of the terminal bulb becomes more sparse in time. The Pearson correlation between the measured Tamura directionality and the chronological age is ∼−0.67 (P<0.001). The Tamura texture directionality increases consistently, but shows two noticeable leaps: one between Days 2 and 4, and another between Days 8 and 10.
Fig. 4.
Tamura texture directionality (50 animals) measured using the terminal bulb in Days 0, 2, 4, 6, 8, 10 and 12 of adulthood.
4 DISCUSSION
Here we used the Haralick texture entropy and the Tamura texture directionality to analyze the structural deterioration of the muscle tissues, which can be noticed using DIC microscope images of the C.elegans pharynx. These measurements show that the entropy of the image texture increases as the animal gets older, but the rate of the increase is not constant throughout the life of the animal. The experiments revealed two major leaps in the structural deterioration of the muscles, one between Days 2 and 4, and the other between Days 8 and 10 of adulthood.
Recent experiments using DNA microarrays suggest that the expression of elt-5, which is responsible for the expression of a large number of age-regulated genes, changes during aging in a non-linear fashion (Budovskaya et al., 2008). The change in the expression of elt-5::Cherry reporter in the head of the animal throughout aging is different than the expression in the trunk. The terminal bulb of the C.elegans is located in the head, and therefore the expression of elt-5 in the head of the worm is the relevant measurement that the terminal bulb muscle entropy should be compared against.
As reported by Budovskaya et al. (2008), the expression of elt-5:cherry reporter in the head of the C.elegans is upregulated between Days 2 and 5, which corresponds to the leap found in this study between Days 2 and 4. A sharper upregulation of elt-5 is also noticeable between Days 7 and 10. This finding is in agreement with the sharper leap of the measured texture entropy between Days 8 and 10. The expression remains steady in Days 5–7, which corresponds to the negligible increase in the texture entropy during Days 4–8.
The expression of elt-3::GFP reporter in the head of wild-type worms generally decreases as the C.elegans ages, but a deregulation of the gene is noticeable between Days 2 and 5, and between Days 9 and 12, while the expression in Days 7–9 is nearly identical (Budovskaya et al., 2008). These findings are also in agreement with the measurements of the texture entropy of the C.elegans terminal bulb. It should be noted, however, that elt-3 expression deregulates also between Days 5 and 7. This deregulation of the expression of elt-3:GFP reporter does not have a corresponding increase in texture entropy of the terminal bulb during that period of the life of the C.elegans.
The agreement between the texture directionality and entropy and the age-regulated gene expression indicates that the same distinct stages of the C.elegans aging that were deduced using DNA microarray experiments can also be identified by quantitative analysis of the tissue microscopy images of the worms.
While in many age-regulated gene studies, the age is measured by the chronological age (Golden et al., 2006; Lund et al., 2002; McColl et al., , 2008), the day of adulthood is not necessarily an accurate indication of the physiological age of the animal. Since the texture entropy reflects age-related physiological changes, it is not unlikely that using the texture entropy instead of the chronological age can lead to a more accurate analysis of age-regulated genes.
A widely held contention is that aging is a process driven by accumulated environmental damage, and there is evidence that damage accumulation such as oxidative damage (Lu et al., 2004), protein glycation (Ulrich and Cerami, 2001) and inflammation (McGeer and McGeer, 2004) is related to aging in mammals. However, some organisms, such as Homaridae (lobsters), can live hundreds of years without showing any signs of decline that are typical to aging, observed in other closely related organisms that live in a similar environment (Guerin, 2007). In worms, there is no convincing evidence that the environmental damage can lead to conditions that have been associated with aging, such as the chronic induction of the stress responses (Lund et al., 2002).
A different approach to aging is that the process is controlled by developmental pathways (Kirkwood and Rose, 1991; Williams, 1957). By measuring the alteration in the image texture entropy that noticeably changes throughout aging, we can identify several distinct states, separated by periods of rapid progression of aging. These findings are in agreement with age-regulated gene expression experiments, and indicate that the aging of C.elegans can be driven by developmental pathways rather than damage accumulation.
It should be noted, however, that the contention that developmental pathways run an ‘aging program’ in C.elegans is controversial, and conflicting conclusions have been reported. For instance, Golden et al. (2008) studied whole-genome expression profiles of wild-type C.elegans throughout their entire life span, and showed that gene expression changed gradually with the chronological and physiological (behavior) age. That work concluded that while the physiological age could be predicted using the expression of a large set of genes, no single gene could be reliably used as an aging biomarker, and after the age of 15 days gene expression profiles became more similar to each other and could not distinguish between younger and older animals.
Caenorhabditis elegans are physiologically very different from mammals, and therefore similar distinct stages of aging are not necessarily expected in humans based on these findings. However, some human aging researchers have proposed the contention that the human health shifts along a path of distinct states (Ferrucci et al., 2008). Age-regulated gene expression in the cortex and medulla of the human kidney show similar aging profiles, suggesting that the aging of the kidney is controlled by biological mechanisms and pathways (Rodwell et al., 2004). Clinical indicators such as motor unit characteristics (size and firing rate) provide evidence of a more rapid process of decline during the sixth decade of life (Ling et al., 2009). While it is yet unknown whether these changes precede, follow or occur concurrent to age-related modifications in muscle structure, it leaves the possibility that aging in humans does not progress at a constant rate throughout life, and that there are certain periods in life in which aging is more rapid.
Funding: Intramural Research Program of the National Institutes of Health, National Institute on Aging.
Conflict of Interest: none declared.
REFERENCES
- Budovskaya YV, et al. An elt-3/elt-5/elt-6 GATA transcription circuit guides aging in C.elegans. Cell. 2008;134:291–303. doi: 10.1016/j.cell.2008.05.044. [DOI] [PMC free article] [PubMed] [Google Scholar]
- Duda R, Hart P. Pattern Classification and Scene Analysis. New York, NY: John Wiley and Sons; 1973. pp. 271–272. [Google Scholar]
- Ferrucci L, et al. Mapping the road to resilience: novel math for the study of frailty. Mech. Ageing Dev. 2008;129:677–679. doi: 10.1016/j.mad.2008.09.007. [DOI] [PMC free article] [PubMed] [Google Scholar]
- Gabor D. Theory of Communication. J. IEEE. 1946;93:429–457. [Google Scholar]
- Garigan D, et al. Genetic analysis of tissue aging in Caenorhabditis elegans: a role for heat-shock factor and bacterial proliferation. Genetics. 2002;161:1101–1112. doi: 10.1093/genetics/161.3.1101. [DOI] [PMC free article] [PubMed] [Google Scholar]
- Golden TR, Melov S. The C.elegans Research Community (ed.) WormBook. 2006. Gene expression changes associated with aging in C.elegans. http://www.wormbook.org. [DOI] [PMC free article] [PubMed] [Google Scholar]
- Golden TR, et al. Microarray analysis of variation in individual aging C.elegans: approaches and challenges. Exp. Gerontol. 2006;10:1040–1045. doi: 10.1016/j.exger.2006.06.034. [DOI] [PubMed] [Google Scholar]
- Golden TR, et al. Age-related behaviors have distinct transcriptional profiles in Caenorhabditis elegans. Aging Cell. 2008;7:850–865. doi: 10.1111/j.1474-9726.2008.00433.x. [DOI] [PMC free article] [PubMed] [Google Scholar]
- Guerin JC. Emerging area of aging research: long-lived animals with negligible senescence. Ann. N. Y. Acad. Sci. 2007;1019:518–520. doi: 10.1196/annals.1297.096. [DOI] [PubMed] [Google Scholar]
- Helfrich YR, et al. Effect of smoking on aging of photoprotected skin: evidence gathered using a new photonumeric scale. Arch. Dermatol. 2007;143:397–402. doi: 10.1001/archderm.143.3.397. [DOI] [PubMed] [Google Scholar]
- Herndon LA, et al. Stochastic and genetic factors influence tissue-specific decline in ageing C.elegans. Nature. 2002;419:808–814. doi: 10.1038/nature01135. [DOI] [PubMed] [Google Scholar]
- Haralick RM, et al. Textural features for image classification. IEEE Trans. Syst. Man, Cybern. 1973;6:269–285. [Google Scholar]
- Johnston J, et al. Quantitative image analysis reveals distinct structural transitions during aging in Caenorhabditis elegans tissues. PLoS ONE. 2008;3:e2821. doi: 10.1371/journal.pone.0002821. [DOI] [PMC free article] [PubMed] [Google Scholar]
- Kirkwood TB, Rose MR. Evolution of senescence: late survival sacrificed for reproduction. Philos. Trans. Biol. Sci. 1991;332:15–24. doi: 10.1098/rstb.1991.0028. [DOI] [PubMed] [Google Scholar]
- Lin HC, et al. Finding textures by textual descriptions, visual examples, and relevance feedbacks. Pattern Recognit. Lett. 2003;24:2255–2267. [Google Scholar]
- Ling SM, et al. Age-associated changes in motor unit physiology: observations from the Baltimore Longitudinal Study of Aging. Arch. Phys. Med. Rehab. 2009;90:1237–1240. doi: 10.1016/j.apmr.2008.09.565. [DOI] [PMC free article] [PubMed] [Google Scholar]
- Lu T, et al. Gene regulation and DNA damage in the ageing human brain. Nature. 2004;429:883–891. doi: 10.1038/nature02661. [DOI] [PubMed] [Google Scholar]
- Lund J, et al. Transcriptional profile of aging in C.elegans. Curr. Biol. 2002;12:1566–1573. doi: 10.1016/s0960-9822(02)01146-6. [DOI] [PubMed] [Google Scholar]
- McColl G, et al. Pharmacogenetic analysis of lithium-induced delayed aging in Caenorhabditis elegans. J. Biol. Chem. 2008;283:350–357. doi: 10.1074/jbc.M705028200. [DOI] [PMC free article] [PubMed] [Google Scholar]
- McGeer PL, McGeer EG. Inflammation and the degenerative disease of aging. Ann. N. Y. Acad. Sci. 2004;1035:104–116. doi: 10.1196/annals.1332.007. [DOI] [PubMed] [Google Scholar]
- Murphy RF, et al. Proceedings of the 2nd IEEE International Symposium on Bioinformatics and Biomedical Engineering. Bethesda, MD: 2001. Searching online journals for fluorescence microscopy images depicting protein subcellular location patterns; pp. 119–128. [Google Scholar]
- Rodwell GE, et al. A transcriptional profile of aging in the human kidney. PLoS Biol. 2004;2:e427. doi: 10.1371/journal.pbio.0020427. [DOI] [PMC free article] [PubMed] [Google Scholar]
- Shamir L, et al. Wndchrm - an open source utility for biological image analysis. BMC Source Code Biol. Med. 2008a;3:13. doi: 10.1186/1751-0473-3-13. [DOI] [PMC free article] [PubMed] [Google Scholar]
- Shamir L, et al. IICBU-2008 - a proposed benchmark suite for biological image analysis. Med. Biol. Eng. Comput. 2008b;46:943–947. doi: 10.1007/s11517-008-0380-5. [DOI] [PMC free article] [PubMed] [Google Scholar]
- Tamura H, et al. Textural features corresponding to visual perception. IEEE Trans. Syst., Man and Cybern. 1978;8:460–472. [Google Scholar]
- Ulrich P, Cerami A. Protein glycation, diabetes, and aging. Recent Prog. Horm. Res. 2001;56:1–21. doi: 10.1210/rp.56.1.1. [DOI] [PubMed] [Google Scholar]
- Williams GC. Pleiotropy, natural selection, and the evolution of senescence. Evolution. 1957;11:398–411. [Google Scholar]
- Wolkow CA. Identifying factors that promote functional aging in Caenorhabditis elegans. Exp. Gerontol. 2006;41:1001–1006. doi: 10.1016/j.exger.2006.06.033. [DOI] [PubMed] [Google Scholar]


