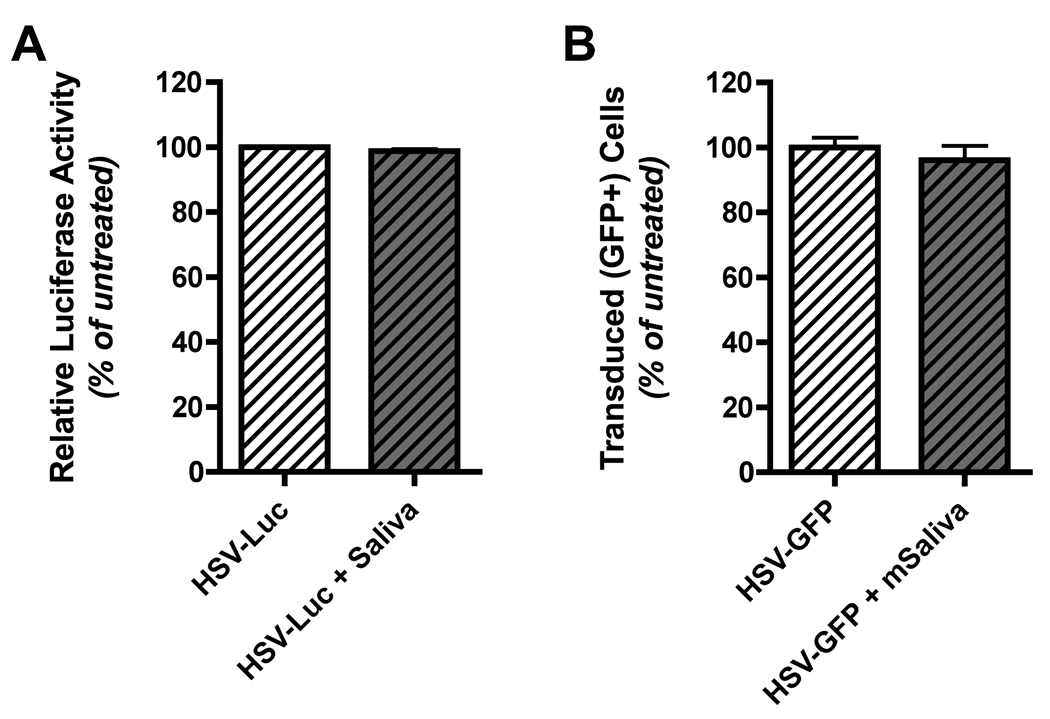
Figure 3. Saliva does not inactivate HSV-1 amplicon particles.
(A) A HSV-1 amplicon vector encoding luciferase was suspended in DMEM medium without FBS and incubated with an equal volume of whole unstimulated human saliva at 37°C for 30 minutes. Following incubation, complete DMEM (containing 10% FBS plus antibiotics) was added and the mixture was then added to HEK 293A cells. Twenty-four hours later the 293A cells were washed with PBS, lysed with passive lysis buffer (Promega), centrifuged at 13,000 RPM for 10 minutes to remove cell debris, and then the lysate was directly used to quantitate luciferase expression. Luciferase expression levels in cells exposed to control virus stocks (not incubated with saliva) was assigned a level of 100%, and luciferase levels in cells exposed to saliva-treated virus stocks was calculated as a percentage of this baseline. The results shown represent mean normalized luciferase expression data (% of baseline relative light units; RLU) from virus samples that were incubated with each of four different human saliva samples; error bars denote the standard error of the mean. (B) A HSV-1 amplicon vector encoding GFP was used to conduct an experiment analogous to that described for panel A. In this case, the vector was preincubated with pooled, pilocarpine-stimulated whole mouse saliva (collected from three female BALB/c mice). 24 hours following addition of control or saliva-treated vector to 293A cell cultures, the cells were collected and analyzed by flow cytometry. The percentage of GFP positive cells in cultures exposed to control virus stocks (not incubated with saliva) was assigned a level of 100%, and the transduction efficiency in cells exposed to saliva-treated virus stocks was calculated as a percentage of this baseline. The results shown represent the mean normalized transduction efficiency data calculated from four replicates; error bars denote the standard error of the mean.

