Abstract
In recent years, experimental evidence has accumulated that supports the existence of sublinear dose-response relationships at low doses of DNA reactive mutagens. However, creating the in vivo data necessary to allow for a more detailed dose-response modeling with the currently available tools might not always be practical. The purpose of the current work was to evaluate the utility of the Pig-a gene mutation assay to rapidly identify dose response relationships for direct acting genotoxicants. The induction of mutations in the peripheral blood of rats was evaluated following 28 days of exposure down to low doses of the direct acting alkylating agents ethyl methane sulfonate (EMS) and ethylnitrosourea (ENU). Using statistical modeling based on the 28-day studies, a threshold for mutation induction for EMS was estimated to be 21.9 mg/kg, whereas for the more potent ENU the threshold was estimated to be 0.88 mg/kg. Comparing mutation frequencies from acute and sub-chronic dosing indicated less than additive dose-response relationships, further confirming the possibility of a thresholded dose-response relationship for both compounds. In conclusion, the work presented provides evidence that the Pig-a assay might be a practical alternative to other in vivo mutation assays when assessing dose-response relationships for direct acting mutagens and that an experimental approach using fractionated dosing could be used to substantiate a biological mechanism responsible for the observation of a sub-linear dose-response relationship.
Keywords: Ethyl Methanesulfonate, Ethylnitrosourea, Point Mutation, Rats, Dose-response, RETs
Introduction
The dose-response relationship associated with the genotoxic and carcinogenic effects of a compound that directly interacts with DNA has been thought to be linear, even with very low doses of a genotoxic agent inducing increases in mutations in a strictly additive fashion. An underlying assumption associated with this hypothesis is that DNA repair capabilities, detoxification pathways and other forms of protection all function in a linear manner regardless of the burden of exposure and associated DNA damage. The conservative assumptions underlying a linear dose-response relationship are the basis of the threshold of toxicological concern (TTC) which has been recommended by the Committee for Medicinal Products for Human Use (CHMP) as an allowable exposure limit for a genotoxic impurity in a drug substance [1]. This daily lifetime limit of 1.5 μg/day is expected to pose a negligible excess cancer risk to patients. The TTC was derived by linearly extrapolating carcinogenic effects determined at high (and often toxic) doses to derive a dose of a genotoxic substance associated with an excess lifetime cancer risk of 1 × 10⁻⁵.
However, recent studies suggest that low doses of direct acting genotoxic agents may exhibit a sub-linear dose response and a threshold below which no increase in genotoxicity is observed [2-7]. Of greatest interest to the current work are a number of recent investigations that provide convincing evidence for a non-linear dose-response for the genotoxic effects of the alkylating agent ethyl methane sulfonate (EMS). Observation of a threshold dose for EMS induced genotoxicity has been reported from in vitro studies [2] and compelling evidence of an in vivo threshold for EMS induced genotoxicity (25 mg/kg/day) has been reported based on elaborate dose-response investigations in mice [3, 4]. The primary purpose of these in vivo studies was to support a risk assessment for patients who ingested EMS as a contaminant in Viracept tablets [8]. The design of the studies was robust in that there were many dose groups near the anticipated threshold dose, seven animals were included per dose group (larger than typical) and multiple tissues were evaluated for mutagenicity. Further, ethylvaline adducts of hemoglobin were measured to assess exposure in the animals. Profound increases in adducts were observed at low doses of EMS which showed no evidence of genotoxicity, indicating that DNA repair (or some other protective mechanism) was preventing the induction of mutations. Additional evidence in support of a threshold was observed by comparing the mutagenic response observed in animals treated for 28 days with low doses of EMS to animals exposed to acute high doses of EMS. Whereas a high acute dose of EMS (350 mg/kg) induced an increase in mutations, fractionating the same dose of EMS over 28 days (12.5 mg/kg/day) completely abolished the mutagenic effect [3, 4].
The data generated for these recent in vivo studies was also used to derive a compound specific permissible daily exposure (PDE) limit for EMS as a genotoxic impurity in a drug substance [9]. Prior to these investigations there was insufficient data to derive a PDE for EMS, and therefore the TTC limit (1.5 μg/day) would need to be applied. Based on the approach recommended in the CHMP guideline for establishing exposure limits for genotoxic impurities with sufficient evidence of a threshold [1], the investigators utilized the procedure outlined in ICH Q3C Guidance on Residual Solvents [10] to derive a PDE of 104 μg/day for EMS.
In theory, the notion of utilizing experimental data to establish allowable limits for genotoxic impurities in pharmaceuticals is very attractive. Data driven decision making rather than pragmatic decision making (current TTC approach) would focus lowest level impurity control and measurement to those compounds presenting the greatest risk to human health. The challenge is to find a way to generate the necessary data in a manner that can be practically applied and implemented. The scope of the in vivo work recently reported for EMS would not be practical to generate on a routine basis during the normal course of drug development.
Recently, a flow cytometric Pig-a assay for measuring gene mutation in the RBCs of rats has been developed [11, 12]. The endogenous gene, phosphatidylinositol glycan complementation group A (Pig-a) codes for a cytoplasmic member anchor protein that holds proteins to the surface of cells. In this assay, RBCs with mutant Pig-a are readily differentiated from wild type cells by fluorescent labeling of CD59. Whereas wild type cells are labeled with CD59 antibody, mutant cells, deficient in anchor proteins remain unlabeled. The assay has several attributes which make it attractive as a potential tool to characterize dose-response relationships associated with genotoxic substances. First, it has been suggested that mutations induced in long-lived hematopoietic precursor cells persist and allow for the detection of an accumulation of mutations in the peripheral blood cells with repeat dosing [13, 14]. Therefore, even weak mutagens or weakly mutagenic exposures should be detected with repeat dosing. Further, the assessment of mutation induction in peripheral blood cells allows an investigator to serially sample animals before, during and after exposure. Doing so allows one to characterize the relationship between accumulating dose and mutant frequency. Finally, in comparison to in vivo transgenic mutation assays, the Pig-a assay does not require use of costly animals, and both sample preparation and quantitation of mutants is much simpler and faster.
The purpose of the current work was to evaluate the utility of the Pig-a assay to rapidly differentiate linear and sub-linear dose-response relationships for direct acting genotoxic agents. Dose-response relationships were characterized for two alkylating agents, EMS and ethylnitrosourea (ENU) and evaluated for linearity. Furthermore, the frequency of Pig-a mutants induced from high acute doses were compared to that induced in animals treated with lower doses for 28 days. Comparison of the mutant frequencies induced from equivalent cumulative exposures should allow one to determine if some process (e.g. DNA repair) is more effective at preventing mutation induction at low doses, and if so, substantiate that an underlying biological mechanism is responsible for the observation of a sub-linear dose-response curve.
1. Methods
Reagents
Ethyl methanesulfonate (EMS, CAS No. 62-50-0), N-ethyl-N-nitrosourea (ENU; CAS. No. 759-73-9, 62% activity) and PBS (Sigma-Aldrich) were purchased from Sigma-Aldrich and distilled water was purchase from Gibco Inc. EMS, a liquid, was formulated daily in distilled water and ENU was formulated in PBS (pH=6.0; the amount of water and stabilizer in the ENU preparation were taken into account when calculating the concentrations). Anticoagulant, balanced salt solution, anti-CD59-phychoerythrin, and SYTO® 13 dye were supplied as Prototype MutaFlow® Pig-a Mutation Assay Kits by Litron Laboratories, Rochester, N. Y.
Animals
6-8 week old male Sprague-Dawley (Crl:CD[SD]) male rats, (∼150-200 grams) from Charles River were used in all experiments. The animals received pelleted certified rodent diet and were provided purified municipal drinking water ad libitum. Animals were housed individually in hanging polycarbonate shoe box cages in a room with relative humidity of 50 ± 20%, temperatures of 70 ± 5° F and a 12 hour light/dark cycle. All animal care and experimental procedures were conducted in compliance with the U.S. Animal Welfare Act and the ILAR guide (1996).
Dose Levels and Treatment Schedule
Initial dose levels and route of administration were selected based on literature information on the maximum tolerate dose (MTD) for the compound. All treatments in all studies were administered by oral gavage in a dose volume of 10 ml/kg. A summary of all studies in this manuscript including dose levels, treatment durations and blood collection are presented in Table 1.
Table 1. Summary of studies conducted.
| Study | Rats per Group | Dose Levels (mg/kg) | Treatment Duration (days) | Blood Collection Times |
|---|---|---|---|---|
| EMS 28 Day Study | 5 | 0, 6.25, 12.5, 25, 50 , 100 | 28 | Day -1, 15, 29, 55 |
| EMS Single Dose Study | 5* | 0, 100, 175, 350, 700 | 1 | Day -1, 15, 29 & 57 |
| ENU 1st 28 Day Study | 5 | 0, 2.5, 5, 10 | 28 | Day -1, 15, 31 & 57 |
| ENU 2nd 28 Day Study | 5 | 0, 0.043, 0.25, 1, 15 | 28 | Day -1, 15, 29 & 57 |
| ENU Single Dose Study | 5 | 0, 1.2, 3.5, 7, 28 | 1 | Day -1, 15, 30 & 57 |
8 rats were assigened to the 700 mg/kg treatment group in case excessive toxicity occurred.
In the EMS 28-day study, five animals per group were dosed by oral gavage once a day with EMS (6.25, 12.5, 25, 50, and 100 mg/kg) or distilled water for 28 consecutive days. In the acute EMS study, five animals per group with the exception of the high dose group, which contained 8 male rats, received a single dose of EMS (100, 175, 350, and 700 mg/kg) or distilled water. Animals were euthanized by CO2 asphyxiation following the last timepoint taken.
In the first ENU study, 10 male animals per group were dosed by oral gavage once a day with ENU (2.5, 5, and 10 mg/kg) or PBS (pH=6.0) for 28 consecutive days. In the second ENU study, five male animals per group were dosed by oral gavage once a day with ENU (0.043, 0.25, 0.5, 1, and 15 mg/kg) or PBS for 28 consecutive days. In the acute ENU study, five male animals per group received a single dose of ENU (1.2 and 28 mg/kg) or PBS by oral gavage at a dose volume of 10 mL/kg. Animals were euthanized by CO2 asphyxiation following the last timepoint taken.
Blood Harvest
All blood harvest occurred via jugular venipuncture using a 1-ml syringe with a 25 gauge needle. Approximately 150 - 200 μl of blood was harvested and transferred to BD microtainer tubes with lithium heparin to prevent coagulation. For the first ENU 28-day study blood was harvested on Day -1, 15, 31, and 57. Blood was harvested on Day -1, 15, 29, and 57 for the second ENU study. For the EMS 28-day study blood was harvested on Day -1, 15, 29, 55, and 105 and on Day -1, 15, and 29 for the acute EMS study.
Flow Analysis
Cell processing, staining and flow cytometric procedures followed methods described by Phonethepswath et al. [14]. Briefly, all blood samples were processed and analyzed on the same day of collection. Flow cytometric analysis was conducted on a BD Biosciences FACSCalibur equiped with a 488 nm argon laser and CellQuest Pro 6.0 software. Aproximately one million red blood cells (RBCs) were acquired with a forward scatter (FSC) threshold under low fluidics pressure to determine total RBC mutant frequency. It should be mentioned that the word mutant in this context refers to the mutant phenotype and not a mutation per se, which can not be identified by the flow cytometric method. For determination of reticulocyte (RET) mutant frequency, an FL1 (SYTO 13) threshold was set to eliminate mature erythrocytes facilitating a faster flow rate. Using medium pressure and a 15-20 minute acquisition time limit, typically 300-400 thousand RETs were evaluated. Because the RET frequency in mature animals is lower than in young animals and in order to stay within the 15-20 minute limit, a lower number of RET was acquired at the later time points.
Statistical Analysis
Percent RETs, number of mutant RETs, and number of mutant RBCs were analyzed using a nonparametric trend test (Jonckheere-Terpstra test; [15]) and a nonparametric one-way analysis of variance (ANOVA) on ranks to compare treatment groups [16].
The nonparametric Jonckheere-Terpstra test was utilized to test for a trend in the treatment groups. Average ranks were used for ties, variance was corrected for ties, and asymptotic p-values were reported. If the trend p-value using all treatment groups was significant (p-value ≤ 0.05), then it was concluded that the “highest” group was different from the “lowest” group and the subsequent test was performed on all groups remaining after dropping the highest dosed group. This process was repeated until a non-significant p-value was found or the test was performed on only the two “lowest” groups. Percent RETs were tested for decreasing trend and mutant RETs and RBCs were tested for increasing trend. Nonparametric one-way ANOVA was conducted on ranks to test for differences among treatment groups. Average ranks were utilized for ties. If the p-value from the overall test was significant (p-value ≤ 0.05), appropriate follow up comparisons of each group to control were performed using two-sided least significant difference tests.
Threshold software developed by Lutz and Lutz [17] was used to generate graphs showing best-fitting hockey stick dose-response of the 28-day study data, calculate the threshold dose value, 95% confidence limits and the p-value which indicates the level at which linearity could be rejected against the threshold model.
3. Results
3.1 Accumulation of Pig-a Mutations in Rats Exposed to EMS for 28 Days
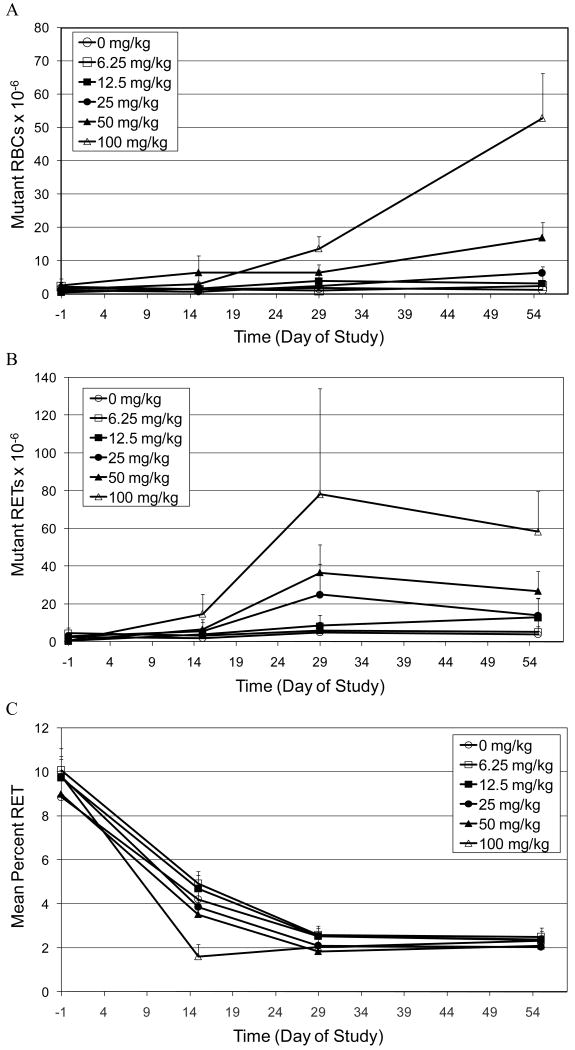
The accumulation of CD59 negative mutant red blood cells (RBCs) and reticulocytes (RETs) in peripheral blood of rats treated for 28 days with doses of EMS ranging from 6.25 to 100 mg/kg/day is illustrated in Figures 1A and 1B respectively. The two highest doses of EMS (50 mg/kg and 100 mg/kg) induced a statistically significant increase in mutant RBCs as early as Day 29, with further increases in mutant frequencies observed at Day 55 (Figure 1A). The next lower dose of EMS (25 mg/kg) also induced a statistically significant increase in mutant RBCs. In contrast to the two higher doses of EMS, the increase in mutant RBCs was not observed until Day 55. There was no increase in mutant RBCs observed in rats treated with the two lowest doses of EMS (6.25 and 12.5 mg/kg) at any time point.
Figure 1.
A. Time-course for the induction of CD59 negative red blood cells (Mutant RBCs) in the peripheral blood of rats treated orally for 28 days with EMS.
B. Time-course for the induction of CD59 negative RETs (Mutant RETs) in the peripheral blood of rats treated orally for 28 days with EMS.
C. Mean percent reticulocyte time-course in peripheral blood of rats treated orally for 28 days with EMS.
EMS also induced increases in CD59 negative RETs. Figure 1B shows that the maximum mutant frequency in RETs was observed on Day 29, with mutant frequencies becoming slightly lower on Day 55. The three highest doses of EMS (25, 50 and 100 mg/kg) induced statistically significant increases in mutant RETs. Both 50 and 100 mg/kg showed marked increases over controls as early as Day 15, whereas the mutant frequency was not elevated at 25 mg/kg until Day 29. There was also a statistically significant increase in mutant RETs observed on Day 55 in animals treated with 12.5 mg/kg. However, the biological significance is questionable for a number of reasons. First, at all previous time points evaluated, all animals dosed with 12.5 mg/kg had mutant frequencies similar to the control animals. Second, the time course of mutant induction is inconsistent with that observed in the higher dose groups. That is, for all other groups that showed a response, the maximum mutant frequency was observed at Day 29 with slightly lower mutant frequencies observed on Day 55. Lastly, on Day 55 three of five animals in the 12.5 mg/kg treatment group had mutant frequencies similar to controls.
The mean percentage of RETs in control and treated groups decreased over time (that is from Day -1 to Day 29) and then achieved a plateau. The time course of percent RETs observed is consistent with the age of the animals [18]. The only statistically significant decrease in RETs was observed at day 15 in animals treated with 100 mg/kg/day EMS.
3.2 Accumulation of Pig-a Mutations in Rats Exposed to High Doses of ENU for 28 Days
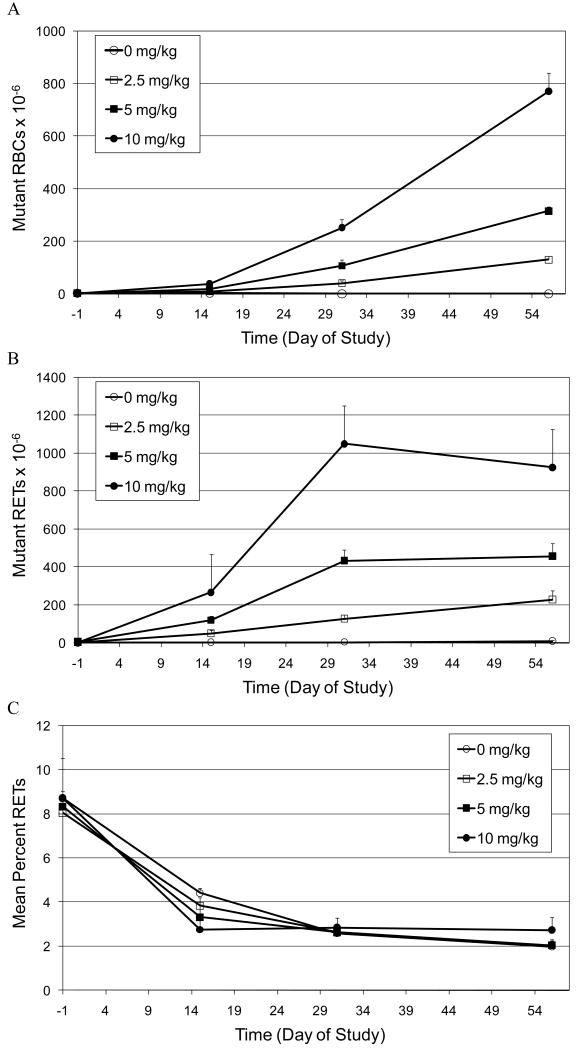
The accumulation of CD59 negative mutant RBCs and RETs in peripheral blood of rats treated for 28 days with high doses of ENU (2.5, 5.0 and 10 mg/kg/day) is illustrated in Figures 2A and 2B, respectively. Statistically significant increases in both mutant RBCs and RETs were observed at the earliest time point evaluated (Day 15) for all dose groups. In the RBC population in all treatment groups, the frequency of mutants continued to increase up to the last time point evaluated (Day 57; Figure 2A). In contrast, analysis of the RET population in animals exposed to 5.0 and 10 mg/kg ENU showed a maximum mutant frequency at Day 31, with no appreciable difference in mutant frequency observed at Day 57.
Figure 2.
A. Time-course for the induction of CD59 negative red blood cells (Mutant RBCs) in the peripheral blood of rats treated orally for 28 days with high doses of ENU (2.5, 5.0 and 10 mg/kg/day).
B. Time-course for the induction of CD59 negative RETs (Mutant RETs) in the peripheral blood of rats treated orally for 28 days with high doses of ENU (2.5, 5.0 and 10 mg/kg/day).
C. Mean percent reticulocyte time-course in peripheral blood of rats treated orally for 28 days with high doses of ENU (2.5, 5.0 and 10 mg/kg/day).
Similar to the prior study, the mean percentage of RETs in control and treated groups decreased over time (that is from Day -1 to Day 29) and then achieved a plateau (Figure 2C). The only statistically significant decrease in RETs was observed at Day 15 in animals treated with 10 mg/kg/day ENU.
3.3 Accumulation of Pig-a Mutations in Rats Exposed to Low Doses of ENU for 28 Days
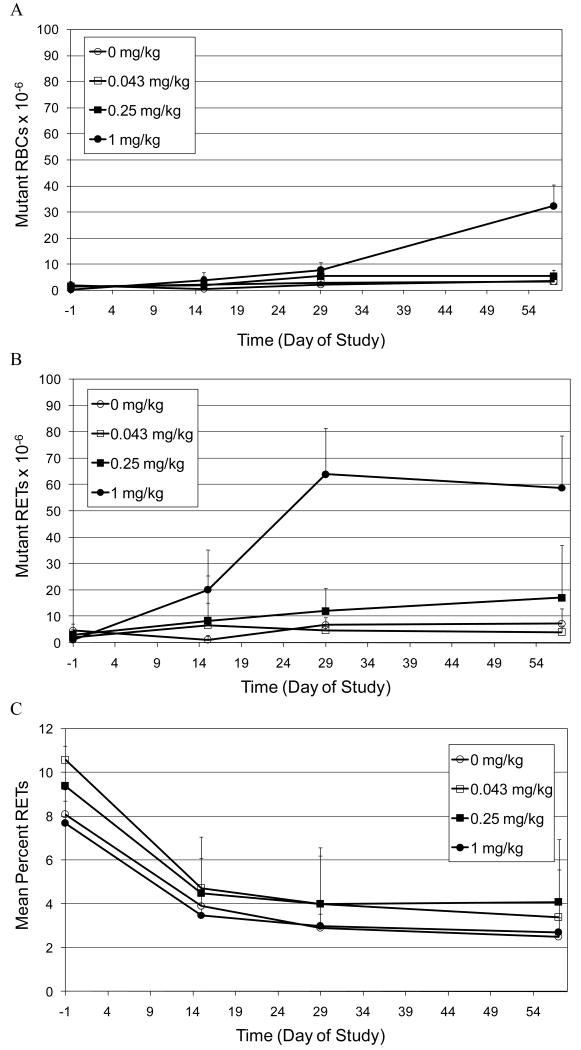
The accumulation of CD59 negative mutant RBCs and RETs in peripheral blood of rats treated for 28 days with low doses of ENU (0.043, 0.25 and 1.0 mg/kg/day) is illustrated in Figures 3A and 3B, respectively. Statistically significant increases in mutant RBCs were observed in animals treated with 1.0 mg/kg/day starting on Day 29 and the frequency of mutants was further elevated on Day 57 (Figure 3A). There was also a statistically significant increase (trend test p value = 0.014; pairwise p value=0.049) in mutant frequency observed on Day 29 in animals treated with 0.25 mg/kg. However, unlike 1.0 mg/kg the mutant frequency was not further elevated or statistically significant at Day 57. Statistically significant increases in mutant RETs were also observed in animals treated with 1.0 mg/kg starting on Day 15. The maximum mutant frequency was observed at Day 29, with a slightly lower mutant frequency observed at Day 57. There was also a statistically significant upward trend in the frequency of mutant RETs observed at 0.25 mg/kg on Day 15 (p value = 0.047). However, this trend did not reproduce at later time points.
Figure 3.
A. Time-course for the induction of CD59 negative red blood cells (Mutant RBCs) in the peripheral blood of rats treated orally for 28 days with low doses of ENU (0.043, 0.25 and 1.0 mg/kg/day).
B. Time-course for the induction of CD59 negative RETs (Mutant RETs) in the peripheral blood of rats treated orally for 28 days with low doses of ENU (0.043, 0.25 and 1.0 mg/kg/day).
C. Mean percent reticulocyte time-course in peripheral blood of rats treated orally for 28 days with high doses of ENU (0.043, 0.25 and 1.0 mg/kg/day).
A few technical limitations affected the results in the 1 mg/kg dose group of 28-day ENU treated rats. All data from one animal in the highest dose group (1.0 mg/kg) were excluded from evaluation for the entire study due to the observation of a high initial mutant frequency (Day -1) of 181 mutants per million RBCs. In addition on Day 29 and 55, % RETs and mutant RETs data from one additional 1.0 mg/kg animal was excluded due to uncharacteristic and likely anomalous RET staining. Similarly, on Day 57, % RETs and mutant RETs data from two of five animals were also excluded for the same reason.
The mean percentage of RETs in control and treated groups decreased over time (that is from Day -1 to Day 29) and then achieved a plateau (Figure 3C). There were no significant differences in the percentage of RETs in treated animals relative to control animals.
3.4 Pig-a Mutant Dose-Response Relationship in Rats Exposed to EMS for 28 Days
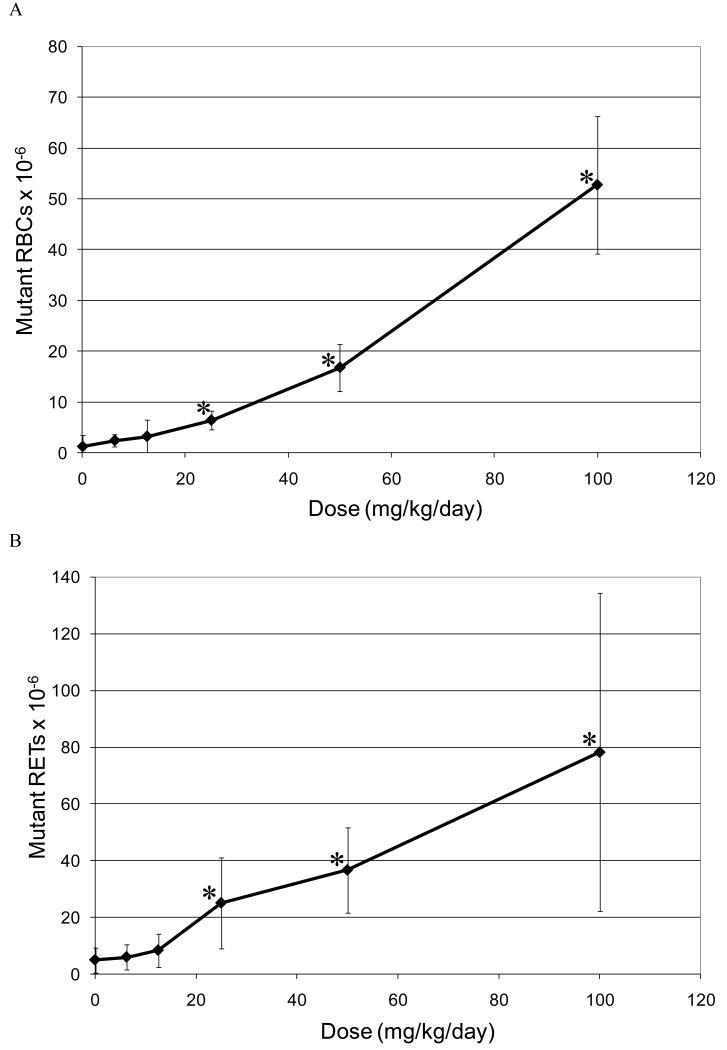
The relationship between the dose of EMS administered and the induction of Pig-a mutant RBCs and RETs is illustrated in Figures 4A and B, respectively. In the case of mutant RBCs the mutant frequency plotted is that observed on Day 55, because the maximum mutant RBC frequency was observed at this latest time point (Figure 4A). For RETs data from Day 29 is presented, as the maximum mutant frequency was typically observed at this time point (Figure 4B). In both RBCs and RETs, the first dose that showed a statistically significant increase in CD59 negative cells was 25 mg/kg/day.
Figure 4.
A. Mutant frequency (CD59 negative) dose-response relationship observed in the RBCs of rat peripheral blood following 28 days of oral treatment with EMS. The frequency of mutant RBCs measured 55 days following the initiation of treatment.
*Statistically significant increase in mutant frequency (p<0.05) over the concurrent control (trend test and pair wise comparison).
B. Mutant frequency (CD59 negative) dose-response relationship observed in the RETs of rat peripheral blood following 28 days of oral treatment with EMS. The frequency of mutant RETs measured 55 days following the initiation of treatment.
*Statistically significant increase in mutant frequency (p<0.05) over the concurrent control (trend test and pair wise comparison).
Application of the hockey stick software developed by Lutz and Lutz [17] on the entire EMS dose-response curve indicated that linearity is a highly unlikely dose-response (p=0.005; Figure 6A). In addition the best estimate of the threshold dose was 21.9 mg/kg with upper and lower 95% confidence intervals of 40.3 and 13.4 mg/kg respectively.
Figure 6.
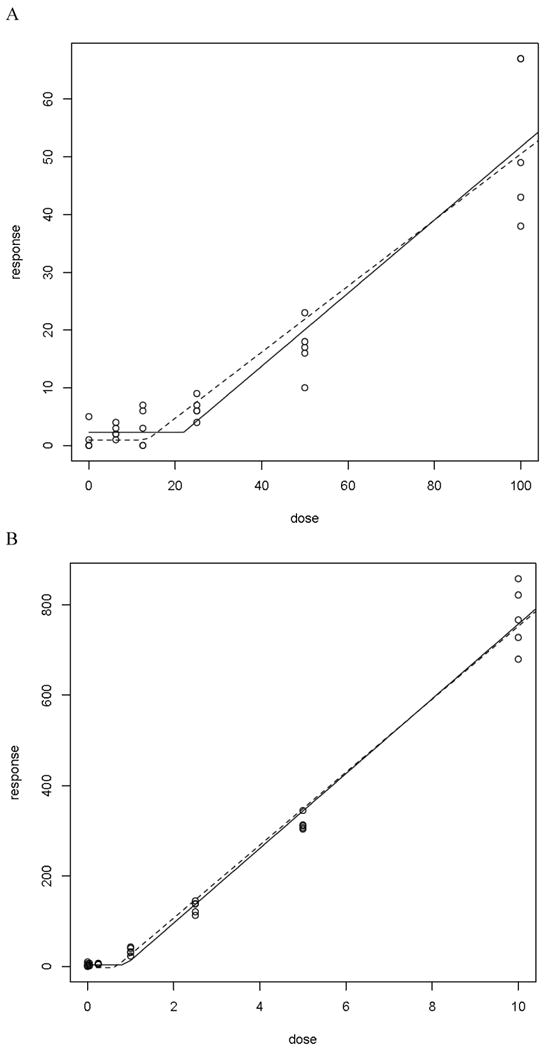
A. Hockeystick curve for mutant RBC frequency observed in animals treated for 28 days with EMS. Mutant frequencies measured on day 55 post-treatment initiation.
B. Hockeystick curve for mutant RBC frequency observed in animals treated for 28 days with ENU. Mutant frequencies measured on day 57 post-treatment initiation.
3.5 Pig-a Mutant Dose-Response Relationship in Rats Exposed to ENU for 28 Days
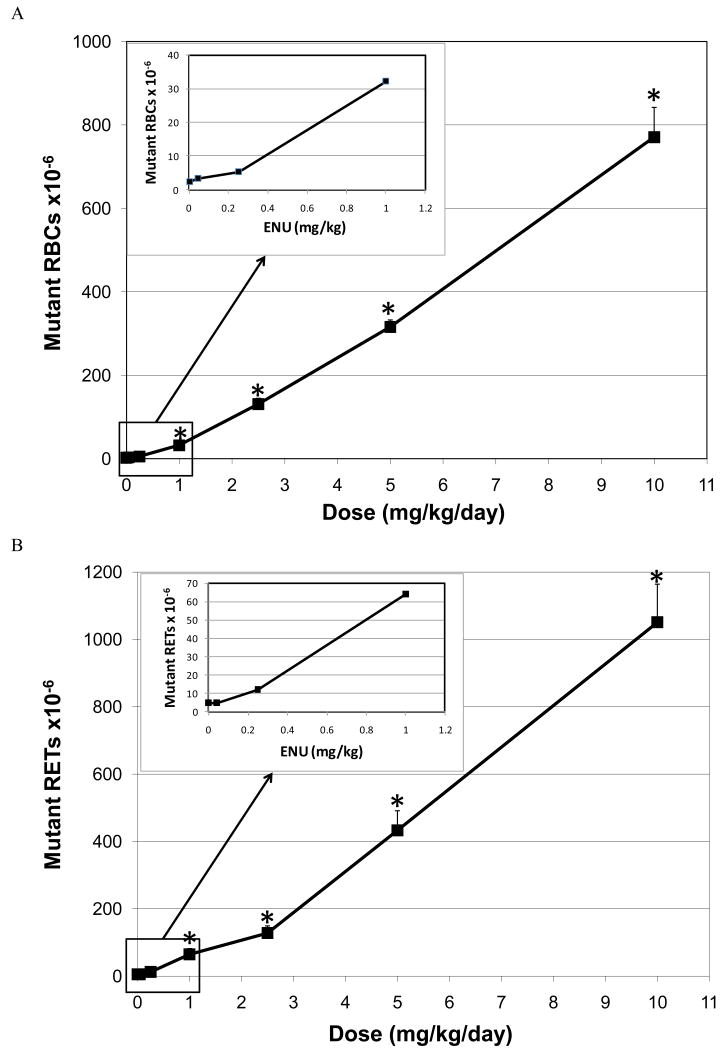
Similarly, the relationship between the dose of ENU administered and the induction of Pig-a mutant RBCs and RETs is illustrated in Figures 5A and B, respectively. In both RBCs and RETs, the first dose that showed a statistically significant increase in CD59 negative cells was 1.0 mg/kg/day. Application of the hockey stick software developed by Lutz and Lutz [17] on the entire ENU dose-response curve indicated that linearity is a highly unlikely dose-response (p = 4.4 × 10⁻⁶; Figure 6B). In addition the best estimate of the threshold dose was 0.88 mg/kg with upper and lower 95% confidence intervals of 0.64 and 1.55 mg/kg respectively.
Figure 5.
A. Mutant frequency (CD59 negative) dose-response relationship observed in the RBCs of rat peripheral blood following 28 days of oral treatment with ENU. The frequency of mutant RBCs measured 57 days following the initiation of treatment.
*Statistically significant increase in mutant frequency (p<0.05) over the concurrent control (trend test and pair wise comparison).
B. Mutant frequency (CD59 negative) dose-response relationship observed in the RETs of rat peripheral blood following 28 days of oral treatment with ENU. The frequency of mutant RETs measured 57 days following the initiation of treatment.
*Statistically significant increase in mutant frequency (p<0.05) over the concurrent control (trend test and pair wise comparison).
3.6 High Dose vs. Low Dose Mutant Induction
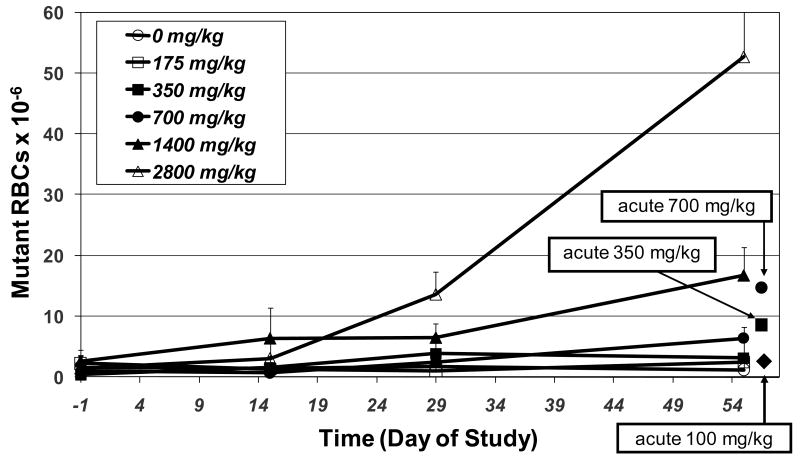
Comparison of the mutant frequency induced by single acute treatment of EMS at 700 and 350 mg/kg vs. fractionating these doses into 28 daily doses of 25 and 12.5 mg/kg/day, respectively, shows that the relationship between EMS dose and mutant induction is not strictly additive at low dose levels (Figure 7). The frequency of mutant RBCs observed following a single administration of 700 and 350 mg/kg/day is ∼2-fold greater than the mutant frequency observed when the dose is fractionated over 28 days of treatment. Repeat treatment with 12.5 mg/kg did not induce any increase in mutant RBCs, whereas a single acute dose of 350 mg/kg did induce a significant increase. It should be noted that, since RBCs require about 2 months to turn over, the sampling time for the 28-day study may underestimate maximum mutant frequencies unlike the acute studies, which are closer to the optimal sampling time. Figure 7 also compares mutant frequencies produced by a single acute treatment vs. 28 days of dosing 100 mg/kg EMS. Although a single dose of 100 mg/kg EMS did not induce an increase in mutant RBCs, repeat exposure to 100 mg/kg ENU for 28 days resulted in a substantial increase in mutant frequency.
Figure 7.
Comparison of mutant frequencies observed in RBCs of rats following a single treatment vs. 28days of treatment with EMS. Doses in legend are expressed as cumulative doses over the 28 day treatment period.
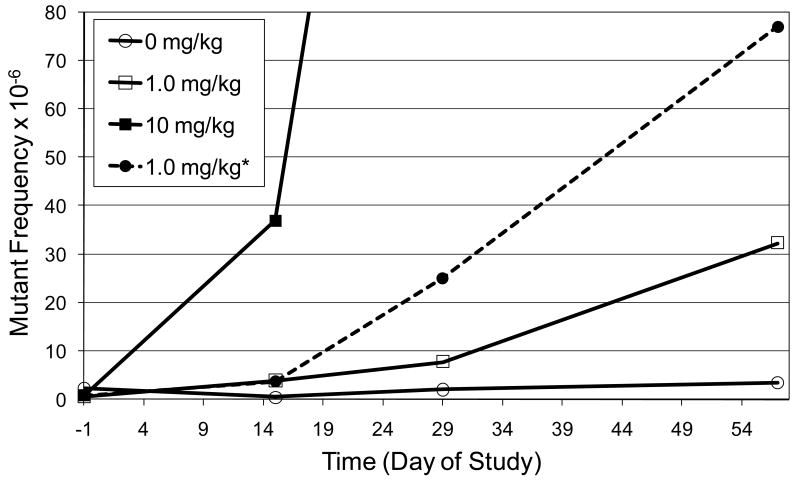
A comparison of the mutant frequency that was observed following 28 daily doses of 1.0 mg/kg ENU and the expected mutant frequency is illustrated in Figure 8. Assuming a strict linear relationship between dose and the induction of mutants, the mutant frequency induced by 1.0 mg/kg/day should be approximately 10-fold lower than that induced by 10 mg/kg/day. However, the observed mutant frequency is approximately 24-fold lower. The lack of additivity in the mutant response is consistent with the fact that the shape of the dose-response curve for ENU begins to deviate from linearity at 1.0 mg/kg (Figure 5A).
Figure 8.
Comparison of observed and expected mutant RBC (CD59 negative) frequencies in the peripheral blood of rats treated with 1.0 mg/kg ENU for 28 days.
*Line represents expected mutant frequency for 28 daily doses of 1 mg/kg given for 28 days, which would expected to be 10 fold lower than the frequency induced by 10 mg/kg, assuming a strict linear relationship between dose and the induction of mutants.
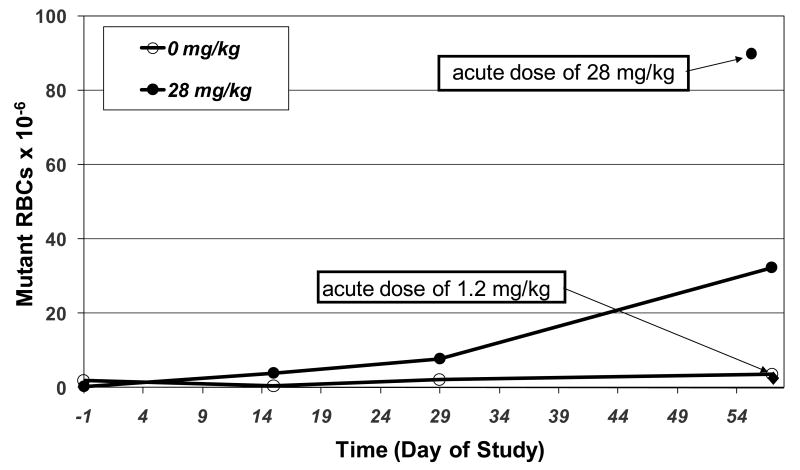
Comparison of the mutant frequency induced by an acute high dose of ENU, 28 mg/kg vs. fractionating the dose into 28 doses of 1 mg/kg/day also indicates that the relationship between ENU dose and mutant induction is not linear at low doses (Figure 9). The frequency of mutant RBCs observed following a single administration of 28 mg/kg/day is ∼3-fold higher than the mutant frequency observed when the dose is fractionated into 28 doses of 1 mg/kg. In addition, Figure 9 also shows the mutant frequency produced by a single dose of 1.2 mg/kg ENU. Although a single dose of 1.2 mg/kg ENU did not induce an increase in mutant RBCs, repeat exposure to 1.0 mg/kg ENU for 28 days resulted in a substantial increase in mutant frequency.
Figure 9.
Comparison of mutant frequencies observed in RBCs of rat following a single treatment vs. 28-days of treatment with ENU. Doses in legend are expressed as cumulative doses over the 28 day treatment period.
4. Discussion
Experimental evidence is accumulating that supports the existence of sub-linear dose-response relationships at low doses of DNA reactive mutagens [2, 4-6, 19]. However, typically the biological data needed to support such conclusions is lacking and consequently compounds that show evidence of mutagenicity in the Ames assay are assumed to induce mutations and cancer via direct interaction with DNA with a linear dose-response relationship. These assumptions are the basis for existing regulatory guidance that indicates a lifetime daily limit of 1.5 μg/day as acceptable for genotoxic impurities in pharmaceuticals [1]. The notion of using experimental data to characterize the dose-response relationship in the low dose range and then derive compound specific limits for genotoxic impurities that pose negligible excess cancer risk is highly attractive. However, a practical approach to generate the necessary data is a must if this is to occur in practice during the normal course of drug development.
The purpose of the current work was to evaluate the utility of the Pig-a assay to rapidly differentiate linear and sub-linear dose-response relationships for direct acting genotoxic agents. The induction of mutations in the peripheral blood of rats was evaluated following 28-days of exposure to EMS and ENU down to doses which have been previously shown or suspected to be below a threshold for genotoxic effects [3, 4, 20, 21]. In addition, the frequency of mutant RBCs in rats receiving low doses of alkylating agent for 28 days was compared to animals receiving acute high doses. It is possible that this experimental approach could be used to substantiate that a biological mechanism is responsible for the observation of a sub-linear dose-response curve.
Following 28 days of treatment, both EMS and ENU induced robust increases in mutant RETs and RBCs in the peripheral blood of rats (Figures 1-3). The maximum induction of mutant RETs was typically observed at the timepoint which most closely coincided with the last day of treatment (Day 29 or 31). Mutant RET frequencies typically showed a plateau or were slightly lower at the next timepoint evaluated, approximately 4 weeks later (Day 55 or 57). In contrast, the frequency of mutant RBCs continued to increase up to the latest timepoint evaluated (Day 55 or 57). These observations related to the time-course of mutant RET and RBC formation are consistent with previous reports [13, 14, 22]. Furthermore, the differences in time-course of peak mutant frequencies are expected. Whereas, the peripheral blood RET population in rat is a relatively small proportion of the total erythrocytes (∼ 2 to 10% in the current studies), which is rapidly turned over (within days), mature erythrocytes are highly abundant (90 to 98% of peripheral blood erythrocytes) and have a lifespan of ∼ 2 months. Therefore, the observation of a rapid increase and subsequent plateau in mutant RETs shortly after last day of dosing could be explained by the fact that any RETs generated post-treatment. In contrast, for RBCs which have a lifespan of 2 months, one would expect a more gradual and protracted increase in the frequency of mutants as the population of erythrocytes pre-treatment is more slowly replaced by those generated from bone marrow stem cells post-treatment. The relationship between bone marrow erythropoiesis and the association with the time-course and accumulation of Pig-a mutant frequencies in peripheral RBCs has been described in detail elsewhere [13].
One potential advantage of using a mutation assay to characterize dose-response relationships is that fixed gene mutations should accumulate using a repeat treatment protocol, such that even weak mutagenic responses could be readily detected. This has been demonstrated for a number of transgenic rodent models in which the target for gene mutation is derived from bacteria [23]. In the case of mutation assays that rely on an endogenous gene (such as the Pig-a assay), there is the potential that mutation of the target gene can result in a selective disadvantage for affected cells decreasing the sensitivity of the assay. The ability of the Pig-a mutation assay to detect weakly mutagenic responses to EMS and ENU following repeat exposure is illustrated in Figures 9 and 10, respectively. Whereas, acute exposure to EMS (100mg/kg) and ENU (1.2 mg/kg), [doses near the inflection point of the dose-response curve] showed no induction of mutant RBCs at 8 weeks post-treatment, 28 days of exposure to 100 mg/kg EMS and 1.0 mg/kg/day ENU, produced significant increases in the mutant RBCs. The observation of mutant accumulation in the Pig-a assay following repeat exposure to ENU, has been reported previously in rats exposed to higher doses of ENU [13]. In this study the investigators also demonstrated that elevated mutant frequencies persisted for 6 months post-treatment, indicating no selective disadvantage for Pig-a mutant erythrocytes.
In the current investigations the dose-response relationship associated with the induction of Pig-a mutations was non-linear for both EMS and ENU (Figure 4&5). Following 28-days of exposure the lowest dose of EMS that generated a statistically significant increase in mutant RETs (Day 29) and RBCs (Day 55) was 25 mg/kg. In addition, an analysis of the shape of the dose response curve showed that the data was a better fit to a hockey stick than a linear dose response with a threshold dose estimated to be 21.9 mg/kg (95% confidence intervals 13.4 to 40.3 mg/kg). Although ENU was a more potent mutagen, similar observations were made. The lowest dose that generated a significant increase in mutant RETs (Day 31) and RBC (Day 57) was 1.0 mg/kg. The shape of the dose-response curve was better fit to a hockey stick than a linear dose response, with the threshold dose estimated to be 0.88 mg/kg/day with 95% confidence intervals of 0.64 and 1.55 mg/kg. However, it should be mentioned that the hockey stick analysis for both EMS and ENU would have profited from inclusion of more doses below the proposed threshold dose.
Evidence to support a protective mechanism as the underlying cause of the non-linear dose-response is observed when mutant frequencies are compared in animals dosed with high acute treatment vs. an equivalent cumulative dose administered by fractionation over 28 days of treatment. The observation that low chronic doses of EMS (12.5 and 25 mg/kg) showed a less than additive relationship in comparison to the respective acute high doses (350 and 700 mg/kg) is consistent with the result of the hockey stick analysis which estimated the threshold dose as 21.9 mg/kg (CI = 13.4 to 40.3 mg/kg). Similar observations supporting lack of an additive relationship following repeat low dose exposure to EMS have been reported in Muta™mouse [3]. For ENU a less than additive response in mutant induction was observed with repeat exposure to 1.0 mg/kg/day and the threshold dose was estimated to be 0.88 mg/kg (CI = 0.64 to 1.55 mg/kg). [3, 4]. Although a threshold dose has not been previously reported for ENU, the existence of a sublinear dose-response relationship and a threshold for mutagenicity has been suspected based on data generated in Muta™mouse following chronic low dose exposure [4, 20, 21].
The threshold dose observed for EMS in rat RBCs in the current study (21.9 mg/kg) is somewhat lower in comparison to that reported for Muta™mouse bone marrow (35.4 mg/kg). A limitation of the current study is the lack of a concurrent exposure assessment. However, recent investigations in which a threshold dose for EMS was determined, were supported by a thorough assessment of pharmacokinetics via measurement of unchanged EMS and ethylated hemoglobin (Hb) adducts in blood of mouse and rat [24, 25]. Although exposure in both mouse and rat was dose proportional, the half-life of EMS in rat was longer (∼2.5 hours) than that observed in mouse (∼10 minutes). In addition, relative to mouse, clearance was lower, Cmax and AUC were higher, and Hb adducts were approximately 2-4 fold higher in the rat. These data suggest that the rat would have more DNA damage and consequently greater sensitivity to the mutagenic effects of EMS at an equivalent dose. However, it has been reported that MGMT activity relative to DNA content is higher in rat relative to mouse (Gerson, et al., 1986). Higher capacity to repair alkylated DNA adducts in rat (vs. mouse) may in effect minimize differences in the threshold dose that would be anticipated strictly based on pharmacokinetic differences.
The genotoxicity of EMS and ENU have been extensively investigated both in vitro and in vivo. The spectrum of DNA adducts and the associated mutations have been well characterized [26-33]. There is also knowledge of how readily various DNA alkylation adducts are repaired and the cellular processes responsible. It has been recommended that both a thorough characterization of the dose response relationship and knowledge of the mechanism of action of a genotoxic compound is necessary to conclude the existence of a non-linear relationship. However, data from our studies and others suggests that a comparison of mutant frequencies induced following acute vs. fractionated treatment can differentiate a linear from a non-linear dose-response relationship. This approach would be more practical for understanding the dose-response relationship for mutagenic impurities where much less is known about the mechanism of DNA mutation and repair.
It is important to acknowledge the practical limitations of more broadly applying the approach presented here for characterizing the dose-response relationship of genotoxic impurities. Currently, assessment of the induction of Pig-a mutations is limited to the hematopoietic tissue, which is acceptable for compounds that are direct acting and well distributed. However, for compounds that require metabolic activation and/or are not well distributed then Pig-a assessment in peripheral blood alone may not be sufficient. In addition, reliance on an in vivo system alone for characterization of genotoxic impurities may present challenges, which make practical implementation problematic. For example, in some cases it will be difficult to synthesize or isolate sufficient quantities of an impurity to conduct in vivo testing. A more practical approach would utilize an in vitro mutation assay to carry out acute vs. fractionated experimentation to determine if the dose response is strictly additive (linear) or sub-linear at low doses. If evidence of non-linearity is observed, then in vivo testing could be done to confirm translation to the in vivo system and estimate a threshold dose.
In conclusion, the Pig-a assay appears to have great potential for differentiating linear and non-linear relationships at low doses of direct acting mutagenic agents. Comparing dose-response relationships from acute and fractionated chronic dosing experiments could provide additional confidence into non-linear dose-response relationships. Some of the practical limitations cited have recently been overcome by technical improvements to the assay allowing for a much larger number of erythrocytes (RBCs and RETs) being evaluated [34]. Using the newly developed approach, additional work is aimed at establishing in vivo dose-response relationships for known genotoxic compounds. In addition, a similar experimental method in vitro is needed to support routine characterization of dose response curves for genotoxic impurities.
Acknowledgments
The authors would like to express their gratitude to Susan Portugal for statistical analysis of the data and Werner Lutz for dose response modeling and determination of threshold values. In addition, we would like to thank Litron Laboratories for making the Pig-a kits available to us and for their expertise. This work was funded in part by NIH-NIEHS grant No.: R44ES015940, S.D.D.
Footnotes
Publisher's Disclaimer: This is a PDF file of an unedited manuscript that has been accepted for publication. As a service to our customers we are providing this early version of the manuscript. The manuscript will undergo copyediting, typesetting, and review of the resulting proof before it is published in its final citable form. Please note that during the production process errors may be discovered which could affect the content, and all legal disclaimers that apply to the journal pertain.
References
- 1.CHMP. Guideline on the limits of genotoxic impurities. [June 28, 2006];2006 www.emea.europa.eu/pdfs/human/swp/519902en.pdf.
- 2.Doak SH, Jenkins GJ, Johnson GE, Quick E, Parry EM, Parry JM. Mechanistic influences for mutation induction curves after exposure to DNA-reactive carcinogens. Cancer Res. 2007;67:3904–3911. doi: 10.1158/0008-5472.CAN-06-4061. [DOI] [PubMed] [Google Scholar]
- 3.Gocke E, Ballantyne M, Whitwell J, Muller L. MNT and MutaMouse studies to define the in vivo dose response relations of the genotoxicity of EMS and ENU. Toxicol Lett. 2009;190:286–297. doi: 10.1016/j.toxlet.2009.03.021. [DOI] [PubMed] [Google Scholar]
- 4.Gocke E, Muller L. In vivo studies in the mouse to define a threshold for the genotoxicity of EMS and ENU. Mutat Res. 2009;678:101–107. doi: 10.1016/j.mrgentox.2009.04.005. [DOI] [PubMed] [Google Scholar]
- 5.Jenkins GJ, Doak SH, Johnson GE, Quick E, Waters EM, Parry JM. Do dose response thresholds exist for genotoxic alkylating agents? Mutagenesis. 2005;20:389–398. doi: 10.1093/mutage/gei054. [DOI] [PubMed] [Google Scholar]
- 6.Johnson GE, Doak SH, Griffiths SM, Quick EL, Skibinski DO, Zair ZM, Jenkins GJ. Non-linear dose-response of DNA-reactive genotoxins: Recommendations for data analysis. Mutat Res. 2009;678:95–100. doi: 10.1016/j.mrgentox.2009.05.009. [DOI] [PubMed] [Google Scholar]
- 7.Pottenger LH, Schisler MR, Zhang F, Bartels MJ, Fontaine DD, McFadden LG, Bhaskar Gollapudi B. Dose-response and operational thresholds/NOAELs for in vitro mutagenic effects from DNA-reactive mutagens, MMS and MNU. Mutat Res. 2009;678:138–147. doi: 10.1016/j.mrgentox.2009.07.002. [DOI] [PubMed] [Google Scholar]
- 8.Muller L, Gocke E, Lave T, Pfister T. Ethyl methanesulfonate toxicity in Viracept--a comprehensive human risk assessment based on threshold data for genotoxicity. Toxicol Lett. 2009;190:317–329. doi: 10.1016/j.toxlet.2009.04.003. [DOI] [PubMed] [Google Scholar]
- 9.Muller L, Gocke E. Considerations regarding a permitted daily exposure calculation for ethyl methanesulfonate. Toxicol Lett. 2009;190:330–332. doi: 10.1016/j.toxlet.2009.03.015. [DOI] [PubMed] [Google Scholar]
- 10.ICH. Impurities: guideline for residual solvents. 2005 http://www.ich.org/cache/compo/363-272-1.html#Q3C.
- 11.Bryce SM, Bemis JC, Dertinger SD. In vivo mutation assay based on the endogenous Pig-a locus. Environ Mol Mutagen. 2008;49:256–264. doi: 10.1002/em.20379. [DOI] [PubMed] [Google Scholar]
- 12.Miura D, Dobrovolsky VN, Mittelstaedt RA, Kasahara Y, Katsuura Y, Heflich RH. Development of an in vivo gene mutation assay using the endogenous Pig-a gene: II. Selection of Pig-a mutant rat spleen T-cells with proaerolysin and sequencing Pig-a cDNA from the mutants. Environ Mol Mutagen. 2008;49:622–630. doi: 10.1002/em.20413. [DOI] [PubMed] [Google Scholar]
- 13.Miura D, Dobrovolsky VN, Kimoto T, Kasahara Y, Heflich RH. Accumulation and persistence of Pig-a mutant peripheral red blood cells following treatment of rats with single and split doses of N-ethyl-N-nitrosourea. Mutat Res. 2009;677:86–92. doi: 10.1016/j.mrgentox.2009.05.014. [DOI] [PubMed] [Google Scholar]
- 14.Phonethepswath S, Franklin D, Torous DK, Bryce SM, Bemis JC, Raja S, Avlasevich S, Weller P, Hyrien O, Palis J, Macgregor JT, Dertinger SD. Pig-a mutation: kinetics in rat erythrocytes following exposure to five prototypical mutagens. Toxicol Sci. 2010;114:59–70. doi: 10.1093/toxsci/kfp289. [DOI] [PMC free article] [PubMed] [Google Scholar]
- 15.Conover WJ, Iman RL. Rank transformations as a bridge between parametric and nonparametric statistics. Amer Stat. 1981;35:10. [Google Scholar]
- 16.Lehmann E. Nonparametrics: statistical methods based on ranks. Holden-Day Inc.; San Francisco: 1975. [Google Scholar]
- 17.Lutz WK, Lutz RW. Statistical model to estimate a threshold dose and its confidence limits for the analysis of sublinear dose-response relationships, exemplified for mutagenicity data. Mutat Res. 2009;678:118–122. doi: 10.1016/j.mrgentox.2009.05.010. [DOI] [PubMed] [Google Scholar]
- 18.Hamada S, Nakajima K, Serikawa T, Hayashi M. The effect of aging on the results of the rat micronucleus assay. Mutagenesis. 2003;18:273–275. doi: 10.1093/mutage/18.3.273. [DOI] [PubMed] [Google Scholar]
- 19.Gocke E, Wall M. In vivo genotoxicity of EMS: statistical assessment of the dose response curves. Toxicol Lett. 2009;190:298–302. doi: 10.1016/j.toxlet.2009.03.008. [DOI] [PubMed] [Google Scholar]
- 20.Cosentino L, Heddle JA. Effects of extended chronic exposures on endogenous and transgenic loci: implications for low-dose extrapolations. Environ Mol Mutagen. 1999;34:208–215. [PubMed] [Google Scholar]
- 21.Cosentino L, Heddle JA. A comparison of the effects of diverse mutagens at the lacZ transgene and Dlb-1 locus in vivo. Mutagenesis. 1999;14:113–119. doi: 10.1093/mutage/14.1.113. [DOI] [PubMed] [Google Scholar]
- 22.Dertinger SD, Phonethepswath S, Franklin D, Weller P, Torous DK, Bryce SM, Avlasevich S, Bemis JC, Hyrien O, Palis J, MacGregor JT. Integration of mutation and chromosomal damage endpoints into 28-day repeat dose toxicology studies. Toxicol Sci. 2010;115:401–411. doi: 10.1093/toxsci/kfq070. [DOI] [PMC free article] [PubMed] [Google Scholar]
- 23.Lambert IB, Singer TM, Boucher SE, Douglas GR. Detailed review of transgenic rodent mutation assays. Mutat Res. 2005;590:1–280. doi: 10.1016/j.mrrev.2005.04.002. [DOI] [PubMed] [Google Scholar]
- 24.Gocke E, Muller L, Pfister T. EMS in Viracept--initial (‘traditional’) assessment of risk to patients based on linear dose response relations. Toxicol Lett. 2009;190:266–270. doi: 10.1016/j.toxlet.2009.04.030. [DOI] [PubMed] [Google Scholar]
- 25.Lave T, Paehler A, Grimm HP, Gocke E, Muller L. Modelling of patient EMS exposure: translating pharmacokinetics of EMS in vitro and in animals into patients. Toxicol Lett. 2009;190:310–316. doi: 10.1016/j.toxlet.2009.07.031. [DOI] [PubMed] [Google Scholar]
- 26.Beranek DT. Distribution of methyl and ethyl adducts following alkylation with monofunctional alkylating agents. Mutat Res. 1990;231:11–30. doi: 10.1016/0027-5107(90)90173-2. [DOI] [PubMed] [Google Scholar]
- 27.Bronstein SM, Cochrane JE, Craft TR, Swenberg JA, Skopek TR. Toxicity, mutagenicity, and mutational spectra of N-ethyl-N-nitrosourea in human cell lines with different DNA repair phenotypes. Cancer Res. 1991;51:5188–5197. [PubMed] [Google Scholar]
- 28.Den Engelse L, De Graaf A, De Brij RJ, Menkveld GJ. O2- and O4-ethylthymine and the ethylphosphotriester dTp(Et)dT are highly persistent DNA modifications in slowly dividing tissues of the ethylnitrosourea-treated rat. Carcinogenesis. 1987;8:751–757. doi: 10.1093/carcin/8.6.751. [DOI] [PubMed] [Google Scholar]
- 29.Den Engelse L, Menkveld GJ, De Brij RJ, Tates AD. Formation and stability of alkylated pyrimidines and purines (including imidazole ring-opened 7-alkylguanine) and alkylphosphotriesters in liver DNA of adult rats treated with ethylnitrosourea or dimethylnitrosamine. Carcinogenesis. 1986;7:393–403. doi: 10.1093/carcin/7.3.393. [DOI] [PubMed] [Google Scholar]
- 30.Ellison KS, Dogliotti E, Connors TD, Basu AK, Essigmann JM. Site-specific mutagenesis by O6-alkylguanines located in the chromosomes of mammalian cells: influence of the mammalian O6-alkylguanine-DNA alkyltransferase. Proc Natl Acad Sci U S A. 1989;86:8620–8624. doi: 10.1073/pnas.86.22.8620. [DOI] [PMC free article] [PubMed] [Google Scholar]
- 31.Jansen JG, Vrieling H, van Teijlingen CM, Mohn GR, Tates AD, van Zeeland AA. Marked differences in the role of O6-alkylguanine in hprt mutagenesis in T-lymphocytes of rats exposed in vivo to ethylmethanesulfonate, N-(2-hydroxyethyl)-N-nitrosourea, or N-ethyl-N-nitrosourea. Cancer Res. 1995;55:1875–1882. [PubMed] [Google Scholar]
- 32.Singer B, Grungerger D. Molecular Biology of Mutagens and Carcinogens. Plenum; New York: 1983. [Google Scholar]
- 33.Suzuki T, Hayashi M, Wang X, Yamamoto K, Ono T, Myhr BC, Sofuni T. A comparison of the genotoxicity of ethylnitrosourea and ethyl methanesulfonate in lacZ transgenic mice (Muta Mouse) Mutat Res. 1997;395:75–82. doi: 10.1016/s1383-5718(97)00144-7. [DOI] [PubMed] [Google Scholar]
- 34.Dertinger SD, Bryce SM, Phonethepswath S, Avlasevich SL. When pigs fly: Immunomagnetic separation facilitates rapid determination of Pig-a mutant frequency by flow cytometric analysis. Mutat Res. 2011 doi: 10.1016/j.mrgentox.2011.01.009. [DOI] [PMC free article] [PubMed] [Google Scholar]


