

Abstract
FISH analysis of well-spread chromosomes reveals that homologs are paired in vegetatively growing budding yeast diploid cells, via multiple interstitial interactions, and independent of recA homologs and mating type heterozygosity. Pairing is present during G1 and G2, and in cells arrested at G1 by mating pheromone, but is disrupted during S phase. Thus, somatic pairing is qualitatively analogous to premeiotic and early meiotic pairing. S-phase pairing disruption occurs by a complex intranuclear program involving regional, nucleus-wide, and temporal determinants. Pairing is also disrupted in two G2-arrest conditions (cdc13ts and nocodazole). Together these findings suggest that cell cycle signals may provoke pairing disruption by modulating underlying chromosome and/or chromatin structure. Whether the cell chooses to disrupt pairing contacts or not (e.g., S phase and G2 arrest, but not G1 arrest or normal G1 or G2), could be dictated by functional considerations involving homolog/sister discrimination.
Keywords: Homologs, pairing, cell cycle, chromosomes, yeast
Intimate juxtaposition of homologous chromosomes is a prominent universal feature of meiosis, where it occurs during early prophase in advance of synaptonemal complex (SC) formation. Pairing is also observed in premeiotic cells of some organisms, including budding and fission yeasts and plants, where it likely simplifies the process of homolog juxtaposition during meiosis (e.g., Stack and Brown 1969).
Pairing of homologous chromosomes outside of the meiotic program has been excluded in certain situations (e.g., Emmerich et al. 1989; van Dekken et al. 1989). In several cases, however, it has been clearly documented, for example, in Drosophilae (Metz 1916; Fung et al. 1998; Gemkow et al. 1998). Yet other cases are controversial, often because of limitations in the assays used, but there are strong indications or provocative hints of transient and/or locus-specific pairing, sometimes in restricted cell types, from cytological studies and epigenetic (trans-sensing) phenomena. Such findings exist in fungi (e.g., Aramayo and Metzenberg 1996; Maloisel and Rossignol 1998), plants (e.g., Hollick et al. 1997; Bender 1998), mammals (e.g., Arnoldus et al. 1989; Lewis et al. 1993; LaSalle and Lalande 1996; Ashe et al. 1997), and Drosophila (Henikoff and Comai 1998; Karpen and Allshire 1998).
The relationship of somatic pairing to premeiotic and/or meiotic pairing has been debated at various levels and from various points of view for nearly a century, ever since the basic nature of chromosomes began to emerge (Digby 1910; Metz 1916; Stack and Brown 1969).
In budding yeast, in cells arrested at G1 just prior to entering the meiotic program, homologs are paired via multiple interstitial interactions between chemically intact chromosomes (Weiner and Kleckner 1994). It has been argued that these pairing contacts should be unstable and dynamic (Kleckner and Weiner 1993; Weiner and Kleckner 1994) and that they might include homology-dependent contacts in nucleosome free regions (Keeney and Kleckner 1996). Pairing is, however, lost during meiotic S phase (Weiner and Kleckner 1994; unpubl.) and then restored early in meiotic prophase, independent of both recombination initiation [double-strand breaks (DSBs)] and SC formation, which play later roles in homolog juxtaposition (Loidl et al. 1994; Weiner and Kleckner 1994). Premeiotic and early meiotic pairing are strongly analogous, most notably the absence of any obvious dependence on chromosomal interruptions; but the meiotic process is uniquely dependent on certain meiosis-specific functions (e.g., SPO11; Loidl et al. 1994; Weiner and Kleckner 1994).
The current study utilizes the fluorescence in situ hybridization (FISH) assay developed previously for analysis of meiotic pairing to demonstrate that homologs of budding yeast, Saccharomyces cerevisiae, are paired during the vegetative life cycle and to investigate modulation of pairing status in several situations.
Results
Homolog pairing in premeiotic and pheromone-arrested G1 cells
A cytological assay for homolog pairing that does not require visualization of morphologically individualized chromosomes has been applied previously to premeiotic and meiotic yeast cells (Weiner and Kleckner 1994). Nuclear contents spread on a glass slide are subjected to FISH with two differentially labeled probes, “green” and “red”, corresponding to two different loci (Fig. 1A). The chromosomes in these preparations are highly dispersed, likely to the level of nucleosomal filaments, as judged from the array of distances between two probes on the same chromosome (Weiner and Kleckner 1994), and are spread over an area about ten times the diameter of an intact nucleus. Thus, direct physical contacts between homologs are sensitively detected above the background from chance colocalization of allelic loci on unconnected homologs (or on connected homologs but far from a connection point). If sister chromatids are absent, or tightly associated, each probe reveals either two foci, distinct or partially overlapping, or a single symmetrical focus.
Figure 1.
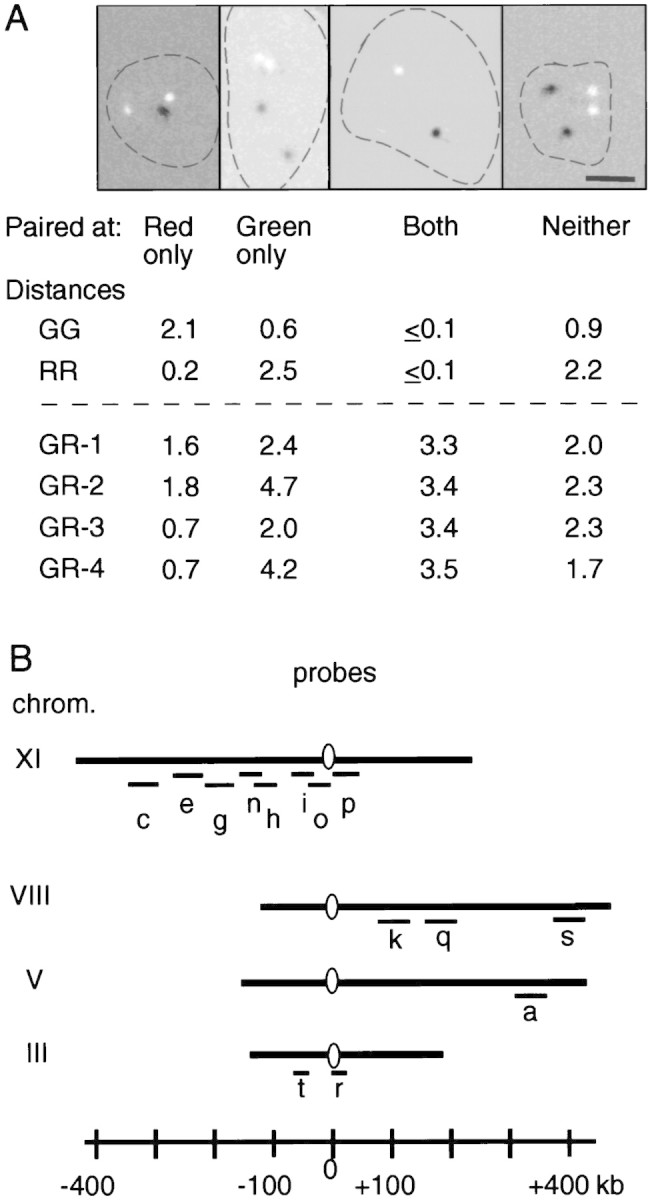
FISH analysis. (A) Images obtained by hybridization of two probes labeled with digoxigenin (green probe, shown in white) or dinitrophenyl (red probe, shown in black) to DNA in spread nuclei from hypotonically lysed cells. DNA was visualized by DAPI staining (demarcated by broken line). Images were digitally collected and processed to determine the distances between all pairs of hybridizing signals (RR, GG, and GR1–GR4). Examples of the four observed classes of nuclei and corresponding measured distances (μm) between signals are given. Homologs separated by ≤0.7 μm are considered to be paired (Weiner and Kleckner 1994). Bar, 2 μm. (B) Probes used.
In each of ∼50 different nuclei, the distance between the homolog foci is measured for each probe; the four distances between nonallelic loci are also measured as controls for fortuitous juxtaposition of unconnected regions (GG, RR, and GR1–GR4; Fig. 1A). Each of the six sets of interprobe distances is then arrayed in rank order, from smallest to largest (e.g., Fig. 2). The extent to which the two arrays of homologous distances fall below the four arrays of nonhomologous distances provides a general impression of homolog pairing. More specifically, the occurrence of allelic probes separated by a distance of 0.7 μm or less, that is, with the two fluorescent foci touching or nearly so, corresponds to the presence of an interhomolog pairing contact somewhere near the probed region (Weiner and Kleckner 1994). Uncorrected pairing levels, Gobs and Robs, are given by the rank plots (e.g., Fig. 2A); more accurate values, Gtot and Rtot, are obtained by subtraction of background from fortuitous colocalization as given by the array of nonallelic distances (Table 1).
Figure 2.
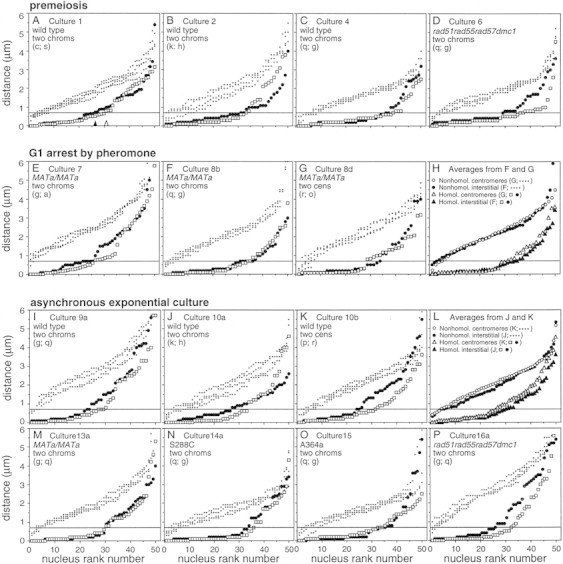
Ranked homologous and nonhomologous foci distances from premeiotic, pheromone-arrested, and cycling cells. In each panel, the six distances among pairs of hybridization signals (Fig. 1A) are individually ranked from the smallest to largest. (□) RR; (●) GG; (♦) GR1–GR4. The cutoff limit for pairing (d ≤ 0.7 μm) is indicated by a horizontal line for each plot. Robs and Gobs are indicated for A by open and solid arrowheads, respectively. All cultures are SK1 MATa/MATα unless otherwise noted; all data are from Table 1. Loci probed are listed within each panel.
Table 1.
Pairing levels in premeiotic, arrested, and cycling cells
|
Condition (genotype)
|
Culture
|
Loci probed (red; green)
|
Pairing
levelb
|
Comparison type (%)
|
Bionomial analysis (cA)
|
Pairing
level in A (Rtot/A;
Gtot/A)
|
|
|---|---|---|---|---|---|---|---|
|
obs.(Robs;
Gobs)
|
obs. − bkgd.(Rtot;
Gtot)
|
||||||
| Premeiosis | |||||||
| wild type | 1 | c; s | 0.60; 0.54 | 0.49; 0.43 | two chroms. | 0.88 | 0.56; 0.49 |
| wild type | 2 | k; h | 0.67; 0.64 | 0.58; 0.55 | two chroms. | 0.88 | 0.66; 0.63 |
| wild type | 3 | r; g | 0.66; 0.58 | 0.49; 0.41 | two chroms. | 0.82–0.83 | 0.59; 0.50 |
| wild type | 4 | q; g | 0.78; 0.74 | 0.64; 0.60 | two chroms. | 0.98–0.99 | 0.65; 0.61 |
 = 0.52 + 0.08 = 0.52 + 0.08 |
(two chroms.) |
 = 0.89 + 0.07 = 0.89 + 0.07 |
 = 0.59 + 0.07 = 0.59 + 0.07 |
||||
| 4 × recA | 5 | c; k | 0.46; 0.65 | 0.31; 0.51 | two chroms. | 0.81 | 0.38; 0.63 |
| 4 × recA | 6 | q; g | 0.74; 0.62 | 0.64; 0.52 | two chroms. | 1.00 | 0.64; 0.52 |
 = 0.50 + 0.14 = 0.50 + 0.14 |
(two chroms.) |
 = 0.91 + 0.13 = 0.91 + 0.13 |
 = 0.54 + 0.12 = 0.54 + 0.12 |
||||
| Arrest by pheromone | |||||||
| a/a | 7 | g; a | 0.54; 0.52 | 0.53; 0.51 | two chroms. | 0.99–1.0 | 0.53; 0.51 |
| a/a | 8a | g; a | 0.56; 0.44 | 0.51; 0.39 | two chroms. | ∼1 | 0.51; 0.39 |
| a/a | 8b | q; g | 0.70; 0.72 | 0.65; 0.67 | two chroms. | 0.92–0.93 | 0.70; 0.72 |
| a/a | 8c | n; e | 0.68; 0.60 | 0.61; 0.53 | one chrom. | 0.84–0.86 | 0.72; 0.62 |
| a/a | 8d | r; o | 0.55; 0.68 | 0.46; 0.59 | two cens. | 0.93–0.94 | 0.49; 0.63 |
 = 0.55 + 0.09 = 0.55 + 0.09 |
(two chroms.+ two cens.) |
 = 0.96 + 0.04 = 0.96 + 0.04 |
x = 0.56 + 0.11 | ||||
| Exponential | |||||||
| wild type | 9a | g; q | 0.64; 0.49 | 0.56; 0.44 | two chroms. | ∼1 | 0.56; 0.44 |
| wild type | 9b | g; o | 0.50; 0.54 | 0.34; 0.38 | one chrom. | 0.74–0.78 | 0.45; 0.50 |
| wild type | 10a | k; h | 0.66; 0.53 | 0.51; 0.38 | two chroms. | 0.91–0.94 | 0.55; 0.41 |
| wild type | 10b | p; r | 0.63; 0.50 | 0.53; 0.40 | two cens. | ∼1 | 0.53; 0.40 |
| wild type | 11a | q; g | 0.74; 0.68 | 0.67; 0.61 | two chroms. | ∼1 | 0.67; 0.61 |
| wild type | 12a | n; s | 0.42; 0.31 | 0.36; 0.25 | two chroms. | 0.74–0.76 | 0.48; 0.33 |
| wild type | 12b | h; c | 0.39; 0.48 | 0.20; 0.29 | one chrom. | 0.68 | 0.29; 0.43 |
| a/a | 13a | g; q | 0.59; 0.59 | 0.51; 0.51 | two chroms. | 0.77 | 0.66; 0.66 |
| a/a | 13b | n; e | 0.62; 0.51 | 0.41; 0.30 | one chrom. | 0.91–0.92 | 0.45; 0.33 |
| (S288C) wild type | 14a | q; g | 0.72; 0.66 | 0.63; 0.58 | two chroms. | 0.97 | 0.65; 0.60 |
| (S288C) wild type | 14b | n; e | 0.61; 0.57 | 0.43; 0.39 | one chrom. | 0.87–0.89 | 0.49; 0.44 |
| (A364a) wild type | 15 | q; g | 0.70; 0.72 | 0.61; 0.63 | two chroms. | 0.91–0.92 | 0.67; 0.69 |
 = 0.46 + 0.13 = 0.46 + 0.13 |
(two chroms.+ two cens.) |
 = 0.92 + 0.10 = 0.92 + 0.10 |
 = 0.56 + 0.11 = 0.56 + 0.11 |
||||
| (one chrom.) |
 = 0.81 + 0.11 = 0.81 + 0.11 |
 = 0.42 + 0.07 = 0.42 + 0.07 |
|||||
| 4 × recA | 16a | g; q | 0.64; 0.52 | 0.63; 0.50 | two chroms. | 0.89 | 0.70; 0.56 |
| 16b | n; e | 0.47; 0.52 | 0.36; 0.41 | one chrom. | 0.85–0.88 | 0.42; 0.47 | |
 = 0.48 + 0.12 = 0.48 + 0.12 |
|||||||
| Arrest by nocodazole | |||||||
| wild type | 11b | q; g | 0.28; 0.49 | 0.23; 0.44 | two chroms. | 0.95–0.98 | 0.24; 0.46 |
| wild type | 11c | q; g | 0.28; 0.36 | 0.12; 0.20 | two chroms. | 0.70–0.95 | 0.14; 0.24 |
| wild type | 17 | h; t | 0.06; 0.26 | 0; 0.21 | two chroms. | all values fit | 0.0; 0.20 |
| wild type | 18 | k; p | 0.50; 0.50 | 0.30; 0.30 | two chroms. | 0.86–0.94 | 0.33; 0.33 |
| (two chroms.) |
 = 0.90 + 0.07 = 0.90 + 0.07 |
 = 0.24 + 0.14 = 0.24 + 0.14 |
|||||
| wild type | 19 | n; c | 0.40; 0.26 | 0.24; 0.10 | one chrom. | 0.62–0.67 | 0.37; 0.16 |
| a/a | 20 | n; e | 0.32; 0.43 | 0.29; 0.40 | one chrom. | 0.70–0.71 | 0.41; 0.57 |
 = 0.24 + 0.12 = 0.24 + 0.12 |
(one chrom.) |
 = 0.68 + 0.04 = 0.68 + 0.04 |
 = 0.38 + 0.15 = 0.38 + 0.15 |
||||
| Arrest by DNA damage | |||||||
| cdc13-1ts | 21 | q; g | 0.33; 0.41 | 0.23; 0.31 | two chroms. | no A | —; — |
| cdc13-1ts | 22 | g; q | 0.56; 0.46 | 0.50; 0.40 | two chroms. | no A | —;— |
| cdc13-1ts | 23a | h; k | 0.1; 0.14 | 0.06; 0.10 | two chroms. | 0.41–1 | 0.09; 0.14 |
| cdc13-1ts | 23b | h; k | 0.33; 0.35 | 0.23; 0.25 | two chroms. | 0.71–0.75 | 0.32; 0.34 |
| cdc13-1ts | 23c | k; g | 0.35; 0.45 | 0.25; 0.35 | two chroms. | 0.60–0.65 | 0.40; 0.56 |
| cdc13-1ts | 23d | k; g | 0.20; 0.24 | 0.14; 0.18 | two chroms. | 0.39–0.45 | 0.33; 0.43 |
 = 0.25 + 0.13 = 0.25 + 0.13 |
(two chroms.) |
 = 0.62 + 0.14 = 0.62 + 0.14 |
 = 0.33 + 0.15 = 0.33 + 0.15 |
||||
The genotype relevant to the experiment is shown; other strain features are described in Materials and Methods. Cultures were prepared using the following strains: 1 and 12 (NKY278); 2, 4, 11, 17, and 19 (NKY1098); 3 (NKY3210); 5, 6, and 16 (NKY2736); 7, 8, 13, and 20 (NKY475); 9 (YBY25); 10 (NKY3077); 14 (NKY3061); 15 (NKY3189); 18 (NKY1380); and 21–23 (NKY2597).
For each hybridization experiment, Robs and Gobs represent the fraction of nuclei in which either the two red or the two green loci were scored as paired, respectively (d ≤ 0.7 μm apart; n ≅ 50 nuclei). A background pairing level was determined for each hybridization experiment by finding the fraction of distances between nonhomologous pairs of loci that are ≤0.7 μm apart (n ≅ 200 measurements). Rtot and Gtot represent pairing levels after subtraction of background. For each set, the mean and the standard deviation are reported. Mean pairing levels for the cdc13-1ts and the nocodozole-arrested cultures differ significantly from the mean pairing level in α-pheromone-arrested cultures (P < 0.001 by two-tailed t-test). Mean pairing levels for the premeiosis culture arrested in G1/G0 do not differ significantly from the mean pairing level of the α-pheromone-arrested cultures (P > 0.1 by two-tailed t-test).
For description of binomial analysis, see text and Materials and Methods. If a value of A is given, the distribution of nucleus types for that value match the observed distribution exactly. A value of A reported as ∼1 implies that no exact match could be found but that the degree of match increased with increasing A and was nearly perfect at A = 1; this situation likely reflects statistical sample variation around a very high value of A. Cultures 21 and 22 (no A found) are discussed in the text. For culture 17 all values of A fit; therefore, it was not included in the mean value of A for this set. For cultures in which A is ∼1, a value of 1 was used to calculate the mean value of A and for the Rtot/A and Gtot/A calculation. For cultures in which a range of A values were found, the median value for A was used for further calculations.
In premeiotic diploid SK1 cells, which are in G1, the pairing level is ∼0.5 at any probed locus (Weiner and Kleckner 1994). In the current study, premeiotic pairing levels ranged from 0.41 to 0.64 (mean = 0.52) at seven different loci located on various chromosomes and at various positions relative to their respective centromeres and telomeres (Figs. 1B and 2A–C; Table 1). The same result is obtained in SK1 MATa/MATa cells arrested at G1 by exposure to mating pheromone, with pairing levels ranging from 0.39 to 0.67 (mean = 0.55) for seven different probes (Fig. 2E–G; Table 1).
Nonspecific clustering of centromeres is prominent in yeast cells at most stages of the cell cycle and at G1 pheromone arrest (Guacci et al. 1997; Jin et al. 1998). If clustering were maintained in spread samples, allelic loci on homologs might tend to fall closer together simply because they lie at similar distances from their respective centromeres, irrespective of direct pairing contacts. If present, centromere clustering should be detectable by a tendency for two nonhomologous centromere-linked loci to lie closer together than two nonhomologous interstitial loci. This is not observed: The array of nonhomologous distances (GR1–GR4) for two nonhomologous centromere-linked loci is indistinguishable from the array of distances for two nonhomologous interstitial loci located at equal distances from their respective centromeres (Fig. 2, F vs. G; averages compared in H). Moreover, the fraction of nuclei in which the nonhomologous loci fell within d ≤ 0.7 μm (where d is for distance) was very low, in both cases (≤9%), as expected from the absence of direct pairing connections (Fig. 2F–H; Table 1). Finally, homolog pairing levels for allelic centromere-linked loci and allelic interstitial loci are essentially indistinguishable (Fig. 2F–H). We conclude that nonspecific centromeric clustering is undetectable in these samples.
Homolog pairing in exponentially dividing cells
Exponentially growing SK1 cells give results very similar to those observed in premeiotic and pheromone-arrested G1 cells (Fig. 2I–K; Table 1). Pairing levels ranged from 0.20 to 0.67 (mean = 0.46) at 11 different loci representing various positions in the genome (Table 1). Comparable results are seen in two other strain backgrounds, S288C and A364a (Fig. 2N,O; Table 1). Finally, just as in pheromone-arrested cells, nonhomologous centromeric loci exhibit no tendency for association, whereas homologous centromeric loci exhibit the same degree of pairing as interstitial loci (Fig. 2J–L; Table 1).
Analysis of asynchronously dividing cells has the additional potential complication that sister chromatids are present and are likely to be separated for at least some fraction of the cell cycle. The actual fraction of nuclei in which sister chromatids are discernibly separated is, however, quite small (Materials and Methods), likely because most cells are in the G1, S, or G2 stages of the cell cycle, in which sisters are either absent or so closely juxtaposed as to give a single signal (Guacci et al. 1994; Weiner and Kleckner 1994 and below; Yang 1997). In any case, a small amount of sister separation could only tend to give a small underestimate of homolog pairing because any nucleus in which homologous nonsister chromatids are paired, but with sisters well separated, would be (mis-)scored as a nucleus in which pairing is absent.
We conclude that homologs are paired in mitotically cycling diploid yeast cells. Furthermore, because pairing levels in asynchronous culture are very similar to those observed in a uniform G1 population, pairing appears to be present throughout most of the mitotic cell cycle.
Somatic and premeiotic pairing are independent of recA homologs
Mitotic and meiotic recombination in yeast is strongly dependent on recA homologs RAD51, RAD55, RAD57, and (for meiosis) DMC1. RecA homologs are thought to coat 3′ single-stranded DNA tails and to promote invasion of an intact partner duplex (Smith and Nicolas 1998). Homolog pairing was examined in nuclei of premeiotic and asynchronously growing cells of a strain deleted for all four recA homolog genes. In both cell types, the rad51 rad55 rad57 dmc1 mutant is indistinguishable from an isogenic wild-type strain (Fig. 2, cf. P with I and D with C; Table 1).
Homolog pairing is independent of mating type heterozygosity
Many diploid-specific functions in yeast are dependent on heterozygosity at the mating-type locus (for review, see Herskowitz et al. 1997). Homolog pairing is not: High pairing levels are observed in nuclei of MATa/MATa cells after pheromone arrest (above) and during exponential growth [cf. with the isogenic MATa/MATα diploid at each of four probed loci (Fig. 2 M vs. I; Table 1)].
Homolog colocalization via multiple interstitial interactions
For premeiotic cells, ∼50% of nuclei exhibit pairing at each locus examined. One explanation for this finding would be that homolog pairing is absent in 50% of cells and present with 100% probability in the other 50%. Further analysis revealed, however, that essentially all cells exhibit homolog pairing, but with a 50% probability of a pairing contact occurring at a given locus in any given nucleus (Weiner and Kleckner 1994). Thus, homologs are coaligned along their lengths via multiple interstitial interactions, but with variations in the positions of those interactions amongst different nuclei. This conclusion was reached as follows:
Analyzed nuclei exhibit one of four possible types of pairing configurations at two probed loci: pairing at Red-only, Green-only, Both loci, or Neither locus (R, G, B, or N; Fig. 1A). If pairing is occurring in all cells, independently at the two probed loci, the frequencies of the four nucleus types observed experimentally will match those predicted by the binomial distribution from the total pairing levels at each of the two loci: R-only = (Rtot) (1 − Gtot); G-only = (Gtot)(1 − Rtot); B = (Rtot)(Gtot); N =(1 − Rtot)(1 − Gtot). Alternatively, given a fraction of “pairing active” cells (A), in which the two loci are behaving independently, and a fraction of “pairing inactive” cells (1 − A), pairing levels would be zero in the latter fraction and higher than the population average in the former (Gtot/A and Rtot/A). In the ideal case, A = 1. In other cases, A < 1. For example, an average pairing level of 0.5 could occur if 50% of cells were active and 50% were inactive (A = 0.5), with a pairing level of 1.0 in the active fraction.
For any given hybridization sample, it can be determined whether a value of A can be found for which the predicted distribution of nucleus types (R, G, B, and N) matches that observed, and if so, what that value of A might be (Weiner and Kleckner 1994; Materials and Methods). For premeiotic cells, the data always fit a value of A that is close to 1: A = 0.82–0.99; mean of A = 0.89 (Table 1), as seen previously (e.g., A = 0.85; Weiner and Kleckner 1994). The corresponding pairing levels in the active fraction range from 0.49 to 0.66 (mean of 0.59; Table 1). Thus, essentially all nuclei are active for pairing and each probed locus has a ∼60% chance of being at or near enough to a pairing contact to give d ≤ 0.7 μm and a ∼40% chance of being far enough away that homologous loci appear unconnected.
Nuclei of pheromone-arrested G1 cells and of exponentially growing cells give the same results as premeiotic cells, except that the fraction of active nuclei tends to be even higher (Table 1; two chromosome data). For G1-arrested cells, the mean optimal value of A = 0.96 (range 0.92–1). For exponential cultures, the mean optimal A = 0.92 (range 0.74–1), with comparable results in wild-type cells of all three analyzed strain backgrounds and in the SK1 quadruple recA mutant. Pairing levels for the active fraction are again high in all cases (Table 1): In G1-arrested cells, 0.39–0.72 (mean of 0.56); in exponential cultures, 0.33–0.69 (mean of 0.56). We conclude that homologs are coaligned along their lengths, via multiple interstitial interactions, in essentially all nuclei of both pheromone-arrested G1 and mitotically cycling cells just as in premeiotic cells.
Notably, premeiotic, G1-arrested, and mitotically cycling cells all give high levels of A even though there is some fluctuation in Rtot and Gtot values between experiments (Table 1). Overall, there is no tendency for different probes to behave differently. Most of the observed fluctuations are due to experimental variation, however, some probe differences could be meaningful (e.g., some loci may tend to be near sites of preferred pairing interactions).
Given certain additional assumptions, the estimated average distance between pairing contacts can be estimated; premeiotic, pheromone-arrested, and vegetative cultures all give the same value, about one contact per ∼60–80 kb (Weiner and Kleckner 1994; Materials and Methods).
Well-separated loci on the same chromosome also exhibit independent pairing
For premeiotic nuclei probed at a pair of loci located ∼200 kb apart on the same chromosome, the distribution of nucleus types can be described by the binomial distribution, with the same high values of A (i.e., the active fraction) as pairs of loci located on nonhomologous chromosomes. This finding implied that loci on the same chromosome can behave rather independently (Weiner and Kleckner 1994). The same situation is observed here in nuclei of pheromone-arrested and exponentially growing cultures: Several pairs of loci separated by ∼90–175 kb also exhibit substantially independent pairing (see “one chromosome” analyses in Table 1; A = 0.85 in a pheromone-arrested culture and mean value of A = 0.81 in four exponential cultures).
Variations in pairing during the mitotic cell cycle
Homolog pairing was examined in nuclei from a culture of diploid MATa/MATa cells proceeding synchronously through a single cell cycle following release from pheromone arrest. Samples taken just prior to release (t = 0 min), and at suitable time points thereafter, were analyzed by FISH, for cell and nucleus morphology, by phase contrast and fluorescence microscopy of DAPI-stained cells, and for cellular DNA content by FACS.
The cell population proceeds synchronously through four stages corresponding approximately to G1 (no bud), S (small bud), G2/M (large bud and asymmetrically positioned nucleus), and late anaphase (DNA extended between mother and daughter cell), and then returns to a telophase/G1 nucleus morphology, without or with cell separation (Fig. 3A,B). The life spans of the three middle stages, inferred from the areas under the corresponding noncumulative curves, were 12, 8, and 11 min, respectively. The overall timing with which the population exits each stage and enters the next is given by corresponding cumulative curves (Materials and Methods). Notably, these curves are rather steep, with similar slopes for both early and late stages, implying a high degree of synchrony throughout the experiment. Bulk DNA replication was in progress in most or all cells at t = 40 and t = 45 min (Fig. 3C; arrows in A and C), approximately contemporaneous with, but somewhat longer than, the small bud morphology stage (data not shown).
Figure 3.

Homolog pairing in synchronously dividing cells. Diploid MATa/MATa cells were released from pheromone arrest at t= 0 min. (A) Percentage of cells in each morphological class. (B) Cumulative curves showing the entry into and exit from each morphological category were calculated from the plots shown in A. The cumulative curve describing the exit from G1 was calculated from the noncumulative plot of [1 − (%G1)] (not shown). (C) FACS and FISH analysis with probes to two chromosomes at representative time points (□ red probe q; ● green probe g). Solid and open arrows indicate the 40- and 45-min time points, when most cells are in S phase.
FISH analysis was performed with three different pairs of probes: (q) and (g), located on two different chromosomes, each ∼200 kb from its respective centromere (two chromosomes); (i) and (g), located ∼150 kb apart on the same chromosome (one chromosome); and (r) and (p or o), centromere-linked on nonhomologous chromosomes (two centromeres) (Fig. 1B). Pairing levels at all loci probed are very high in the arrested G1 cells (at t = 0 min), are strongly reduced at t = 40 and t = 45 min when most cells are in S phase, and then return to a high level at t = 50 min when most cells are in G2. This pattern is observable qualitatively in rank plot data (e.g., Fig. 3C) and quantitatively in corrected pairing levels at individual loci (Fig. 4A) and in mean pairing levels for all loci (0.59 at t = 0 min, 0.23 and 0.30 at t = 40 and t = 45 min, respectively; and 0.52 at t = 50 min; Table 2). Furthermore, for each locus combination, at the two S-phase time points, the frequency of nuclei that exhibits pairing at both loci decreases, whereas the frequency that exhibit pairing at neither locus increases; then, at t =50 min, the distribution returns to one closely resembling t = 0 min (Fig. 4B).
Figure 4.

Pairing in synchronously dividing cells. (Arrows) S phase as in Fig. 3; (broken lines) onset of late anaphase according to nuclear morphology. (A) Observed pairing levels (Table 1). (B) Nucleus types (Fig. 1A). (C) Percentages of nuclei not engaged in pairing and the calculated duration of S-phase unpairing (see text). (D) Cumulative curves for entry into and exit from unpairing (see text). Shaded region shows entry into and exit from the small bud morphology stage (relevant curves in Fig. 3). At t=0 min, probes R- (r) and G- (o) were used.
Table 2.
Pairing in synchronous mitotic cultures
|
Phase and
samplea
|
Pairing
levels
|
Binomial analysis
|
||
|---|---|---|---|---|
|
Robs;
Gobs
|
Rtot;
Gtot
|
A
|
Rtot/A;
Gtot/A
|
|
| G1 | ||||
| t = 0 min | ||||
| two chroms. | 0.70; 0.72 | 0.65; 0.67 | 0.92–0.93 | 0.70; 0.72 |
| one chrom. | 0.68; 0.60 | 0.61; 0.53 | 0.83–0.85 | 0.72; 0.62 |
| two cens. | 0.55; 0.68 | 0.46; 0.59 | 0.93–0.94 | 0.49; 0.63 |
 = 0.59 + 0.08 = 0.59 + 0.08 |
 = 0.65 + 0.09 = 0.65 + 0.09 |
|||
| S | ||||
| t = 40 min | ||||
| two chroms. | 0.28; 0.28 | 0.22; 0.22 | no A | —;— |
| one chrom. | 0.24; 0.24 | 0.19; 0.19 | 0.86–0.97 | 0.21; 0.21 |
| two cens. | 0.38; 0.42 | 0.26; 0.30 | 0.68–0.74 | 0.37; 0.42 |
 = 0.23 + 0.04 = 0.23 + 0.04 |
 = 0.30 + 0.11 = 0.30 + 0.11 |
|||
| t = 45 min | ||||
| two chroms. | 0.32; 0.26 | 0.27; 0.21 | 0.88–0.89 | 0.31; 0.24 |
| one chrom. | 0.28; 0.30 | 0.24; 0.26 | 0.53 | 0.45; 0.49 |
| two cens. | 0.44; 0.62 | 0.31; 0.49 | no A | —;— |
 = 0.30 + 0.10 = 0.30 + 0.10 |
 = 0.37 + 0.12 = 0.37 + 0.12 |
|||
| G2 | ||||
| t = 50 min | ||||
| two chroms. | 0.49; 0.51 | 0.47; 0.49 | 0.84–0.86 | 0.55; 0.58 |
| one chrom. | 0.68; 0.66 | 0.60; 0.58 | no A | —;— |
| two cens. | 0.52; 0.68 | 0.41; 0.57 | 0.96–0.97 | 0.43; 0.59 |
 = 0.52 + 0.07 = 0.52 + 0.07 |
 = 0.54 + 0.07 = 0.54 + 0.07 |
|||
| ∼G1 | ||||
| t = 85 min | ||||
| two chroms. | 0.48; 0.58 | 0.40; 0.50 | 0.80 | 0.50; 0.62 |
 = 0.45 + 0.07 = 0.45 + 0.07 |
 = 0.56 + 0.09 = 0.56 + 0.09 |
|||
Pairing levels and binomial analysis are reported as in Table 1. Data for the t = 0-min samples are repeated from Table 1. The mean pairing levels for t = 40- and t = 45-min time points differ significantly from the mean pairing level observed for the t = 0-min time point (P < 0.001 by two tailed t-test). There is no significant difference between the mean pairing level at the t = 0-min time point and the mean pairing level at either the t = 50- or the t = 85-min time points (P > 0.1 and P > 0.05, respectively).
The samples and probes used are the same as those described in Fig. 4.
The appearance of sister chromatids does not appear to create any ambiguity in interpretation of focus patterns in S-phase samples. Nuclei in the t = 0- and t = 40-min samples that contained two or more foci, which would have been scored as lacking homolog pairing, were reexamined carefully with this possibility in mind. At t = 40 min there was a significant increase in the fraction of foci that appeared as asymmetric dumbbells, rather than symmetric circles, but there was no increase in the number of nuclei with three or four well-separated spots. This suggests that sisters are often slightly separated during S phase but that they are almost never far enough apart to have been mis-scored as unpairing of homologs.
At t = 55 and t = 60 min, the percentage of nuclei exhibiting a single focus at each individual locus (d≤ 0.7 μm) or at neither probed locus is increased, whereas the percentage of nuclei showing a single focus at both probed loci is reduced (Fig. 4A,B). Because ∼40% of cells are at late anaphase in both samples, these effects could, in principle, reflect either loss of homolog pairing and/or loss of intersister contacts. Although further analysis is clearly needed, we favor the view that homolog pairing is retained throughout the period of chromosome segregation, at or near full levels, and that the observed effects reflect primarily loss of intersister cohesion. In the t = 60-min sample, the fraction of nuclei containing one, two, three, or four foci fits closely a scenario in which all nuclei exhibit full levels of homolog pairing and the late anaphase nuclei all exhibit fully separated sister chromatids and is compatible with full loss of homolog pairing in all late anaphase cells only if it is assumed that sisters are still together in 75% of such cells (Materials and Methods). Because sisters should be fully separated at this stage, and because DNA is spread uniformly between widely separated poles at late anaphase (Straight et al. 1997; Yang et al. 1997), this scenario, although not specifically excluded, seems unlikely.
By the final time point of the experiment, t = 85 min, pairing levels are high, as shown by the two chromosomes analysis (Fig. 4A). Most cells in this sample are in the G1 phase following the synchronous mitosis. Thus, G1 pairing is a natural feature of the G1 stage of the cell cycle, not simply a peculiarity of pheromone or premeiotic arrest. The fact that pairing levels are high in asynchronous cultures, in which G1 cells comprise the majority class (e.g., Fig. 5C), leads to the same conclusion.
Figure 5.

Pairing in G2/M-arrested cells. (A, a–c) FISH analysis of exponentially growing cells from culture 11 (MATa/MATα, SK1; Table 1) before and after treatment with nocodazole. (B) Parallel analysis of wild-type and cdc13-1ts cultures grown to mid-log phase at 23°C (d,f) and shifted to 37°C for 2 hr (e,g). (C) Distribution of cells among morphological classes for all samples analyzed in A and B. (##) In cdc13-1ts arrested cells, no true late anaphase cells were seen; instead, a thin thread of DAPI-stained material from the bulk nuclear mass extended through the bud neck and into the bud cell.
Complex program of pairing disruption during S phase
Population average behavior
The five loci examined with regard to pairing status during the cell cycle exhibit somewhat different behaviors when considered on a population average basis.
First, different probed loci remain unpaired for different lengths of time during S phase. If the fraction of nuclei showing paired loci at t = 0 min is defined as 100%, the ratio of the (background corrected) pairing level at t = t min to that at t = 0 min gives the fraction of nuclei that are in the unpaired state at the later time point. A plot of fractional unpairing as a function of time (Fig. 4C) gives a noncumulative unpairing curve, the area under which gives the duration of the unpaired condition for the locus in question. These durations are ∼11–15 min at the three interstitial loci and significantly shorter at the two centromeric loci, ∼5 and ∼8 min, suggestive of special behavior in centric regions. Second, cumulative curves for unpairing and repairing calculated from the noncumulative curves show that the two centromeric loci tend to enter the unpaired condition later than any of the interstitial loci, whereas exit from the unpaired condition seems to occur at about the same time for all loci (Fig. 4D).
Notably, also, unpairing periods for all five loci examined are shorter than the likely duration of S phase, ∼15–20 min under the conditions used here (Campbell and Newlon 1991; R. Cha and N. Kleckner, unpubl.), suggesting that pairing is usually disrupted at any given locus for only a fraction of the replication cycle. Correspondingly, for each locus, the period of unpairing corresponds to part or all of the small bud morphology stage (Fig. 4D).
Binomial distribution analysis of locus pairs
G1 nuclei can be described as a mixture of two populations, a very small fraction of cells in which pairing is absent and a large majority of cells in which pairing is occurring independently at the two probed loci (above); in the parlance of the binomial distribution analysis, an acceptable value of A can be found, and that value is close to 1. If the same approach is applied to cells undergoing pairing disruption, pairing might be lost at the two probed loci either (1) independently, (2) coordinately, (i.e., in a positively correlated way), or (3) in a negatively correlated way. In the first case, the value of A will remain high and the average pairing levels for the two loci will be reduced. In the second case, the fraction of cells that are pairing active (with respect to the two loci being examined) will decrease, that is, A will be reduced, but the level of pairing in the remaining cells will remain high. In the third case, no value of A can be found at which the predicted distribution of nucleus types matches the observed distribution (i.e., there is no acceptable value of A. The best fit will occur at A = 1 but with residual deficits of B and N nuclei and excesses of R and G nuclei; not shown).
As shown in Table 2, it appears that all three of these situations pertain, depending upon the pair of loci probed and the time point. Of the six t = 40- and t = 45- min samples, two come close to meeting the predictions of simple independent pairing disruption (one chromosome at t = 40 min and two chromosomes at t = 45 min). Two others appear to exhibit a mixture of independent and coordinate disruption, with both a significantly reduced value of A and a reduced average pairing level in the active fraction (two centromeres at t = 40 min and one chromosome at t = 45 min), and for the final two (two chromosomes at t = 40 min and two centromeres at t = 45 min), no acceptable value of A can be found, although a value of A = 1 is close to acceptable (not shown). This may reflect negatively correlated pairing disruption; alternatively, these samples may exhibit independent pairing disruption with failure to find an acceptable value of A attributable to statistical fluctuations in the distribution of nucleus types.
Implications
The findings presented above rule out the possibility that pairing is disrupted and reestablished synchronously at all loci in the genome. On a population average basis, different loci exhibit different kinetics of pairing disappearance and reappearance and exist in an unpaired condition for different lifespans. Furthermore, when the nature of pairing disruption is compared for different pairs of loci, different pairs behave differently, even within the same timepoint sample. These results further imply that disruption and/or restoration of pairing involves local and/or regional determinants.
Pairing disruption also appears to involve two additional types of determinants. First, although some pairs of loci may undergo pairing disruption independently of one another, others clearly do not, most notably, the two centromeres sample at t = 40 min. This nonindependence suggests the involvement of some type of genome-wide or nucleus-wide coordination. Second, the same pair of loci sometimes behaves differently at different time points, most notably, the two centromeres and the one chromosome cases. Because earlier and later samples will tend to contain cells that are at earlier or later points in S phase, this result is most simply interpreted as evidence for temporal modulation of pairing disruption. Temporal modulation could also explain nonindependent pairing absence, which could thus reflect a tendency for the two assayed loci to be unpaired either at the same time, or at different times, during S phase.
Pairing is disrupted in two types of G2-arrested cells
Pairing has been examined in yeast cells subjected to two different treatments known to trigger cell cycle arrest in G2; exposure to the microtubule inhibitor nocodazole, which triggers regulatory checkpoint arrest due to failure of chromosomes to become attached to a spindle (for review, see Rudner and Murray 1996) and cdc13-1ts temperature shift, which triggers RAD9-dependent DNA damage checkpoint arrest due to defective replication and processing of telomeres (Garvik et al. 1995). Both types of arrested cells have completed bulk DNA replication and do not exhibit sister chromatid separation (Weinert and Hartwell 1993, Guacci et al. 1994; data not shown).
Significant disruption of pairing was observed under both arrest conditions (Fig. 5A,B; Table 1). Nocodazole treatment caused overall average pairing levels to drop from 0.64 to 0.16 with probes q and g (Fig. 5A, a and c). When additional probes are considered, average pairing levels drop from 0.46 observed in untreated exponential cells to an average level of 0.24 (Table 1). Shift of cdc13-1ts cells to the nonpermissive temperature causes pairing levels to drop similarly, to 0.27 for the experiment shown with probes q and g (Fig. 5B, g), and to an average level of 0.25 for these and additional probes tested (Table 1). Pairing levels were high in the absence of nocodazole, in cdc13-1ts cells prior to the shift, and in isogenic wild-type cells either before or after incubation at high temperature.
Binomial distribution analysis suggests that pairs of loci in nocodazole-arrested cells usually exhibit a combination of coordinate and independent pairing disruption, though the degree of coordinate disruption (i.e., the reduction in A) is variable (Table 1). The fact that coordinate disruption is more prominent in the one-chromosome samples than in the two-chromosome samples may imply regionally controlled pairing disruption. Temperature-arrested cdc13-1ts cells exhibited dramatic coordinate pairing disruption in one experiment. In two other experiments, however, no acceptable value of A could be found and we favor the negatively correlated pairing disruption scenario: The data fit to A = 1 is quite poor (not shown) and with the deviations expected for that situation.
Discussion
Somatic pairing is present in vegetatively cycling yeast cells
The observations presented above indicate that direct pairing of homologs is a regular feature of diploid cells of budding yeast S. cerevisiae as observed in three different laboratory strain backgrounds. Somatic pairing is well documented in Diptera and, in somatic or premeiotic cells, in a number of plants. These findings extend the identification of this feature to another group of organisms, the fungi. The existence of homolog pairing in cycling budding yeast cells has not been revealed by previous studies despite intensive investigation of this organism. Identification of pairing in the current study is made possible by the unique advantages of the dispersed chromosome spreading method (above).
The somatic pairing described in yeast is inferred to occur via multiple interstitial interactions. Interactions occur at different positions in different nuclei analyzed. It remains to be determined whether the positions of the interactions change over time in a given nucleus. Because pairing is present in both G1 and G2 cells, it can occur in both the absence and the presence of sister chromatids. It is generally assumed that chromosomes are chemically intact both before and after S phase, therefore these findings support the idea that pairing occurs between chromosomes that lack nicks, gaps, or breaks in their DNA. Finally, somatic pairing is independent of recA homologs, implying that identification of homology at the chromosomal level during pairing is determined by processes other than those involved in searching for homology at the DNA level during recombinational repair.
Similar properties are exhibited in premeiotic and early meiotic cells (above; Weiner and Kleckner 1994). During meiosis, premeiotic pairing is disrupted during the ensuing S phase and is then restored in prophase (G2), independent of meiosis-specific DSBs. Analogously, in cycling cells, pairing is present in G1, lost during S phase, and restored in G2. These results provide strong circumstantial evidence that pairing occurs via fundamentally similar underlying mechanisms in all three cases. Meiotic pairing likely has additional special requirements, however, as indicated by its dependence on the meiosis-specific function SPO11 (Weiner and Kleckner 1994). Also, recA homolog mutations can affect the level of homolog colocalization during meiotic prophase (but not premeiotic G1) (Weiner and Kleckner 1994; Rockmill et al. 1995), although these proteins may play a role after DSB-independent pairing.
Homolog pairing is likely established at the time a diploid cell is first formed by conjugation of two haploid cells of opposite mating types. Pairing levels are high in a G1 condition induced by α factor. This is the same situation found during conjugation and karyogamy, where mitotic cell cycles of the two interacting cells are arrested in G1 by a and α pheromones, respectively (for review, see Marsh and Rose 1997).
Pairing disruption during S phase
Pairing contacts at any individual locus appear to be disrupted for only a portion of S phase. The program for loss and reestablishment of pairing contacts appears to be quite complex. Different loci behave differently; some pairs of loci sometimes behave nonindependently; and the same pair of loci exhibits different relative behaviors at different time points. These three features imply the involvement, respectively, of three types of determinants: local/regional, genome- or nucleus-wide, and temporal.
We favor the idea that disruption of pairing contacts is actively provoked by local/regional changes in chromosome/chromatin structure as directed by cell cycle regulatory signals. The temporal variation in pairing status would result from temporal changes in the nature or level of the regulatory signal; differences in timing at different loci would reflect differential sensitivities of different regions. It is already known that the timing with which a replication origin fires is determined by both its local environment and by cell cycle signals whose strength likely varies with time during S phase (Friedman et al. 1996; Donaldson et al. 1998). Pairing disruption could be mediated by the same, related, or different but analogous processes. This model can also account straightforwardly for disruption of pairing in G2-arrested cells (below).
An alternative model would be that pairing disruption is provoked by passage of the replication fork. The program of origin firing during yeast is rather complex, perhaps sufficiently so as to accommodate all of the observed effects. On the other hand, replication of seven tested centromeres occurs relatively early in S phase (McCarroll and Fangman 1988), whereas the current analysis suggests that unpairing at centromere-linked loci may occur later than in other regions. Furthermore, this model does not account for pairing disruption during G2 arrest.
Pairing disruption in G2-arrested cells
Absence of homolog pairing after nocodazole treatment or cdc13-1ts arrest would seem to be a specific consequence of the corresponding G2 checkpoint responses, although this remains to be documented by analysis of the effects of regulatory mutations. Pairing might be lost by programmed disruption of reestablished (G2) pairing contacts; alternatively, checkpoint arrest might prevent reestablishment of pairing in cells that have transited S phase under arrest conditions and then accumulated in G2.
In either case, the model favored above for S-phase pairing disruption could apply. This model is supported by the fact that both of the arrest conditions examined here are known to trigger chromosome compaction (Guacci et al. 1994). Furthermore, the effects of nocodazole are more uniform than the effects of cdc13-1ts arrest not only for pairing (above) but also for compaction (Guacci et al. 1994). Alternatives to the above model can be envisioned, of course. Dependence of homolog repairing after replication might be dependent on architectural features, or specific motors that bring chromosomes together, with nocodazole treatment blocking pairing by disrupting these components. Oppositely, arrest treatments might specifically keep homologous regions separated; for example, a nuclear-addressing feature might hold a given region of one homolog on one side of the nucleus and the corresponding region of its partner on the other side.
Interestingly, Marshall et al. (1997), studying how allelic GFP-tagged loci on homologs approach one another in real time, can describe their findings by random (diffusional) motion that is constrained within ∼1% the total volume of the nucleus, and this constraint is eliminated by treatment with nocodazole. The authors attribute the constraint to intranuclear microtubules. In light of the current findings, the constraint might alternatively be attributable to homolog pairing contacts.
Somatic pairing is generally similar in yeast and Drosophila
Recent studies of Drosophila suggest that pairing in that organism involves multiple interstitial interactions (Fung et al. 1998; Gemkow et al. 1998) and that pairing is disrupted during S phase of the mitotic cell cycle (Csink and Henikoff 1998), features analogous to those described here for yeast. Furthermore, in Drosophila, pairing is disrupted in euchromatic regions earlier in S phase than pairing in the centromeric heterochromatic regions (Csink and Henikoff 1998) and the data above suggest that in yeast, pairing in centromeric regions is disrupted later than in interstitial regions. Somatic pairing in the two organisms thus seems quite similar.
With regard to pairing status during anaphase, the situation is uncertain in both organisms. Classical cytological analyses in both Diptera (Metz 1916) and plants (e.g., Watkins 1935) suggest that, overall, homologs usually or often remain associated over at least some of their lengths throughout the process of chromosome segregation. In the current study, the scanty available data are also most consistent with significant persistence of homolog pairing during this period. Recent FISH analysis of pairing at specific loci in Drosophila suggests, however, that homolog pairing is sometimes absent at individual loci that have undergone sister chromatid separation (Fung et al. 1998). Perhaps pairing is lost or reduced, with some probability at some or all loci, but in such a way that overall association of homologous chromosomes is never fully lost.
Is homolog pairing disruption motivated by situations that require homolog/sister discrimination?
Why should homolog pairing be disrupted during S phase? One possibility could be that pairing contacts interfere with passage of the replication fork and thus must be eliminated to permit smooth fork progression. A more intriguing possibility, however, is that the persistence of pairing contacts creates confusion during the establishment of sister chromatid cohesion, which occurs during S phase (for review, see Nasmyth 1999). If sister–sister proximity plays an important role in determining their specific interaction, close proximity of a homolog might permit (unwanted) interactions to occur between homologous nonsister chromatids in addition to between sisters.
Why should homolog pairing be disrupted in conditions that cause arrest in G2 but not in conditions that cause arrest in G1? In G1 cells, sisters are absent; thus, if chromosomes are at risk from DNA damage, homolog pairing could be favorable because it promotes interhomolog recombinational repair. In G2 cells, in contrast, the presence of the homolog confers no such advantage because a sister chromatid is always present as a recombination partner; in fact, it is known that recombinational repair in yeast G2 diploid cells preferentially utilizes the sister as the intact template rather than a nonsister (Fabre et al. 1984; Kadyk and Hartwell 1993). It may be safer for recombinational repair to occur off of a sister, either for evolutionary reasons or because the formation of a crossover between homologs in a mitotic cell can lead to confusion in chromosome orientation at metaphase and thus to chromosome missegregation (Chua and Jinks-Robertson 1991; Kleckner 1996). Thus, it may make sense for the DNA damage checkpoint response to include disruption of homolog pairing contacts, which would then contribute to the observed intersister bias for repair. Analogously, for cells that are defective in attaching chromosomes to the spindle, the presence of pairing contacts (with resultant effects on sensing of tension) might exacerbate an already compromised situation.
Thus, as a unifying motivation, pairing status might be disrupted by various conditions in which there is a risk of, or a disadvantage to, confusion between homologs and sisters. This formulation makes programmed pairing disruption especially attractive because cells could specifically modulate pairing status to appropriate advantage. Passive loss of pairing contacts as a mechanical consequence of DNA replication, or possibly chromosome segregation, would not have this virtue.
This general formulation can be extended analogously to meiosis, not only during S phase but also during early prophase (i.e., G2). The meiotic recombination process has recruited both biochemical functions and checkpoint monitoring machinery from the mitotic recombinational repair process (Lydall et al. 1996; Xu et al. 1998). Moreover, certain mutants, notably hop1Δ, exhibit high levels of pairing by the assay used here in very early prophase nuclei (Weiner and Kleckner 1994) but reduced levels of pairing by a chromosome painting assay that requires progression to later stages of prophase where chromosomes are more compact (Loidl et al. 1994; Nag et al. 1995). Taken together, these considerations raise the possibility that early meiotic pairing contacts are disrupted, concomitant with DSB formation, as another role for the recruited mitotic repair process. In this case, the biological motivation might be to avoid confusion between early pairing contacts and the later, mechanically crucial interhomolog connections corresponding to crossovers/chiasmata. Moreover, it is not impossible that organisms that exhibit achiasmate meiosis (von Wettstein et al. 1984) have simply stopped at the end of the early stage, without progressing to DSB formation and loss of early pairing contacts, which are then used instead of crossing over to ensure homolog disjunction.
Materials and methods
Yeast
Yeast SK1 strains (Alani et al. 1990) were derived from NKY278 (MATa/MATα ho::LYS2/′′ lys2/′′leu2::hisG/′′ ura3/′′) with the following genotypic modifications: NKY1098 and NKY1380 (his4x::LEU2–URA3/HIS4::LEU2; Cao et al. 1990), NKY3077 (ho::hisG/′′ arg4::LEU2–pGPD–loxP–lacZ/arg4::LEU2–loxP–ura3; S.M. Burgess, unpubl.), YBY25 (GAL3/GAL3 arg4-Nsp/arg4-Bgl; Y. Blat, unpubl.), NKY3210 (trp::hisG/′′ arg4-Nsp/arg4-Bgl his4x::LEU2–URA3/his4b:LEU2, S.M. Burgess, unpubl.), NKY475 (MATa/MATa; made by UV irradiation of the diploid NKY278; Raymond 1990), and NKY2736 (rad51/rad51 rad55/rad55 rad57/rad57 dmc1/dmc1; Schwacha and Kleckner 1997). Non SK1 strains include: NKY2597 (A364a congenic strain, MATa/MATα cdc13-1/′′ his7/′′ ura3-52/′′ can1/′′ trp1/TRP1 leu2-3,112/LEU2, made from haploids 4078-13-3a and 4078-13-1b; Garvik et al. 1995), NKY3189 (A364a congenic strain MATa/MATα his7/′′ ura3-52/′′ trp1/TRP1 leu2-3, 112/ LEU2, made from haploids 4053-1-4a and 4053-1-4b generously provided by B. Garvik and L. Hartwell). NKY3061 (S288C strain MATa/MATα ura3-52/′′lys2-D202/′′trp1Δ63/′′leu2Δ1/′′ his3Δ200/′′; Winston et al. 1995). All strains were cultured at 30°C in YPD (1% yeast extract, 2% Bacto-peptone, and 2% glucose) or grown on YPD plates supplemented with 2% agar unless otherwise noted.
Analysis of FISH results
FISH analysis was performed essentially as described by Weiner and Kleckner (1994) (details available on request). Cosmid sources for probes (Fig. 1B) were as follows: the ATCC (a) ATCC70874; (k) ATCC70887; (q) ATCC70891; and (s) ATCC70890; B. Dujon (Institut Pasteur, Paris, France) (c) pEKG097; (e) pEKG081; (g) pUKG141; (h) pUKG133; (i) pEKG011; (n) pEKG080; (o) pUKG041; (p) pUKG047; (r) D12B (Newlon et al. 1991); (t)YIp300 (Donahue et al. 1982).
Distance between pairing contacts
Given the simplifying assumption that pairing contacts are approximately Poisson-distributed along the chromosomes, the probability of a pairing contact, per kilobase, along a pair of homologs can be estimated (Weiner and Kleckner 1994). The probability that a given nucleus will exhibit d ≤ 0.7 μm for a given probe is the probability that no pairing contact occurs anywhere within a certain number of kilobases to either side of the probed locus (±s/2). If pairing contacts occur at a probability of k per kilobase, the probability that no contact will occur over a distance s kilobases is P(0) = e−k(s). The value of P(0) is given by experimental data ([1 − (Rtot/A)] or [1 − (Gtot/A)]). Values for s can be calculated from one chromosome data. For premeiotic cultures analyzed with probes separated by 40 kb, s was ∼52 kb (Weiner and Kleckner 1994). For pheromone-arrested and exponentially dividing cultures, s was estimated to range from 62–67 kb as determined from cultures 8c, 13b, and 14b (Table 1) with probes n and e, which are each about 30 kb long and are located 60 kb apart on chromosome XI. Given a value of s, the value of k can be calculated. Premeiotic, pheromone-arrested G1 and exponential populations all give the same P(0) of ∼ 0.41–0.45; thus, in all three cases, k is ∼0.013–0.017 and average distances between pairing contacts are ∼60–80 kb.
Life-span calculations
The duration of a stage is given by the area under the corresponding noncumulative curve divided by the total fraction of nuclei progressing through the cell cycle (Padmore et al. 1991), assumed to be 100% at all time points. Cumulative curves describe what fraction of cells have either entered or completed a given event as a function of time: The curve is identical to the noncumulative curve plotted up to the first nonzero time point and one lifespan thereafter. Then for any time point (t) after one life span has elapsed, the cumulative curve value at t is equal to the noncumulative curve value at (t) plus the cumulative curve value at (t) minus one life span. The exit curve for any event is given by plotting entry curve at a rightward displacement along the x-axis by one life span (Figs. 3B and 4D).
Sister chromatid pairing status
Exponential cells: FISH analysis was performed on nuclei of a diploid strain hemizygous for an insertion at ADE2 of a mini-Tn10 transposon containing lacZ and kanR (Huisman et al. 1987) to permit examination of a single homolog. Among nuclei from an exponential culture of this strain, probed with sequences specific to the insert, 90% exhibited a single fluorescent focus, whereas 10% exhibited two foci, indicative of separated sisters. Probes to homozygous loci in these strains give similar results: The fraction of nuclei exhibiting more than two foci is very small.
Late anaphase: The fraction of nuclei containing one, two, three, or four foci per probed locus was determined very carefully for the two chromosome case at t = 0 min (0.57, 0.36, 0.07, and 0.00) and t = 60 min (0.47, 0.32, 0.18, and 0.03). The t = 0 min sample contains a few nuclei exhibiting three foci; as this sample contains no anaphase cells, such nuclei are assumed to have unpaired homologs plus an extra focus from nonspecific background. The t = 60 min distribution, corrected for this background, is 0.47, 0.40, 0.10, and 0.03. Assuming that 60% of cells are not in anaphase and have full sister chromatid cohesion and full levels of homolog pairing, as at G1 (70% d ≤ 0.7 μm), different total distributions of nucleus types are predicted according to the status of the 40% of anaphase cells. The distribution expected for full homolog pairing and full sister separation in late anaphase cells is 0.42, 0.38. 0.17, and 0.03; that for full homolog pairing and no sister separation is 0.7, 0.3, 0.0, and 0.0, and that for no homolog pairing and full sister separation is 0.42, 0.18, 0.0, and 0.40. The distribution expected for no homolog pairing and 25% sister separation in late anaphase cells is 0.42, 0.40, 0.15, and 0.03.
Binomial distribution analysis
The observed frequencies of R-only, G-only, Both, and Neither nuclei were corrected for background from fortuitous juxtaposition of homologous foci as given by the fraction of nonhomologous foci exhibiting d ≤ 0.7 μm. This fraction was subtracted from the R-only and G-only classes and added to the Neither class; likewise, the square of this fraction was subtracted from the Both class and added appropriately to the R-only, G-only, and Neither classes. To determine which value(s) of A best describe the (corrected) distribution of nucleus types, test values for A were substituted into the following equations: R-only = (Rtot/A) (1 − Gtot/A) (A), G-only = (Gtot/A) (1 − Rtot/A) (A), Both = (Rtot/A) (Gtot/A) (A); Neither = (1 − Rtot/A) (1 − Gtot/A) (A) + (1 − A). The range of values giving an exact fit between observed and predicted distributions is given (Table 2).
Cell cycle analysis
NKY475 was patched from a −80°C glycerol stock onto a YPG plate and incubated at 30°C overnight. Cells were streaked for single colonies on YPD which, after 2 days growth, were used to inoculate 5 ml of overnight cultures in YPD. Cells from these cultures were then diluted to 2 × 10⁶ cells/ml in YPD and grown for 3 hr while shaking at 30°C. Yeast α factor (U.S. Biologicals, Swampscott, MA) was then added to a final concentration of 5 mg/liter and cells were further incubated with shaking at 30°C for 2 hr. Cells were then pelleted, washed once in 30°C YPD, resuspended in fresh 30°C YPD, and incubated at 30°C with continued shaking. Aliquots taken prior to washing, and at indicated times thereafter, were treated with sodium azide (0.1% final concentration) and stored on ice. FACS was carried out as described by Sazer and Sherwood (1990) with a Becton-Dickinson FACScan analyzer. Bud morphology and nuclear morphology were examined by combined phase contrast and fluorescence microscopy (Alani et al. 1990). For cdc13-1ts arrest, an exponentially growing culture of NKY2597 or NKY3189 grown at 23°C was shifted to 37°C for 2 hr. For nocodazole arrest, a log-phase culture of NKY1098 was treated with drug (Sigma; final concentration 15 μg/ml) and incubated further for 2 hr at 30°C unless otherwise noted.
Acknowledgments
This work and B.M.W. were supported by a grant to N.K. from the National Institutes of Health (RO1-GM44794). S.M.B. was supported by the Helen Hay Whitney Foundation and an Office of Naval Research Science Scholar Fellowship from the Mary Ingraham Bunting Institute of Radcliffe College.
The publication costs of this article were defrayed in part by payment of page charges. This article must therefore be hereby marked ‘advertisement’ in accordance with 18 USC section 1734 solely to indicate this fact.
Footnotes
E-MAIL kleckner@fas.harvard.edu; FAX (617) 495-0758.
References
- Alani E, Padmore R, Kleckner N. Analysis of wild-type and rad50mutants of yeast suggests an intimate relationship between meiotic chromosome synapsis and recombination. Cell. 1990;61:419–436. doi: 10.1016/0092-8674(90)90524-i. [DOI] [PubMed] [Google Scholar]
- Aramayo R, Metzenberg RL. Meiotic transvection in fungi. Cell. 1996;86:103–113. doi: 10.1016/s0092-8674(00)80081-1. [DOI] [PubMed] [Google Scholar]
- Arnoldus EP, Peters AC, Bots GT, Raap AK, van der Ploeg M. Somatic pairing of chromosome 1 centromeres in interphase nuclei of human cerebellum. Hum Genet. 1989;83:231–234. doi: 10.1007/BF00285162. [DOI] [PubMed] [Google Scholar]
- Ashe HL, Monks J, Wijgerde M, Fraser P, Proudfoot NJ. Intergenic transcription and transinduction of the human β-globin locus. Genes & Dev. 1997;11:2494–2509. doi: 10.1101/gad.11.19.2494. [DOI] [PMC free article] [PubMed] [Google Scholar]
- Bender J. Cytosine methylation of repeated sequences in eukaryotes: The role of DNA pairing. Trends Biochem Sci. 1998;23:252–256. doi: 10.1016/s0968-0004(98)01225-0. [DOI] [PubMed] [Google Scholar]
- Campbell JL, Newlon CS. Chromosomal DNA replication. In: Pringle JR, Broach JR, Jones EW, editors. The molecular and cellular biology of the yeast Saccharomyces. Vol. 3. Cold Spring Harbor, NY: Cold Spring Harbor Laboratory Press; 1991. pp. 41–146. [Google Scholar]
- Cao L, Alani E, Kleckner N. A pathway for generation and processing of double-strand breaks during meiotic recombination in S. cerevisiae. Cell. 1990;61:1089–1101. doi: 10.1016/0092-8674(90)90072-m. [DOI] [PubMed] [Google Scholar]
- Chua P, Jinks-Robertson S. Segregation of recombinant chromatids following mitotic crossing over in yeast. Genetics. 1991;129:359–369. doi: 10.1093/genetics/129.2.359. [DOI] [PMC free article] [PubMed] [Google Scholar]
- Csink AK, Henikoff S. Large-scale chromosomal movements during interphase progression in Drosophila. J Cell Biol. 1998;143:13–22. doi: 10.1083/jcb.143.1.13. [DOI] [PMC free article] [PubMed] [Google Scholar]
- Digby L. The somatic, premeiotic and meiotic nuclear divisions of Galtonia candicans. Ann Bot. 1910;24:727–757. [Google Scholar]
- Donahue TF, Farabaugh PJ, Fink GR. The nucleotide sequence of the HIS4 region of yeast. Gene. 1982;18:47–59. doi: 10.1016/0378-1119(82)90055-5. [DOI] [PubMed] [Google Scholar]
- Donaldson AD, Fangman WL, Brewer BJ. Cdc7 is required throughout the yeast S-phase to activate replication origins. Genes & Dev. 1998;12:491–501. doi: 10.1101/gad.12.4.491. [DOI] [PMC free article] [PubMed] [Google Scholar]
- Emmerich P, Loos P, Jauch A, Hopman AH, Wiegant J, Higgins MJ, White BN, van der Ploeg M, Cremer C, Cremer T. Double in situ hybridization in combination with digital image analysis: A new approach to study interphase chromosome topography. Exp Cell Res. 1989;81:126–140. doi: 10.1016/0014-4827(89)90188-2. [DOI] [PubMed] [Google Scholar]
- Fabre F, Boulet A, Roman H. Gene conversion at different points in the mitotic cycle of Saccharomyces cerevisiae. Mol & Gen Genet. 1984;195:139–143. doi: 10.1007/BF00332736. [DOI] [PubMed] [Google Scholar]
- Friedman KL, Diller JD, Ferguson BM, Nyland SV, Brewer BJ, Fangman WL. Multiple determinants controlling activation of yeast replication origins late in S phase. Genes & Dev. 1996;10:1595–1607. doi: 10.1101/gad.10.13.1595. [DOI] [PubMed] [Google Scholar]
- Fung JC, Marshall WF, Dernburg A, Agard DA, Sedat JW. Homologous chromosome pairing in Drosophila melanogasterproceeds through multiple independent initiations. J Cell Biol. 1998;141:5–20. doi: 10.1083/jcb.141.1.5. [DOI] [PMC free article] [PubMed] [Google Scholar]
- Garvik B, Carson M, Hartwell L. Single-stranded DNA arising at telomeres in cdc13 mutants may constitute a specific signal for the RAD9checkpoint. Mol Cell Biol. 1995;15:6128–6138. doi: 10.1128/mcb.15.11.6128. [DOI] [PMC free article] [PubMed] [Google Scholar]
- Gemkow MJ, Verveer PJ, Arndt-Jovin DJ. Homologous association of the Bithorax-Complex during embryogenesis: Consequences for transvection in Drosophila melanogaster. Development. 1998;125:4541–4552. doi: 10.1242/dev.125.22.4541. [DOI] [PubMed] [Google Scholar]
- Guacci V, Hogan E, Koshland D. Chromosome condensation and sister chromatid pairing in budding yeast. J Cell Biol. 1994;125:517–530. doi: 10.1083/jcb.125.3.517. [DOI] [PMC free article] [PubMed] [Google Scholar]
- ————— Centromere position budding yeast: Evidence for anaphase A. Mol Biol Cell. 1997;8:957–972. doi: 10.1091/mbc.8.6.957. [DOI] [PMC free article] [PubMed] [Google Scholar]
- Henikoff S, Comai L. Trans-sensing effects: The ups and downs of being together. Cell. 1998;93:329–332. doi: 10.1016/s0092-8674(00)81161-7. [DOI] [PubMed] [Google Scholar]
- Herskowitz I, Rine J, Strathern JN. Mating-type determination and mating-type interconversion in S. cerevisiae. In: Pringle JR, Broach JR, Jones EW, editors. The molecular and cellular biology of the yeast Saccharomyces. Vol. 3. Cold Spring Harbor, NY: Cold Spring Harbor Laboratory Press; 1997. pp. 827–888. [Google Scholar]
- Hollick JB, Dorweiler JE, Chandler VL. Paramutation and related allelic interactions. Trends Genet. 1997;13:302–308. doi: 10.1016/s0168-9525(97)01184-0. [DOI] [PubMed] [Google Scholar]
- Huisman O, Raymond W, Froehlich KU, Errada P, Kleckner N, Botstein D, Hoyt MA. A Tn10-lacZ-kanR-URA3gene fusion transposon for insertion mutagenesis and fusion analysis of yeast and bacterial genes. Genetics. 1987;116:191–199. doi: 10.1093/genetics/116.2.191. [DOI] [PMC free article] [PubMed] [Google Scholar]
- Jin Q, Trelles-Sticken E, Scherthan H, Loidl J. Yeast nuclei display prominent centromere clustering that is reduced in nondividing cells and in meiotic prophase. J Cell Biol. 1998;141:21–29. doi: 10.1083/jcb.141.1.21. [DOI] [PMC free article] [PubMed] [Google Scholar]
- Kadyk LC, Hartwell LH. Sister chromatids are preferred over homologs as substrates for recombinational repair in Saccharomyces cerevisiae. Genetics. 1992;132:387–402. doi: 10.1093/genetics/132.2.387. [DOI] [PMC free article] [PubMed] [Google Scholar]
- Karpen GH, Allshire RC. The case for epigenetic effects on centromere identity and function. Trends Genet. 1997;13:489–496. doi: 10.1016/s0168-9525(97)01298-5. [DOI] [PubMed] [Google Scholar]
- Keeney S, Kleckner N. Communication between homologous chromosomes: Genetic alterations at a nuclease-hypersensitive site can alter mitotic chromatin structure at that site both in cis and in trans. Genes Cells. 1996;1:475–489. doi: 10.1046/j.1365-2443.1996.d01-257.x. [DOI] [PubMed] [Google Scholar]
- Kleckner N. Interactions between and along chromosomes during meiosis. Harvey Lect. 1996;91:21–45. [PubMed] [Google Scholar]
- Kleckner N, Weiner BM. Potential advantages of unstable interactions for pairing of chromosomes in meiotic, somatic, and premeiotic cells. Cold Spring Harb Symp Quant Biol. 1993;58:553–565. doi: 10.1101/sqb.1993.058.01.062. [DOI] [PubMed] [Google Scholar]
- LaSalle JM, Lalande M. Homologous association of oppositely imprinted chromosomal domains. Science. 1996;272:725–728. doi: 10.1126/science.272.5262.725. [DOI] [PubMed] [Google Scholar]
- Lewis JP, Tanke HJ, Raap AK, Beverstock GC, Kluin-Nelemans HC. Somatic pairing of centromeres and short arms of chromosome 15 in the hematopoietic and lymphoid system. Hum Genet. 1993;92:577–582. doi: 10.1007/BF00420942. [DOI] [PubMed] [Google Scholar]
- Loidl J, Klein F, Scherthan H. Homologous pairing is reduced but not abolished in asynaptic mutants of yeast. J Cell Biol. 1994;125:1191–1200. doi: 10.1083/jcb.125.6.1191. [DOI] [PMC free article] [PubMed] [Google Scholar]
- Lydall D, Nikolsky Y, Bishop DK, Weinert TA. Meiotic recombination checkpoint controlled by mitotic checkpoint genes. Nature. 1996;383:840–843. doi: 10.1038/383840a0. [DOI] [PubMed] [Google Scholar]
- Maloisel L, Rossignol JL. Suppression of crossing-over by DNA methylation in Ascobolus. Genes & Dev. 1998;12:1381–1389. doi: 10.1101/gad.12.9.1381. [DOI] [PMC free article] [PubMed] [Google Scholar]
- Marsh L, Rose MD. The pathway of cell and nuclear fusion during mating in S. cerevisiae. In: Pringle JR, Broach JR, Jones EW, editors. The molecular and cellular biology of the yeast Saccharomyces. Vol. 3. Cold Spring Harbor, NY: Cold Spring Harbor Laboratory Press; 1997. pp. 827–888. [Google Scholar]
- Marshall WF, Straight A, Marko JF, Swedlow J, Dernburg A, Belmont A, Murray AW, Agard DA, Sedat JW. Interphase chromosomes undergo constrained diffusional motion in living cells. Curr Biol. 1997;7:930–939. doi: 10.1016/s0960-9822(06)00412-x. [DOI] [PubMed] [Google Scholar]
- McCarroll RM, Fangman WL. Time of replication of yeast centromeres and telomeres. Cell. 1998;54:505–513. doi: 10.1016/0092-8674(88)90072-4. [DOI] [PubMed] [Google Scholar]
- Metz CW. Chromosome studies in Diptera II. The paired association of chromosomes in the Dipteraand its significance. J Exp Zool. 1916;21:213–279. [Google Scholar]
- Nag DK, Scherthan H, Rockmill B, Bhargava J, Roeder GS. Heteroduplex DNA formation and homolog pairing in yeast meiotic mutants. Genetics. 1995;141:75–86. doi: 10.1093/genetics/141.1.75. [DOI] [PMC free article] [PubMed] [Google Scholar]
- Nasmyth K. Separating sister chromatids. Trends Biochem Sci. 1999;24:98–104. doi: 10.1016/s0968-0004(99)01358-4. [DOI] [PubMed] [Google Scholar]
- Newlon CS, Lipchitz LR, Collins I, Deshpande A, Devenish RJ, Green RP, Klein HL, Palzkill TG, Ren RB, Synn S, Woody ST. Analysis of a circular derivative of Saccharomyces cerevisiaechromosome III: A physical map and identification and location of ARS elements. Genetics. 1991;129:343–357. doi: 10.1093/genetics/129.2.343. [DOI] [PMC free article] [PubMed] [Google Scholar]
- Padmore R, Cao L, Kleckner N. Temporal comparison of recombination and synaptonemal complex formation during meiosis in S. cerevisiae. Cell. 1991;66:1239–1256. doi: 10.1016/0092-8674(91)90046-2. [DOI] [PubMed] [Google Scholar]
- Raymond WE. “Characterization of the RAD50 gene and protein,” Ph.D. thesis. Cambridge, MA: Harvard University; 1990. [Google Scholar]
- Rockmill B, Sym M, Scherthan H, Roeder GS. Roles for two RecA homologs in promoting meiotic chromosome synapsis. Genes & Dev. 1995;9:2684–2695. doi: 10.1101/gad.9.21.2684. [DOI] [PubMed] [Google Scholar]
- Rudner AD, Murray AW. The spindle assembly checkpoint. Curr Opin Cell Biol. 1996;8:773–780. doi: 10.1016/s0955-0674(96)80077-9. [DOI] [PubMed] [Google Scholar]
- Sazer S, Sherwood SW. Mitochondrial growth and DNA synthesis occur in the absence of nuclear DNA replication in fission yeast. J Cell Sci. 1990;97:509–516. doi: 10.1242/jcs.97.3.509. [DOI] [PubMed] [Google Scholar]
- Schwacha A, Kleckner N. Interhomolog bias during meiotic recombination: Meiotic functions promote a highly differentiated interhomolog-only pathway. Cell. 1997;90:1123–1135. doi: 10.1016/s0092-8674(00)80378-5. [DOI] [PubMed] [Google Scholar]
- Smith KN, Nicolas A. Recombination at work for meiosis. Curr Opin Genet Dev. 1998;8:200–211. doi: 10.1016/s0959-437x(98)80142-1. [DOI] [PubMed] [Google Scholar]
- Stack SM, Brown WV. Somatic pairing, reduction and recombination: An evolutionary hypothesis of meiosis. Nature. 1969;222:1275–1276. doi: 10.1038/2221275a0. [DOI] [PubMed] [Google Scholar]
- Straight AF, Marshall WF, Sedat JW, Murray AW. Mitosis in living budding yeast: Anaphase A but no metaphase plate. Science. 1997;277:574–578. doi: 10.1126/science.277.5325.574. [DOI] [PubMed] [Google Scholar]
- van Dekken H, Pinkel D, Mullikin J, Trask B, van den Engh G, Gray J. Three-dimensional analysis of the organization of human chromosome domains in human and human-hamster hybrid interphase nuclei. J Cell Sci. 1989;94:299–306. doi: 10.1242/jcs.94.2.299. [DOI] [PubMed] [Google Scholar]
- von Wettstein D, Rasmussen SW, Holm PB. The synaptonemal complex in genetic segregation. Annu Rev Genet. 1984;18:331–413. doi: 10.1146/annurev.ge.18.120184.001555. [DOI] [PubMed] [Google Scholar]
- Watkins GM. A study of chromosome pairing in Yucca rupicola. Bull Torrey Bot Club. 1935;62:133–150. [Google Scholar]
- Weiner BM, Kleckner N. Chromosome pairing via multiple interstitial interactions before and during meiosis in yeast. Cell. 1994;77:977–991. doi: 10.1016/0092-8674(94)90438-3. [DOI] [PubMed] [Google Scholar]
- Weinert TA, Hartwell LH. Cell cycle arrest of cdc mutants and specificity of the RAD9 checkpoint. Genetics. 1993;134:63–80. doi: 10.1093/genetics/134.1.63. [DOI] [PMC free article] [PubMed] [Google Scholar]
- Winston F, Dollard C, Ricupero-Hovasse SL. Construction of a set of convenient Saccharomyces cerevisiaestrains that are isogenic to S288C. Yeast. 1995;11:53–55. doi: 10.1002/yea.320110107. [DOI] [PubMed] [Google Scholar]
- Xu L, Weiner BM, Kleckner N. Meiotic cells monitor the status of the interhomolog recombination complex. Genes & Dev. 1998;11:106–118. doi: 10.1101/gad.11.1.106. [DOI] [PubMed] [Google Scholar]
- Yang SS, Yeh E, Salmon ED, Bloom K. Identification of a mid-anaphase checkpoint in budding yeast. J Cell Biol. 1997;136:345–354. doi: 10.1083/jcb.136.2.345. [DOI] [PMC free article] [PubMed] [Google Scholar]