Abstract
Objective:
To determine the effects of the visual functions on the occurrence of road traffic accidents (RTA) amongst commercial drivers in Ife central local government area (LGA) of Osun state of Nigeria.
Design:
A cross-sectional study.
Settings:
Four major motor parks located at Ife Central LGA.
Materials and Methods:
Of the estimated 270 commercial drivers in the four major parks of the LGA, 215 consecutive drivers were interviewed and had their eyes examined. Structured questionnaires were administered by an ophthalmologist.
Results:
The prevalence of visual impairment (visual acuity < 6/18) in the better eye without correction was 3.3% ± 2.4 and there was a significant association between uncorrected visual acuity impairment in the better eye and RTA (P = 0.0152). Refractive error was seen in 8.4% of the drivers, but none of these wear corrective glasses. Visual field defect, abnormal stereopsis and color vision impairment did not have any significant association with RTA.
Conclusion:
Poor visual acuity is strongly associated with RTA amongst Nigerian commercial drivers as opposed to visual field defect, abnormal color vision and stereopsis. A significant proportion of visual impairment was due to uncorrected refractive errors.
Keywords: Driving, road traffic accidents, visual functions
INTRODUCTION
Road traffic accident (RTA) remains a dreadful plague the world over. The trend has been on a decline in most developed countries, while the reverse is the case in the developing nations.[1]
RTA is endemic in Nigeria, with seasonal epidemics.[2] The police records show that between 1980 and 1989, a total of 98,168 Nigerians died and 244,864 were injured in RTA.[3] These averaged about 10,000 killed and 25,000 injured annually.[3] A study has shown that 1 out of 3 and 1 out of 9 of the Nigerian population stand the risk of getting injured or killed respectively, on a yearly basis from RTA.[4] In spite of the concerted effort at reducing the rate of RTA, Nigeria still ranked amongst the highly affected nations of the world.[5] It is even more disturbing to note that the young adults group, the economic back-bone of a nation, is most affected by this ravaging menace.[6,7]
Driving requires several sets of abilities, which include sensory ability (mainly visual), mental ability, motor ability and compensatory abilities. Though 95% of the sensory requirement for driving has been shown to be visual,[8] various workers however found no correlation between visual impairment and the occurrence of RTA. [8–15]
As with visual acuity, published data shows equivocal and sometimes conflicting evidences of the correlation between visual field and RTA.[16] There is however some evidence that drivers with binocular field defect do have a higher incidence of accidents, especially of the side-wipe nature.[17]
The Drivers and Vehicle Licensing Agency in the UK has defined the minimum visual field for safe driving as a field of vision of at least 120 degree on the horizontal meridian and no significant field defect in the binocular field which encroaches within 20 degree of fixation, either above or below the horizontal meridian. The test is done using the Goldmann perimeter on the iii4e setting or its equivalent.
Johnson and Keltner[18] in their mass visual field screening of 10,000 drivers in California found that both accident rate and conviction rate in groups with visual field loss were more than twice as high, as for age and sex matched control group with normal vision. Taylor,[8] however submitted that there was no evidence of a progressive increase in the accident rate with the deterioration in the total visual field. Burg,[13] Council and Allen[14] in the USA and Davidson in the UK[19] also showed little correlation between visual field defect and accident record.
Nwosu[10] in Nigeria, reported a prevalence of 3.9% visual field defect amongst drivers in Ibadan, but found no significant association with RTA. Okafor[11] and Effiong[12] also found no significant association between RTA and visual field defect in their studies.
In Nigeria, the federal road safety corps (FRSC) guideline for visual requirement for drivers is silent about visual field.[20] Alli[21] however recommended a horizontal binocular visual field of 140° or more for Nigerian drivers and that any visual field less than 110° should be a contraindication for driving in Nigeria.
This study aimed at analyzing the relationship between the various aspects of visual function and the occurrence of RTA.
MATERIALS AND METHODS
All the four major motor parks in Ife central LGA were included in the study; these were Ilesa/Akure/Ekiti motor park, Lagere motor park, Mayfair motor park and OAU campus gate motor park. The drivers were educated on the purpose and importance of the study by the consultant ophthalmologist, thereafter verbal consent was sought from consecutive drivers who agreed to participate in the interview and subsequently presented for ocular examination.
Two hundred and seventy commercial drivers in these four major motor parks were enroled for this study. However, 215 consecutive drivers who consented were interviewed and had their eyes examined. All these drivers travel regularly within the local government area and the adjacent nearby communities during the day in vehicles with current valid certificate of roadworthiness.
A structured questionnaire was administered by an ophthalmologist to each driver by face- to-face interview. The documented information included drivers demographic data, duration of driving, history of involvement in RTA, history of previous ophthalmic diseases and past ophthalmic examination and treatment.
Ocular examination was done on all the respondents by an ophthalmologist and two ophthalmologists-in-training who were trained to assist. These include visual acuity test, which was done in the open field during the day, using the Snellen's chart (or illiterate E chart) placed at 6 meters from the respondents. Each eye was tested separately unaided and with pinhole in cases where visual acuity was less than 6/6. Visual acuity of 6/6 - 6/18 was considered to be normal, < 6/18 - 6/60 was classified as visual impairment and < 6/60 - 3/60 was classified as severe visual impairment while visual acuity less than 3/60 was classified as blindness.[22]
Color vision was tested using the Ishihara pseudo-isochromatic plates while TNO test chart was used to examine for stereopsis in each respondent.
Full field visual field test was done on each respondent by an ophthalmologist using the supra-threshold Optifield KP-910+V-1.42 automated perimeter. Extra-ocular muscle activity was tested in all directions of gaze, seeking for any paresis or paralysis of the extra-ocular muscles or diplopia.
The anterior segment was examined using a pen torch. The upper and lower lids were examined for deformities. The conjunctiva, cornea, anterior chamber, pupil and lens were examined in each eye and findings recorded.
Funduscopy was done on all the respondents using the Keeler professional direct ophthalmoscope, in a relatively darkened common room of the motor parks. Dilated funduscopy was done when absolutely necessary, for instance when the ocular media is hazy precluding detailed view of the fundus, after which such drivers were advised not to drive for the day. Intra-ocular pressure was measured using Schiotz tonometer.
Respondents who required further evaluation or any further medical or surgical attention were referred to the eye clinic of the Obafemi Awolowo University Teaching Hospitals Complex (OAUTHC) Ile-Ife, with a designed referral form.
Approval for the protocol for this study was obtained from the ethic and research committee of the Obafemi Awolowo University Teaching Hospitals Complex.
Data obtained were analyzed using EPI-INFO statistical software. The relationships between categorical data were analyzed using Chi square test. At the adopted confidence level of 95%, P value of 0.05 (i.e. 5%) or less was considered to be significant. Yates's corrected Chi square and the appropriate Fisher's exact P value were used where the value of any cell was less than 5.
We identified and adjusted for potential confounding factors like age, duration of driving experience and presence of illnesses and medication by using logistic regression model in the statistical analysis. The effects of poor vehicle condition and environmental factors such as rainfall and fogs were not considered in this study.
RESULTS
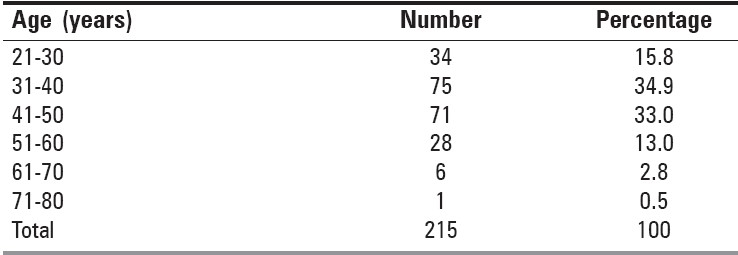
A total of 215 drivers participated in this study; this represents about 80% of the total population (270) of the commercial drivers in the four parks. Table 1 shows the age distribution of the drivers. Their ages ranged between 21 years and 75 years. The mean age was 41.5±6.7 years. All of them were males. About 2/3 of the drivers (67.9%) were between the ages 31 years to 50 years.
Table 1.
Age distribution of the drivers

Majority (91.2%) had formal education, 54.9% had post-primary education. Majority (94.0%) of the drivers obtained their driver's licenses at the approved age of 18 years or older. An unlicensed driver was however seen amongst the studied population. This was reported to the FRSC for investigation and necessary action.
A large proportion of 83.6% had no eye test before they were issued their driver's licenses, 22% got their licenses without undergoing any form of driving test. Majority (92.1% ) could read and comprehend road signs.
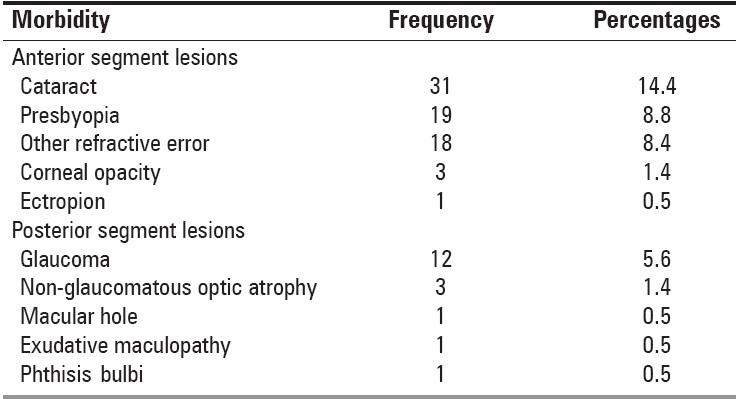
Table 2 shows that refractive errors (17.2%, about 50% of which was presbyopia) was the most common ocular morbidity among the drivers, followed by cataract (14.4%), pterygium (7.0%) and glaucoma (5.6%). Others were corneal opacity, macular lesions, lid abnormalities and phthisis bulbi (0.5% each).
Table 2.
Ocular morbidity amongst 215 drivers

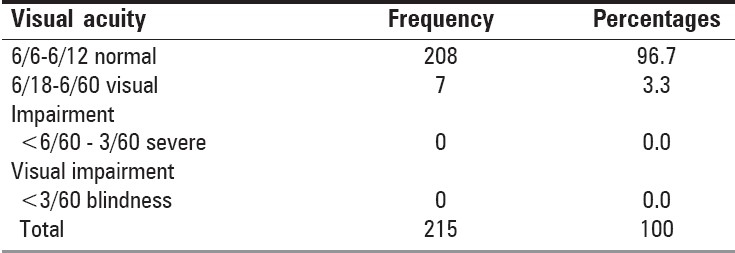
Table 3 depicts the visual acuity in the better eyes of the 215 drivers. Majority, 208 (96.7%) had normal visual acuity, while seven (3.3%) had visual impairment in the better eyes. None of the drivers had severe visual impairment or blindness in the better eye.
Table 3.
Presenting visual acuity in the better eye of drivers

Out of the seven drivers who had visual impairment in their better eye, six (85.7%) had been involved in road traffic accident before. Fifty-one (24.5%) of the 208 drivers with normal visual acuity in their better eyes had been involved in road traffic accident. There is a statistically significant association between visual impairment in the better eye and RTA involvement with a risk of 4.16 (Risk ratio was 3.5, 95% confidence interval 2.38 - 5.14, X2 13.02, P = 0.0003)
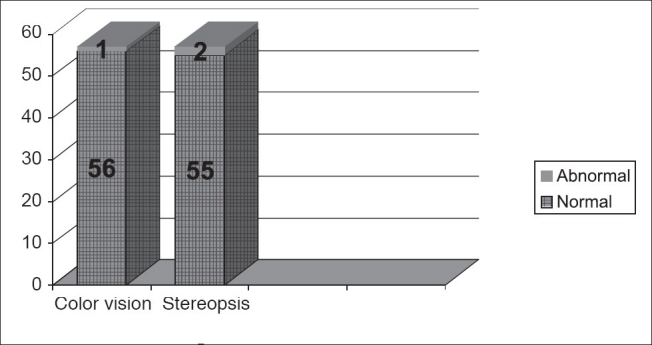
Figure 1 shows that only one of the 57 drivers who were involved in road accident had abnormal color vision. There is no statistically significant association between color vision impairment and involvement in road traffic accident (Risk ratio was 1.12, 95% CI 10.3-11.05, X2 = 2.30, P = 0.10).
Figure 1.

Relationship between colour vision and stereopsis and RTA
Also, 2 (18.2%) of the 11 drivers with abnormal stereopsis had road traffic accident. Of the 204 drivers with normal stereopsis, 55 (27.0%) were involved in road traffic accidents; there is no statistically significant association between stereopsis and involvement in road traffic accident (Risk ratio was 1.45, 95% CI 0.42-5.3, X2 0.41, P =0.52).
Seven (31.8%) of the 22 drivers with field defect in at least one eye were involved in road traffic accidents, whereas 50 (25.9%) of the drivers with normal field were involved in road accidents. There was no statistically significant association between visual field impairment in at least one eye and involvement in road traffic accident. Also, 1out of the 5 drivers with bilateral visual field defect was involved in RTA, while 56 out of the 210 drivers who did not have bilateral visual field impairment were involved in RTA. There is no statistically significant association between bilateral visual field defect and involvement in road traffic accident (Risk ratio was 1.07, 95% CI 0.98-6.73, X2 0.83, P =0.34).
DISCUSSION
The prevalence of visual impairment of 3.3% found in this study is higher than those found in drivers of similar categories from previous studies.[12,23] This can be explained partly by the fact that these other studies used the best or pinhole corrected visual acuity for their analysis, while the presenting visual acuity (VA) was used in this study. If this study had used the corrected VA, the prevalence of visual impairment would have been lower, since some drivers categorized as visually impaired would have been improved into the normal VA category. The presenting VA was used in this study because this was the drivers’ habitual VA. This is in agreement with the results of other researchers that a number of drivers in Nigeria operate on the roads with vision below the legal requirement.[12,24]
The prevalence of uniocular blindness in this study was 2.3%. Two out of the five drivers with uniocular blindness had been involved in RTA in the past, but the causes of RTA in the two cases were excessive speeding and faulty vehicle. The RTAs were also said to have occurred before the drivers noticed the impairment in vision. The finding here does not support Norman`s[25] observation that one-eyed drivers are more prone to RTA. This may be due to the small number of uniocular blind drivers involved in this study.
The significant association between visual impairment and RTA found in this study is similar to the results of other studies.[12,23,24,26] VA is the only visual parameter currently measured by FRSC,[20] but it was noticed that the VA was not checked in most cases before drivers were issued their driver's licenses. Majority (83.6%) of the drivers in this study never had any eye test done before obtaining their driver's licenses. This implied that some individuals that would have been barred from driving based on visual impairment easily obtained driver's licenses, with a negative consequence on road safety.
Visual field is another visual parameter that has been recommended to be tested along with VA before driver's licenses are issued to drivers,[21] but this is yet to be incorporated into the requirements for driving in Nigeria. In this study, there was no significant association between visual field defect and RTA. This result is in agreement with other studies done in Nigeria.[12,23,24] Some works done outside Nigeria however found significant association between visual field defect and RTA.[9,18,27] The difference in observation could not be explained based on the type of tools used for the test. In the other studies reported in Nigeria, the confrontational method was used, while this study and most of the works done outside the country used the automated perimeter, which is more sensitive. If the examination of visual field is to be effectively incorporated into the visual requirement for driving, then appropriate instrument must be made available with trained personnel to operate the equipment.
The only driver found with color vision abnormality was actually involved in RTA, but the cause of the RTA was excessive speeding. There was no significant association between color vision abnormality and RTA in this study. This result is in agreement with other studies.[9,24] It should however be noted that Ishihara test used in this study is sensitive only to congenital color defect, other instruments such as Fansworth Munsell 100 hue test that are sensitive to acquired color vision defect were not available.
Abnormal stereopsis was found in 5.1% of the drivers. All the drivers with uniocular blindness were included because it is known that binocular vision is a requirement for depth perception. There is no statistically significant association between impaired stereopsis and RTA in this study. Effiong,[12] Erikitola,[23] McMoli and Ogunmekan[28] all got similar results in their studies. As it was noted in other studies.[30,31]
The prevalence of refractive error in this study was 8.4%, but no refraction was done so they could not be classified into various categories of refractive errors. This result is similar to findings in some studies,[12,19] but not in agreement with others.[11,24] It is however disturbing to note in this study, just as it was noted in other studies, that some drivers whose vision may have been improved with simple optical devices do not wear any. It shows that most drivers do not yet appreciate the importance of good vision in road safety.
The prevalence of cataract was 14.4%. There were two drivers with uniocular matured cataract. It was however not surprising that those two drivers with matured cataract were above 50 years old. Cataract has been reported as the most common cause of blindness worldwide, especially in the elderly population[29] Cataract has also been associated with diminished contrast sensitivity and scotopic vision, both of which have been associated with RTA.[6,12,29]
CONCLUSION
There is a significant relationship between VA impairment and road accidents but none between visual field defect, abnormal color vision and stereopsis among commercial drivers in Ile-Ife, Nigeria.
Footnotes
Source of Support: We are grateful to the hospital management of Obafemi Awolowo University Teaching Hospital, Ile-Ife who gave some financial assistance for conducting this survey
Conflict of Interest: No.
REFERENCES
- 1.Willette RE, Walsh JM, editors. WHO Offset Publication No. 78. Geneva: World Health Organization; 1983. Drugs, driving and traffic safety; pp. 1–10. [PubMed] [Google Scholar]
- 2.Asogwa SE. Road traffic accidents: A major public health problem. Public Health. 1978;92:237–45. doi: 10.1016/s0033-3506(78)80067-5. [DOI] [PubMed] [Google Scholar]
- 3.The Nigeria Police Force Management services and Research department. Data on establishment of force. Force Headquarters Lagos. 1989:1–19. [Google Scholar]
- 4.Ezenwa AO. Trend and characteristic of RTA in Nigeria. J Roy Soc Health. 1986;1:27–9. doi: 10.1177/146642408610600111. [DOI] [PubMed] [Google Scholar]
- 5.Agunloye O. Road danger in Nigeria- Truth and consequences. J Fed Road Safety Commission, Nigeria. 1988;1:11–6. [Google Scholar]
- 6.Oyemade A. Epidemiology of road traffic accidents in Ibadan and its environs. Niger Med J. 1973;3:174–7. [Google Scholar]
- 7.Asogwa SE. Some characteristics of drivers and riders involved in road traffic accidents in Nigeria. East Afr Med J. 1980;57:399–404. [PubMed] [Google Scholar]
- 8.Taylor JF. Vision and driving. Practitioner. 1982;226:885–9. [PubMed] [Google Scholar]
- 9.Cashell GT. Visual functions in relation to road accident. Trans Ophthalmol Soc UK. 1966;86:617–20. [PubMed] [Google Scholar]
- 10.Nwosu SN. Visual impairment and road traffic accident in Nigeria professional drivers. Orient J Med. 1991;3:110–2. [Google Scholar]
- 11.Okafor CF. Visual status of Nig. Police force drivers. Dissertation submitted to National Postgraduate Medical College of Nigeria. 1992:35–9. [Google Scholar]
- 12.Effiong B. Visual Status of Taxi Park Drivers in Enugu. Dissertation Submitted to National Postgraduate Medical College of Nigeria. 1993 Nov;:41–6. [Google Scholar]
- 13.Burg A. The Relationship between vision test scores and driving record: Geneva Finding, Dept of Engineering, Los Angeles, University of California. 1968:27–46. Report number 68. [Google Scholar]
- 14.Council FM, Allen IA. A Study of the visual fields of North Carolina drivers and their relationship to accidents. University of North Carolina, North Carolina High Way and Safety Research Center. 1974:18–26. Report. [Google Scholar]
- 15.Griep DJ. Traffic, accidents, Visual perfomance and driving behaviour. In: Henkes HE, editor. Perspective in Ophthalmology. Amsterdam: Xcerpta Medica Foundation; 1968. pp. 231–8. [Google Scholar]
- 16.Johnson CA, Keltner JL. Incidence of visual field losses in 10,000 eyes and its relationship to driving performance. Arch Ophthalmol. 1983;101:371–5. doi: 10.1001/archopht.1983.01040010371002. [DOI] [PubMed] [Google Scholar]
- 17.Hills RL, Burg A. A re-analysis of California drivers vision data: General findings. J Traff Med. 1977;5:42–3. [Google Scholar]
- 18.Johnson CA, Kilter JL. Incidence of visual field losses in 10,000 eyes and its relationship to driving performance. Arch Ophthalmol. 1983;101:371–5. doi: 10.1001/archopht.1983.01040010371002. [DOI] [PubMed] [Google Scholar]
- 19.Davidson PA. Inter-relationships between British drivers visual abilities, Age and road accident histories. Ophthalmic Physiol Opt. 1985;5:195–204. [PubMed] [Google Scholar]
- 20.Agunloye O. Guidelines for the National Drivers License Scheme. Public Education Department Headquarters, Lagos. Federal Road Safety Commission. 1990:6–9. [Google Scholar]
- 21.Alli BO. The medical and psychosocial aspect of motor vehicle accident prevention. Niger Med J. 1979;12:767–70. [PubMed] [Google Scholar]
- 22.WHO: Categories of Visual Impairment: Strategies for the prevention of blindness in National programmes. Technical report series. No.10 Geneva. 1984 [Google Scholar]
- 23.Erikitola B. Ocular status of Motor Park Drivers as seen in Mushin Local Government Area, Lagos State, Nigeria. Dissertation Submitted to National. Postgraduate Medical College of Nigeria. 1998 May;:30–5. [Google Scholar]
- 24.Nwosu SN, Osuntokun O, Ajayi BK. The prevalence of subnormal vision among government motor vehicle drivers in Oyo State, Nigeria. Niger Med J. 1991;2:51–3. [Google Scholar]
- 25.Norman LG. Control and prevention. Geneva: WHO; 1962. Road traffic accidents epidemiology; pp. 77–95. [Google Scholar]
- 26.Falola A. A survey of the visual status of Nigerian army drivers in Lagos area. Dissertation Submitted to National Postgraduate Medical College of Nigeria. 2000 May;:46–60. [Google Scholar]
- 27.Burg A. Vision and driving: A report on research. J Traff Med. 1975;3:18–22. [Google Scholar]
- 28.McMoli TE, Ogunmekan IO. Road traffic accidents in Nigeria - Observation on controllable human factor in Lagos. Afr Ann Med. 1983;1:30–3. [Google Scholar]
- 29.Anderson SJ, Holliday IE. Night driving: Effect of glare from Vehicle headlights on motion perception. Ophthalmic Physiol Opt. 1995;27:443–59. [PubMed] [Google Scholar]
- 30.Keeney AH. Establishing vision standards for motor vehicle operators. J Traffic Med. 1975;3:28–30. [Google Scholar]
- 31.Kalberer M. The meaning of colour blindness in traffic. Ophthalmologica. 1971;63:171–7. doi: 10.1159/000306634. [DOI] [PubMed] [Google Scholar]


