Abstract
Magnetotactic bacteria comprise a diverse group of aquatic microorganisms that are able to orientate themselves along geomagnetic fields. This behavior is believed to aid their search for suitable environments (1). This capability is conferred by the magnetosome, a subcellular organelle that consists of a linear-chain assembly of lipid vesicles each able to biomineralize and enclose a ~50-nm crystal of magnetite or greigite. A principle component of the magnetosome that was shown to be required for the formation of functional vesicles is MamA. MamA is a highly abundant magnetosome-associated protein which is one of the most characterized magnetosome-associated proteins in vivo(2-6). This article focuses on the purification of MamA, which despite being studied in vivo, no clear functional or structural details have been identified for it. Bioinformatics analysis suggested that MamA is a tetra-tricopeptide repeat (TPR) containing protein. TPR is a structural motif found as such or forming part of a bigger fold in a wide range of proteins, it serves as a template for protein-protein interactions and mediates multi-protein complexes (7). TPRs are involved in many crucial tasks in eukaryotic cell organelle processes and many bacterial pathways (8-14). In order to understand MamA, a unique TPR containing protein, highly purified protein is required as a first step. In this article, we present the purification protocol for a stable MamA deletion mutant (MamAΔ41) from M. magneticum AMB-1.
Protocol
1. Cloning and Expression of mamA Gene in E. coli
The mutant gene mamAΔ41 was amplified using the polymerase chain reaction (PCR) from genomic DNA of Magnetospirillummagneticum AMB-1, with primers: 5'-GCATTACGCATATGGACGACATCCGCCAGGTG-3' and 5'-GCGCGGCAGCCATA-TGGCATACG-3'. In the amplified DNA fragments, an NcoI site was introduced at the initiation codon ATG and the termination codon was replaced with a ScoI site. The fragments were digested with NcoI and SacI and cloned into the respective sites of pET52b(+), giving rise to pET52bMamAΔ41-AMB1. In this construct, the mamAΔ41 gene was fused in-frame with the 10-His tag at the C-terminus. The plasmid was electroporated into E. coli strain BL21. E. coli strain BL21 harboring pET52bMamAΔ41 was grown in auto-induction (15) medium containing ampicillin (50 mg/ml) 310°K for 3 hours. The cultivation temperature was then shifted from 310° to 300°K and maintained for an additional 48 h at 300°K. The cells were harvested by centrifugation at 5465g for 10 min at 277°K. 8 liters culture produced 60 grams of wet cell pellet.
2. Bioinformatics Calculations
Calculations of molecular weight (MW), according to amino acids sequence and the predicted absorption of 1mg/1ml of protein in 280nm, using the ProtParam server (http://www.expasy.ch/tools/protparam.html). For 10His-Tag-MamAΔ41 the MW is 22529 Da (240 amino acids) and for MamAΔ41 (with 9 amino acids left after His-tag removal by Thrombin) the Mw is 20596.5Da (187 amino acids). The predicted absorption of 1mg/1ml of protein in 280nm for 10His-Tag-MamAΔ41 is 0.595 and for MamAΔ41 is 0.579. In addition, the amino acid sequence does not contain any cysteine residues. Therefore, reducing agents are not required during the purification process.
3. Purification of MamAΔ41
For stock solution preparation, weigh out and prepare (200 ml each) in the following concentrations: Imidazole (MW 228.2 g/mol) 4M solution, NaCl (Mw 58.44 g/mol) 5M solution, Tris-HCl (Mw 121.3 g/mol) 1M solution, adjust pH=8. Add double distilled water (DDW) and mix using a vortex until the solution is clear. Filter solutions with 0.22μm filter and keep at room temperature.
Prepare and filter 6 fresh buffers from stock solutions (Table1).
Dilute and suspend cells in buffer A in 1:2 ratio, grams of cells to buffer volume (ml).
Add 10μl for each 10gr of bacteria of DNase I (1 mg/ml) in order to break DNA fragments in the sample. Add 1ml for each 20gr of bacteria of EDTA free protease inhibitor cocktail. Incubate for 20 min on ice.
Disrupted cells by two cycles of French press at 25,000 psi. Unlike sonication, the French press is aimed at high volume (>10ml) cell extrusion by forcing the cells under high pressure through a thin orifice. The piston should be cooled on ice for ten minutes prior to its usage and assembly due to temperature buildup.
Transfer the lysed cells into 25ml ultracentrifuge tubes and balance them precisely ( 50mg) with buffer A until the sample reaches the tube s neck line.
Separate cell debris by Ultra centrifugation at 270,000g for 1 hour at 277°K.
Prepare a homemade gravity Ni NTA column (2.5cm diameter) by adding 4 ml of Ni NTA resin, which are preserves in 20% ethanol, onto the column. Let the fluid drop completely, then wash with 40 ml of DDW and let the fluid drop completely. Pre-equilibrated the resin in the column with 40 ml of buffer A.
Apply the soluble fraction from ultra-centrifugation tubes on gravity Ni NTA column. Let the fluid drop, collect flow-through (unbound proteins) and preserve at 277K.
Collect pellet sample from the ultra-centrifugation tubes by using a small tip to scrap the pellet. Mix the tip in 50μl of 5% β-mercaptoethanol in 2X SDS-PAGE sample buffer.
Wash the column with 100 ml buffer B. Let the fluid drop, collect flow-through and preserve at 277K.
Prepare 15 marked eppendorf tubes (1.5ml).
Elution - close column valve and then load 1ml of buffer C onto the column; incubate for 3 min followed by valve opening and flow-through collection. Repeat this step three times.
Elute rest of suspension at 1 ml buffer C increments and close the valve.
Measure OD at 280nm of the fractions and evaluate location of the protein peak; if the OD is still >0.3, additional samples are needed.
SDS-PAGE analysis of collected fractions. Such analysis should be performed also with the following samples, unbound proteins flow-through, wash flow-through and ultra-centrifugation pellet sample. Mix 10μl from each sample with 10μl of 5% β-mercaptoethanol in 2X SDS-PAGE sample buffer. Load the samples on 15% SDS-PAGE and run for 45 min in 180 Volts.
Stain the gel in 15 ml of InstantBlue solution, shake for 1 hour. Make sure that the plastic box is covered and protected from light.
Evaluate gel; if protein expression is high and specific according to the indicative bands, merge selected eluted fractions.
In order to remove 10-His-tag, add bovine thrombin (10 units/μl), 10μl thrombin per 1 mg protein, according to the manufacturer's recommendation to the combined sample.
Dialysis is used for excess Imidazole removal and to decrease NaCl concentrations for levels needed during ion exchange binding. For dialysis, cut desired length of 7 kD molecular weight cut off (MWCO) dialysis tubing. Wash with DDW and make a knot at one end (or seal with clips). Transfer merged protein solution onto the bag while leaving some space at top and clamp up.
Submerge the dialysis tubing in 4 Liters chilled dialysis buffer (Buffer D). Stir the solution slowly over night at 277°K.
Take the dialysis tubing out of the beaker, make a small cut and transfer the protein to 50ml tube.
Ion-exchange chromatography: assemble pre-packed MonoQ 4.6/100 PE column on Fast Performance Liquid Chromatography (FPLC). Wash the column with 5 column volumes (CV) of DDW filtered water. Equilibrated the column with 5 CV of buffer D.
Wash the injection loop with DDW (two loop volumes) and repeat with buffer D. Load the protein in the injection loop.
Inject the protein sample (flow rate of 1 ml/min) and start collecting fractions for SDS-PAGE detection of unbounded proteins.
If the initial protein volume (step 3.23) is larger than injection loop, repeat steps 3.25-3.26, without washing the loop, until the whole sample is loaded on column.
Wash the column with 3 CV of buffer C in order to remove unbounded proteins.
Elute the protein with a 60 min linear gradient of 40 2000mM NaCl between buffers D & E (when 100% buffer E is the end of the gradient), flow rate 1 ml/min (although higher flow rates can be used in the cost of larger volumes, but less concentrated, protein peaks). Collect proteins peaks as they appear in the 280nm chromatogram.
Clean pre-packed column according to manufacture recommendation.
SDS-PAGE analysis of collected fractions. Such analysis should be performed with the following samples, unbounded proteins flow-through and protein peaks flow-through. Run the SDS-PAGE and stain as mention in steps 3.17-3.18.
Evaluate gel for protein bands existence at the predicted Mw according to the protein pre-stained marker. Merge selected elution fractions that contain the relevant protein.
Dialyze the merged samples, in order to lower NaCl concentrations needed for size exclusion chromatography. Perform the dialysis as mentioned in steps 3.21-3.23 against buffer F.
Concentrate the protein sample using a Vivaspin-15 10,000 MWCO to 8 mg/ml in a table centrifuge, 4000 rpm. Validate desire concentration by measuring OD at 280nm in Quartz cuvette. If the protein is too concentrated dilute it with buffer F and measure again.
Assemble size exclusion pre-packed column, HiLoad 26/60 Superdex 200, on FPLC; wash the column with 3 CV of DDW filtered water. Equilibrated the column with 3 CV of buffer F.
Wash injection loop with 5ml DDW (two loop volumes) followed by the same volume with buffer F. Load no more than 4 ml of the protein sample in the injection loop.
Inject the protein sample (flow rate of 3.5 ml/min) and start collecting proteins peak fractions as they appear it the 280nm chromatogram. Let the buffer flow until it reaches column volume.
If the initial protein volume (step 3.23) is larger than injection loop, repeat steps 3.25-3.26, without washing the loop, until the whole sample is loaded on column.
Clean pre-packed column according to the manufacture recommendation.
SDS-PAGE analysis of collected fractions. Such analysis should be performed with the protein peaks samples. Run the SDS-PAGE and stain as mention in steps 3.17-3.18.
Evaluate gel: if protein peaks are specific, in the correct predicted Mw according to the protein pre-stained marker and only one band is visible merge selected eluted fractions of the relevant protein.
Concentrate protein sample using a Vivaspin-15 10,000 MWCO to >20 mg/ml in a table centrifuge, 4000 rpm. Validate desire concentration by measuring OD at 280nm. The purified MamAΔ41 was then concentrated to 26.5 mg/ml for crystallization.
Confirm sample purity and protein identification using Matrix-assisted laser desorption/ionization (MALDI-TOF).
If the protein is purified according to the mass spectrometer and SDS-PAGE, divide the concentrated MamAΔ41 to pre-marked eppendorf tubes; 25-50μl protein in each.
Flash frozen in liquid nitrogen and store at 193°K.
4. Representative Results
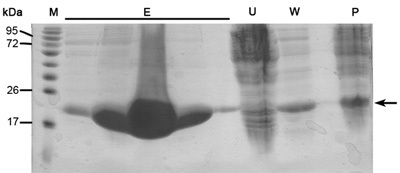
When this protocol is done correctly one should get highly purified, size homogenous and concentrated protein samples. These protein samples are then ready for crystallization trials as well as biochemical studies, such as enzyme kinetics, binding affinity and more. Described here are representative results of main steps in the purification protocol. SDS-PAGE analysis of elution profile of Ni-NTA affinity column should reveal highly over expressed protein in the soluble fraction at appropriate MW of ~22kDa (Figure 1). This SDS-PAGE analysis should also reveal minimum if any protein in the unbounded proteins flow-through, wash flow-through and ultra-centrifugation pellet sample. If large bands of the appropriate protein do appear in these samples one should consider wrong buffer preparation, problems in cell disruption or problems in culture auto-induction conditions and growth.
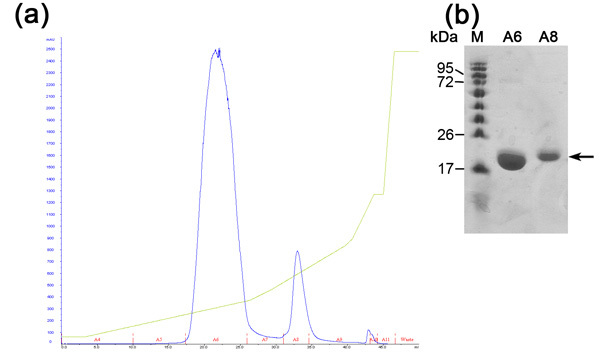
Ion exchange chromatography is preformed in order to separate between our desirable protein to other E.coli proteins that were bound to the nickel resin (due to electrostatic interactions or histidine/negative amino acids rich protein loops) and uncut His-Tagged desirable protein. This column separates proteins according to their binding affinity to the positively charged resin under increasing NaCl concentrations. Highly negatively charged protein will elute in higher NaCl concentrations appose to moderate negatively charged ones. The advantages of this column are high flow rate and binding capacity. The ion exchange chromatogram (Figure 2) reveals a good separation between 3 proteins populations in increasing NaCl concentration. SDS-PAGE analysis is needed in order to determine MW of each population, isolating the desirable one and evaluation whether further purification steps are needed. The first population is MamAΔ41 (~20 kDa) while the second population is MamAΔ41+His Tag (~22kDa) that was not cleaved by bovine thrombin and the third population is undetectable in SDS-PAGE due to low concentration. If the proteins peaks are not separated clearly one should consider wrong buffer preparation or changing the slope of NaCl gradient.
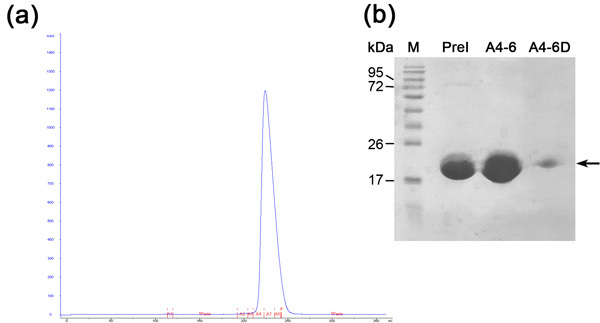
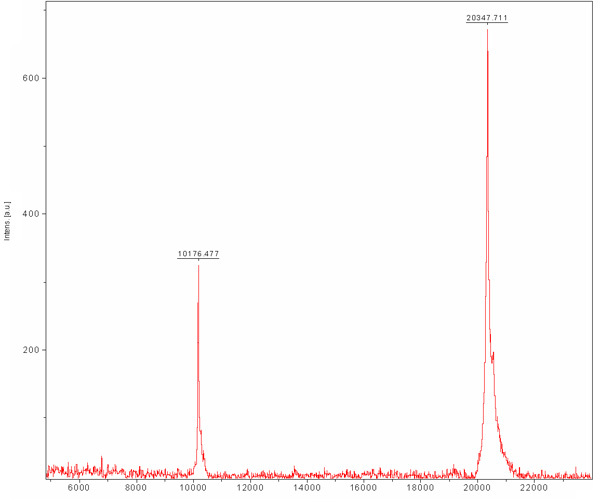
Size exclusion chromatography is preformed in order to separate between our desirable protein to other E.coli cell proteins that were bound to the Ni-NTA resin and were not separated during ion exchange chromatography. This column separates proteins according to their size. Large proteins will elute in smaller elution volumes opposed to small ones which will be eluted in larger volumes. The column chromatogram (Figure 3) reveals a good separation of the desirable protein as one main population. The population appears to elute in appropriate monomer size with a MW of ~20 kDa. The presence of ~80 kDa band (E.coli typical protein that binds Ni-NTA resin) is detected in SDS-PAGE prior to column loading and disappears during this run. Since the concentration of this ~80 kDa protein is low to begin with, its population does not appear in the chromatogram due to its dilution and SDS-PAGE analysis is needed to determine the purification efficiency. We recommend loading a diluted and concentrated sample of the main peak to the SDS-PAGE so one could surely determine the presence of a pure protein in the appropriate MW. By this stage the protein is purified and its homogeneity should be evaluated by MALDI-TOF. This analysis revealed a protein in MW of 20347 Da and another in Mw of 10176 Da (Figure 4). The ~10 kDa protein is the ~20 kDa protein doubled charged. The predicted MW of MamAΔ41 with the 9 amino acids left after His-Tag removal was 20596.5 Da. By comparing it to the obtained MALDI-TOF MW we found that they are 248 Da apart. This dissimilarity can result from MALDI-TOF measurement errors and/or due to common degradation of the first methionine and the second glycine. To conclude, the protein is highly purified and can be used for further experiments.
 Table 1. Buffer formulations.
 Figure 1. Representative SDS-PAGE analysis of Ni-NTA column purification. From right to left; P- ultra-centrifuge pellet (3.11 protocol step), W- wash (3.12 protocol step), U- unbounded proteins (3.10 protocol step), E-five lanes of elution samples (3.14 protocol step), M - protein marker (numbers indicate MW). Arrow indicates MamAΔ41.
 Figure 2. Analysis of ion exchange chromatography step (a) Ion exchange (MonoQ column) chromatogram; Blue - absorption 280nm,
represents protein concentration, Green- NaCl concentration, Red - indication of fractions collected. (b) Representative SDS-PAGE analysis of the ion exchange purification step. From left to right; M - protein marker (numbers indicate Mw), A6 - first peak fraction, A8- second peak fraction.
 Figure 3. Size exclusion chromatography analysis (a) Size exclusion (Superdex 200 column) chromatogram; Blue - absorption 280nm, represents protein concentration, Red indication of fractions collected. (b) Representative SDS-PAGE analysis of size exclusion purification step. From left to right; M- protein marker (numbers indicate MW), PreI- pre-injected sample, A4-6 combined fraction collected from the first peak, A4-6D- Diluted fraction collected from the peak.
 Figure 4. Matrix-assisted laser desorption/ionization (MALDI-TOF) mass spectrum of purified MamAΔ41. The matrix is Sinapic acid (SA). MamAΔ41 shown at 20347 Da, also shown is the doubled charged species of MamAΔ41 at 10176 Da.
Discussion
Protein purification is the main step in any proteins biochemical or structural studies. Since each protein is unique with its own behavior, one needs to define its properties and modify its purification accordingly. Protein target should be analyzed as a first step toward purification using bioinformatics tools. They are used to calculate the target iso-electric point, assess its need for reducing/oxidizing environment and its need for special ions/ligands. There are several critical modifications of our protocol which reflect the target uniqueness. These modifications include buffer, working temperatures and column adjustments.
The first critical modification is the buffer in use (section 3.3) such buffers need to be altered to reflect the correct pH range, ions/ligands and ionic strength needed for protein stability and functions. If the target shows any sign of instability (degradation, precipitation or loss of function) one need to test and search for other more suitable buffers. Another critical issue is the purification speed and working temperatures. As a mean to avoid protein degradation (due to proteases or protein inner instability) rapid purification should performed at 277°K (including the use of cold buffers, rotors and columns).
Affinity purification steps as well as other chromatography stages can be perform on various resin sources. Affinity resin can be protein loaded using several techniques and it should be altered based on the local settings. If the resin is loaded by passing the protein solution over it, one should use slow flow (1-1.5 ml/min) to ensure maximum protein capture. For batch binding (mixing the resin with the protein solution) one need to allow ~10 min incubation at room temperature and longer (up to 1 hr) at 277°K. Based on the affinity strength, resin wash could be done under various imidazole concentrations.
Overall, alteration of each step in this protocol should take place in order to purify efficiently the unique protein target taking under consideration this purification scheme as a guide.
Acknowledgments
We acknowledge Dr. Amir Aharoni for his support and Geula Davidov, Noam Grimberg and Chen Guttman for their advice and comments.
References
- Faivre D, Schuler D. Magnetotactic Bacteria and Magnetosomes. Chem Rev. 2008;108:4875–4898. doi: 10.1021/cr078258w. [DOI] [PubMed] [Google Scholar]
- D'Andrea LD, Regan L. TPR proteins: the versatile helix. Trends Biochem Sci. 2003;28:655–662. doi: 10.1016/j.tibs.2003.10.007. [DOI] [PubMed] [Google Scholar]
- Young JC, Barral JM, Hartl Ulrich, F More than folding: localized functions of cytosolic chaperones. Trends Biochem Sci. 2003;28:541–547. doi: 10.1016/j.tibs.2003.08.009. [DOI] [PubMed] [Google Scholar]
- Brocard C, Hartig A. Peroxisome targeting signal 1: is it really a simple tripeptide? Biochim Biophys Acta. 2006;1763:1565–1573. doi: 10.1016/j.bbamcr.2006.08.022. [DOI] [PubMed] [Google Scholar]
- Fransen M, Amery L, Hartig A, Brees C, Rabijns A, Mannaerts GP, Van Veldhoven PP. Comparison of the PTS1- and Rab8b-binding properties of Pex5p and Pex5Rp/TRIP8b. Biochim Biophys Acta. 2008;1783:864–873. doi: 10.1016/j.bbamcr.2008.02.013. [DOI] [PubMed] [Google Scholar]
- Baker MJ, Frazier AE, Gulbis JM, Ryan MT. Mitochondrial protein-import machinery: correlating structure with function. Trends Cell Biol. 2007;17:456–464. doi: 10.1016/j.tcb.2007.07.010. [DOI] [PubMed] [Google Scholar]
- Mirus O, Bionda T, von Haeseler A, Schleiff E. Evolutionarily evolved discriminators in the 3-TPR domain of the Toc64 family involved in protein translocation at the outer membrane of chloroplasts and mitochondria. J Mol Model. 2009;15:971–982. doi: 10.1007/s00894-008-0449-y. [DOI] [PubMed] [Google Scholar]
- Gatsos X, Perry AJ, Anwari K, Dolezal P, Wolynec PP, Likic VA, Purcell AW, Buchanan SK, Lithgow T. Protein secretion and outer membrane assembly in Alphaproteobacteria. FEMS Microbiol Rev. 2008;32:995–1009. doi: 10.1111/j.1574-6976.2008.00130.x. [DOI] [PMC free article] [PubMed] [Google Scholar]
- Tiwari D, Singh RK, Goswami K, Verma SK, Prakash B, Nandicoori VK. Key residues in Mycobacterium tuberculosis protein kinase G play a role in regulating kinase activity and survival in the host. J Biol Chem. 2009;284:27467–27479. doi: 10.1074/jbc.M109.036095. [DOI] [PMC free article] [PubMed] [Google Scholar]
- Edqvist PJ, Broms JE, Betts HJ, Forsberg A, Pallen MJ, Francis MS. Tetratricopeptide repeats in the type III secretion chaperone, LcrH: their role in substrate binding and secretion. Mol Microbiol. 2006;59:31–44. doi: 10.1111/j.1365-2958.2005.04923.x. [DOI] [PubMed] [Google Scholar]
- Grunberg K, Muller EC, Otto A, Reszka R, Linder D, Kube M, Reinhardt R, Schuler D. Biochemical and proteomic analysis of the magnetosome membrane in Magnetospirillum gryphiswaldense. Appl Environ Microbiol. 2004;70:1040–1050. doi: 10.1128/AEM.70.2.1040-1050.2004. [DOI] [PMC free article] [PubMed] [Google Scholar]
- Komeili A, Vali H, Beveridge TJ, Newman DK. Magnetosome vesicles are present before magnetite formation, and MamA is required for their activation. Proc Natl Acad Sci USA. 2004;101:3839–3843. doi: 10.1073/pnas.0400391101. [DOI] [PMC free article] [PubMed] [Google Scholar]
- Okuda Y, Fukumori Y. Expression and characterization of a magnetosome-associated protein, TPR-containing MAM22, in Escherichia coli. FEBS Lett. 2001;491:169–173. doi: 10.1016/s0014-5793(01)02178-0. [DOI] [PubMed] [Google Scholar]
- Taoka A, Asada R, Sasaki H, Anzawa K, Wu LF, Fukumori Y. Spatial localizations of Mam22 and Mam12 in the magnetosomes of Magnetospirillum magnetotacticum. J Bacteriol. 2006;188:3805–3812. doi: 10.1128/JB.00020-06. [DOI] [PMC free article] [PubMed] [Google Scholar]
- Studier FW. Protein production by auto-induction in high density shaking cultures. Protein Expression and Purification. 2005;41:207–234. doi: 10.1016/j.pep.2005.01.016. [DOI] [PubMed] [Google Scholar]


