Abstract
We demonstrated a method to screen for binders to a particular G-quadruplex sequence using easily designed short peptides consisting of naturally occurring amino acids and mining of binding data using statistical methods such as hierarchical clustering analysis (HCA). Despite the small size of the library used in this study, candidates of specific binders were identified. In addition, a selected peptide stabilized the G-quadruplex structure of a DNA oligonucleotide derived from the promoter region of the protooncogene c-MYC. This study illustrates how a peptide library can be designed and presents a screening guideline for construction of G-quadruplex binders. Such G-quadruplex peptide binders could be functionally modified to enable switching, cellular penetration, and organelle-targeting for cell and tissue engineering.
1. Introduction
Research over the last few decades has revealed that some DNA and RNA secondary structures modulate a variety of cellular events. One secondary structure in particular, the G-quadruplex [1] regulates cellular events such as transcription, translation, pre-RNA splicing, and telomerase elongation, all of which play roles in various serious diseases and cellular aging [2–6]. Systems capable of controlling DNA and RNA G-quadruplex structures would therefore be useful for the modulation of various cellular events for the purpose of producing biological effects. Because of their biological importance, many G-quadruplex-targeting ligands [7, 8] have been described, including phthalocyanine derivatives [9], porphyrin derivatives [10], and others [11–14]. However, the next generation of binders should have more G-quadruplex sequence specificity, higher inducing or collapsing ability of the structure, and a greater degree of functionality including binding on-off switching, cellular penetration, and the ability to target organelles.
De novo designed peptides (peptides not derived from domains of binding proteins) are promising next generation G-quadruplex binding candidates because of the following advantages they offer: (i) peptides are easier to design and synthesize than antibodies or recombinant proteins; (ii) they can mimic protein-G-quadruplex interactions; (iii) analyses based on peptide libraries can be used to elucidate binding properties of DNAs; (iv) in addition to naturally occurring amino acids, various functional moieties (e.g., artificial amino acids) can be employed as building blocks in designed peptides; (v) because certain peptide sequences may exhibit transmembrane or hormonal properties, combining peptides with these functional sequences with G-quadruplex-binding peptides can produce multifunctional molecular systems useful in cell and tissue engineering.
To increase the utility of the peptide library technology, we designed peptide microarrays composed of various secondary structures. The designed peptide arrays were initially applied to protein analysis [15–21]. Upon addition of various proteins to these peptide arrays, library peptides containing fluorescent probes showed different binding responses depending on the peptide sequence. These response patterns served as “protein fingerprints” (PFPs), which can be used to establish the identity of a target protein and correlate the recognition properties of a target protein to a particular peptide [15, 16, 21]. In addition, by applying statistical analyses such as hierarchical clustering analysis (HCA) and principal component analysis (PCA) to PFPs, researchers can draw high-confidence correlations between target proteins and biological function, based primarily upon peptide charge and hydrophobicity data [19, 21]. We successfully applied our system to screen for peptide ligands that tightly bind to a target protein and simultaneously control the function of a protein related to the target [20]. This approach has several advantages, such as ease of peptide library design and robust selection of ligands with novel structures for the control of signaling pathways and/or cascades.
Here, we demonstrate a model screening of binders to a particular G-quadruplex sequence using easily designed short peptides consisting of naturally occurring amino acids. We also examined the stability of the DNA G-quadruplex structure upon addition of a G-quadruplex-binding peptide and checked whether the peptides could induce or collapse the G-quadruplex structure. This study illustrates how a peptide library can be designed and presents a screening guideline for the construction of next-generation ligands with increased specificity to particular G-quadruplexes and increased functionality, including on-off switching and the ability to penetrate cells and target organelles.
2. Experimental Methods
2.1. General Remarks
All chemicals and solvents were of reagent or HPLC grade and were used without further purification. Oligodeoxynucleotide samples purified by HPLC were purchased from Hokkaido System Science (Sapporo, Japan). HPLC was performed on a GL-7400 HPLC system (GL sciences, Tokyo, Japan) using an Inertsil ODS-3 (10 × 250 mm; GL Science) column for preparative purification with a linear acetonitrile/0.1% trifluoroacetic acid (TFA) gradient at a flow rate of 3.0 mL/min. Peptides were analyzed using MALDI-TOF MS on an Autoflex III (Bruker Daltonics, Billerica, MA, USA) mass spectrometer with 3,5-dimethoxy-4-hydroxycinnamic acid as the matrix.
2.2. Synthesis of a Designed Peptide Minilibrary
The designed peptide library was synthesized on Fmoc-NH-SAL-PEG Resin (Watanabe Chemical Industries, Hiroshima, Japan) using an automatic synthesizer (Advanced ChemTech Model 357 FBS) with Fmoc chemistry [22] using Fmoc-AA-OH (4 eq., Watanabe Chemical Industries) according to the O-(7-azabenzotriazol-1-yl)-1,1,3,3-tetramethyluronium hexafluorophosphate (HATU, Watanabe Chemical) method. Side chain protections were as follows: t-butyl (tBu) for Glu and Tyr, trityl (Trt) for His, and t-butyloxycarbonyl (Boc) for Lys. The peptides were cleaved from the resin and side chain protections were removed by incubating the peptides for 2 h in TFA (Watanabe Chemical Industries)/H2O/triisopropylsilane (Wako Pure Chemical Industries, Tokyo, Japan) (20:1:1, v/v). The peptides were precipitated by addition of cold diethylether and then collected by centrifugation. The recovered peptides were dissolved in water to about 1 mM and stored at 4°C. In order to determine the concentration of library peptide stock solutions, the absorbance at 280 nm (for Trp (ε = 5500) and Tyr (ε = 1490) [23]) of a diluted solution of each peptide was measured on a U-1900 UV spectrometer (Hitachi High-Technologies, Tokyo, Japan). After a screening assay in 3.2, selected peptides were purified by RP-HPLC and characterized by MALDI-TOF MS for further experiments in 3.3–3.5. Purified peptides were dissolved in water to about 1 mM and their concentrations were measured by their absorbance at 280 nm, after which they were stored at 4°C.
2.3. Screening of Library Peptides Using Gel Electrophoresis
Prior to analysis, each sample in 10 mM Tris-HCl (pH 7.0) buffer containing 0.1 mM EDTA was heated to 85°C for 5 min then gently cooled to room temperature at a rate of 1.0°C min−1. Native gel electrophoresis was performed using nondenaturing gels containing 13% polyacrylamide. Loading buffer (2 μL) was mixed with 2 μL of 5 μM DNA sample with/without 50 μM library peptide in 10 mM Tris-HCl (pH 7.0) buffer containing 0.1 mM EDTA. A 4 μL aliquot of each sample was loaded onto the gel and electrophoresed at 10.0 V cm−1 for 2 h at room temperature. Gels were stained with SYBR Gold Nucleic Acid Gel Stain (Invitrogen, Carlsbad, CA, USA) and imaged using a FLA-7000 imager (Fuji Film, Tokyo, Japan). Band intensities were quantified using Malti Gauge software (V.3.2) for Windows. The bound DNA percentage was calculated according to the following equation: {(intensity of DNA band without peptide) − (intensity of DNA band with peptide)} / (intensity of DNA band without peptide) × 100 (%).
2.4. Preparation of the Color Scale Bar
Data were manipulated according to previously reported standard procedures to prepare the black-red-yellow color scale bar [16]. A portable-pixel-map (.ppm) file format was used. Each grid position was first assigned a three whole-number code based on its RGB color-code response (0, 0, 0 = full black, lowest bound DNA percentage; 255, 0, 0 = red, moderate percentage; 255, 255, 0 = yellow, highest percentage), which corresponds to all the bound DNA percentages divided into 511 levels. The numbers of the grid were saved as a comma-separated-value (.csv) file including the three (or four) lines of the .ppm setting at the top of the file. The file was then saved in the portable-pixel-map format by simply adding a “.ppm” extension to the filename. This file can be opened using graphic viewer software, resized, then saved in another file format, such as bitmap (.bmp).
2.5. Hierarchical Clustering Analysis (HCA)
The Euclidean distance [24, 25], a common measure of the distance between two vectors, was used to determine the similarity between two binding-color images obtained from different target DNAs. After the similarities between the binding-color images were determined, HCA was conducted. Ward's clustering algorithm was used and the dendrogram was obtained from the Euclidean distances using the Excel Macro program [26]. The horizontal axis represents the distance between vectors (left for high similarity and right for low similarity).
2.6. Circular Dichroism (CD) Spectroscopy
Circular dichroism (CD) spectroscopy was performed using DNA (1 μM) and peptide no. 010 (0 or 100 μM) in 20 mM Tris-HCl (pH 7.0) containing 0.1 mM KCl and 0.1 mM EDTA. A J-820 spectropolarimeter (JASCO, Hachioji, Japan) with a thermoregulator using a quartz cell with a 1 cm path length at 25°C was used for CD measurements. Prior to analysis, each sample was heated to 85°C for 5 min, then gently cooled to room temperature at a rate of 1.0°C min−1.
2.7. UV Melting of G-Quadruplex Structures
The UV absorbance was measured using a Shimadzu 1800 spectrophotometer equipped with a temperature controller (Shimadzu, Kyoto, Japan). Melting curves for the G-quadruplex structures were obtained by measuring the UV absorbance at 295 nm in 10 mM Tris-HCl (pH 7.0) containing 0.1 mM KCl and 0.1 mM EDTA at a heating rate of 1.0°C min−1. The melting temperature (Tm) values for 5 μM DNAs with/without peptide no. 010 (100 μM) were obtained from UV melting curves as described previously [27, 28].
3. Results and Discussion
3.1. Design and Synthesis of the Peptide Minilibrary
We constructed a minilibrary consisting of 32 peptides of varying charge and/or hydrophobicity using the strategy shown in Figure 1(a). The KWK motif is known for its ability to bind to DNA [29]. We designed peptides in which four residues were added to the N-terminus of the KWK motif. Addition of a G or P at 4th residue allowed for varying the flexibility of the peptide main chain. Addition of an H, W, F, or Y at residue X1 allowed for varying the aromatic character of the peptide, while addition of a K or E at residues Z1 and Z2 allowed for varying the peptide charge. Figures 1(b) and 1(c) show all the library peptide species. The column and row headings in Figure 1(c) denote the aromatic residues (H, W, F, or Y at X1) and numbers of amines (E, or K at Z1 and Z2; numbers of amines = 3, 4, or 5), respectively, and each cell displays the number of the synthesized peptide. Hence, the library consists of two series (a G series and a P series) of designed peptides, each of which contains 16 systematically designed peptides.
Figure 1.
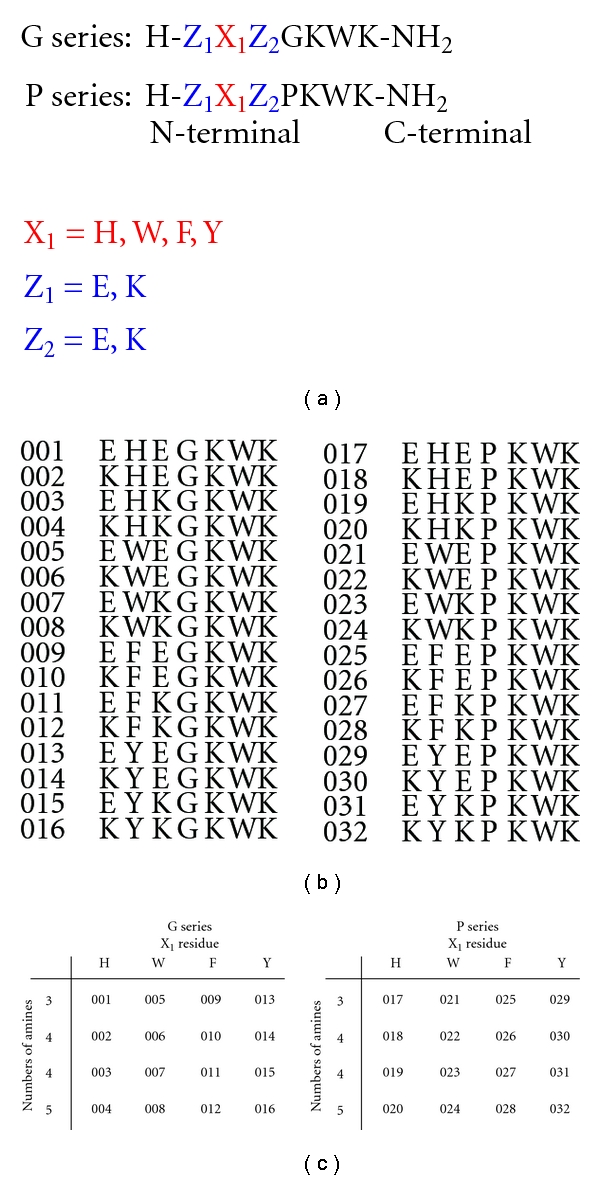
(a) Design of the G and P series peptide libraries. (b) Peptide identification number and sequence of each library peptide. (c) Distribution of peptides into the G or P series.
3.2. Screening of the Designed Peptide Minilibrary and Data Mining
Library peptides were assayed for their ability to bind to four different parallel G-quadruplex sequences from the promoter regions or the 5′ untranslated regions of human protooncogenes (MYC from c-MYC, NRAS from NRAS, WNT from WNT 3, and FGF from FGF 3 [30–32] (Table 1)) using electrophoresis. The bound DNA percentages varied according to the peptide sequence (Figure 2), and the binding percentages ranged from high to low. To visualize the binding properties more clearly, these results were converted into black-red-yellow images as shown in Figure 2(b). The color images correspond to two series of peptides (Figure 1(c)), and the color of each cell indicates the binding response of each peptide against each DNA. The RGB color codes represent the degree of binding: black (lowest percentage), to red (moderate percentage), to yellow (highest percentage), divided into 511 levels. Some peptides, such as nos. 008 and 032, bound to all DNAs tested, while peptide no. 011, for example, little bound to the DNAs tested. The cells in the bottom portion of each series were colored in either yellow or red, indicating that DNAs preferentially bind cationic peptides. In addition, while the MYC G-quadruplex tended to bind to G-series peptides and the NRAS G-quadruplex tended to bind to P-series peptides, the FGF and WNT G-quadruplexes tended to bind to both peptide series. This result implies that imparting variation of flexibility to the peptides by adding a G and P to the middle of the sequence provides DNA selectivity.
Table 1.
Sequences of the G-quadruplex DNAs used in this study.
| Oligo name | Gene | Sequence (5′-3′) |
|---|---|---|
| MYC | c-MYC | AGGGTGGGGAGGGTGGGGA |
| NRAS | NRAS | GGGAGGGGCGGGTCTGGG |
| WNT | WNT 3 | GGGCCGGGCGGGAGGGG |
| FGF | FGF 3 | GGGGGAGGGGCGGGTAGGG |
Figure 2.
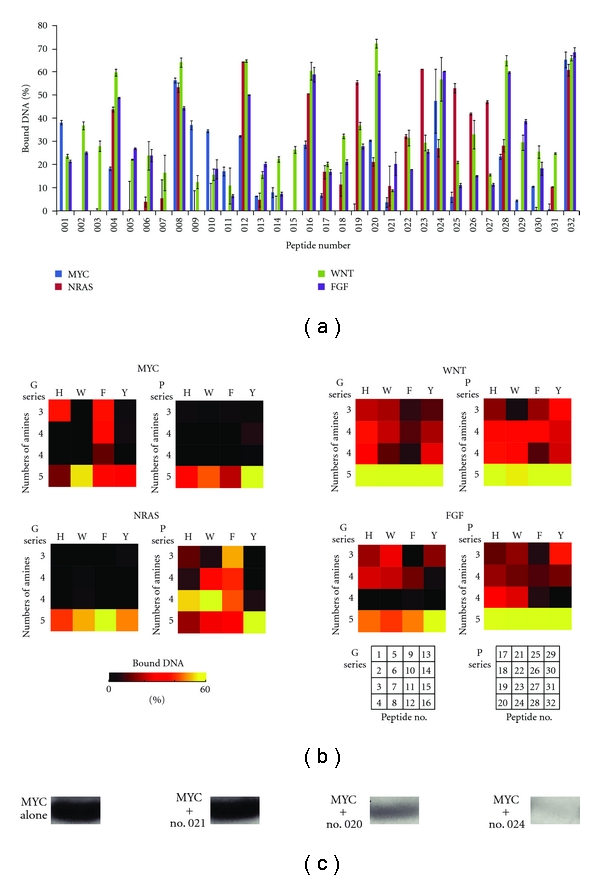
(a) Bound DNA percentages to each library peptide. (b) Bound DNA percentages to each peptide shown as a color illustration. (c) Typical MYC bands in PAGE. MYC alone (A representative of 0% bound DNA percentage), MYC with no. 021 (a representative of 0–10% bound DNA percentage), MYC with no. 020 (a representative of 30–40% bound DNA percentage), and MYC with no. 024 (a representative of 50–70% bound DNA percentage).
Similarities between the peptides in their ability to bind DNAs were analyzed quantitatively using HCA with Euclidean distances. As shown in Figure 3(a), the library peptides could be sorted into five groups (Groups A–E). Group A peptides exhibited a relatively high binding percentage for the FGF and WNT G-quadruplexes, but had less binding percentages for the MYC and NRAS G-quadruplexes. Peptides classified into Group B showed relatively low binding percentages for all DNAs except the WNT G-quadruplex, to which they bound tightly. Peptides classified into Group C had high binding percentages for the MYC G-quadruplex, but lower binding percentages for the NRAS, FGF, and WNT G-quadruplexes. Peptides in Group D demonstrated an intermediate binding percentage for all quadruplexes except MYC, to which they did not bind. Finally, peptides classified into Group E, which are characterized by 5 amines, bound to all the DNAs tested with high binding percentages. Because peptides with 3 or 4 amines demonstrated diverse binding percentages, we concluded that a greater number of specific binders could be obtained by designing and synthesizing a wider array of peptides with 3 or 4 amines. Despite the small size of the library used in this study, we were able to obtain peptides that demonstrated sequence-specific binding. For example, our results show that peptides 009 and 010 are MYC-specific binders, and peptides 003, 007, and 015 are WNT-specific binders.
Figure 3.
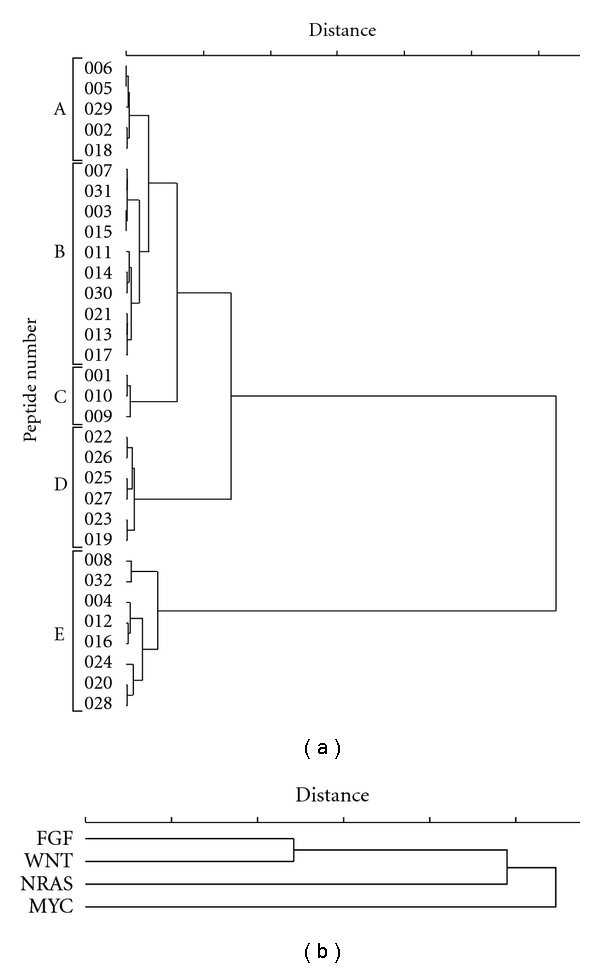
(a) Peptide-binding divergence clustering dendrogram generated by Euclidean distance analysis. (b) DNA-binding property clustering dendrogram generated by Euclidean distance analysis.
Similarities between G-quadruplex binding properties were analyzed quantitatively using the HCA method. A clustering dendrogram (Figure 3(b)) was generated by analysis of Euclidean distances. The horizontal axis indicates the distance between the binding percentages of the G-quadruplexes for library peptides (left indicates high similarity and right indicates low similarity). The clustering dendrogram discriminated MYC from the other G-quadruplexes, which tended to cluster. We suspect that some of the library peptides recognized a particular sequence (GGGCGGG) present in all the G-quadruplexes tested except for MYC. Although much additional data regarding the binding of library peptides to various DNA types are needed, these results imply that the statistical approaches used in this study could be used to characterize the binding properties of a variety of other G-quadruplexes.
3.3. Confirmation of DNA Binding
We selected peptide no. 010 as a MYC-specific binder and after the peptide was purified, an electrophoresis assay was conducted to confirm no. 010 binding to MYC, (Though we also selected and purified peptide no. 009, the purified no. 009 peptide did not strongly bind to MYC (data not shown)). Figure 4 shows the bound DNA percentages at which purified peptide no. 010 bound to various DNAs. Peptide no. 010 strongly bound to MYC, while the peptide weakly bound to NRAS and WNT or little bound to csMYC (complementary sequence of MYC, 5′-TCCCCACCCTCCCCACCCT-3′) and TELO (representative antiparallel G-quadruplex sequence from human telomeric DNA, 5′-AGGGTTAGGGTTAGGGTTAGGG-3′ [33]). Although G-quadruplex FGF as well as MYC highly bound to peptide no. 010, the data clearly suggest that peptide no. 010 bound only to the parallel G-quadruplex sequence, not to the antiparallel G-quadruplex sequence or to the other sequences, including the MYC complementary sequence. Although additional assays and/or detailed confirmation experiments are needed, these results indicate that the electrophoresis in 3.2 is one of the promising tools for screening DNA-binding peptides using peptide libraries.
Figure 4.
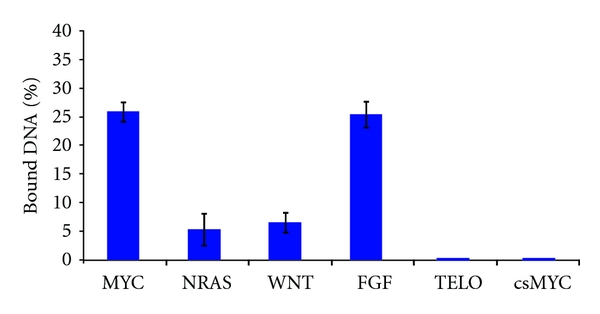
Binding percentages of various DNAs with purified peptide no. 010 (100 μM).
3.4. Circular Dichroism (CD) Spectroscopy of G-Quadruplex DNAS with/without Peptide no. 010
We performed CD experiments to investigate induction of structural and conformational changes in the MYC G-quadruplex upon interaction with peptide no. 010. The MYC G-quadruplex yielded spectra that were characteristic of parallel quadruplexes, with a maximum at 260 nm and a minimum at 240 nm (Figure 5(a)), a result that is consistent with a prior study [10]. Interestingly, addition of peptide no. 010 led to an increase in the parallel G-quadruplex signature. Furthermore we performed CD experiments with the other G-quadruplex DNAs upon addition of peptide no. 010. The FGF G-quadruplex showed similar results to those of MYC (Figure 5(b)), whereas the NRAS and the WNT did not show significant changes upon addition of peptide no. 010 (Figures 5(c) and 5(d). These results were correlated to the DNA-binding results in 3.3.
Figure 5.

CD spectra of (a) MYC, (b) FGF, (c) NRAS, and (d) WNT with/without peptide no. 010.
3.5. Thermodynamic Stability of the DNA G-Quadruplexes Bound to Peptide no. 010
We investigated the effect of peptide binding on the thermodynamic stability of the DNA G-quadruplexes. Table 2 shows the Tm of the MYC and FGF G-quadruplexes in the presence and absence of 100 μM peptide no. 010. (Melting curves of MYC and FGF with/without no. 010 are shown in Figure 6.) Surprisingly, the MYC G-quadruplex Tm changed appreciably in the presence of the peptide, increasing by about 8°C while the FGF G-quadruplex Tm changed in the presence of the peptide, increasing by only about 4°C.
Table 2.
Melting temperature (Tm) of G-quadruplex DNAs with/without peptide no. 010.
| Oligo name | No. 10 peptide | Tm (°C) |
|---|---|---|
| MYC | 0 μM | 41.3 ± 0.2 |
| 100 μM | 49.3 ± 0.3 | |
| FGF | 0 μM | 25.5 ± 0.9 |
| 100 μM | 29.2 ± 0.3 |
Figure 6.
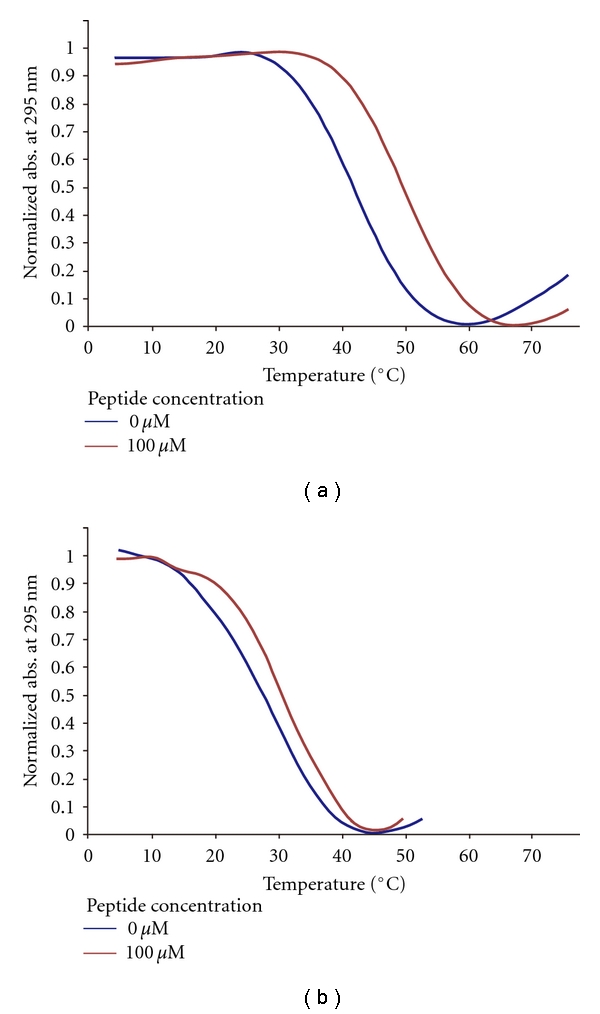
Normalized UV melting curves for (a) MYC and (b) FGF with/without 100 μM peptide no. 010.
These results imply that peptide no. 010 binds to the MYC G-quadruplex by a kind of specific association. Although we could not screen peptides with a high binding selectivity, despite the limited size of our library, we found that peptide no. 010 acts as a promising stabilizer of the G-quadruplex structure as well as a binder to MYC.
4. Conclusions
In this study, we demonstrated a novel designed peptide library method to screen for binders to a particular G-quadruplex and also demonstrated the mining of data generated from binding results using statistical methods such as HCA. Our results suggest that the use of a designed peptide library enables the discrimination of G-quadruplex sequences and could therefore provide useful information for the design of peptides for targeting specific G-quadruplexes. Despite the small size of the library used in this study, some candidates of specific binders were identified. By improving the design of the library peptides and the screening methods, our system could be used to screen for peptides that bind to a particular G-quadruplex and alter its thermodynamic properties. It would then be possible to find binders with strong specificity to which specific functional attributes can be added, such as the ability to penetrate cells in order to control DNA and/or RNA events for the purposes of cell and tissue engineering.
Acknowledgments
This study was supported in part by grants from the Ministry of Education, Culture, Sports, Science and Technology (MEXT). K. Usui is grateful to the Grants-in-Aid for Scientific Research, the “Core research” project (2009–2014) from MEXT.
References
- 1.Gellert M, Lipsett MN, Davies DR. Helix formation by guanylic acid. Proceedings of the National Academy of Sciences of the United States of America. 1962;48(12):2013–2018. doi: 10.1073/pnas.48.12.2013. [DOI] [PMC free article] [PubMed] [Google Scholar]
- 2.Henderson E, Hardin CC, Walk SK, Tinoco I, Jr., Blackburn EH. Telomeric DNA oligonucleotides form novel intramolecular structures containing guanine·guanine base pairs. Cell. 1987;51(6):899–908. doi: 10.1016/0092-8674(87)90577-0. [DOI] [PubMed] [Google Scholar]
- 3.Siddiqui-Jain A, Grand CL, Bearss DJ, Hurley LH. Direct evidence for a G-quadruplex in a promoter region and its targeting with a small molecule to repress c-MYC transcription. Proceedings of the National Academy of Sciences of the United States of America. 2002;99(18):11593–11598. doi: 10.1073/pnas.182256799. [DOI] [PMC free article] [PubMed] [Google Scholar]
- 4.Rankin S, Reszka AP, Huppert J, et al. Putative DNA quadruplex formation within the human c-kit oncogene. Journal of the American Chemical Society. 2005;127(30):10584–10589. doi: 10.1021/ja050823u. [DOI] [PMC free article] [PubMed] [Google Scholar]
- 5.Miyoshi D, Matsumura S, Nakano SI, Sugimoto N. Duplex dDissociation of telomere DNAs induced by molecular crowding. Journal of the American Chemical Society. 2004;126(1):165–169. doi: 10.1021/ja036721q. [DOI] [PubMed] [Google Scholar]
- 6.Yu HQ, Miyoshi D, Sugimoto N. Characterization of structure and stability of long telomeric DNA G-quadruplexes. Journal of the American Chemical Society. 2006;128(48):15461–15468. doi: 10.1021/ja064536h. [DOI] [PubMed] [Google Scholar]
- 7.De Cian A, Lacroix L, Douarre C, et al. Targeting telomeres and telomerase. Biochimie. 2008;90(1):131–155. doi: 10.1016/j.biochi.2007.07.011. [DOI] [PubMed] [Google Scholar]
- 8.Hurley LH. DNA and its associated processes as targets for cancer therapy. Nature Reviews Cancer. 2002;2(3):188–200. doi: 10.1038/nrc749. [DOI] [PubMed] [Google Scholar]
- 9.Yaku H, Murashima T, Miyoshi D, Sugimoto N. Anionic phthalocyanines targeting G-quadruplexes and inhibiting telomerase activity in the presence of excessive DNA duplexes. Chemical Communications. 2010;46(31):5740–5742. doi: 10.1039/c0cc00956c. [DOI] [PubMed] [Google Scholar]
- 10.Seenisamy J, Rezler EM, Powell TJ, et al. The dynamic character of the G-quadruplex element in the c-MYC promoter and modification by TMPyP4. Journal of the American Chemical Society. 2004;126(28):8702–8709. doi: 10.1021/ja040022b. [DOI] [PubMed] [Google Scholar]
- 11.Roy S, Tanious FA, Wilson WD, Ly DH, Armitage BA. High-affinity homologous peptide nucleic acid probes for targeting a quadruplex-forming sequence from a MYC promoter element. Biochemistry. 2007;46(37):10433–10443. doi: 10.1021/bi700854r. [DOI] [PubMed] [Google Scholar]
- 12.Müller S, Pantoş GD, Rodriguez R, Balasubramanian S. Controlled-folding of a small molecule modulates DNA G-quadruplex recognition. Chemical Communications. 2009;(1):80–82. doi: 10.1039/b816861j. [DOI] [PMC free article] [PubMed] [Google Scholar]
- 13.Chakraborty TK, Arora A, Roy S, Kumar N, Maiti S. Furan based cyclic oligopeptides selectively target G-quadruplex. Journal of Medicinal Chemistry. 2007;50(23):5539–5542. doi: 10.1021/jm070619c. [DOI] [PubMed] [Google Scholar]
- 14.Schouten JA, Ladame S, Mason SJ, Cooper MA, Balasubramanian S. G-quadruplex-specific peptide-hemicyanine ligands by partial combinatorial selection. Journal of the American Chemical Society. 2003;125(19):5594–5595. doi: 10.1021/ja029356w. [DOI] [PubMed] [Google Scholar]
- 15.Usui K, Ojima T, Takahashi M, Nokihara K, Mihara H. Peptide arrays with designed secondary structures for protein characterization using fluorescent fingerprint patterns. Biopolymers. 2004;76(2):129–139. doi: 10.1002/bip.10568. [DOI] [PubMed] [Google Scholar]
- 16.Usui K, Takahashi M, Nokihara K, Mihara H. Peptide arrays with designed α-helical structures for characterization of proteins from FRET fingerprint patterns. Molecular Diversity. 2004;8(3):209–218. doi: 10.1023/b:modi.0000036237.82584.2d. [DOI] [PubMed] [Google Scholar]
- 17.Tomizaki KY, Usui K, Mihara H. Protein-detecting microarrays: current accomplishments and requirements. ChemBioChem. 2005;6(5):782–799. doi: 10.1002/cbic.200400232. [DOI] [PubMed] [Google Scholar]
- 18.Usui K, Tomizaki KY, Ohyama T, Nokihara K, Mihara H. A novel peptide microarray for protein detection and analysis utilizing a dry peptide array system. Molecular BioSystems. 2006;2(2):113–121. doi: 10.1039/b514263f. [DOI] [PubMed] [Google Scholar]
- 19.Usui K, Tomizaki KY, Mihara H. Protein-fingerprint data mining of a designed α-helical peptide array. Molecular BioSystems. 2006;2(9):417–420. doi: 10.1039/b608875a. [DOI] [PubMed] [Google Scholar]
- 20.Usui K, Tomizaki KY, Mihara H. Screening of α-helical peptide ligands controlling a calcineurin-phosphatase activity. Bioorganic and Medicinal Chemistry Letters. 2007;17(1):167–171. doi: 10.1016/j.bmcl.2006.09.075. [DOI] [PubMed] [Google Scholar]
- 21.Usui K, Tomizaki KY, Mihara H. A designed peptide chip: protein fingerprinting technology with a dry peptide array and statistical data mining. Methods in Molecular Biology. 2009;570:273–284. doi: 10.1007/978-1-60327-394-7_13. [DOI] [PubMed] [Google Scholar]
- 22.Chan WC, White PD. Fmoc Solid Phase Peptide Synthesis: A Practical Approach. New York, NY, USA: Oxford University Press; 2000. [Google Scholar]
- 23.Pace CN, Vajdos F, Fee L, Grimsley G, Gray T. How to measure and predict the molar absorption coefficient of a protein. Protein Science. 1995;4(11):2411–2423. doi: 10.1002/pro.5560041120. [DOI] [PMC free article] [PubMed] [Google Scholar]
- 24.Grognux J, Reymond JL. Classifying enzymes from selectivity fingerprints. ChemBioChem. 2004;5(6):826–831. doi: 10.1002/cbic.200300779. [DOI] [PubMed] [Google Scholar]
- 25.Goddard JP, Reymond JL. Enzyme activity fingerprinting with substrate cocktails. Journal of the American Chemical Society. 2004;126(36):11116–11117. doi: 10.1021/ja0478330. [DOI] [PubMed] [Google Scholar]
- 26. http://aoki2.si.gunma-u.ac.jp/lecture/stats-by-excel/vba/html/clustan.html.
- 27.Sugimoto N, Nakano SI, Katoh M, et al. Thermodynamic parameters to predict stability of RNA/DNA hybrid duplexes. Biochemistry. 1995;34(35):11211–11216. doi: 10.1021/bi00035a029. [DOI] [PubMed] [Google Scholar]
- 28.Nakano SI, Kanzaki T, Sugimoto N. Influences of ribonucleotide on a duplex conformation and its thermal stability: study with the chimeric RNA-DNA strands. Journal of the American Chemical Society. 2004;126(4):1088–1095. doi: 10.1021/ja037314h. [DOI] [PubMed] [Google Scholar]
- 29.Johnson NP, Mazarguil H, Lopez A. Strandedness discrimination in peptide-polynucleotide complexes. Journal of Biological Chemistry. 1996;271(33):19675–19679. doi: 10.1074/jbc.271.33.19675. [DOI] [PubMed] [Google Scholar]
- 30.Patel DJ, Phan AT, Kuryavyi V. Human telomere, oncogenic promoter and 5′-UTR G-quadruplexes: diverse higher order DNA and RNA targets for cancer therapeutics. Nucleic Acids Research. 2007;35(22):7429–7455. doi: 10.1093/nar/gkm711. [DOI] [PMC free article] [PubMed] [Google Scholar]
- 31.Kumari S, Bugaut A, Huppert JL, Balasubramanian S. An RNA G-quadruplex in the 5′ UTR of the NRAS proto-oncogene modulates translation. Nature Chemical Biology. 2007;3(4):218–221. doi: 10.1038/nchembio864. [DOI] [PMC free article] [PubMed] [Google Scholar]
- 32.Kumar N, Maiti S. A thermodynamic overview of naturally occurring intramolecular DNA quadruplexes. Nucleic Acids Research. 2008;36(17):5610–5622. doi: 10.1093/nar/gkn543. [DOI] [PMC free article] [PubMed] [Google Scholar]
- 33.Wang Y, Patel DJ. Solution structure of the human telomeric repeat d[AG3(T2AG3)3] G-tetraplex. Structure. 1993;1(4):263–282. doi: 10.1016/0969-2126(93)90015-9. [DOI] [PubMed] [Google Scholar]


