

Abstract
For a number of organisms, the ability to withstand periods of nutrient deprivation correlates directly with lifespan. However, the underlying molecular mechanisms are poorly understood. We show that deletion of the N-myristoylprotein, Sip2p, reduces resistance to nutrient deprivation and shortens lifespan in Saccharomyces cerevisiae. This reduced lifespan is due to accelerated aging, as defined by loss of silencing from telomeres and mating loci, nucleolar fragmentation, and accumulation of extrachromosomal rDNA. Genetic studies indicate that sip2Δ produces its effect on aging by increasing the activity of Snf1p, a serine/threonine kinase involved in regulating global cellular responses to glucose starvation. Biochemical analyses reveal that as yeast age, hexokinase activity increases as does cellular ATP and NAD+ content. The change in glucose metabolism represents a new correlate of aging in yeast and occurs to a greater degree, and at earlier generational ages in sip2Δ cells. Sip2p and Snf1p provide new molecular links between the regulation of cellular energy utilization and aging.
Keywords: Aging, Saccharomyces cervisiae, N-myristoylproteins, Snf1p kinase interacting protein-2, glucose metabolism, cellular energy storage
A direct correlation between lifespan and stress resistance, including resistance to the stress of nutrient deprivation, has been observed in organisms as diverse as Saccharomyces cerevisiae, Caenorhabditis elegans, and Drosophila melanogaster (Service et al. 1985; Arking et al. 1991; Graves et al. 1992; Larsen 1993; Kennedy et al. 1995; Lithgow et al. 1995). Similarly, mice raised on a calorically restricted diet have extended maximal lifespans and exhibit a delay in the evolution of aging-associated physiologic and pathologic changes (Arking 1998; Lee et al. 1999). Although the correlation between stress resistance and lifespan has been used to identify several genes that affect longevity, it remains poorly understood at a molecular level (Kenyon et al. 1993; Orr and Sohal 1994; Kennedy et al. 1995; Morris et al. 1996; Murakami and Johnson 1996; Ewbank et al. 1997; Kimura et al. 1997; Lin et al. 1997, 1998).
A recent analysis of the expression patterns of 6347 genes in the mouse gastrocnemius muscle indicated that aging is associated with a significant (≥∼2-fold) increase or decrease in the steady state levels of 113 mRNAs (Lee et al. 1999). Of the 58 mRNAs that increase with age, 16% encode proteins involved in stress responses (e.g., oxidative damage and heat shock). Of the 55 mRNAs that decrease with age, 13% encode enzymes involved in various aspects of energy metabolism. Compared to age-matched controls, calorie-restricted mice manifest reduced expression of genes that participate in stress responses and DNA repair. There is also increased expression of genes that regulate glycolysis (glucose-6-phosphate isomerase) and gluconeogenesis (fructose-1,6-bisphosphatase), and that inhibit glycogen synthesis (IPP-2). These expression profiles indicate that aging is associated with a decline in metabolic activity while chronic caloric restriction produces a shift toward increased energy metabolism and gluconeogenesis.
One of the challenges presented by this type of comprehensive profiling of gene expression is to identify simplified experimental models where genetic and biochemical tests can be performed to decipher how these or other responses to nutrient deprivation regulate and/or mediate the aging process. S. cerevisiae provides one such model. Individual yeast cells undergo a limited number of divisions prior to cessation of growth (Mortimer and Johnston 1959). Different strains have characteristic mean and maximum lifespans, indicating an underlying genetic basis for aging (Kennedy et al. 1995). Mutations in the RecQ-like helicase, Sgs1p, have been reported to cause accelerated aging in yeast. Rapid aging is manifested by reduced generational lifespan, sterility, redistribution of the Sir transcriptional silencing complex from HM loci and telomeres to the nucleolus, changes in nucleolar morphology, and accumulation of extrachromosomal rDNA circles (ERCs; Sinclair and Guarente 1997; Sinclair et al. 1997). Mutations in the human homolog of SGS1 also affect longevity, producing the premature aging phenotype of Werner's syndrome (Yu et al. 1996).
In rich media, S. cerevisiae utilizes glucose as its preferred carbon source. When glucose becomes limiting, cells transition from fermentative growth to respiratory growth on alternative carbon sources. S. cerevisiae enters a stationary phase when all nutrient sources are exhausted (Werner-Washburne et al. 1993, 1996). The diauxic transition from fermentative to respiratory growth is accompanied by global changes in gene transcription (DeRisi et al. 1997). Remarkably, DNA array analysis of these changes has disclosed some responses that are similar to those produced by caloric restriction in mice, e.g., the induction of fructose 1,6-bisphosphatase, which redirects glycolysis towards glucose-6-phosphate (Lee et al. 1999).
Because of the correlation between the generational lifespan of yeast, and their ability to withstand the stress of nutrient deprivation (Kennedy et al. 1995), we hypothesized that some of the genes that regulate resistance to starvation during stationary phase may also affect aging. We focused our attention on genes encoding N-myristoylproteins. MyristoylCoA:protein N-myristoyltransferase (Nmt1p; Duronio et al. 1989; Bhatnagar et al. 1998) covalently links myristate to proteins that participate in a number of signal transduction cascades (e.g., kinases and their substrates, phosphatases, and the α subunits of heterotrimeric G proteins). N-myristoylation is cotranslational, appears to be irreversible, and in many cases is critical for biological function (for review, see Boutin 1997; Bhatnagar and Gordon 1997). NMT1 is an essential gene (Duronio et al. 1989). Previously, we had used a temperature sensitive allele (nmt1–451D) encoding an enzyme with reduced affinity for myristoylCoA, to establish that deficits in protein N-myristoylation result in decreased resistance to acute and gradual nutrient deprivation, even at permissive temperatures (24°C; Ashrafi et al. 1998). In this report, we have identified an N-myristoylprotein that provides a functional link between cellular aging in yeast and carbon source utilization.
Results
Deficiencies in protein N-myristoylation are associated with all of the known manifestations of accelerated aging in S. cerevisiae
Micromanipulation assays were used to determine whether nmt1–451D has any effect on lifespan. Studies conducted at the permissive temperature of 24°C revealed a mean lifespan that was half that of isogenic wild-type cells (14.5 vs. 27.5 generations; Fig. 1A).
Figure 1.


The shortened lifespan of nmt1–451D cells is accompanied by progressive sterility. (A) Lifespans of isogenic NMT1 and nmt1–451D cells were determined by removing daughters from their mothers after each cell division and scoring the number of times each mother divides prior to senescence (n = 85 NMT1 mothers; 68 nmt1–451D mothers). Experiments were performed at 24°C. Mean lifespan is defined as the generation at which 50% of mothers are still dividing. The difference in mean lifespans of NMT1 and nmt1–451D mothers was statistically significant as judged by the nonparametric Wilcoxen signed rank test. (B) nmt1–451D cells become sterile during their short lifespan. Numbers that appear above each bar represent the number of cells whose pheromone response was scored at this point in their lifespan. At various generation times, individual MATa cells were moved near to a disk soaked in 0.25 μm α-factor. Four hours later they were scored for shmooing. They were then moved to an area of the YPD/agar plate away from the source of pheromone and allowed to complete their lifespan. nmt1–451D cells that have completed <50% of their lifespan are responsive to pheromone (i.e., they are fertile), while cells that have completed over 70% of their shortened lifespan are almost always sterile. (C) Parallel assays of sterility in the isogenic wild-type strain yield results equivalent to those obtained with the nmt1–451D strain: the percentage of sterile cells increases progressively as a function of the percentage of lifespan completed. Similar results were obtained when the wild-type strain was assayed at 24°C and at 30°C (data not shown).
A shortened lifespan can reflect accelerated aging or a reduction in cellular fitness. The ability to distinguish between these two possibilities is important: Short-lived mutants are most likely to arise from genetic alterations that have deleterious effects on cellular viability. Sterility accompanies aging in yeast and has been used to distinguish a shortened lifespan due to accelerated aging from a shortened lifespan due to a general loss of fitness (Sinclair et al. 1997). Sterility arises from a loss of silencing at the HM mating loci (Smeal et al. 1996). The loss of silencing appears to be attributable to redistribution of a transcriptional silencing complex, composed in part of Sir2p, Sir3p, and Sir4p, from HM loci (and telomeres) to the nucleolus (Smeal et al. 1996; Kennedy et al. 1997; Sinclair et al. 1997). We found that the percentage of nmt1–451D cells that are sterile increases progressively towards the end of their reduced lifespan (Fig. 1B). This progressive sterility is similar to the pattern observed during the course of aging of isogenic wild-type cells (Fig. 1C).
As noted earlier, nucleolar enlargement and fragmentation, and the localization of Sir complexes to these nucleolar fragments represent other markers of aging in yeast (Sinclair et al. 1997). nmt1–451D cells appear normal during their first few divisions, but by generation 7 (50% of their mean lifespan) ∼35% have enlarged and/or fragmented nucleoli containing Sir3p. Sir3p is also absent from telomeres (n = 2 experiments) (Fig. 2). The percentage of nmt1–451D cells that display nucleolar abnormalities and Sir complex redistribution increases further with increasing cell divisions. These changes are not apparent until later generational time points in the wild-type strain, i.e., between generation 7 and 14 (50% of mean lifespan), the number of NMT1 cells with nucleolar fragmentation and Sir complex redistribution increases from <1% to 16%–18% (1000 cells scored/time point/experiment; n = 2 independent experiments).
Figure 2.

Nucleolar fragmentation and Sir complex redistribution is observed in generation 7 nmt1–451D but not NMT1 cells. Multilabel immunofluorescence study. Fixed NMT1 cells [average bud scar count (ABSC) = 7.3 ± 3.3] and nmt1–451D cells (ABSC = 6.9 ± 2.0) are stained blue with 4′,6′-diamidino-2-phenylindole (DAPI) to visualize nuclear DNA. Nucleoli are marked with antibodies to yeast fibrillarin (Nop1p, red). Sir3p appears green. (Left panels) DAPI plus Nop1p; (middle panels) DAPI plus Sir3p; (right panels) DAPI, Nop1p, and Sir3p. The NMT1 cell has an intact, crescent-shaped nucleolus and Sir3p appears as telomeric spots. Sir3p is redistributed to a fragmented nucleolus in the nmt1–451D cell (colocalization of Sir3p and Nop1p in the nucleolus is seen as yellow).
Sinclair and Guarente (1997) noted that extrachromosomal rDNA circles (ERCs) accumulate as yeast cells age. The S. cerevisiae genome contains ∼140 rDNA genes clustered together on chromosome XII as 9.1-kb repeats. Homologous recombination between these repeats results in excision of a single rDNA repeat and generation of ERCs (Clark-Walker and Azad 1980; Larionov et al. 1980). ERCs are able to replicate because each rDNA repeat contains an origin of replication (Larionov et al. 1984). Asymmetric segregation of ERCs to mothers occurs after each division, resulting in their exponential accumulation (Sinclair and Guarente 1997). Sinclair and Guarente (1997) proposed that ERCs may promote cell death by titrating essential transcription factors and enzymes involved in DNA replication and repair.
ERC formation was compared in young and older NMT1 and nmt1–451D cells by probing Southern blots of total cellular DNA with a 32P-labeled rDNA fragment. The results reveal that nmt1–451D cells contain higher levels of ERCs. By generation 7, the difference is 5-fold (n = 3 experiments; Fig. 3). Thus, nmt1–451D cells satisfy all of the known criteria associated with accelerating aging in S. cerevisiae.
Figure 3.

ERC levels are increased in nmt1–451D cells. DNA was recovered from NMT1 cells (ABSC = 0.9 ± 1.1 and 7.2 ± 2.1) and isogenic nmt1–451D cells (ABSC = 0.9 ± 1.1 and 6.8 ± 2.6), and fractionated by agarose gel electrophoresis. Southern blots were probed with 32P-labeled rDNA. ERCs and their multimeric derivatives are indicated by arrows.
Loss of Sip2p recapitulates the rapid aging phenotype of nmt1–451D cells
Because the enzymatic defects of nmt451Dp can affect levels of N-myristoylation of one or more of its substrates, these results raise the question of which N-myristoylproteins are responsible for the rapid aging phenotype.
The yeast genome contains ≥64 open reading frames (ORFs) encoding known or putative Nmt1p substrates (Ashrafi et al. 1998). In many cases, undermyristoylation of a protein results in its functional inactivation (for review, see Bhatnagar and Gordon 1997). In a recent study (Ashrafi et al. 1998), we disrupted each ORF in wild-type cells and found nine N-myristoylproteins whose loss mimicked the starvation-sensitive phenotype of nmt1–451D cells (Arf1p, Arf2p, Ptc2p, Sip2p, Van1p, YBL049W, YJR114W, YKR007W, YMR077C) (see http://genome-www.stanford.edu/Saccharomyces/). Sip2p was selected for further analysis because its removal from wild-type cells produces a more complete loss of viability during stationary phase than any of the other eight N-myristoylproteins, and because it has been linked to a signaling pathway that regulates cellular responses to glucose deprivation.
Sip2p (Snf interacting protein-2) is a member of an evolutionarily conserved and homologous group of proteins that includes Sip1p and Gal83p. All bind to Snf1p with high affinity (Jiang and Carlson 1996, 1997). Snf1p is a serine/threonine kinase required for induction of glucose-repressed genes in response to glucose starvation (Celenza and Carlson 1984, 1986; for review, see Hardie et al. 1998). The induced genes encode proteins involved in the use of alternative carbon sources, gluconeogenesis, and respiration (Celenza and Carlson 1986). The Snf1p pathway is also required for resistance to other forms of environmental stress (Alepuz et al. 1997). snf1Δ cells exhibit a number of defects during stationary phase including reduced survival (Thompson-Jaeger et al. 1991). Although the precise role of Sip2p in the Snf1p pathway has not been defined, it physically links Snf1p to its activating subunit, Snf4p, and may serve as an adaptor molecule between Snf1p kinase and some of its substrates (Yang et al. 1994). The three components of the Snf1p kinase complex (Snf1p, Snf4p, and its interacting Sip proteins) are homologous to the subunits of AMP-activated protein kinase, a mammalian cellular fuel gauge involved in regulating cellular stress responses (Hardie et al. 1998).
sip2Δ cells grow normally on glucose-, galactose- or raffinose-containing media, exhibit appropriately regulated SUC2 (invertase) expression, and sporulate properly (Yang et al. 1994). However, the mean lifespan of NMT1sip2Δ cells is reduced to 60% of isogenic wild-type cells (average value from five independent experiments). The reduction is accompanied by all known manifestations of accelerated aging. These cells become sterile during their shortened lifespan (Fig. 4A), display nucleolar enlargement and fragmentation, and manifest Sir3p redistribution (Fig. 4B). After seven generations, ERC levels in NMT1sip2Δ cells are <2-fold greater than age-matched wild-type cells, but by generation 12 they are 10-fold greater (Fig. 4C).
Figure 4.

NMT1sip2Δ cells undergo rapid aging. (A) Sterility assay, performed as described in the legend to Fig. 1B. The shortened lifespan of these cells is accompanied by progressive sterility. (B) Multilabel immunohistochemical study of a sip2Δ cell at generation 12 (ABSC = 11.8 ± 3.6) showing Sir3p redistribution to a fragmented nucleolus. Note that 20%–25% of generation 12 sip2Δ cells exhibit these phenotypic changes (n = 1000 cells/scored per experiment; two independent experiments). (C) Increased ERC levels in sip2Δ cells. ABSC for the indicated generations were as follows: NMT1 (0.9 ± 1.1; 7.5 ± 2.8; 12.7 ± 4.1); NMT1sip2Δ (0.9 ± 1.1; 7.2 ± 2.3; 11.8 ± 3.6).
The difference in ERC levels between NMT1sip2Δ and NMT1 cells is less than the difference between nmt1–451D and wild-type cells at generation 7, suggesting that in addition to Sip2p, other N-myristoylproteins contribute to the rapid aging phenotype of the nmt1–451D strain. However, the mean lifespans of isogenic nmt1–451D and nmt1–451Dsip2Δ cells are nearly identical (12.5 vs. 14.5 generations, respectively, in a direct comparison; data not shown). This finding supports the notion that Sip2p is the major N-myristoylprotein responsible for the reduced lifespan of nmt1–451D cells. Moreover, removal of some of the other candidate N-myristoylproteins from wild-type cells has either no effect on lifespan (e.g., arf2Δ, Fig. 5A), or produces a reduction in lifespan but without the concomitant appearance of molecular markers of aging (e.g., arf1Δ; Fig. 5A,B).
Figure 5.

Loss of other N-myristoylproteins produces a shortening of lifespan without accompanying signs of aging or has no effect on lifespan. (A) Lifespans of the wild-type strain and isogenic strains containing null alleles of genes encoding two N-myrisotylproteins, Arf1p and Arf2p. (B) Sterility assay of arf1Δ cells.
The reduced lifespan produced by sip2Δ is not a unique feature of the genetic background of our S288C-derived wild-type strain (YB332; Table 1). Deletion of SIP2 in a different wild-type strain (W303) produces a comparable result: The lifespan of YO40 (sip2Δ; Table 1) is 71% of its wild-type YO36 parent.
Table 1.
Yeast strains
| Strain
|
Genotype
|
Source
|
|---|---|---|
| YB332 | S288CMATaNMT1ura3-52his3Δ200ade2-101lys2-801leu2-3,112 | Ashrafi et al. 1998 |
| YB336 | S288CMATanmt1-451Dura3-52his3Δ200ade2-101lys2-801leu2-3,112 | Ashrafi et al. 1998 |
| YB614 | S288CMATaNMT1ura3-52his3Δ200ade2-101lys2-801leu2-3,112, snf4::HIS3 | this work |
| YB616 | S288CMATaNMT1ura3-52his3Δ200ade2-101lys2-801leu2-3,112, mig1::HIS3 | this work |
| YB618 | S288CMATaNMT1ura3-52his3Δ200ade2-101lys2-801leu2-3,112,sip1::HIS3 | this work |
| YB651 | S288CMATaNMT1ura3-52his3Δ200ade2-101lys2-801leu2-3,112gal-83::HIS3 | this work |
| YB670 | 288CMATaNMT1ura3-52his3Δ200ade2-101lys2-801leu2-3,112,sip2::URA3, snf4::HIS3 | this work |
| YB674 | S288CMATaNMT1ura3-52his3Δ200ade2-101lys2-801leu2-3,112,sip2::LEU2, snf4::HIS3 | this work |
| YB810 | S288CMATaNMT1ura3-52his3Δ200ade2-101lys2-801leu2-3,112,sip2::HIS3 | this work |
| YO28 | S288CMATaNMT1ura3-52his3Δ200ade2-101lys2-801leu2-3,112snf1::HIS3 | this work |
| YO43 | S288CMATaura3-52/ura3-52his3Δ200/his3Δ200ade2-101/ade2-101 lys2-801/lys2-801leu2/leu2trp1-901/trp1-901TYR/tyr CANS/canR snf1Δ::URA3 | M. Johnston |
| YB686 | S288CMATaura3-52his3Δ200-ade2-101lys2-801leu2trpl-901TYRCANSsip2Δ::HIS3 | this work |
| YB687 | S288CMATaura3-52his3Δ200ade2-101lys2-801leu2trp1-901TYRCANSsnf1Δ::URA3 | this work |
| YB688 | S288CMATaura3-52his3Δ200ade2-101lys2-801leu2trp1-901TYRCANSsip2Δ::HIS3 snf1Δ::URA3 | this work |
| YO36 | W303-1AMATaura3-1his3-11,15ade2-1leu2-3,112can1-100trp1-1 | Sinclair et al. 1997 |
| YO40 | W303-1AMATaura3-1his3-11,15ade2-1leu2-3,112can1-100trp1-1, sip2::URA3 | this work |
Genetic evidence that sip2Δ accelerates aging by producing increased or aberrant cellular Snf1p kinase activity
The effect of Sip2p on aging is not shared by Snf1p's other protein partners. gal83Δ has no detectable effect on lifespan, whereas sip1Δ reduces lifespan to 82% of wild-type, but without any of the accompanying manifestations of accelerated aging. Therefore, we examined whether the impact of sip2Δ on aging was Snf1p-independent or -dependent.
Two observations indicated that diminishing or removing Snf1p activity does not accelerate aging. First, NMT1snf1Δ cells have a reduced lifespan (79% of wild-type), but this reduction is not associated with sterility or Sir3p redistribution. Moreover, ERC accumulation is actually reduced by generation 7 in this strain (Fig. 6A; below). Therefore, we presume that the decreased lifespan of NMT1snf1Δ cells results from deleterious effects unrelated to accelerated aging. Second, removing Snf4p (the activating subunit of the Snf1p complex), reduces Snf1p activity (Jiang and Carlson 1997; Ludin et al. 1998) and leads to a modest increase in longevity: The mean generational lifespan of NMT1snf4Δ cells is 110%–120% of wild type.
Figure 6.

ERC accumulation is reduced when Snf1p is deleted and augmented when Snf1p is overexpressed. Southern blot analysis of ERC accumulation in the indicated strains at generation 0–1 (ASBC = 0.9 ± 1.1) and at generation 7 (ASBC = 7.3 ± 2.6). Equal amounts of total cellular DNA were applied to all lanes. Note that in generation 7 wild-type cells containing YEp24–SNF1, the signal produced from hybridization of the labeled rDNA probe with ERCs, is >80% of the signal produced by reaction of the probe with total cellular DNA.
Next, we tested the hypothesis that sip2Δ accelerates aging by producing increased or aberrant cellular Snf1p kinase activity. When a high-copy 2 μ plasmid (YEp24) containing SNF1 under the control of its own promoter was introduced into wild-type cells, mean generational lifespan decreased to 74% of cells containing vector alone. This reduction was accompanied by sterility, nucleolar fragmentation, and Sir3p redistribution. By generation 7, YEp24–SNF1 had produced a marked augmentation in ERC concentration so that they were the predominant cellular DNA species (Fig. 6B). In contrast, deletion of SNF1 from wild-type cells produced a 2-fold reduction in ERC levels by generation 7 (Fig. 6A,B).
YEp24–SNF1 also caused an additional 25% reduction in the mean lifespan of sip2Δ cells whereas the YEp24 vector had no effect. The reduced lifespan of sip2Δ,YEp24–SNF1 cells was associated with the manifestations of aging, including further increases in ERC levels (data not shown).
Together, these results indicated that sip2Δ produces its effect on aging by increasing the activity of Snf1p kinase. Moreover, the mean generational lifespans of isogenic snf1Δ and sip2Δsnf1Δ strains were the same, consistent with the idea that they operate through a common pathway. However, caution must be exercised when interpreting results obtained with this double mutant because cells with snf1Δ are “sick” and have a reduced lifespan that is not accompanied by the manifestations of aging. Therefore, we created a NMT1sip2Δsnf4Δ strain as an additional test of the hypothesis that sip2Δ affects aging by increasing Snf1p kinase. We reasoned that if sip2Δ results in increased kinase activity, then the effect of this increase should be countered by removal of Snf1p's coactivator, Snf4p. The results support the hypothesis. The mean generational lifespans of two independently generated sip2Δsnf4Δ strains (YB670 and YB674 in Table 1) were twice that of isogenic sip2Δ cells (31–33 vs. 15, respectively), and equivalent to snf4Δ cells (110%–120% of wild type) (Fig. 7).
Figure 7.

Removal of the Snf1p activator, Snf4p, rescues the reduced lifespan of sip2Δ cells. Strains YB810 (sip2Δ) and YB674 (sip2Δsnf4Δ) were derived from a S288C parent (YB322; see Table 1).
Changes in the intracellular location of Mig1p provide support for generational increases in Snf1p kinase activity
Mig1p is a zinc finger transcription factor responsible for most of the repression of glucose-repressed genes in yeast (Nehlin and Ronne 1990; Nehlin et al. 1991; for review, see Johnston 1999). In wild-type cells, Mig1p resides in the nucleus when glucose is present. In the absence of glucose, Snf1p phosphorylation of Mig1p results in redistribution of the protein from the nucleus to the cytoplasm (DeVit et al. 1997).
We monitored the intracellular location of a Mig1p–green fluorescent protein (GFP) chimera expressed in wild-type S288C and W303 strains (YB332 and YO36 in Table 1), and in YB322-derived sip2Δ cells, during growth in YPD medium (glucose = 110 mm). At generation 0–1, Mig1p–GFP is detectable in the cytoplasm in <1% of wild-type and sip2Δ cells (n = 2–3 experiments/strain; Fig. 8A). In the two wild-type strains, this value remains essentially unchanged at generation 5–6 (0%–5%). By generation 11–12, 25% of cells (range = 24%–34%, n = 3 experiments) display cytoplasmic localization despite continuous exposure to glucose-rich medium prior to and throughout the sorting steps used for their recovery, and during fluorescence microscopy (Fig. 8A). Remarkably, 10%–23% of sip2Δ cells exhibit cytoplasmic Mig1p–GFP as early as generation 4–5. This value increases to 58%–95% by generation 11–12 (n = 2 experiments) (Fig. 8A).
Figure 8.


The cytoplasmic localization of a Mig1p–GFP fusion protein provides in vivo evidence for enhanced Snf1p kinase activity in sip2Δ cells. (A) Wild type and sip2Δ containing a CEN plasmid encoding Mig1p–GFP were sorted to the generations indicated. The intracellular distribution of Mig1p–GFP was then determined using fluorescence microscopy. Nomarski and fluorescence images of each field are shown. Arrows point to examples of cells where Mig–GFP is predominantly cytoplasmic. See text for further discussion. (B) Western blot of total cellular proteins isolated from young and old sip2Δ cells without (−) and with (+) a MIG1–GFP plasmid. Cells were recovered at the generational ages noted in parenthesis. The blot was probed with a GFP monoclonal antibody. The arrow points to the Mig1p–GFP fusion protein.
A trivial explanation for the age-associated redistribution of Mig1p–GFP would be proteolytic release of its GFP domain rather than increased Snf1p-dependent phosphorylation of its Mig1p domain. Therefore, Western blots containing total cellular proteins from generation 0–1 and generation 7 wild-type and sip2Δ cells were probed with antibodies to GFP. An immunoreactive band of the expected mass for Mig1p–GFP was observed in young and old wild-type and sip2Δ cells and was absent from control cells that lacked the MIG1–GFP plasmid (Fig. 8B). The intensity of this band did not diminish with increasing age in sip2Δ cells, nor did a band appear corresponding to GFP alone (Fig. 8B). These results indicate that there is no appreciable cleavage of Mig1p–GFP as cells age.
We can not formally rule out the possibility that the generation-associated redistribution of Mig1p–GFP from the nucleus to the cytoplasm reflects as yet unknown effects of aging on the activity of one or more cellular phosphatases, or on the nuclear import/export machinery itself. However, two findings from previous studies of Mig1p localization in vegetatively growing cells (Dewit et al. 1997; Dewit and Johnston 1999) support our hypothesis that Snf1p mediates Mig1p translocation in aging cells. First, Mig1p is not observed in the cytoplasm of log-phase cells in the absence of Snf1p. Second, Mig1p contains four putative Snf1p phosphorylation sites, two within its nuclear export signal sequence. The number of log-phase cells that contain cytoplasmic Mig1p decreases as more of these sites are mutated: Negligible cytoplasmic Mig1p is observed when all of these sites are eliminated (DeVit and Johnston 1999).
Finally, because mig1Δ cells have a normal lifespan (data not shown), we concluded that Mig1p is not responsible for expression of the sip2Δ phenotype, or an essential regulator of aging.
Biochemical studies of glucose uptake and metabolism in sip2Δ compared to wild-type cells
Snf1p acts as a nutrient sensor in the cell, coupling glucose availability to gene expression. Snf1p activity is upregulated when cells are starved or otherwise stressed (Hardie et al. 1998). Therefore, a series of biochemical assays were performed to determine whether there are changes in glucose uptake and metabolism as a function of generational age and SIP2 allele.
Direct measurements of intracellular glucose levels revealed no statistically significant differences between wild-type and sip2Δ cells cultured in YPD medium. This similarity was evident when young (generation 0–1) cells were compared with one another (4.9 ± 0.8 vs. 3.8 ± 1 fmole/cell for wild type and sip2Δ, respectively), and with older cells (4.7 ± 1.7 and 6.1 ± 0.5 fmole/cell for generation 6 wild type and generation 4 sip2Δ; 106 cells assessed/genotype/generational time point/assay; n = 4).
Hexokinase catalyzes the first step in glycolysis, the conversion of glucose to glucose-6-phosphate (G6P). Sensitive microanalytic methods (Passonneau and Lowry 1993) were used to measure hexokinase activity in individual wild-type and sip2Δ mother yeast cells to determine whether aging is associated with changes in the ability of glucose to enter the glycolytic pathway. Individual cells were harvested directly from YPD/agar plates by micromanipulation (n = 9–21 individual mothers assayed/age/genotype). Hexokinase activity increases progressively as wild-type mothers progress from generation 0–1 to generation 19–21. Hexokinase activity in sip2Δ mothers rises more abruptly, to higher levels at earlier generations (Fig. 9A).
Figure 9.
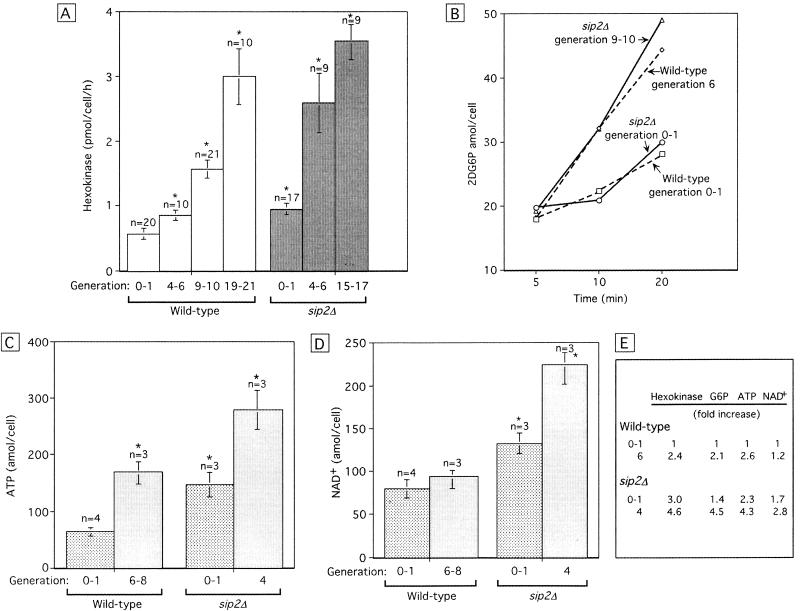
The rapid aging of sip2Δ cells is accompanied by increases in hexokinase activity and energy storage. (A) Hexokinase activity was measured in lysates prepared from individual mothers recovered at the indicated generations. Mean values ± 1 s.d. are plotted. (Asterisk) Values are significantly different (P < 0.05; Student's t-test) from generation 0–1 wild-type cells. (B) 2DG6P accumulation as a function of time in isogenic wild-type and sip2Δ cells. (C,D) Cellular ATP and NAD+ levels. The number of independently generated lysates/cell population/generational time point is noted (n = 50,000 cells assayed/lysate/experiment). Note that generation 4 in sip2Δ cells and generation 6–8 in wild-type cells represent equivalent fractions of their total lifespans. (E) Summary of fold differences in hexokinase, G6P, ATP, and NAD+ levels relative to young wild-type cells.
Virtually identical age- and genotype-associated differences in hexokinase activity were documented in lysates prepared from populations of 2 × 10⁴ wild-type and sip2Δ cells that had been recovered at various ages by sorting (data not shown). This result provided evidence that the sorting procedure does not produce artifactual changes in cellular glycolytic activity.
Microanalytic methods were then used to measure directly the product of hexokinase, G6P, in lysates representing 5 × 10⁴ sorted cells. Levels of G6P correlated directly with the generational age- and SIP2 allele-associated differences noted in hexokinase activity. In wild-type cells, G6P levels increase 2.1-fold from generation 0–1 to generation 6 (i.e., from 21.8 ± 3 to 45.1 ± 7 amole/cell; P < 0.05). G6P levels in generation 0–1, 4, and 6–8 sip2Δ cells were 1.4-fold, 4.5-fold, and 5.3-fold higher than in the reference generation 0–1 wild-type cells (P < 0.05 for generations 4 and 6–8).
Like glucose, 2-deoxyglucose (2DG) is a substrate for cellular glucose transporters and hexokinase. 2-deoxyglucose-6-phosphate (2DG6P) does not undergo rapid metabolic processing: For example, it takes 5000-fold more G6P dehydrogenase to oxidize 2DG6P than G6P (Passonneau and Lowry 1993). Therefore, changes in cellular 2DG6P levels after exposure to exogenous 2DG can be used as a reporter of 2DG uptake (and hexokinase activity).
Young and older wild-type and sip2Δ cells were incubated with 110 mm glucose for 20 min, followed by the addition of 0.1 mm 2DG. Aliquots were removed 5, 10, and 20 min after 2DG was added, and cellular 2DG6P levels were measured (see Materials and Methods). A similar progressive increase in 2DG6P occurs in young wild-type and sip2Δ cells (Fig. 9B). Moreover, there is no impairment in the uptake of 2DG and its conversion 2DG6P in older sip2Δ cells. The greater rate of accumulation of 2DG6P observed in older compared to younger cells (Fig. 9B) can be explained, at least in part, by their increased hexokinase activity.
These assays of cellular glucose, G6P and 2DG6P levels, and hexokinase activities indicate that a generational increase in Snf1p kinase activity can not be attributed to age-associated reductions in cellular glucose import, or to detectable defects in the ability of glucose to enter the glycolytic pathway. The observed generational increases in hexokinase and G6P prompted us to measure ATP and nicotinamide-adenine dinucleotide (NAD+) levels in wild-type and sip2Δ cells. The results disclosed that as wild-type cells proceed from generation 0–1 to generation 6 in medium containing 110 mm glucose they store energy. Cellular ATP content increases 2.6-fold from 64 ± 7.5 to 146.0 ± 21.5 amole/cell (P < 0.05; Fig. 9C), while NAD+ rises a modest 20% (Fig. 9D). sip2Δ cells store energy to a significantly greater extent: ATP content is 2.3-fold higher in young sip2Δ cells compared to young wild-type cells, and 4.3-fold higher at generation 4; NAD+ content is 1.7- and 2.8-fold higher, respectively (Fig. 9C,D).
Figure 9E summarizes the impressive correlation between fold-changes in hexokinase activity, G6P, ATP, and NAD+ as a function of generational age and SIP2 allele. It is important to note that as yeast cells age, their size increases. Therefore, increases in G6P, ATP, and NAD+ content may not necessarily be accompanied by increases in their molarity. To address this point, we defined the sizes of generation 0–1 and 7 sip2Δ cells (n = 90/group) by measuring their two-dimensional areas in photographs directly, and then calculating their volumes. The results revealed a 40% increase over the course of seven generations. The magnitude of this calculated increase is less than the increase in G6P, ATP, and NAD+ content documented as sip2Δ cells progress from generations 0–1 to 4–6, suggesting that the molarity of these compounds rises.
In summary, our findings indicate that changes in glucose metabolism are a manifestation of aging in wild-type yeast cells, and that this process is exaggerated in the more rapidly aging sip2Δ cells. As discussed below, these findings have implications concerning mechanisms that may underlie the relationship between calorie restriction, energy storage, and aging.
Discussion
The significance of mutations that produce a shortened lifespan must be viewed with caution. Proof that a mutation is actually affecting an aging-related pathway should include evidence that shortening of the generational lifespan is accompanied by other known stigmata of aging, and evidence that opposing genetic manipulations leads to increased lifespan. We believe that our genetic analysis of SIP2 and its associated Snf1p-kinase pathway satisfies these requirements. The shortening of lifespan observed in nmt1–451DSIP2 and NMT1sip2Δ strains is accompanied by all of the currently defined manifestations of aging in S. cerevisiae. This is in contrast to results obtained with other N-myristoylproteins selected in our screen, and with other members of the Snf1p kinase pathway. Deletion of some of these genes produce a shortening of lifespan without any accompanying signs of aging (e.g., arf1Δ, sip1Δ) or have no effect on mean generational lifespan (e.g., arf2Δ, gal83Δ, mig1Δ).
We have found that manipulating Snf1p-kinase activity affects aging in yeast. Forced expression of SNF1 in wild-type cells shortens lifespan and evokes all the known aging phenotypes, whereas deleting SNF4 (encoding the activating subunit of the Snf1p complex) extends lifespan. Moreover, removal of Sip2p accelerates aging through a Snf1p kinase-dependent mechanism: the rapid aging phenotype of sip2Δ cells is rescued completely by introduction of a snf4Δ mutation. The lifespan results obtained for snf1Δ and sip2Δsnf1Δ cells are difficult to interpret as complete removal of Snf1p results in loss of cellular fitness. This loss of fitness is not surprising because Snf1p is responsive to multiple cellular stresses, has multiple substrates, and hence is likely to have pleiotropic effects. Therefore, some activities of Snf1p may affect fitness without impacting aging. Removal of Snf4p simply attentuates Snf1p activity, thereby allowing assessment of the role of Snf1p in aging.
Yeast two-hybrid assays have established that Sip2p binds to Snf1p (Yang et al. 1994). In vitro kinase activity is not affected demonstrably by Sip2, but only a limited number of substrates have been tested (Yang et al. 1994). Previous genetic studies suggest that Sip2p, Gal83p, and Sip1p mediate interactions between Snf1p and distinct targets (Yang et al. 1994; Vincent and Carlson 1999). Based on our findings, we speculate that Sip2p inhibits phosphorylation of one or more cellular proteins/enzymes by Snf1p that normally affect aging. Alternatively, Sip2p may regulate production of Snf1p substrates or their interactions with the kinase. Removing Sip2p leads to an increase in Snf1p kinase activity, a conclusion supported by the augmented generational increase in Snf1p phosphorylation-dependent translocation of Mig1p from the nucleus to the cytoplasm of sip2Δ cells.
Snf1p is required for induction of glucose-repressed genes in response to glucose starvation. Therefore, it is intriguing that Snf1p activity increases as cells age, even when there is abundant glucose in the environment. Our measurements of intracellular glucose concentrations and of 2-deoxyglucose uptake indicate that aging wild-type and sip2Δ cells have no detectable defects in their ability to abstract glucose from the environment. Remarkably, the initial step in glycolysis, hexokinase-catalyzed conversion of glucose to G6P, increases as cells age, as does cellular ATP content. These effects are more pronounced in sip2Δ compared with wild-type cells.
The augmentation in cellular ATP content is also consistent with our proposed age-associated increase in Snf1p activity. The mammalian homolog of Snf1p, AMP-activated kinase (AMP-K), functions as a fuel guage to help conserve energy when cells are starved. AMP-K is known to phosphorylate, and thereby inactivate, a series of ATP-utilizing enzymes, resulting in retention of energy sources. These enzymes include acetylCoA carboxylase, and HMG CoA reductase, the critical regulator of isoprenoid and sterol biosynthesis. For example, inhibition of acetyl-CoA carboxylase can promote ATP conservation in two ways: (1) by turning off the ATP-consuming fatty acid biosynthetic pathway, and (2) by turning on the ATP-generating fatty acid oxidation pathway (for review, see Hardie et al. 1998). Like AMP-K, purified yeast Snf1p complex phosphorylates and inactivates (yeast) acetyl-CoA carboxylase (Acc1p; Mitchelhill et al. 1994).
Our biochemical analyses, which indicate that aging in yeast is marked by a shift in metabolism towards increased energy pools, are consistent with results obtained from DNA microarray studies of gene expression in the skeletal muscles of young and old mice (Lee et al. 1999). A persistent theme in the study of aging is the close connection between regulation of energy intake and expenditure, and longevity. Many organisms, including S. cerevisiae, C. elegans, and mice can alter their rate of aging in response to changes in nutrient availability (Klass and Hirsch 1976; Ashrafi et al. 1999; Lee et al. 1999). In C. elegans, an insulin-like signaling pathway controls entry into diapause when nutrients are limited during the larval stage. This pathway also affects longevity during the adult stage (Kenyon et al. 1993; Kimura et al. 1997; Wood 1998).
In a recent study, Guarente and coworkers speculated that NAD+ may serve as an indicator of cellular nutritional status and help regulate aging (Imai et al. 2000). They discovered that Sir2p, which mediates transcriptional silencing, suppresses ERC formation and extends generational lifespan, and is a NAD-dependent histone deacetylase. They postulated that increases in NAD+ may promote Sir2p-mediated deacetylation, resulting in enhanced genomic stability and suppression of potentially deleterious patterns of gene expression (Imai et al. 2000). Our biochemical studies establish that as cells age there is a concommittent increase in NAD+ content. Because increased NAD+ would be expected to enhance Sir2p-mediated histone deacetylase activity, the increase may be a response designed to help oppose genomic instability. It appears that genomic instability associated with aging in yeast can not be attributed simply to lowered total cellular NAD+ levels leading to decreased Sir2p histone deacetylase activity. A future challenge will be to determine whether the increased cellular NAD+ pools are accessible to Sir2p.
Snf1p, Sip2p, and their associated signaling pathway(s) can now be added to a very short list of molecules known to functionally link adaptations to changes in carbon source availability and aging. Our data indicate that Snf1p activity is increased despite abundant nutrients in the environment and that aging is associated with an alteration in cellular energy homeostasis. We propose that the context in which energy accumulation occurs may help determine its impact on the aging process. One interpretation of the accelerated aging phenotype of sip2Δ cells is that activation of Snf1p at early generational ages causes premature and inappropriate accumulation/compartmentalization of energy reserves and that the cells are not equipped to deal with these reserves. It will be important to use the microanalytic approaches described in this report to obtain a more comprehensive view of cellular glucose metabolism as yeast cells age. For example, do changes in Snf1p kinase activity correlate with changes in fructose 1,6 bisphosphatase, the enzyme that is increased in calorically restricted mice (Lee et al. 1999) and which drives glycolysis backward to G6P?
As noted above, Sip2p is unique among Snf1p's partners in affecting aging: Neither gal83Δ or sip1Δ produce a demonstrable effect, suggesting partner-specific effects on phosphorylation. Therefore, identifying the protein targets of this kinase in the presence or absence of Sip2p (or in presence or absence of Sn4p) should provide additional clues about the molecular mechanisms that regulate longevity, and help identify the contexts in which these mechanisms operate.
In summary, S. cerevisiae provides an attractive, genetically manipulatable, unicellular, replicative eukaryotic model for deciphering the details about how cellular (and organismal) energy metabolism changes as a function of generational lifespan and Snf1p complex activity. The results should form a framework for designing and interpreting genetic and biochemical tests of whether and how these processes operate in multicellular organisms.
Materials and methods
Strains
The strains used for this study are listed in Table 1. ORFs were deleted in the haploid wild-type strains YB332 or YO36, and replaced with HIS3, URA3, or LEU2 markers using a protocol described previously (Baudin et al. 1993). Deletions were confirmed by PCR using allele-specific primers. To generate a snf1Δsip2Δ strain, a sip2Δ allele was engineered in the diploid strain YO43 (snf1Δ; kindly supplied by Mark Johnston, Washington University, Seattle) using the SIP2::HIS3 fragment employed for generation of strain YB810 (Table 1). Standard methods were used for selecting transformants, sporulation and subsequent tetrad analysis. sip2Δsnf1Δ cells were identified by scoring for growth on selective media and by allele-specific PCR.
Mean lifespan determination
Micromanipulation assays (Mortimer and Johnston 1959; Kennedy et al. 1995) were used to define the number of divisions that individual mothers underwent on YPD (1% yeast extract, 2% peptone, 2% dextrose)/agar plates at 24°C. Each experiment involved an analysis of 50–100 mothers of a given genotype. Wild-type cells were always used as internal controls. The statistical significance of observed differences in the lifespans of strains was evaluated using the nonparametric Wilcoxen signed rank test.
Preparation of old-cell populations by sorting
Cells were obtained with an average generational age of seven using the technique described by Smeal et al. (1996). Briefly, 2 × 10⁸ cells were harvested from a mid-log phase culture grown in YPD at 24°C. Cells were washed in phosphate buffered saline (PBS) and then resuspended in 1 ml of PBS containing 7 mg of EZ-link Sulfo-NHS-LC-LC biotin [sulfosuccinimidyl-6′-(biotinamido)-6-hexanamido hexanoate; Pierce]. Following gentle shaking for 15 min at 24°C, unbound biotin was removed by washing cells in PBS (four washes; 1 ml each). Cells were resuspended in 1 liter of YPD (containing 2.5% dextrose), grown at 24°C to an OD600 = 0.8, recovered by centrifugation (8 min at 4400g), and resuspended in 35 ml PBS containing streptavidin conjugated to magnetic beads (PerSeptive Biosystems; final concentration = 70 μg/ml). The mixture was incubated for 2 hr at 4°C in a polypropylene tube, with brief swirling every 15 min. Biotin-coated cells that had bound to magnetic beads were recovered with a magnetic sorter and washed eight times in ice cold YPD, with magnetic sorting after each wash. Average bud scar count (ABSC) of the sorted cell population was determined by staining an aliquot of the cells with fluorescent brightener 28 (Sigma) and counting the number of bud scars per cell with a fluorescence microscope (n = 40–70 cells analyzed/preparation).
Generation 0–1 refers to the population of cells that remained after old cells had been removed by magnetic sorting. On average, 50% of cells in this population are newly formed daughters, 25% are mothers that have undergone one division, 12.5% are mothers that have undergone two divisions, etc.
To obtain a population that had undergone an average of 12–14 divisions, 108-sorted generation 7 cells were resuspended in 1 liter YPD (containing 2.5% dextrose) and incubated at 24°C for an additional 13 hr. A second sort was then performed exactly as above.
Defining the localization of Mig1p–GFP in aging cells
YB332, YO36 (wild type), and YB810 (sip2Δ) cells were transformed with pBM3315, a CEN plasmid containing MIG1–GFP under the control of the MIG1 promoter (DeVit et al. 1997; a gift from Mark Johnston, Washington University). Cells were sorted as above and the intracellular location of Mig1–GFP was defined by fluorescence microscopy (n ≥ 100 cells scored/generational time point/experiment; n = 2–3 independent experiments/strain). Exposure to glucose (2% w/v) was maintained throughout the sorting and microscopy steps.
To assess the integrity of Mig1–GFP, lysates were prepared from wild-type and sip2Δ cells recovered at generations 0–1 and 7. Cellular proteins were fractionated by SDS-PAGE and transferred to PVDF membranes (Millipore). Blots were probed with a mouse monoclonal anti-GFP (Zymed; final dilution = 1:1000). Antigen-antibody complexes were visualized using reagents and protocols contained in the enhanced chemiluminescence kit from Tropix.
Immunohistochemistry
Sir3p distribution was defined as follows. Cells (5–50 × 106) were washed twice in PBS, resuspended in 1 ml of 0.1 m EDTA (pH 8)/10 mm DTT, and incubated for 10 min at 30°C with gentle shaking. Cells were recovered by centrifugation, and washed in 1 ml YPD/20% (w/v) sorbitol. Spheroplasts were prepared by adding Zymolyase-100 (ICN, 100 U/mg; final concentration = 6 μg/ml) and incubating the cells at 30°C for 15–60 min (depending on the strain). Spheroplasts were recovered, washed, and resuspended in 1 ml of YPD/20% sorbitol and then fixed for 20 min in 3.7% formaldehyde. Fixed spheroplasts were resuspended in 200 μl YPD, placed on Vectabond-coated glass slides (Vector Laboratories), air dried for 10–15 min, treated for 6 min with methanol (−20°C) followed by acetone (1 min; −20°C) and then preincubated for 1 hr in blocking buffer [PBS/1% bovine serum albumin (BSA)/0.1% Triton X-100]. Antibodies were added in the following order (all diluted 1:100 in blocking buffer, all incubations at 37°C): (1) rabbit anti-Sir3p, overnight incubation (Sinclair et al. 1997; kindly supplied by L. Guarente, Department of Biology, MIT); (2) fluorescein isothiocyanate (FITC)-conjugated goat anti-rabbit IgG, 1 hr incubation (Vector Laboratories); (3) mouse monoclonal antibodies to yeast fibrillarin, overnight incubation (Nop1p, Sinclair et al. 1997; from L. Guarente); and (4) indocarbocyanine (Cy3)-tagged goat anti-mouse IgG, 1 hr incubation (Sigma). DNA was stained blue with 4′,6′-diamidino-2-phenylindole. Staining patterns were scored for a minimum of 500–1000 cells/genotype/experiment.
ERC analysis
DNA was prepared according to Sinclair and Guarente (1997) and fractionated by electrophoresis for 30 hr through 0.7% agarose containing TAE buffer (40 mm Tris acetate, 1 mm EDTA at pH 7.5) at constant voltage (1 volt/cm gel length with buffer recirculation at room temperature). Following capillary transfer to GeneScreen Plus (NEN Life Science Products), blots were probed with a 32P-labeled, 2.8-kb EcoRI fragment containing rDNA sequences obtained from pNL47 (Sinclair and Guarente 1997). Relative ERC levels were defined by analyzing the blot with a storage phosphorimaging system (Molecular Dynamics).
Biochemical assays of young and old cell populations
The principles underlying these well-established microanalytic techniques have been described in great detail by Lowry and coworkers (e.g., Lowry 1980; Passonneau and Lowry 1993) and are based on highly specific enzymatic reactions where a pyridine nucleotide is either oxidized or reduced. Great sensitivity is achieved by amplifying the nucleotide product several thousand-fold by enzymatic cycling. These techniques have been used to measure glucose, G6P, 2DG6P, ATP, NAD+, and hexokinase in a wide variety of higher eukaryotic cells (e.g., Chi et al. 1988; Manchester et al. 1994).
Young or older cells (recovered by sorting at 4°C) were incubated at 24°C in YPD for 20 min, pelleted, rinsed in PBS, quickly frozen in liquid nitrogen, and freeze-dried for four days at −35°C. For some experiments, cells were incubated with YPD containing 0.1 mm 2-deoxyglucose. In all cases, aliquots were removed prior to pelleting and cell-number defined with a hemocytometer.
To prepare samples for measurement of glucose, G6P, 2DG6P, ATP, and NAD+ levels, 100 μl of 0.02 m HCl were added to 107 freeze-dried cells. The mixture was incubated at 80°C for 20 min to lyse cells, and to destroy endogenous enzymes (e.g., hexokinase), as well as reduce pyridine nucleotides. The extract was neutralized by adding 100 μl 100mm Tris-HCl (pH 8.1) containing 0.02 N NaOH, and then stored at −20°C prior to assay.
To prepare samples for hexokinase assay, 107 freeze-dried cells were incubated for 1 min at 24°C in 1 ml of extraction buffer (20 mm phosphate buffer at pH 7.4, 0.02% BSA, 0.5 mm EDTA, 5 mm β-mercaptoethanol, 25% glycerol, and 0.5% Triton X-100). Extracts were stored at −70°C.
To measure hexokinase activity in individual yeast cells grown on YPD/agar, cohorts of mothers were microdissected from their daughters as they underwent successive rounds of cell division. Individual mothers were picked from the plate using a subnanoliter capacity quartz constriction micropipet and transferred to 0.5 μl of extraction buffer under oil in a telfon rack (Passonneau and Lowry 1993). Following a 1 hr incubation at 20°C, the rack, containing all samples (1 mother/well; n = 9–21 mothers/generational time point), was placed under house vacuum, and the vacuum chamber stored at −80°C.
To begin the hexokinase assay, samples were thawed (and lysed) at 20°C. Hexokinase reaction buffer (0.1 μl) [200 mm Tris-HCl at pH 8.1, 0.1% BSA, 14 mm MgCl2, 10 mm ATP, 10 mm glucose, 1 mm DTT, 20 μm NADP, 1% Triton X-100, 2 μg/ml glucose-6-phosphate dehydrogenase from Leuconostoc mesenteroides (specific activity = 312 units/mg protein; Calbiochem)] was combined with a 0.1 μl aliquot of the individual cell lysate. The mixture was incubated for 1 hr at 20°C. The reaction was then stopped and excess NADP was destroyed by adding 0.1 μl 0.25 N NaOH and incubating the solution at 80°C for 20 min. Once the rack had cooled to room temperature, 5 μl of NADP cycling reagent was added [100 mm imidazole-HCl at pH 7.0, 2 mm G6P (Sigma), 7.5 mm disodium α-ketoglutarate (Sigma), 0.1 mm ADP, 25 mm ammonium acetate, 0.1% BSA, 1.5 units/ml glutamate dehydrogenase (Boehringer), and 1.5 U/ml of Leuconostoc mesenteroides G6P dehydrogenase]. The mixture was incubated for 1 hr at 38°C. The cycling reaction was stopped by adding 0.5 μl of 1 N NaOH and incubating the solution at 80°C for 20 min. A 5-μl aliquot was removed and added to 1 ml of 6-phosphogluconate indicator reagent [100 mm imidazole-HCl at pH 7.0, 30 mm ammonium acetate, 2 mm MgCl2, 0.1 mm EDTA, 0.1 mm NADP, and 0.1 units/ml 6-phosphogluconate dehydrogenase (Boehringer)]. The NADPH product generated from NADP was measured fluorimetrically. For each experiment, G6P standards were assayed in parallel reactions and used as a reference to compute hexokinase activity in individual cell lysates. Two independent standards were also employed: A NADP standard was incorporated at the cycling step to mimic the G6P standards, and a 6-phosphogluconate standard was assayed to validate the G6P and NADP standards.
Acknowledgments
We are indebted to David Sinclair, Kevin Mills, Pierre Defossez, Leonard Guarente, and Mark Johnston for generously providing reagents and protocols, and for their many helpful comments. We also thank Michael Khodadoust and Thalia Farazi for their invaluable assistance at various stages of this study. This work was supported by grants from the National Institutes of Health (AI38200) and the American Federation for Aging Research (predoctoral fellowship to K.A.).
The publication costs of this article were defrayed in part by payment of page charges. This article must therefore be hereby marked “advertisement” in accordance with 18 USC section 1734 solely to indicate this fact.
Footnotes
E-MAIL jgordon@molecool.wustl.edu; FAX (314) 362 7047.
References
- Alepuz PM, Cunningham KW, Estruch F. Glucose repression affects ion homeostasis in yeast through the regulation of the stress-activated ENA1 gene. Mol Microbiol. 1997;26:91–98. doi: 10.1046/j.1365-2958.1997.5531917.x. [DOI] [PubMed] [Google Scholar]
- Arking R. Biology of Aging. 2nd Edition. Sunderland, MA: Sinaur Associates; 1998. [Google Scholar]
- Arking R, Buck S, Berrios A, Dwyer S, Baker GT., III Elevated paraquat resistance can be used as a bioassay for longevity in a genetically based long-lived strain of Drosophila. Dev Genet. 1991;12:362–370. doi: 10.1002/dvg.1020120505. [DOI] [PubMed] [Google Scholar]
- Ashrafi K, Farazi TA, Gordon JI. A role for Saccharomyces cerevisiae fatty acid activation protein 4 in regulating protein N-myristoylation during entry into stationary phase. J Biol Chem. 1998;273:25864–25874. doi: 10.1074/jbc.273.40.25864. [DOI] [PubMed] [Google Scholar]
- Ashrafi K, Sinclair D, Gordon JI, Guarente L. Passage through stationary phase advances replicative aging in Saccharomyces cerevisiae. Proc Natl Acad Sci. 1999;96:9100–9105. doi: 10.1073/pnas.96.16.9100. [DOI] [PMC free article] [PubMed] [Google Scholar]
- Baudin A, Ozier-Kalogeropoulos O, Denouel A, Lacroute F, Cullin D. A simple and efficient method for direct gene deletion in Saccharomyces cerevisiae. Nucleic Acids Res. 1993;21:3329–3330. doi: 10.1093/nar/21.14.3329. [DOI] [PMC free article] [PubMed] [Google Scholar]
- Bhatnagar RS, Gordon JI. Understanding covalent modification of proteins by lipids: Where cell biology and biophysics mingle. Trends Cell Biol. 1997;7:14–18. doi: 10.1016/S0962-8924(97)10044-7. [DOI] [PubMed] [Google Scholar]
- Bhatnagar RS, Futterer K, Farazi TA, Korolev S, Murray CL, Jackson-Machelski E, Gokel GW, Gordon JI, Waksman G. Structure of N-myristoyltransferase with bound myristoyl CoA and peptide substrate analogs. Nature Struct Biol. 1998;5:1091–1097. doi: 10.1038/4202. [DOI] [PubMed] [Google Scholar]
- Boutin JA. Myristoylation. Cell Signal. 1997;9:15–35. doi: 10.1016/s0898-6568(96)00100-3. [DOI] [PubMed] [Google Scholar]
- Celenza JL, Carlson M. Cloning and genetic mapping of SNF1, a gene required for expression of glucose-repressible genes in Saccharomyces cerevisiae. Mol Cell Biol. 1984;4:49–53. doi: 10.1128/mcb.4.1.49. [DOI] [PMC free article] [PubMed] [Google Scholar]
- ————— A yeast gene that is essential for release from glucose repression encodes a protein kinase. Science. 1986;233:1175–1180. doi: 10.1126/science.3526554. [DOI] [PubMed] [Google Scholar]
- Chi MY, Manchester J, Yang V, Curato A, Strickler R, Lowry OH. Contrast in levels of metabolic enzymes in human and mouse ova. Biol Reprod. 1988;39:295–307. doi: 10.1095/biolreprod39.2.295. [DOI] [PubMed] [Google Scholar]
- Clark-Walker GD, Azad AA. Hybridizable sequences between cytoplasmic ribosomal RNAs and 3 micron circular DNAs of Saccharomyces cerevisiae and Torulopsis glabrata. Nucleic Acids Res. 1980;8:1009–1022. doi: 10.1093/nar/8.5.1009. [DOI] [PMC free article] [PubMed] [Google Scholar]
- DeRisi JL, Iyer VR, Brown PO. Exploring the metabolic and genetic control of gene expression on a genomic scale. Science. 1997;78:680–686. doi: 10.1126/science.278.5338.680. [DOI] [PubMed] [Google Scholar]
- DeVit MJ, Johnston M. The nuclear exportin Msn5 is required for nuclear export of the MIG 1 glucose repressor of Saccharomyces cerevisiae. Curr Biol. 1999;9:1231–1241. doi: 10.1016/s0960-9822(99)80503-x. [DOI] [PubMed] [Google Scholar]
- DeVit MJ, Waddle JA, Johnston M. Regulated nuclear translocation of the Mig1 glucose repressor. Mol Biol Cell. 1997;8:1603–1618. doi: 10.1091/mbc.8.8.1603. [DOI] [PMC free article] [PubMed] [Google Scholar]
- Duronio RJ, Towler DA, Heuckeroth RO, Gordon JI. Disruption of the yeast N-myristoyltransferase gene causes recessive lethality. Science. 1989;243:796–800. doi: 10.1126/science.2644694. [DOI] [PubMed] [Google Scholar]
- Ewbank JJ, Barnes TM, Lakowski B, Lussier M, Bussey H, Hekimi S. Structural and functional conversation of the Caenorhabditis elegans timing gene clk-1. Science. 1997;275:980–983. doi: 10.1126/science.275.5302.980. [DOI] [PubMed] [Google Scholar]
- Graves JL, Toolson EC, Jeong C, Vu LN, Rose MR. Desiccation, flight, glycogen and postponed senescence in Drosophila melanogaster. Physiol Zool. 1992;65:268–286. [Google Scholar]
- Hardie DG, Carling D, Carlson M. The AMP-activated/SNF1 protein kinase subfamily: Metabolic sensors of the eukaryotic cell? Annu Rev Biochem. 1998;67:821–855. doi: 10.1146/annurev.biochem.67.1.821. [DOI] [PubMed] [Google Scholar]
- Imai S-I, Armstrong CM, Kaeberlein M, Guarente L. Transcriptional silencing and longevity protein Sir2 is an NAD-dependent histone deacetylase. Nature. 2000;403:795–800. doi: 10.1038/35001622. [DOI] [PubMed] [Google Scholar]
- Jiang R, Carlson M. Glucose regulates protein interactions within the yeast SNF1 protein kinase complex. Genes & Dev. 1996;10:3105–3115. doi: 10.1101/gad.10.24.3105. [DOI] [PubMed] [Google Scholar]
- ————— The Snf1 protein kinase and its activating subunit, Snf4, interact with distinct domains of the Sip1/Sip2/Gal83 component in the kinase complex. Mol Cell Biol. 1997;4:2099–2106. doi: 10.1128/mcb.17.4.2099. [DOI] [PMC free article] [PubMed] [Google Scholar]
- Johnston M. Feasting, fasting and fermenting glucose sensing in yeast and other cells. Trends Genet. 1999;15:29–33. doi: 10.1016/s0168-9525(98)01637-0. [DOI] [PubMed] [Google Scholar]
- Kennedy BK, Austriaco NR, Zhang J, Guarente L. Mutation of silencing gene SIR4 can delay aging in S. cerevisiae. Cell. 1995;80:485–496. doi: 10.1016/0092-8674(95)90499-9. [DOI] [PubMed] [Google Scholar]
- Kennedy BK, Gotta M, Sinclair DA, Mills K, McNabb DS, Murthy M, Pak SM, Laroche T, Gasser SM, Guarente L. Redistribution of silencing proteins from telomeres to the nucleolus is associated with extension of life span in S. cerevisiae. Cell. 1997;89:381–391. doi: 10.1016/s0092-8674(00)80219-6. [DOI] [PubMed] [Google Scholar]
- Kenyon CJ, Chang J, Gensch E, Rudner A, Tabtiang RA. A C. elegans mutant that lives twice as long as wild-type. Nature. 1993;366:461–464. doi: 10.1038/366461a0. [DOI] [PubMed] [Google Scholar]
- Kimura KD, Tissenbaum HA, Liu Y, Ruvkun G. daf-2, an insulin receptor-like gene that regulates longevity and diapause in Caenorhabditis elegans. Science. 1997;277:942–946. doi: 10.1126/science.277.5328.942. [DOI] [PubMed] [Google Scholar]
- Klass MR, Hirsch DI. Nonaging developmental variant of C. elegans. Nature. 1976;260:523–525. doi: 10.1038/260523a0. [DOI] [PubMed] [Google Scholar]
- Larionov VL, Grishin AV, Smirnov MN. 3 micron DNA: An extrachromosomal ribosomal DNA in the yeast Saccharomyces cerevisiae. Gene. 1980;12:41–49. doi: 10.1016/0378-1119(80)90014-1. [DOI] [PubMed] [Google Scholar]
- Larionov VL, Kouprina N, Karpova T. Stability of recombinant plasmids containing the ARS sequences of yeast extrachromosomal rDNA in several strains of Saccharomyces cerevisiae. Gene. 1984;28:229–235. doi: 10.1016/0378-1119(84)90260-9. [DOI] [PubMed] [Google Scholar]
- Larsen PL. Aging and resistance to oxidative damage in Caenorhabditis elegans. Proc Natl Acad Sci. 1993;90:8905–8909. doi: 10.1073/pnas.90.19.8905. [DOI] [PMC free article] [PubMed] [Google Scholar]
- Lee C-K, Kloop RG, Weindruch R, Prolla TA. Gene expression profile of aging and its retardation by caloric restriction. Science. 1999;285:1390–1393. doi: 10.1126/science.285.5432.1390. [DOI] [PubMed] [Google Scholar]
- Lin K, Dorman J, Rodan A, Kenyon CJ. daf-16, a HNF-3/forkhead family member that can function to double the lifespan of C. elegans. Science. 1997;278:1319–1322. doi: 10.1126/science.278.5341.1319. [DOI] [PubMed] [Google Scholar]
- Lin Y-J, Seroude L, Benzer S. Extended life-span and stress resistance in the Drosophila mutant methuselah. Science. 1998;282:943–946. doi: 10.1126/science.282.5390.943. [DOI] [PubMed] [Google Scholar]
- Lithgow GJ, White TM, Melov S, Johnson TE. Thermotolerance and extended life-span conferred by single-gene mutations and induced by thermal stress. Proc Natl Acad Sci. 1995;92:7540–7544. doi: 10.1073/pnas.92.16.7540. [DOI] [PMC free article] [PubMed] [Google Scholar]
- Lowry OH. Amplification by emzymatic cycling. Mol Cell Biol. 1980;32:135–146. doi: 10.1007/BF00227440. [DOI] [PubMed] [Google Scholar]
- Ludin K, Jiang R, Carlson M. Glucose-regulated interaction of a regulatory subunit of protein phosphatase 1 with the Snf1 kinase in Saccharomyces cerevisiae. Proc Natl Acad Sci. 1998;95:6245–6250. doi: 10.1073/pnas.95.11.6245. [DOI] [PMC free article] [PubMed] [Google Scholar]
- Manchester J, Kong X, Nerbonne J, Lowry OH, Lawrence JC. Glucose transport and phosphorylation in single cardiac myocytes: Rate limiting steps in glucose metabolism. Am J Physiol. 1994;266:E326–E333. doi: 10.1152/ajpendo.1994.266.3.E326. [DOI] [PubMed] [Google Scholar]
- Mitchelhill KI, Stapleton D, Gao G, House C, Michell B, Katsis F, Witters LA, Kemp BE. Mammalian AMP-activated protein kinase shares structural and functional homology with the catalytic domain of yeast Snf1 protein kinase. J Biol Chem. 1994;269:2361–2364. [PubMed] [Google Scholar]
- Morris JZ, Tissenbaum HA, Ruvkun G. A phosphatidylinositol-3-OH kinase family member regulating longevity and diapause in Caenorhabditis elegans. Nature. 1996;382:536–539. doi: 10.1038/382536a0. [DOI] [PubMed] [Google Scholar]
- Mortimer RK, Johnston JR. Life span of individual yeast cells. Nature. 1959;183:1751–1752. doi: 10.1038/1831751a0. [DOI] [PubMed] [Google Scholar]
- Murakami S, Johnson TE. A genetic pathway conferring life extension and resistance to UV stress in Caenorhabditis elegans. Genetics. 1996;143:1207–1218. doi: 10.1093/genetics/143.3.1207. [DOI] [PMC free article] [PubMed] [Google Scholar]
- Nehlin JO, Ronne H. Yeast MIG1 repressor is related to the mammalian early growth response and Wilms' tumour finger proteins. EMBO J. 1990;9:2891–2898. doi: 10.1002/j.1460-2075.1990.tb07479.x. [DOI] [PMC free article] [PubMed] [Google Scholar]
- Nehlin JO, Carlberg M, Ronne H. Control of yeast GAL genes by MIG1 repressor: A transcriptional cascade in the glucose response. EMBO J. 1991;10:3373–3377. doi: 10.1002/j.1460-2075.1991.tb04901.x. [DOI] [PMC free article] [PubMed] [Google Scholar]
- Orr WC, Sohal RS. Extension of life-span by overexpression of superoxide dismutase and catalase in Drosophila melanogaster. Science. 1994;263:1128–1130. doi: 10.1126/science.8108730. [DOI] [PubMed] [Google Scholar]
- Passonneau JV, Lowry OH. Enzymatic analysis: A practical guide. Totawa, NJ: Humana Press; 1993. [Google Scholar]
- Service PM, Hutchinson M, MacKinley D, Rose MR. Resistance to environmental stress in Drosophila melanogaster selected for postponed senescence. Physiol Zool. 1985;58:380–389. [Google Scholar]
- Sinclair DA, Guarente L. Extrachromosomal rDNA circles: A cause of aging in yeast. Cell. 1997;91:1033–1042. doi: 10.1016/s0092-8674(00)80493-6. [DOI] [PubMed] [Google Scholar]
- Sinclair DA, Mills K, Guarente L. Accelerated aging and nucleolar fragmentation in yeast sgs1 mutants. Science. 1997;277:1313–1316. doi: 10.1126/science.277.5330.1313. [DOI] [PubMed] [Google Scholar]
- Smeal T, Claus J, Kennedy B, Cole F, Guarente L. Loss of transcriptional silencing causes sterility in old mother cells of S. cerevisiae. Cell. 1996;84:633–642. doi: 10.1016/s0092-8674(00)81038-7. [DOI] [PubMed] [Google Scholar]
- Thompson-Jaeger S, Francois J, Gaughran JP, Tatchell K. Deletion of SNF1 affects the nutrient response of yeast and resembles mutations which activate the adenylate cyclase pathway. Genetics. 1991;129:697–706. doi: 10.1093/genetics/129.3.697. [DOI] [PMC free article] [PubMed] [Google Scholar]
- Vincent O, Carlson M. Gal83 mediates the interaction of the Snf1 kinase complex with the transcription activator Sip4. EMBO J. 1999;18:6672–6681. doi: 10.1093/emboj/18.23.6672. [DOI] [PMC free article] [PubMed] [Google Scholar]
- Werner-Washburne M, Braun E, Johnston GC, Singer RA. Stationary phase in the yeast Saccharomyces cerevisiae. Micro Rev. 1993;57:383–401. doi: 10.1128/mr.57.2.383-401.1993. [DOI] [PMC free article] [PubMed] [Google Scholar]
- Werner-Washburne M, Braun EL, Crawford ME, Peck VM. Stationary phase in Saccharomyces cerevisiae. Mol Microbiol. 1996;19:1159–1166. doi: 10.1111/j.1365-2958.1996.tb02461.x. [DOI] [PubMed] [Google Scholar]
- Wood WB. Aging of C. elegans: Mosaics and mechanisms. Cell. 1998;95:147–150. doi: 10.1016/s0092-8674(00)81744-4. [DOI] [PubMed] [Google Scholar]
- Yang X, Jiang R, Carlson M. A family of proteins containing a conserved domain that mediates interaction with the yeast SNF1 protein kinase complex. EMBO J. 1994;13:5878–5886. doi: 10.1002/j.1460-2075.1994.tb06933.x. [DOI] [PMC free article] [PubMed] [Google Scholar]
- Yu C-E, Oshima J, Fu Y-H, Wijsman EM, Hisama F, Alisch R, Matthews S, Nakura J, Miki T, Ouais S, et al. Positional cloning of the Werner's syndrome gene. Science. 1996;272:258–262. doi: 10.1126/science.272.5259.258. [DOI] [PubMed] [Google Scholar]