Abstract
Choline kinase is the first step enzyme for phosphatidylcholine (PC) de novo biosynthesis. Loss of choline kinase activity in muscle causes rostrocaudal muscular dystrophy (rmd) in mouse and congenital muscular dystrophy in human, characterized by distinct mitochondrial morphological abnormalities. We performed biochemical and pathological analyses on skeletal muscle mitochondria from rmd mice. No mitochondria were found in the center of muscle fibers, while those located at the periphery of the fibers were significantly enlarged. Muscle mitochondria in rmd mice exhibited significantly decreased PC levels, impaired respiratory chain enzyme activities, decreased mitochondrial ATP synthesis, decreased coenzyme Q and increased superoxide production. Electron microscopy showed the selective autophagic elimination of mitochondria in rmd muscle. Molecular markers of mitophagy, including Parkin, PINK1, LC3, polyubiquitin and p62, were localized to mitochondria of rmd muscle. Quantitative analysis shows that the number of mitochondria in muscle fibers and mitochondrial DNA copy number were decreased. We demonstrated that the genetic defect in choline kinase in muscle results in mitochondrial dysfunction and subsequent mitochondrial loss through enhanced activation of mitophagy. These findings provide a first evidence for a pathomechanistic link between de novo PC biosynthesis and mitochondrial abnormality.
INTRODUCTION
Phosphatidylcholine (PC) is the major phospholipid in eukaryotic cell membranes. Disruption of PC synthesis by loss-of-function mutations in CHKB (GenBank Gene ID 1120), which encodes the primary choline kinase isoform in muscle, causes autosomal recessive congenital muscular dystrophy with mitochondrial structural abnormalities in human (1). Loss-of-function mutation in the murine ortholog, Chkb, is reported to cause rostrocaudal muscular dystrophy (rmd) in the laboratory mouse (2). Rmd is so-named because of a gradient of severity of muscle damage—hindlimbs (caudal) are affected more severely than forelimbs (rostral). The most outstanding feature of the muscle pathology in both human patients and rmd mice is a peculiar mitochondrial abnormality—mitochondria are greatly enlarged at the periphery of the fiber and absent from the center.
Mitochondria have a variety of cellular functions from energy production to triggering apoptotic cell death (3,4). Inhibition of mitochondrial respiration [chemically or by mitochondrial DNA (mDNA) mutations], disruption of inner membrane potential, senescence and enhanced reactive oxygen species (ROS) production are all known to cause mitochondrial morphological abnormalities (5–8). Conversely, primary mitochondrial morphological changes can subsequently cause mitochondrial and cellular dysfunction. Mitochondria are dynamic organelles, which continuously fuse and divide. Disequilibrium of mitochondrial fusion and fission can cause alterations of mitochondrial morphology with mitochondrial dysfunction (9,10). Thus, mitochondrial function and morphology are tightly linked.
It has been reported that mitochondria in rmd show decreased membrane potential (11). However, there have been no further studies about mitochondrial functional abnormalities in rmd, although its morphology is the most distinct feature compared with other myopathies. In addition, there has been no study about mitochondrial function when PC synthesis is blocked in vivo, although mitochondrial respiratory enzyme activities are dependent on membrane phospholipids (12). We hypothesized that the mitochondrial morphological abnormality in rmd muscle indicates the presence of a bioenergetic dysfunction caused by mitochondrial membrane phospholipid alteration.
In this study, we demonstrate that mitochondria in rmd mouse muscle show reduced PC level, bioenergetic dysfunction and increased ROS production are ubiquitinated and eliminated via mitophagy, leading to the peculiar mitochondrial loss in the skeletal muscle. These findings provide further evidence that mitochondrial dysfunction is related to phospholipid metabolism and may play a role in the pathogenesis of muscle disease.
RESULTS
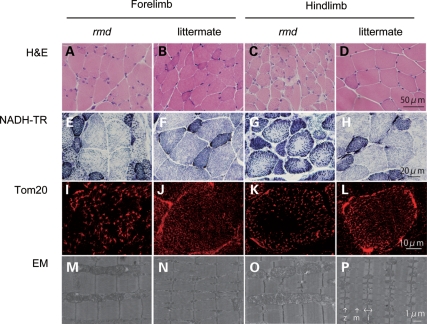
Light microscopic examination of H&E-stained samples from 8-week-old homozygous rmd mutant mice and littermate controls confirmed dystrophic muscle pathology, especially in hindlimb muscles, as previously described (2) (Fig. 1A–D). NADH-TR and immunohistochemistry for mitochondrial outer membrane protein Tom20 also showed that mitochondria were sparse in the muscle fiber both in forelimb and hindlimb muscles of rmd mice, while the remaining mitochondria were prominent (Fig. 1E–L). More striking is the mitochondrial enlargement observed by EM (Fig. 1M–P). Mitochondria were rounder and massively enlarged compared with littermate controls. Normally, two mitochondria are present in almost all intermyofibrillar spaces and extend alongside the region between Z band and I bands. In muscles of rmd mice, mitochondria were larger than the size of the Z-I length itself, and often exceeded the size of a single sarcomere. In addition, mitochondria were seen only in some intermyofibrillar spaces leaving many regions devoid of mitochondria.
Figure 1.
Muscle histopathology. H&E staining of triceps or quadriceps femoris muscles in 8-week-old homozygous rmd mutant mice and unaffected (+/rmd or +/+) littermate controls (A–D) shows dystrophic changes including variation in fiber size, necrosis and regeneration of individual fibers and interstitial fibrosis. NADH-TR staining (E–H), immunostaining of mitochondrial outer membrane protein Tom20 and EM (M–P) show abnormal mitochondria. Mitochondria in rmd muscle fibers are enlarged and prominent at the periphery, but sparse in the center (I–L). z, Z line; m, M line; i, I band.
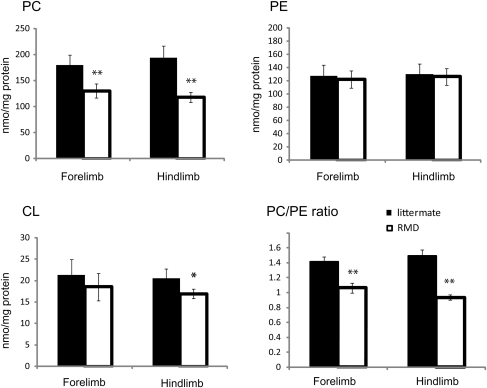
We hypothesized that the abnormal mitochondrial morphology in rmd skeletal muscles reflects altered PC content in mitochondrial membranes, as these mitochondria lack the PC biosynthetic pathway. We therefore measured PC, PE and CL in isolated mitochondria (Fig. 2). PE is the second most abundant phospholipid in mitochondria and CL is a mitochondria-specific phospholipid. PC was significantly decreased to 72% in forelimb and to 61% in hindlimb muscles compared with healthy littermates, while PE levels were unchanged. The PC/PE ratio was decreased, reflecting the PC reduction. This reduction is well correlated with the phospholipid compositional alteration in muscle tissue as previously described (1,2). CL showed only a slight decrease and only in the more severely affected hindlimb muscles.
Figure 2.
The PC level is decreased in rmd muscle mitochondria. The PE level is not altered. The PC/PE ratio is significantly decreased in rmd. The CL level is slightly decreased in rmd hindlimb. Data are expressed as the mean ± SD of eight experiments. *P < 0.01, **P < 0.0001.
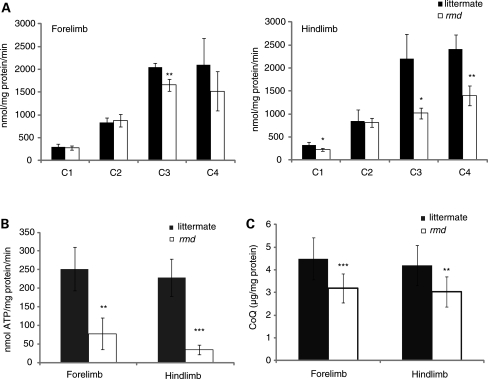
We speculated that mitochondrial function in rmd is altered, and therefore measured respiratory enzyme activity and ATP synthesis in isolated mitochondria in rmd muscle. Compared with healthy littermates, only mitochondrial respiratory Complex III activity was significantly decreased in mitochondria from rmd forelimb muscles, while Complex I, III and IV activities were significantly decreased in rmd hindlimb muscles (Fig. 3A). Mitochondrial ATP synthesis was severely decreased, especially in hindlimb muscles (Fig. 3B), and coenzyme Q9 was moderately decreased in rmd compared with littermates (Fig. 3C).
Figure 3.
Mitochondrial energetic function is altered and CoQ level is decreased in rmd. (A) Mitochondrial respiratory chain enzyme activities in rmd were compared with healthy littermates. C1, Complex I ; C2, Complex II ; C3, Complex III ; C4, Complex IV (n = 4). (B) The rate of ATP synthesis measured by luminometry method (n = 4). (C) Total CoQ9 level (littermate forelimb, n = 13; littermate hindlimb, n = 12; rmd forelimb, n = 11; rmd hindlimb, n = 13). Data are expressed as the mean ± SD of experiment number shown as n. *P < 0.05, **P < 0.005, ***P < 0.001.
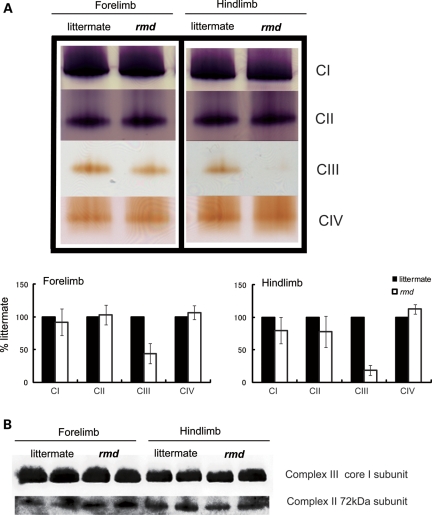
In-gel activity staining on native PAGE showed decreased Complex III activity, especially in hindlimb (Fig. 4A), although normal protein levels of the Complex III were detected by western blot followed by Native PAGE (Fig. 4B). There was no difference in mobility of Complex III in rmd and littermate. Furthermore, respiratory chain supercomplex formation, which is important for effective electron transport (24), was not altered in rmd (Supplementary Material, Fig. S1).
Figure 4.
Mitochondrial respiratory enzyme activity is decreased without the loss of the enzyme complex. (A) Native PAGE gel electrophoresis. In-gel activity staining shows that Complex III activity is decreased in rmd. Representative data from four different experiments are shown. (B) Immunoblotting of Complex II and III shows protein levels are maintained despite defect in significant Complex III enzymatic activity. Representative data from three different experiments of six samples are shown.
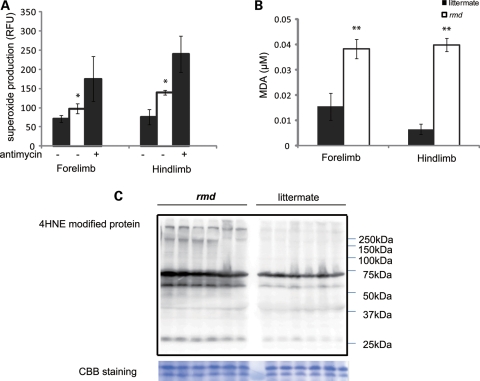
Mitochondria are a major site of ROS production under normal circumstances and the production of ROS is enhanced when respiration is blocked. To determine whether the identified respiratory defects lead to elevated ROS, we measured superoxide levels from isolated mitochondria. Superoxide production was significantly increased in rmd muscle mitochondria, especially in those isolated from the hindlimbs (Fig. 5A). Moreover, the MDA level (Fig. 5B) and 4-hydroxynonenal adducts (Fig. 5C) were increased in rmd muscles indicating that oxidative stress is increased in rmd muscle.
Figure 5.
Mitochondrial superoxide production is increased and oxidative stress is increased in muscle tissue in rmd. (A) Mitochondrial superoxide production is enhanced in rmd, especially in hindlimb muscle mitochondria. Data are shown as the mean ± SD of seven experiments. *P < 0.001. (B) MDA levels are increased in muscle tissue. **P < 0.0005. Data are shown as the mean ± SD (n = 4 for rmd and n = 5 for littermate controls). (C) HNE4-modified proteins are increased in rmd hindlimb muscle. Coomassie brilliant blue staining is shown as a loading control. Representative data of six samples.
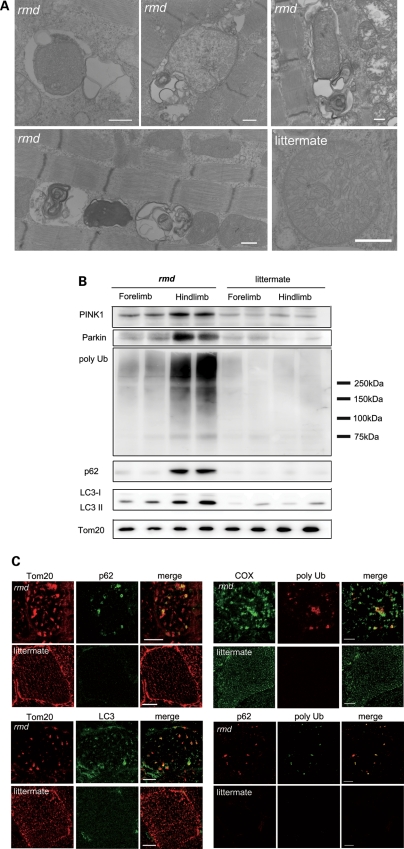
Interestingly, examination of muscle sections by EM revealed autophagosomes selectively engulfing an entire mitochondrion, without cytoplasm, suggesting that mitophagy is activated in rmd skeletal muscles (Fig. 6A). Western blots of isolated mitochondria from muscle showed significantly increased levels of the autophagosome marker LC3 in rmd (Fig. 6B). In addition, polyubiquitinated proteins and p62/SQSTM1, which connects ubiquitination and autophagic machineries, were also increased in isolated mitochondria (Fig. 6B). These data suggest that mitochondria are polyubiquitinated and p62 is recruited to mitochondria. We also analyzed PINK1 and the E3 ubiquitin ligase Parkin, which are known to contribute to ubiquitination and mitophagy of damaged mitochondria (25,26). PINK1 and Parkin levels were increased in rmd isolated muscle mitochondria (Fig. 6B), suggesting that they were recruited to mitochondria to promote mitophagy. Immunohistochemical analyses demonstrated the colocalization of p62, polyubiquitin and LC3 with mitochondria (Fig. 6C).
Figure 6.
Mitochondrial degeneration in rmd. (A) EM of extensor digitorum longus muscle. In rmd, mitochondria are degraded by mitophagy. Scale bar = 0.5 μm. (B) Western blot of isolated muscle mitochondria immunodetected for Parkin, polyubiquitin, p62/SQSTM1 and LC3. TOM20, a mitochondrial outer membrane protein is used as loading control. Hindlimb mitochondria in rmd show significantly increased expression level in these mitophagy markers. (C) p62 and TOM20 immunohistrochemistry of hindlimb muscle section. Note that mitochondria are significantly enlarged and sparse in rmd. p62 colocalizes with the mitochondrial outer membrane protein TOM20. Polyubiquitin and mitochondrial protein cytochrome c oxidase (COX) colocalize. LC3 and TOM20 colocalize. Polyubiquitin and p62 colocalize. Scale bar = 10 μm.
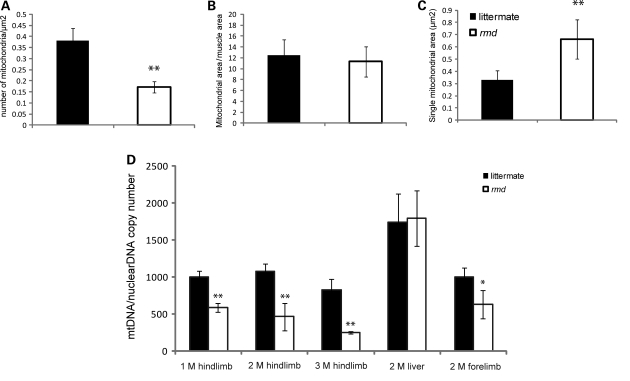
We quantified mitochondrial numbers in muscle fibers, mitochondria occupying-area relative to muscle cross-sectional area and mean mitochondrial area in cross-section by morphometric analysis in EM. In rmd, the average number of mitochondria per fiber was profoundly decreased (Fig. 7A). However, the average area occupied by mitochondria in each muscle fiber was comparable with littermates (Fig. 7A). This was due to increased mean mitochondrial area in rmd (Fig. 7A).
Figure 7.
(A) Mitochondrial morphometrical analysis. All mitochondria are counted in cross-sections of EDL muscle by EM. Number of mitochondria per 1 μm2 of muscle fiber cross-sectional area is shown (n = 20). The percentage of area occupied by mitochondria in a cross-section of muscle fiber is not different in rmd and littermates (n = 20). The average total mitochondrial area per muscle fiber is larger in rmd compared with littermates (n = 20). *P < 0.005, **P < 0.0005. (B) mtDNA copy number is decreased in rmd compared with littermate controls. Copy number of mtDNA (ND1) was normalized by nuclear DNA (pcam1) (M; month-old, 1 M hindlimb: rmd; n = 4, littermates; n = 4. 2 M hindlimb: rmd; n = 5, littermates; n= 6, 3 M hindlimb: rmd; n = 4, littermates; n = 6. 2 M liver: rmd; n = 5, littermates; n = 5. 2 M forelimb: rmd; n = 6, littermates; n = 6).
We quantified mtDNA copy number relative to nuclear DNA. In rmd, mtDNA was decreased both in forelimb and hindlimb muscles compared with littermate controls (Fig. 7B), which was in agreement with the number of mitochondria decrease. The mtDNA copy number in liver is preserved in rmd, and reduction in muscle is progressive in age.
DISCUSSION
In the rmd mouse, we observed greater superoxide production and more significant Complex III and ATP synthesis deficiencies in hindlimb than in forelimb muscles, correlating with the more severe caudal phenotype. PC was decreased in isolated rmd muscle mitochondria as a consequence of disruption of muscle PC biosynthesis because PC cannot be synthesized in mitochondria. This suggests that muscle damage in the rmd mouse is primarily due to mitochondrial dysfunction possibly caused by the impaired PC biosynthesis.
Why then are mitochondrial functions altered when PC is decreased? Mitochondria produce energy mainly via oxidative phosphorylation, which transfers electrons by a series of redox reactions through four enzyme complexes, and pumps protons across the mitochondrial inner membrane, producing an electrochemical proton gradient that enables ATP synthesis (3). Here, we demonstrate for the first time a Complex III activity decrease without the loss of the enzyme protein complex in rmd muscle mitochondria, suggesting a link between decreased PC content and Complex III activity. One possible explanation is that mitochondrial PC alterations may directly impair Complex III function by affecting lipid–protein interactions (27). PC is a component of the yeast respiratory enzyme complex, as revealed by X-ray crystallography, and thus may regulate enzyme function (28). Alteration of fatty acid composition in PC has been shown to change enzymatic activity in Complexes I, III and IV in a mouse model (29). In this model, Complex III activity is profoundly increased when n-3 fatty acid is increased. In rmd, it is reported that docosahexiaenoic acid containing PC, the major n-3 fatty acid in muscle PC, is profoundly decreased in muscle and in isolated mitochondria (1). This suggests a possible association between phospholipid composition alterations and respiratory chain enzymatic activities due to the choline kinase defect in rmd muscle.
Through the oxidative phosphorylation process, ROS are also generated as byproducts even in normal cellular states, but especially when respiration is inhibited (30,31). In rmd mouse muscle, ROS production from isolated mitochondria was increased, which may be related to the respiratory chain defect caused by PC reduction in mitochondria. Interestingly, selenium-deficient myopathy is associated with muscle pathology showing similar enlarged and sparse mitochondrial morphological abnormalities to the rmd mice and the human congenital muscular dystrophy caused by CHKB mutations (32). As selenium is a cofactor of glutathione peroxidase, selenium deficiency is thought to cause oxidative stress (33,34). Morphological similarity between choline kinase beta deficiency and selenium deficiency suggests that ROS may play a key role in the formation of the mitochondrial abnormalities in rmd myopathy. In another model, depletion of glutathione, which provides cells with a reducing environment and detoxifies the ROS, is reported to cause mitochondria enlargement in muscle, also suggesting the possible link between mitochondrial enlargement and ROS in skeletal muscle (35).
In addition, as a major site of ROS production, mitochondria themselves are prone to ROS damage (36). Recent studies have shown that damaged mitochondria are eliminated by selective autophagy, called mitophagy, most likely as a quality control mechanism to protect the cells (37,38). In addition to mitochondrial enlargement, we observed large areas devoid of mitochondria. Mitochondrial depolarization can trigger mitophagy in cell culture models (26). PINK1 and Parkin interactions promote ubiquitination of mitochondrial outer membrane proteins, and induce mitophagy. This process is mediated by p62, an adaptor molecule, which interacts directly with ubiquitin and LC3 (25,39). ROS generated from mitochondria are also important for mitophagy (39). Interestingly, we found increased mitophagy in rmd, accompanied by mitochondrial ubiquitination and recruitment of p62 and LC3. Enhanced PINK1 and Parkin expression in mitochondria likely reflects the process of elimination of damaged mitochondria as a consequence of mitochondrial dysfunction and ROS production. These findings were similar to those in cells treated with the protonophore carbonyl cyanide m-chlorophenyl hydrazone (CCCP) or respiratory chain inhibitors (25,26). In rmd, decreased membrane potential (11), as a consequence of respiratory chain insufficiency and ROS production, may trigger mitophagy and thus increased mitochondrial clearance, which may lead to energy crisis and result in cell death and muscular dystrophy.
We observed progressive loss of mtDNA with age, together with progressive loss of mitochondria. We suggest that mtDNA depletion in this case results from increased mitophagy, because mtDNA is known to be degraded by mitophagy in cultured hepatocytes (40) and because the pathological features of CHKB-deficient myopathy are clearly distinct from those observed in ‘primary’ mtDNA depletion syndromes, usually associated with defective mtDNA synthesis, in which muscle fiber mitochondria are increased both in number and size, causing the ‘ragged-red fiber’ appearance (41).
In summary, we have demonstrated for the first time a pathogenic mechanism that links PC reduction in the mitochondrial membranes of rmd muscle to mitochondrial morphological and functional abnormalities and the induction of mitophagy as a response to structural and functional damage by ROS generation or impaired bioenergetics. These findings indicate the importance of PC de novo synthesis pathway and phospholipid composition of mitochondrial membrane in the maintenance of mitochondria and muscle.
MATERIALS AND METHODS
Rmd mice
Eight-week-old rmd mice (2) were used for all analysis and were compared with healthy littermates. The Ethical Review Committee on the Care and Use of Rodents in the National Institute of Neuroscience, National Center of Neurology and Psychiatry approved all mouse experiments.
Histological analyses
The quadriceps femoris muscles were freeze-fixed in liquid-nitrogen-cooled isopentane and stored at −80°C. Serial transverse sections of 10 μm thickness were stained with a series of histochemical methods, including hematoxylin and eosin (H&E) and nicotine amide adenine dinucleotide-tetrazolium reductase (NADH-TR), as previously described (13), and were observed by light microscopy.
Immunohistochemical analyses were performed as previously described (13). Briefly, 6 μm thick frozen muscle sections were fixed in cold acetone for 5 min. After blocking with 5% normal goat serum, sections were incubated with primary antibodies for 2 h at 37°C. After rinses with phosphate-buffered saline, sections were incubated with secondary Alexa Fluor 488- or Alexa Fluor 568-labeled goat anti-mouse or rabbit antibodies at room temperature for 45 min. Confocal images were obtained with FLUOVIEW FV500 systems (Olympus) using a ×100 objective.
For observation by electron microscopy (EM), muscle samples were fixed in 2.5% glutaraldehyde in 0.1 m cacodylate buffer. Specimens were post-fixed in 1% osmium tetroxide in the same buffer, dehydrated with graded series of ethanol and embedded in epon, as previously described (13). Ultrathin sections were stained with uranyl acetate and lead citrated, and were analyzed by a FEI Tecnai Spirit at 120 kV.
Isolation of skeletal muscle mitochondria
Mitochondria from skeletal muscle of whole forelimb and hindlimbs were isolated by differential centrifugation. Fresh muscle was minced and homogenized using a motor-driven Teflon pestle homogenizer with ice-cold mitochondrial isolation buffer [10 mm Tris–HCl pH 7.2, 320 mm sucrose, 1 mm ethylenediaminetetraacetic acid, 1 mm dithiothreitol, 1 mg/ml bovine serum albumin (BSA)] and centrifuged at 1500g for 5 min. Supernatant fraction was centrifuged at 15 000g for 20 min, and the pellet was resuspended in mitochondrial isolation buffer. The centrifugation was repeated twice. Protein concentration was determined by the Bradford method using Bio-Rad Protein Assay (Bio-Rad Laboratories), according to the manufacturer's protocol.
Lipid extraction, phospholipid separation and determination
PC, phosphatidylethanolamine (PE) and cardiolipin (CL) were extracted from isolated mitochondria of forelimb and hindlimb muscles, separated by one-dimensional thin layer chromatography (TLC) and amount of each phospholipid was measured by phosphorus analysis (14,15). Briefly, total lipids in frozen muscle biopsy samples were extracted according to the method of Bligh and Dyer (14). Each extract was evaporated to dryness under nitrogen, and the residues were then dissolved in a small amount of a 2:1 v/v mixture of chloroform and methanol and applied to a TLC plate (Merck, Silica Gel 60). The plate was developed with a medium of chloroform:methanol:formic acid:acetic acid = 100:100:9:9 (v/v/v/v). The products and standards were visualized with primulin reagent, and the products identified by comparison with chromatographic standards. PC and PE were then scraped from the TLC plate for quantification. Phospholipids were quantified according to the method of Rouser et al. (15). Briefly, the lipids were digested by heating for 1 h at 200°C with 70% perchloric acid. After cooling, ammonium molybdate and ascorbic acid solution were added in that order. Color was developed after heating for 5 min in a boiling water bath. Absorbance was determined at 820 nm by spectrophotometer. Phospholipid levels were corrected by the total protein amount in isolated mitochondria.
Respiratory enzyme activity and ATP synthesis
Mitochondrial respiratory enzyme activities were measured as previously described, using colorimetric assays in isolated mitochondria (16,17). Complex I (NADH-ubiquinone oxidoreductase) activity was measured by the reduction of 10 μm decylubiquinone (DB) in the presence of 2 mm potassium cyanide (KCN), 50 μg/ml antimycin and 50 μm NADH at 272 nm. Complex II (succinate-ubiquinone oxidoreductase) activity was measured by the reduction of 50 μm 2,6-dichlorophenolindophenol in the presence of 20 mm succinate, 2.5 μg/ml rotenone, 2.5 μg/ml antimycin, 2 mm KCN and 50 μm DB at 600 nm. Complex III (ubiquinol-ferricytochrome c oxidoreductase) activity was measured by the reduction of 50 μm cytochrome c at 550 nm in the presence of 50 μm reduced DB and 2 mm KCN. Complex IV (ferrocytochrome c-oxigen oxidoreductase) activity was measured by the oxidation of 2.5 μm reduced cytochrome c at 550 nm. The activity was calculated using an extinction coefficient of 8 mm−1cm−1, 19.1 mm−1cm−1, 19.0 mm−1cm−1 and 19.0 mm−1cm−1 for Complexes I, II, III and IV, respectively. The specific activity of the enzymes was expressed as nmol of each substrate oxidized or reduced/min/mg of mitochondrial protein.
Mitochondrial ATP synthesis was measured by the method of Manfredi and colleagues (18). Briefly, isolated mitochondria were resuspended in 0.25 m sucrose, 50 mm 4-(2-hydroxyethyl)-1-piperazineethanesulfonic acid (HEPES), 2 mm MgCl2, 1 mm ethylene glycol tetraacetic acid (EGTA) and 10 mm KH2PO4, pH 7.4. Then 0.15 mm P1,P5-di(adenosine) pentaphosphate, 1 mm malate, 1 mm pyruvate, luciferin and luciferase and 0.1 mm adenosine diphosphate (ADP) were added, and light emission was recorded by luminometer. For each sample, 1 mm oligomycin-added sample was used to obtain the baseline luminescence corresponding to non-mitochondrial ATP production.
CoQ9 determination
Total CoQ9 contents in isolated mitochondria were analyzed with high performance liquid chromatography (HPLC) by electrochemical detection according to the standard procedure described by Tang et al. (19). Briefly, isolated muscle mitochondria pellet were lysed with 2-propanol, vortexed for 1 min and centrifuged at 2000g for 10 min and then clear supernatant was applied for HPLC Coul Array Detector Model 5600A (ESA BIOSCIENCES, Inc.) with Capcell Pak C18 MG 100 column (3.2 I.D × 150 mm length; ESA BIOSCIENCES, Inc.). The mobile phase was degassed methanol containing 0.4% sodium acetate, 1.5% acetic acid, 1% 2-propanol and 8% n-hexane. Chromatographic data were analyzed with CoulArray Data Station 3.00 (ESA Biosciences). Standard curves were created with both oxidized and reduced CoQ9. Total CoQ9 level was determined according to the standard curve and corrected by the total protein level in isolated mitochondria as measured by the Bradford method.
High-resolution clear native PAGE
High-resolution clear native polyacrylamide gel electrophoresis (PAGE) was performed by the method of Wittig et al. (20). Briefly, isolated mitochondria were solubilized with Native PAGE Sample buffer (Invitrogen) containing 0.3% n-dodecyl-β-d-maltoside (Dojindo). Twenty micrograms of protein were applied to 3–12% NativePAGE Bis–Tris gel (Invitrogen). Native PAGE buffer (Invitrogen) was used for anode buffer and Native PAGE buffer containing 0.02% n-dodecyl-β-D-maltoside and 0.05% deoxycolate was used for cathode buffer.
For in-gel catalytic activity assays, gels were incubated in the following solutions: Complex I, 5 mm Tris–HCl pH 7.4, 140 μm NADH and 3 mm nitro tetrazolium blue (NTB); Complex II, 5 mm Tris–HCl pH 7.4, 20 mm succinate, 3 mm NTB and 200 μm phenazine methosulfate; Complex III, 50 mm sodium phosphate buffer pH 7.2 and 0.5 mg/ml diaminobenzidine (DAB); Complex IV, 50 mm sodium phosphate buffer (pH 7.2), 0.5 mg/ml DAB and 5 mm cytochrome c.
For immunoblotting, gels were incubated for 20 min in 300 mm Tris, 100 mm acetic acid, 1% sodium dodecyl sulfate (SDS), pH 8.6 and then electroblotted to polyvinylidene fluoride (PVDF) membrane (Millipore). Complexes II and III were detected with monoclonal antibodies against the 70 kDa subunit (Abcam) and core 2 subunit (Invitrogen), respectively.
Measurement of mitochondrial superoxide (O2−) production
Mitochondrial superoxide production was measured by dehydroethidium (DHE) (Molecular Probes), as described previously (21). Isolated mitochondria were incubated with 200 mm mannitol, 70 mm sucrose, 2 mm HEPES pH 7.4, 0.5 mm EGTA and 0.1% BSA. Reagents were added in the following order: 1 mm glutamate, 1 mm malate, 1 μm DHE, 0.25 mm ADP and 5 mm KH2PO4. Fluoresence was measured by Cytofluor 4000 (Applied biosystems) at excitation/emission = 530/620 nm.
Measurement of malondialdehyde in muscle
Malondialdehyde (MDA) levels were measured in muscle homogenates using an LPO-485 assay kit (BIOXYTEC), according to the manufacturer's protocol.
Western blot analysis for muscle tissue and isolated mitochondria
Proteins were extracted from quadriceps femoris muscles or mitochondria isolated from forelimb and hindlimb muscles and suspended in SDS sample buffer; 125 mm Tris–HCl pH 6.8, 5% β-mercaptoethanol, 2% SDS and 10% glycerol. Extracted proteins were separated on acrylamide gels, and then transferred onto PVDF membranes (Millipore). Blocking solution of 5% skim milk was used. ImageQuant LAS 4000 Mini Biomolecular Imager (GE Healthcare) was used for evaluating bands.
Quantification of mtDNA by real-time PCR
Total DNA was isolated from triceps and quadriceps femoris and liver by proteinase K digestion and standard phenol–chloroform extraction. Copy number of mtDNA (ND1) was quantified by real-time polymerase chain reaction (PCR) using SYBR Green PCR Kit (Qiagen) with pcam1 as the control for the nuclear genome copy number. We used the following primers: ND1 forward primer, CCTATCACCCTTGCCATCAT; ND1 reverse primer, GAGGCTGTTGCTTGTGTGAC; pcam1 DNA forward primer, ATGGAAAGCCTGCCATCATG; pcam1 DNA reverse primer, TCCTTGTTGTTCAGCATCAC.
The amount of mtDNA relative to nuclear DNA was calculated using the following formula:  where Ct is the threshold cycle (22).
Morphometrical analysis of mitochondria
Cross-sectional EM image of extensor digitorum longus (EDL) muscle from rmd and littermates was analyzed by Image J software (23). Total areas of all mitochondria in 20 muscle fibers were calculated and compared with cross-sectional fiber areas. Total number of mitochondria per muscle fiber was counted.
Antibodies
Primary antibodies used were: mouse anti-4-hydroxy-2-nonenal (4-HNE) modified protein antibody (HNEJ-2,JalCA), rabbit anti-PINK1 antibody (BC100-494, Novus Biologicals), mouse anti-Parkin antibody (4211, Cell Signaling), rabbit anti-p62/SQSTM1 antibody (PWS860, Biomol), rabbit anti-LC3 antibody (NB100-2220, Novus Biologicals), mouse anti-poly-ubiquitin antibody (FK1, Biomol), rabbit anti-TOM20 antibody (FL-145, Santa Cruz), mouse anti-COX subunit 1 antibody (Invitrogen) and mouse anti-VDAC antibody (20B12, Santa Cruz). Second antibodies used were: horse radish peroxidase-labeled goat anti-mouse (Beckman Coulter) or rabbit antibodies (Cell Signaling), Alexa Fluor 488- and Alexa Fluor 568-labeled goat anti-mouse or rabbit antibodies (Invitrogen).
Statistical analysis
Data are presented as mean ± SD. Mean differences were compared with the analysis of t-test using R software version 2.11.0 (http://www.r-project.org/).
SUPPLEMENTARY MATERIAL
FUNDING
This study was supported partly by the Research on Psychiatric and Neurological Diseases and Mental Health of Health and Labour Sciences Research Grants; partly by the Research on Intractable Diseases of Health and Labor Sciences Research Grants; partly by the Research Grant for Nervous and Mental Disorders (20B-12, 20B-13) from the Ministry of Health, Labour and Welfare; partly by an Intramural Research Grant (23-4, 23-5) for Neurological and Psychiatric Disorders from NCNP; partly by KAKENHI (20390250, 22791019); partly by Research on Publicly Essential Drugs and Medical Devices of Health and Labor Sciences Research Grants; partly by the Program for Promotion of Fundamental Studies in Health Sciences of the National Institute of Biomedical Innovation (NIBIO); and partly by the Grant from Japan Foundation for Neuroscience and Mental Health. G.A.C. and R.B.S. were supported in part by a National Institutes of Health Grant (AR054170 to G.A.C.).
Supplementary Material
ACKNOWLEDGEMENTS
We thank Megumu Ogawa, Kanako Goto and Junko Takei for technical assistance.
REFERENCES
- 1.Mitsuhashi S., Ohkuma A., Talim B., Karahashi M., Koumura T., Aoyama C., Kurihara M., Quinlivan R., Sewry C., Mitsuhashi H., et al. A congenital muscular dystrophy with mitochondrial structural abnormalities caused by defective de novo phosphatidylcholine biosynthesis. Am. J. Hum. Genet. 2011;88:845–851. doi: 10.1016/j.ajhg.2011.05.010. doi:10.1016/j.ajhg.2011.05.010. [DOI] [PMC free article] [PubMed] [Google Scholar]
- 2.Sher R.B., Aoyama C., Huebsch K.A., Ji S., Kerner J., Yang Y., Frankel W.A., Hoppel C.A., Wood P.A., Vance D.E., et al. A rostrocaudal muscular dystrophy caused by a defect in choline kinase beta, the first enzyme in phosphatidylcholine biosynthesis. J. Biol. Chem. 2006;281:4938–4948. doi: 10.1074/jbc.M512578200. doi:10.1074/jbc.M512578200. [DOI] [PubMed] [Google Scholar]
- 3.Saraste M. Oxidative phosphorylation at the fin de siècle. Science. 1999;283:1488–1493. doi: 10.1126/science.283.5407.1488. doi:10.1126/science.283.5407.1488. [DOI] [PubMed] [Google Scholar]
- 4.Spierings D., McStay G., Saleh M., Bender C., Chipuk J., Maurer U., Green D.R. Connected to death: the (unexpurgated) mitochondrial pathway of apoptosis. Science. 2005;310:66–67. doi: 10.1126/science.1117105. doi:10.1126/science.1117105. [DOI] [PubMed] [Google Scholar]
- 5.Wakabayashi T. Megamitochondria formation—physiology and pathology. J. Cell Mol. Med. 2002;6:497–538. doi: 10.1111/j.1582-4934.2002.tb00452.x. doi:10.1111/j.1582-4934.2002.tb00452.x. [DOI] [PMC free article] [PubMed] [Google Scholar]
- 6.Benard G., Bellance N., James D., Parrone P., Fernandez H., Letellier T. Mitochondrial bioenergetics and structural network organization. J. Cell Sci. 2007;120:838–848. doi: 10.1242/jcs.03381. doi:10.1242/jcs.03381. [DOI] [PubMed] [Google Scholar]
- 7.Yoon Y.S., Yoon D.S., Lim I.K., Yoon S.H., Chung H.Y., Rojo M., Malka F., Jou M.J., Martinou J.C., Yoon G. Formation of elongated giant mitochondria in DFO-induced cellular senescence: involvement of enhanced fusion process through modulation of Fis1. J. Cell Physiol. 2006;209:468–480. doi: 10.1002/jcp.20753. doi:10.1002/jcp.20753. [DOI] [PubMed] [Google Scholar]
- 8.Karbowski M., Kurono C., Wozniak M., Ostrowski M., Teranishi M., Nishizawa Y., Usukura J., Soji T., Wakabayashi T. Free radical-induced megamitochondria formation and apoptosis. Free Radic. Biol. Med. 1999;26:396–409. doi: 10.1016/s0891-5849(98)00209-3. doi:10.1016/S0891-5849(98)00209-3. [DOI] [PubMed] [Google Scholar]
- 9.Chen H., Detmer S.A., Ewald A.J., Griffin E.E., Fraser S.E., Chan D.C. Mitofusins Mfn1 and Mfn2 coordinately regulate mitochondrial fusion and are essential for embryonic development. J. Cell Biol. 2003;160:189–200. doi: 10.1083/jcb.200211046. doi:10.1083/jcb.200211046. [DOI] [PMC free article] [PubMed] [Google Scholar]
- 10.Chen H., Chomyn A., Chan D.C. Disruption of fusion results in mitochondrial heterogeneity and dysfunction. J. Biol. Chem. 2005;280:26185–26192. doi: 10.1074/jbc.M503062200. doi:10.1074/jbc.M503062200. [DOI] [PubMed] [Google Scholar]
- 11.Wu G., Sher R.B., Cox G.A., Vance D.E. Understanding the muscular dystrophy caused by deletion of choline kinase beta in mice. Biochim. Biophys. Acta. 2009;1791:347–356. doi: 10.1016/j.bbalip.2009.02.006. [DOI] [PubMed] [Google Scholar]
- 12.Daum G. Lipids of mitochondria. Biochim. Biophys. Acta. 1985;822:1–42. doi: 10.1016/0304-4157(85)90002-4. [DOI] [PubMed] [Google Scholar]
- 13.Hayashi Y.K., Matsuda C., Ogawa M., Goto K., Tominaga K., Mitsuhashi S., Park Y.E., Nonaka I., Hino-Fukuyo N., Haginoya K., et al. Human PTRF mutations cause secondary deficiency of caveolins resulting in muscular dystrophy with generalized lipodystrophy. J. Clin. Invest. 2009;119:2623–2633. doi: 10.1172/JCI38660. doi:10.1172/JCI38660. [DOI] [PMC free article] [PubMed] [Google Scholar]
- 14.Bligh E.G., Dyer W.J. A rapid method of total lipid extraction and purification. Can. J. Biochem. Physiol. 1959;37:911–917. doi: 10.1139/o59-099. doi:10.1139/o59-099. [DOI] [PubMed] [Google Scholar]
- 15.Rouser G., Fkeischer S., Yamamoto A. Two dimensional then layer chromatographic separation of polar lipids and determination of phospholipids by phosphorus analysis of spots. Lipids. 1970;5:494–496. doi: 10.1007/BF02531316. doi:10.1007/BF02531316. [DOI] [PubMed] [Google Scholar]
- 16.Mimaki M., Hatakeyama H., Ichiyama T., Isumi H., Furukawa S., Akasaka M., Kamei A., Komaki H., Nishino I., Nonaka I., et al. Different effects of novel mtDNA G3242A and G3244A base changes adjacent to a common A3243G mutation in patients with mitochondrial disorders. Mitochondrion. 2009;9:115–122. doi: 10.1016/j.mito.2009.01.005. doi:10.1016/j.mito.2009.01.005. [DOI] [PubMed] [Google Scholar]
- 17.Trounce I.A., Kim Y.L., Jun A.S., Wallace D.C. Assessment of mitochondrial oxidative phosphorylation in patient muscle biopsies, lymphoblasts, and tranmitochondrial cell lines. Methods enzymol. 1996;264:484–509. doi: 10.1016/s0076-6879(96)64044-0. doi:10.1016/S0076-6879(96)64044-0. [DOI] [PubMed] [Google Scholar]
- 18.Vives-Bauza C., Yang L., Manfredi G. Methods in Cell Biology. Mitochondria. (2nd edn.) Vol. 80:155–171. doi: 10.1016/S0091-679X(06)80007-5. Academic Press, London, UK, Part 2, 7. [DOI] [PubMed] [Google Scholar]
- 19.Tang P.H., Miles M.V., Miles L., Quinlan J., Wong B., Wenisch A., Bove K. Measurement of reduced and oxidized coenzyme Q9 and coenzyme Q10 levels in mouse tissues by HPLC with coulometric detection. Clin. Chim. Acta. 2004;341:173–184. doi: 10.1016/j.cccn.2003.12.002. doi:10.1016/j.cccn.2003.12.002. [DOI] [PubMed] [Google Scholar]
- 20.Wittig I., Karas M., Schagger H. High resolution clear native electrophoresis for in-gel functional assays and fluorescence studies of membrane protein complexes. Mol. Cell Proteomics. 2007;6:1215–1225. doi: 10.1074/mcp.M700076-MCP200. doi:10.1074/mcp.M700076-MCP200. [DOI] [PubMed] [Google Scholar]
- 21.Armstrong J.S., Whiteman M. Methods in Cell Biology. Mitochondria. (2nd edn.) Vol. 80:355–377. Academic Press, London, UK, 18. [Google Scholar]
- 22.Naini A., Shanske S. Methods in Cell Biology. Mitochondria. (2nd edn.) Vol. 80:448–449. Academic Press, London, UK, Part2, 22. [Google Scholar]
- 23.Abramoff M.D., Magelhaes P.J., Ram S.J. Image processing with Image J. Biophotonics Int. 2004;11:36–42. [Google Scholar]
- 24.Zhang M., Mileykovskaya E., Dowhan W. Gluing the respiratory chain together. Cardiolipin is required for supercomplex formation in the inner mitochondrial membrane. J. Biol. Chem. 2002;277:43553–43556. doi: 10.1074/jbc.C200551200. doi:10.1074/jbc.C200551200. [DOI] [PubMed] [Google Scholar]
- 25.Geisler S., Holmström K.M., Skujat D., Fiesel F.C., Rothfuss O.C., Kahle P.J., Springer W. PINK1/Parkin-mediated mitophagy is dependent on VDAC1 and p62/SQSTM1. Nat. Cell Biol. 2010;12:119–131. doi: 10.1038/ncb2012. doi:10.1038/ncb2012. [DOI] [PubMed] [Google Scholar]
- 26.Narendra D., Tanaka A., Suen D.F., Youle R.J. Parkin is recruited selectively to impaired mitochondria and promotes their autophagy. J. Cell Biol. 2008;183:795–803. doi: 10.1083/jcb.200809125. doi:10.1083/jcb.200809125. [DOI] [PMC free article] [PubMed] [Google Scholar]
- 27.Lee A.G. Lipid-protein interactions in biological membranes: a structural perspective. Biochim. Biophys. Acta. 2003;1612:1–40. doi: 10.1016/s0005-2736(03)00056-7. doi:10.1016/S0005-2736(03)00056-7. [DOI] [PubMed] [Google Scholar]
- 28.Lange C., Nett J.H., Trumpower B.L., Hunte C. Specific roles of protein-phospholipid interactions in the yeast cytochrome bc1 complex structure. EMBO J. 2001;20:6591–6600. doi: 10.1093/emboj/20.23.6591. doi:10.1093/emboj/20.23.6591. [DOI] [PMC free article] [PubMed] [Google Scholar]
- 29.Hagopian K., Weber K.L., Hwee D.T., Van Eenennaam A.L., López-Lluch G., Villalba J.M., Burón I., Navas P., German J.B., Watkins S.M., et al. Complex I-associated hydrogen peroxide production is decreased and electron transport chain enzyme activities are altered in n-3 enriched fat-1 mice. PLoS ONE. 2010;5:e12696. doi: 10.1371/journal.pone.0012696. doi:10.1371/journal.pone.0012696. [DOI] [PMC free article] [PubMed] [Google Scholar]
- 30.Balaban R.S., Nemoto S., Finkel T. Mitochondria, oxidants, and aging. Cell. 2005;120:483–495. doi: 10.1016/j.cell.2005.02.001. doi:10.1016/j.cell.2005.02.001. [DOI] [PubMed] [Google Scholar]
- 31.St-Pierre J., Buckingham J.A., Roebuck S.J., Brand M.D. Topology of superoxide production from different sites in the mitochondrial electron transport chain. J. Biol. Chem. 2002;277:44784–44790. doi: 10.1074/jbc.M207217200. doi:10.1074/jbc.M207217200. [DOI] [PubMed] [Google Scholar]
- 32.Osaki Y., Nishino I., Murakami N., Matsubayashi K., Tsuda K., Yokoyama Y.I., Morita M., Onishi S., Goto Y.I., Nonaka I. Mitochondrial abnormalities in selenium-deficient myopathy. Muscle Nerve. 1998;21:637–639. doi: 10.1002/(sici)1097-4598(199805)21:5<637::aid-mus10>3.0.co;2-s. doi:10.1002/(SICI)1097-4598(199805)21:5<637::AID-MUS10>3.0.CO;2-S. [DOI] [PubMed] [Google Scholar]
- 33.Hill K.E., Motley A.K., Li X., May J.M., Burk R.F. Combined selenium and vitamin E deficiency causes fatal myopathy in guinea pigs. J. Nutr. 2001;131:1798–1802. doi: 10.1093/jn/131.6.1798. [DOI] [PubMed] [Google Scholar]
- 34.Rederstorff M., Krol A., Lescure A. Understanding the importance of selenium and selenoproteins in muscle function. Cell Mol. Life Sci. 2006;63:52–59. doi: 10.1007/s00018-005-5313-y. doi:10.1007/s00018-005-5313-y. [DOI] [PMC free article] [PubMed] [Google Scholar]
- 35.Martensson J., Meister A. Mitochondrial damage in muscle occurs after marked depletion of glutathione and is prevented by giving glutathione monoester. Proc. Natl Acad. Sci. USA. 1989;86:471–475. doi: 10.1073/pnas.86.2.471. doi:10.1073/pnas.86.2.471. [DOI] [PMC free article] [PubMed] [Google Scholar]
- 36.Choksi K.B., Boylston W.H., Rabek J.P., Widger W.R., Papaconstantinou J. Oxidatively damaged proteins of heart mitochondrial electron transport complexes. Biochim. Biophys. Acta. 2004;1688:95–101. doi: 10.1016/j.bbadis.2003.11.007. [DOI] [PubMed] [Google Scholar]
- 37.Kim I., Rodriguez-Enriquez S., Lemasters J. Selective degradation of mitochondria by mitophagy. Arch. Biochem. Biophys. 2007;462:245–253. doi: 10.1016/j.abb.2007.03.034. doi:10.1016/j.abb.2007.03.034. [DOI] [PMC free article] [PubMed] [Google Scholar]
- 38.Tatsuta T., Langer T. Quality control of mitochondria: protection against neurodegeneration and ageing. EMBO J. 2008;27:306–314. doi: 10.1038/sj.emboj.7601972. doi:10.1038/sj.emboj.7601972. [DOI] [PMC free article] [PubMed] [Google Scholar]
- 39.Ding W.X., Ni H.M., Li M., Liao Y., Chen X., Stolz D.B., Dorn G.W., 2nd., Yin X.M. Nix is critical to two distinct phases of mitophagy, reactive oxygen species-mediated autophagy induction and Parkin-ubiquitin-p62-mediated mitochondrial priming. J. Biol. Chem. 2010;285:27879–27890. doi: 10.1074/jbc.M110.119537. doi:10.1074/jbc.M110.119537. [DOI] [PMC free article] [PubMed] [Google Scholar]
- 40.Moraes C.T., Shanske S., Tritschler H.J., Aprille J.R., Andreetta F., Bonilla E., Schon E.A., DiMauro S. mtDNA depletion with variable tissue expression: a novel genetic abnormality in mitochondrial diseases. Am. J. Hum. Genet. 1991;48:492–501. [PMC free article] [PubMed] [Google Scholar]
- 41.Kim I., Lemasters J.J. Mitochondrial degradation by autophagy (mitophagy) in GFP-LC3 transgenic hepatocytes during nutrient deprivation. Am. J. Physiol. Cell Physiol. 2011;300:C308–C317. doi: 10.1152/ajpcell.00056.2010. doi:10.1152/ajpcell.00056.2010. [DOI] [PMC free article] [PubMed] [Google Scholar]
Associated Data
This section collects any data citations, data availability statements, or supplementary materials included in this article.


