

Abstract
In Alzheimer’s disease (AD), lipid alterations are present early during disease progression. As some of these alterations point towards a peroxisomal dysfunction, we investigated peroxisomes in human postmortem brains obtained from the cohort-based, longitudinal Vienna-Transdanube Aging (VITA) study. Based on the neuropathological Braak staging for AD on one hemisphere, the patients were grouped into three cohorts of increasing severity (stages I–II, III–IV, and V–VI, respectively). Lipid analyses of cortical regions from the other hemisphere revealed accumulation of C22:0 and very long-chain fatty acids (VLCFA, C24:0 and C26:0), all substrates for peroxisomal β-oxidation, in cases with stages V–VI pathology compared with those modestly affected (stages I–II). Conversely, the level of plasmalogens, which need intact peroxisomes for their biosynthesis, was decreased in severely affected tissues, in agreement with a peroxisomal dysfunction. In addition, the peroxisomal volume density was increased in the soma of neurons in gyrus frontalis at advanced AD stages. Confocal laser microscopy demonstrated a loss of peroxisomes in neuronal processes with abnormally phosphorylated tau protein, implicating impaired trafficking as the cause of altered peroxisomal distribution. Besides the original Braak staging, the study design allowed a direct correlation between the biochemical findings and the amount of neurofibrillary tangles (NFT) and neuritic plaques, quantified in adjacent tissue sections. Interestingly, the decrease in plasmalogens and the increase in VLCFA and peroxisomal volume density in neuronal somata all showed a stronger association with NFT than with neuritic plaques. These results indicate substantial peroxisome-related alterations in AD, which may contribute to the progression of AD pathology.
Electronic supplementary material
The online version of this article (doi:10.1007/s00401-011-0836-9) contains supplementary material, which is available to authorized users.
Keywords: Aging, Neurofibrillary tangles, Peroxisome, Plasmalogen, VLCFA
Introduction
Owing to the increased life expectancy, the number of aging individuals affected by Alzheimer’s disease (AD) is growing rapidly. Fundamental knowledge has been generated from basic research and familial mutations highlighting the role of amyloid precursor protein (APP), presenilin-1 and presenilin-2, as well as pathological phosphorylation of tau in the neuropathological changes. However, only limited information is available on initial events and disease modulators. So far, the ε4 allele of apolipoprotein E (APOE) is the best established genetic risk factor for sporadic AD [4, 39]. Although neurofibrillary degeneration may appear early in life [9], aging is one major factor for the development of AD-related neuropathology. The onset and progression of neuropathological alterations (and finally conversion from mild cognitive impairment to clinical AD) is variable. Age-based metabolic changes may lead to an imbalance of metabolites and/or second messengers promoting mitochondrial, endosomal–lysosomal and peroxisomal dysfunctions, which might be involved in the initiation of neuropathological events in AD [26, 32]. Mitochondria contribute to aging, as mutations accumulate in the mitochondrial DNA, leading to dysfunction and net production of reactive oxygen species (ROS), reviewed in [26]. The observation that the life span of mice is extended when catalase, normally localized to the cytosol and to peroxisomes, is transgenically targeted to mitochondria supports the theory of organellar contribution to aging [37].
Peroxisomes are present in all nucleated human cells, including all cell types of the brain, and perform anabolic and catabolic functions and play a major role in generation and decomposition of ROS, reviewed in [1, 6, 36, 41]. An altered intra-peroxisomal balance between ROS production by many oxidases and scavenging of ROS possibly adds to oxidative stress in AD, as recently suggested from animal studies [11]. In addition, peroxisomes are required for some steps in the synthesis of several lipids with antioxidant properties and are thus involved in the cellular protection against ROS burden; prominent representatives are plasmalogens [24] and docosahexaenoic acid (DHA) [10]. The levels of both of these lipids are decreased in brains of patients suffering from a generalized peroxisome biogenesis deficiency (Zellweger syndrome spectrum) [30] and in AD [15, 18, 19, 29, 34].
Plasmalogens represent a heterogeneous class of phospholipids characterized by a vinyl ether substitution at the sn-1 position of the glycerol backbone. This glycerol–vinyl ether bond can only be synthesized in peroxisomes by the enzymes dihydroxyacetone phosphate acyltransferase (DHAPAT) and alkyldihydroxyacetone phosphate synthase (ADHAPS). In brain, ethanolamine is the predominant head group of plasmalogens. Although in human gray matter and neurons, the sn-2 position of plasmalogens is predominantly occupied by polyunsaturated acyl chains, such as arachidonic acid and DHA, in white matter almost exclusively monounsaturated acyl chains are present [17]. Plasmalogens were described to be significantly reduced in both gray and white matter of AD patients [15, 18, 19, 34]. The decrease in plasmalogens is independent of the APOE ε4 allele [34]. Moreover, the level of circulating ethanolamine–plasmalogens is significantly decreased in serum from clinically and pathologically diagnosed AD subjects at all stages of dementia, and the severity of this decrease correlated with the severity of dementia [16, 42].
The polyunsaturated fatty acid (PUFA) DHA (22:6 ω3) is predominantly derived from the diet but can also be synthesized by glial and endothelial cells via elongation, desaturation and a final step of peroxisomal β-oxidation from the precursors eicosapentaenoic acid (20:5 ω3) or linolenic acid (18:3 ω3). DHA incorporated into phospholipids and cholesterol esters were found to be reduced in brain [29] and plasma [12] of AD patients and several studies indicate a decreased risk for AD after an ω3 (in particular DHA) rich diet [3, 20, 31].
The reduced plasmalogen level and increased ROS production in AD resemble findings observed in peroxisomal disorders. In case of a generalized peroxisome deficiency, such as in patients affected by Zellweger spectrum disorder (ZSD), the loss of peroxisomal functions such as plasmalogen biosynthesis and fatty acid α and β-oxidation leads to decreased amounts of plasmalogens and bile acids, whereas very long-chain fatty acids (VLCFA), long-chain dicarboxylic acids and, dependent on dairy product intake, pristanic and phytanic acid accumulate [41]. A decrease in peroxisomal scavenging enzymes, such as catalase and peroxiredoxins, reviewed in [36], during aging may lead to peroxisomal ROS imbalance and consequently to an increase in free radicals and cellular oxidative stress.
The similarities in lipid alterations observed in AD and peroxisomal disorders, prompted us to specifically investigate the role of peroxisomes in human AD. To this end, we combined neuropathological, biochemical, lipidomic and immunohistochemical analyses focusing on peroxisomes in well-defined autopsy material derived from the Vienna Transdanube Aging (VITA) study, a longitudinal, community-based cohort study [14], enabling us to generate a uniform sample set of age-matched AD and control cases. Our results show accumulation of VLCFA and decreased plasmalogen levels indicating peroxisomal dysfunction in AD, as well as an increase in peroxisomal volume density in neuronal cell bodies of cortical regions, all correlating with increasing progression of AD pathology.
Materials and methods
All analyses were performed in a blinded manner.
Immunohistochemistry
Brain sections were formalin-fixed and paraffin-embedded. Bielschowsky–Hirano’s silver staining was used for quantification of neuritic plaques. Mouse monoclonal antibody AT8 (Pierce Biotechnology) was used to detect phosphorylated tau protein for quantification of NFT.
Quantification of pathological markers for AD on brain sections
For quantitative light microscopic immunohistochemical analyses, 10× ocular magnification, 40× objective magnification and 1-mm2 grid size were used as microscope settings. Cortical areas with concentrated pathological markers were quantified to define the number of plaques or tangles in each grid area; ten grids were counted in each section. The staging of AD-related neuropathology was done on the left brain hemisphere according to Braak and Braak [7, 8]. The quantification of neuropathological markers in parasubiculum, trans-entorhinal cortex, gyrus frontalis medius, gyrus precentralis and cerebellar cortex of formalin-fixed and paraffin-embedded tissue adjacent to the snap-frozen tissues used for lipid analysis was done on the right hemisphere of each brain.
Quantitative Western blot analysis
Snap frozen postmortem tissues from different cortical brain regions were homogenized in Potter–Elvehjem tissue grinders at 4°C in the presence of protease inhibitor cocktail (Roche). After measurement of protein concentration, aliquots were stored at −80°C until use for lipidomic or western blot analyses. Homogenized human brain samples (2 μg of total protein) were diluted in H2O, heated with sample buffer for western blots [25] and loaded on precast 10–20% gradient polyacrylamide/Tris–Tricine gels (VarioGels®, Anamed Elektrophorese). After blot transfer to PVDF membrane, the samples were probed by an antibody mixture of β-tubulin (polyclonal rabbit anti-human β-tubulin III; Sigma) and myelin basic protein (MBP) (monoclonal rat anti-bovine MBP; Abcam). The membrane was blocked at room temperature (RT) for 1 h using 3% bovine serum albumin (Sigma) in PBST (PBS with 0.05% Tween) before incubating with primary antibody (diluted in PBS with 3% BSA) at 4°C overnight. After washing carefully in PBST, the membrane was incubated with Alexa Fluor 680 goat anti-rat and anti-rabbit secondary antibodies at RT in the dark for 1 h, and finally scanned for quantification of the fluorescence signal intensity using the Odyssey® infrared imaging system (LI-COR Biotechnology). MBP, an oligodendrocyte marker, was used to quantify the amount of myelin in grey matter samples. To this end, 20, 50 and 80 ng of purified human MBP of 18.3 kDa (Hytest) was loaded onto each gel as a mass standard for quantification of the relative amount of MBP in the human brain tissue samples. The monoclonal rat anti-bovine MBP antibody (Abcam) targets the bovine epitope amino acid 82–87 (DENPVV), which is identical in human MBP isoform 5 (18.5 kDa) and 6 (17.2 kDa). Isoform 5 is the most abundant form in the adult human CNS [33]; isoform 6 is identical to isoform 5 except for an 11 amino acid deletion near the C-terminus [21]. Isoforms 5 and 6 were used for MBP quantification. β-Tubulin III was used as a control for equal loading and transfer. Alexa Fluor 680-conjugated secondary antibodies were used for detection with the Odyssey® infrared imaging system (LI-COR Biotechnology).
Lipid analysis
VLCFA, pristanic acid and phytanic acid were measured according to previously described methods [40] and plasmalogens and PUFA as described in [13]. For improved method for analysis of plasmalogen subspecies, lipid standards dissolved in chloroform/methanol (1:2, vol/vol) were added to the extraction solvent before neutral lipid extraction, which was performed according to the method of Bligh and Dyer [5]. Dried lipids were dissolved in methanol containing 10 mM ammonium acetate. Mass spectrometry analyses and lipid quantifications were done on a triple quadrupole instrument (QUATTRO II from Micromass) equipped with a nano-ESI source as described [27].
Peroxisome volume density measurement
Brain sections from gyrus frontalis of ten AD patients each representing Braak stage III–IV and V–VI, respectively, and ten controls (Braak stage I–II) as defined (see above) were immunostained using a polyclonal rabbit anti-PMP70 antibody (Bioreagent) and DAKO EnVision© detection kit, peroxidase/DAB, rabbit/mouse (Dako, Glostrup, Denmark) was used to visualize peroxisomes for light microscopy. The stained slides were scanned (Hamamatsu, NanoZoomer Digital Pathology) and 15 subareas were randomly chosen for photographic documentation. At least 24 large, round neurons with the cytosol surrounding the nucleus and both nucleus and nucleoli visible were selected for each of 30 individuals; in total, 857 neurons were analyzed. We optically dissected the nucleus of neurons using the ‘lasso’ function of Adobe Photoshop with white background. Applying similar tolerance level of ‘magic wand’, we selected a brown immunoreactive dot representing PMP70 immunopositivity. Using black background, we cut this selection. Thus, only black cytoplasmic dots from each neuron were present. This was followed by selecting the cytoplasmic area of the same neuronal images and cutting with black background creating a black colored image of the neuronal cytoplasmic area. To determine the density of black dots per unit cytoplasmic area, we used the black and white images and the command ‘phase analysis’ using the software analySIS® with similar threshold values. The ratio of black pixels representing PMP70 immunoreactivity to the cytoplasmic area was used as a measure of peroxisome density in the neurons. This method is also described in [23].
Statistical evaluation
Continuous variables are presented as mean and range if normal distribution can be assumed and as median and range otherwise. In the case of normally (log-normally) distributed variables the bars in bar charts represent means (geometric means) and the error bars represent standard errors (standard errors calculated on the log-scale and back-transformed asymmetrically to the original scale). ANOVA models were used to compare various variables between stages or NFT or plaque status. Post hoc tests for pairwise stage comparisons were adjusted for multiple testing using Tukey’s method. If data on all brain areas were investigated, areas entered the model as second factor and the interaction of stage and area was tested. To estimate and test the NFT effect for different degrees of saturation of fatty acids across plasmalogen species, a mixed model was employed with a random patient effect (with compound symmetry correlation pattern), a species factor nested in the fatty acid type and an interaction term for tangles and fatty acid type. Similarly, a mixed model with random patient effect (with compound symmetry correlation pattern) was used to test for an NFT or plaque effect with respect to peroxisome density. To compare the effect of NFT with that of plaques resampling-based p values were calculated from 10,000 bootstrap samples. Standard errors presented in bar charts corresponding to these models are estimated from the mixed models and thus take account of within-patient correlations. Except for Tukey’s correction in the context of pairwise post hoc tests in ANOVA models, no further correction for multiple testing has been done due to the exploratory character of the study. All reported p values are the results of two-sided tests. p ≤ 0.05 was considered to be statistically significant. All computations were performed using SAS software version 9.2 (SAS Institute Inc., Cary, NC, USA, 2008).
Results
Study design and neuropathological staging
Autopsy brain tissues were obtained from 79 individuals deceased at 80–82 years of age, who had been enrolled in the VITA study at the age of 75 years, at that time lacking clinical evidence of dementia. According to neuropathological investigations of the left brain hemisphere, subjects with findings of α-synucleinopathy, including Parkinson’s disease or Lewy body dementia, frontotemporal lobar degeneration with TDP-43 proteinopathy, and primary tauopathies (e.g. corticobasal degeneration), progressive supranuclear palsy or argyrophilic grain disease were excluded from the present study. AD-related pathological alterations in cases involved in our study were staged according to Braak and Braak [7, 8] using silver staining and immunohistochemistry with antibodies against phosphorylated tau for detection of neuritic plaques and NFT, respectively and grouped into three categories: Braak stage I–II, stage III–IV and stage V–VI, with ten patients/group (Table 1).
Table 1.
Characteristics of brain tissues included in the study
| Groups | B&B | Gender | Age at death (years) | PMI (h) |
|---|---|---|---|---|
| B&B I–II | 4 B&B I, 6 B&B II | 10 (5M + 5F) | 81.23 (80.68–82.19) | 33.0 (6–95) |
| B&B III–IV | 9 B&B III, 1 B&B IV | 10 (2M + 8F) | 81.26 (80.38–82.08) | 27.5 (4–44) |
| B&B V–VI | 3 B&B V, 7 B&B VI | 10 (2M + 8F) | 81.40 (80.42–82.08) | 30.5 (9–85) |
PMI post mortem interval
From the right hemisphere of each brain, tissue samples were micro-dissected from the parasubiculum, trans-entorhinal cortex, gyrus frontalis medius, gyrus precentralis and the cerebellar cortex and snap frozen for biochemical studies. Adjacent tissues were formalin-fixed and paraffin-embedded for histological studies; the results for each tissue and patient are given in Table 2. The observed results are in good agreement with the original neuropathological Braak staging performed on the other brain hemisphere. Some individuals in the group Braak I–II (representing normal aging/mildly affected cases) showed unexpectedly high numbers of neuritic plaques (patients 5, 7 and 10 in Table 2) and NFT (patient 10 in Table 2) in both parasubiculum and trans-entorhinal cortex, but were still within the distribution and range of Braak stage I–II.
Table 2.
Quantification of neuritic plaques and neurofibrillary tangles in brain tissues
| Patient | Braak stage | Parasubiculum | Trans-entorhinal Cortex | Gyrus frontalis | Gyrus precentralis | ||||
|---|---|---|---|---|---|---|---|---|---|
| NFT | Plaque | NFT | Plaque | NFT | Plaque | NFT | Plaque | ||
| Braak stage I–IIa | |||||||||
| 1 | II | 1 | 0 | 3 | 0 | 0 | 0 | 0 | 0 |
| 2 | II | 1 | 4 | 9 | 0 | 0 | 0 | 0 | 0 |
| 3 | I | 7 | 1 | 20 | 9 | 0 | 0 | 0 | 0 |
| 4 | I–II | 3 | 0 | 17 | 0 | 0 | 0 | 0 | 0 |
| 5 | II | 0 | 47 | 3 | 40 | 0 | 54 | 0 | 43 |
| 6 | II | 2 | 0 | 4 | 0 | 0 | 0 | 0 | 0 |
| 7 | I | 0 | 31 | 8 | 44 | 0 | 21 | 0 | 6 |
| 8 | I | 2 | 0 | 39 | 0 | 0 | 0 | 0 | 0 |
| 9 | II | 0 | 0 | 4 | 0 | 0 | 0 | 0 | 0 |
| 10 | II | 24 | 29 | 62 | 20 | 0 | 15 | 0 | 7 |
| Braak stage III–IVa | |||||||||
| 11 | III–IV | 4 | 0 | 11 | 0 | 0 | 0 | 0 | 0 |
| 12 | III | 1 | 0 | 29 | 0 | 0 | 0 | 0 | 0 |
| 13 | III | 13 | 53 | 11 | 64 | 0 | 49 | 0 | 53 |
| 14 | III | 85 | 3 | 70 | 0 | 0 | 0 | 0 | 0 |
| 15 | III | 0 | 69 | 5 | 58 | 0 | 89 | 0 | 7 |
| 16 | III | 66 | 0 | 108 | 0 | 0 | 0 | 0 | 0 |
| 17 | III | 3 | 0 | 7 | 0 | 0 | 0 | 0 | 0 |
| 18 | III | 19 | 0 | 39 | 0 | 0 | 0 | 0 | 0 |
| 19 | III | 17 | 0 | 42 | 0 | 0 | 22 | 0 | 38 |
| 20 | III | 32 | 65 | 38 | 83 | 0 | 85 | 0 | 71 |
| Braak stage V–VIa | |||||||||
| 21 | VI | 30 | 11 | 69 | 44 | 8 | 61 | 4 | 5 |
| 22 | VI | 59 | 37 | 74 | 94 | 24 | 62 | 20 | 39 |
| 23 | VI | 93 | 71 | 63 | 70 | 19 | 92 | 20 | 61 |
| 24 | VI | 44 | 14 | 89 | 34 | 8 | 57 | 12 | 59 |
| 25 | V | 77 | 26 | 126 | 32 | 39 | 43 | 57 | 60 |
| 26 | VI | 14 | 15 | 21 | 39 | 5 | 13 | 0 | 7 |
| 27 | V | 36 | 67 | 95 | 91 | 0 | 143 | 3 | 98 |
| 28 | V | 3 | 4 | 48 | 44 | 8 | 76 | 0 | 37 |
| 29 | VI | 79 | 89 | 177 | 105 | 87 | 157 | 72 | 91 |
| 30 | VI | 51 | 7 | 71 | 19 | 2 | 8 | 1 | 8 |
The amount of myelin differs between cortical regions but not with AD pathology
Owing to differing amounts of myelinated fibers in various cortical areas and because the selective loss of neurons in AD could alter the relative proportions of lipids across the samples, we determined the amount of myelin basic protein (MBP) as a marker for myelin in each tissue sample by quantitative western blot analysis (Fig. S1). In all cortical tissues, the amount of MBP was at least sevenfold lower than the mean value of the white matter controls. There were significant differences in MBP content between cortical areas (p < 0.001), but not between groups of different AD stages within the same brain region (p = 0.630) (Fig. S1). The lowest amount of MBP was found in the cerebellar cortex. Among the regions of cerebral cortex, gyrus precentralis showed the highest amount of MBP (Fig. S1).
VLCFA accumulate in the brain of AD patients
In mammals, VLCFA with a carbon chain of more than 22 C atoms (and possibly also C22:0) are exclusively degraded by the peroxisomal β-oxidation system [41]. Thus, hypothesizing multifaceted peroxisomal dysfunctions in AD, using coupled gas chromatography–mass spectrometry (GC–MS) we measured the amount of long- and very long-chain fatty acids in all five sampled cortical brain regions of the 30 cases. In contrast to C16:0 and C18:0 (Fig. 1a, upper two panels), which are mainly degraded in mitochondria, C22:0 as well as the VLCFAs C24:0 and C26:0 were increased in all cortical areas except parasubiculum of the group with the highest Braak score (Fig. 1a, dashed line, lower three panels). In gyrus frontalis medius, the observed increase in the individual levels of C22:0, C24:0 and C26:0, and combined C24:0 plus C26:0 (VLCFA), showed a statistically significant difference when Braak stage I–II were compared with stage V–VI (Fig. 1a, b).
Fig. 1.
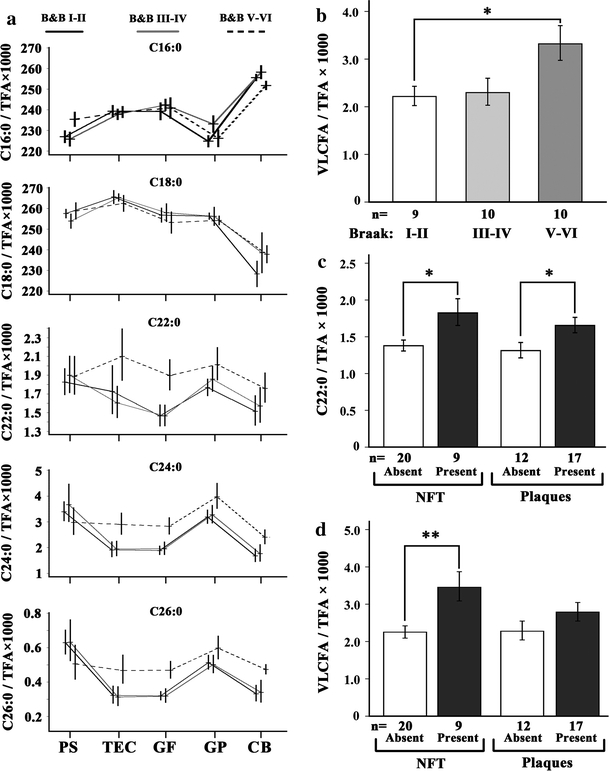
Accumulation of VLCFA in cortical areas of human brains associated with progressive AD neuropathology. a The content of long and very long-chain fatty acids in five different cortical regions, indicated below the graphs, was determined by GC–MS (n = 10/group). Relative amounts of the fatty acids C16:0, C18:0, C22:0, C24:0 and C26:0 are depicted as ratio to the total fatty acid (TFA) content (×1,000). The mean values of each AD severity group are connected across brain regions by the line pattern indicated above the graphs. The AD-related neuropathology was defined according to Braak staging of the contralateral hemisphere. Tissue abbreviations: PS parasubiculum, TEC trans-entorhinal cortex, GF gyrus frontalis, GP gyrus precentralis, CB cerebellar cortex. The mean level of VLCFA (C24:0 and C26:0 combined) in gyrus frontalis is depicted as ratio to total fatty acids for the three Braak stage groups (b) and of C22:0 (c) and VLCFA (d) in relation to NFT and plaques. The increase in VLCFA in stage V–VI when compared with stage I–II was statistically significant (corr. p = 0.044). When NFT were present, both C22:0 (c left) and VLCFA (d left) were significantly increased (p = 0.013 and 0.003, respectively). Also when the cases were grouped according to plaques, the levels of C22:0 (c right) and VLCFA (d right) were elevated when plaques were present, but to a lesser extent (p = 0.030 and 0.165, respectively). Thus, the increase in VLCFA was more strongly associated with NFT than with plaques. Error bars indicate SEM; *p < 0.05 and **p < 0.01; corr., corrected for multiple testing (Tukey’s post hoc test)
In addition to fatty acid β-oxidation, peroxisomes also contain the enzymes for α-oxidation of branched-chain fatty acids, such as phytanic acid. Therefore, we investigated the levels of phytanic acid and pristanic acid (the product of peroxisomal α-oxidation of phytanic acid) in the brain samples of our cohort. It should be noted that the human body does not synthesize phytanic acid; instead, it is solely derived from dietary intake and, hence, the amount of phytanic acid was highly variable. Pristanic acid, the product of peroxisomal phytanic acid α-oxidation, was only detectable in 38 out of 150 samples, probably due to dietary habits in this collective of elderly and the results were not further statistically evaluated.
Increase in VLCFA levels is associated with NFT rather than with neuritic plaques
Next, we asked whether the observed increase in VLCFA could be correlated with the amount of neuritic plaques and/or NFT. As we had quantified the number of neuritic plaques and NFT in tissue samples immediately adjacent to those collected for lipid analyses (Table 2), we regrouped the 30 patients into cohorts with absence or presence of NFT and plaques, respectively. For detailed quantitative and statistical comparisons, we focused on gyrus frontalis because this region showed the most pronounced difference in VLCFA levels between AD stages, it is a relatively mildly affected brain area and, thus, sufficient numbers of cases with and without the respective pathology were available for each category (Fig. 1c, d). We never observed isolated tauopathy (NFT) in the absence of amyloid plaques in our samples. Eight cases had an abundant plaque load in the absence of tangles, 9 featured both NFT and plaques and 13 (from 12 of these fatty acid profiles could be obtained) showed neither type of pathology in this brain region. For one sample, no fatty acid profile could be obtained. In samples with tangles and plaques, the amount of C22:0 was significantly increased when compared with those lacking the respective pathology (Fig. 1c; p = 0.013 and p = 0.030, respectively). The analysis of VLCFA (C24:0 plus C26:0) showed elevated levels that were associated with both types of pathology and disclosed a stronger, statistically significant (p = 0.003), increase in the presence of NFT than of neuritic plaques (p = 0.165) (Fig. 1d). The difference in the extent of elevation of VLCFA between the two groups of pathology was statistically significant (p = 0.024).
The levels of C22:0 and VLCFA show similar trends of increase in cerebellar cortex of AD brains
When considering whether the increase in VLCFA could be a direct consequence of abnormally phosphorylated tau, we compared the amount of VLCFA in the cerebellar cortex, where tangles are absent, with the cases grouped according to NFT pathology of gyrus frontalis. Although the increase was not statistically significant, there was a trend with the mean value of C22:0 increased by 14.5% (p = 0.336) and of VLCFA (C24:0 and C26:0 combined) by 36.6% (p = 0.109) in cerebellar cortex of patients with NFT in the gyrus frontalis (Fig. S2).
Reduced plasmalogen levels in gyrus frontalis of AD patients were associated with NFT rather than with neuritic plaques
Whereas VLCFA are degraded in peroxisomes, the synthesis of plasmalogens requires intact peroxisomes. The initial steps of ether-linked glycerophospholipid biosynthesis are exclusively carried out by the peroxisomal enzymes DHAPAT and ADHAPS. Thus, generalized peroxisomal dysfunction should affect the level of plasmalogens [41]. Because brain plasmalogens predominantly contain ethanolamine as head group, we first investigated C16:0 and C18:0 dimethyl acetals derived from total ethanolamine plasmalogens. This method did not account for C18:1 and disregarded the fatty acid present at the sn-2 position (Fig. 2a). In gyrus frontalis, we observed a statistically significant reduction (p = 0.027) of total plasmalogen concentrations when the control group (Braak stage I–II) was compared with the AD group, Braak stage V–VI (Fig. 2b). Sorting the brain specimens according to type of pathology, the reduction in plasmalogen levels compared with the unaffected group was more pronounced in the group with NFT (p = 0.004) than in the one with plaques only (p = 0.300) (Fig. 2c). This difference in reduction between NFT and plaques is statistically significant (p = 0.003).
Fig. 2.
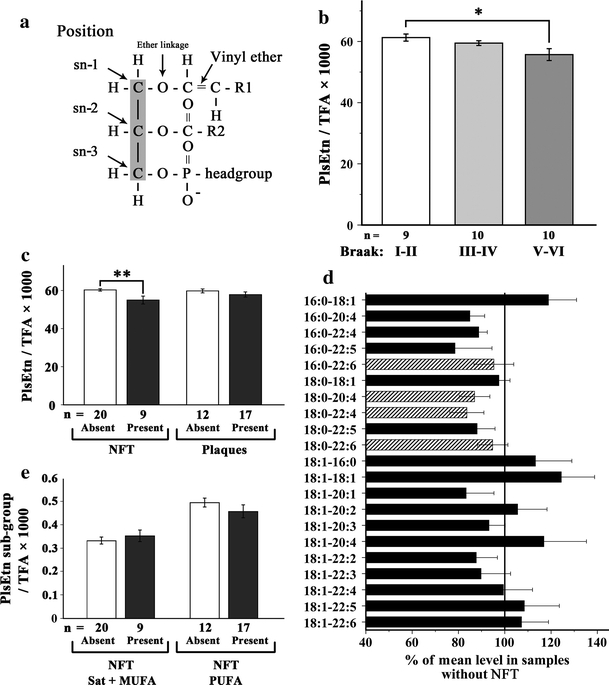
Plasmalogens are reduced in gyrus frontalis with AD pathology. a Schematic structure of plasmalogen. b, c The relative levels of total ethanolamine plasmalogens (PlsEtn) in gyrus frontalis medius were determined by GC–MS and expressed as ratio to the total fatty acid (TFA) content (×1,000). Reduced levels were observed when the samples were grouped either by Braak staging of neuropathology (b corr. p = 0.027) or by the presence or absence of NFT (c left; p = 0.004) or plaques (c right; p = 0.300). d Individual plasmalogen sub-species were determined by nano-ESI–MS and depicted as percentage of the mean level of the same plasmalogen species in samples without NFT. The four main species (striped) account together for 58.5% of total plasmalogen. e The level of plasmalogen species grouped according to the degree of saturation of the fatty acid at the sn-2 position and the presence or absence of NFT. The difference between the 6.1% increase in plasmalogens with saturated (sat) or monounsaturated (MUFA) fatty acids at sn-2 compared with the 7.7% decrease in those with polyunsaturated fatty acids (PUFA) is statistically significant (p = 0.019) The number (n) of cases in each group are indicated below the graphs. Error bars indicate SEM; *p < 0.05 and **p < 0.01; corr., corrected for multiple testing (Tukey’s post hoc test)
The significant reduction in plasmalogens association with NFT prompted us to evaluate the plasmalogen profile in gyrus frontalis in more detail. In Fig. 2d, the level of all plasmalogen species accounting for more than 0.1% of total phospholipids is indicated. Values are given in percent of the mean concentration found in cases, which showed an absence of NFT in the gyrus frontalis. Although some of the minor species were not decreased, most plasmalogen species, including the four major species: C16:0-22:6, C18:0-20:4, C18:0-22:4 and C18:0-22:6 (striped in Fig. 2d) accounting for more than 58% of total plasmalogens, were reduced. In myelin, mainly saturated and mono-unsaturated fatty acids have been found at the sn-2 position of plasmalogens, whereas in neurons predominantly PUFAs occupy this position [17]. Interestingly, whereas plasmalogens containing PUFA at the sn-2 position were decreased by 7.7% in tissues with NFT present, those containing mono-unsaturated or saturated fatty acids were increased by 6.1% (Fig. 2e). This difference was statistically significant (p = 0.019).
DHA and arachidonic acid are not decreased in AD brains
In addition to the dietary intake, DHA can be endogenously synthesized by one round of peroxisomal β-oxidation of the precursor C24:6 [41]. Neither DHA nor arachidonic acid levels were significantly altered in the different cortical regions (Fig. S3). However, within the plasmalogen fractions, DHA and arachidonic acid were reduced by 6.9 and 7.6%, respectively, in gyrus frontalis of the AD group Braak V–VI when compared with control tissues (Braak I–II) (Fig. S4a, b).
Peroxisomal density is increased in neuronal somata of AD brains
Our observations of altered concentrations of VLCFA and plasmalogens raised the question as to whether other peroxisomal attributes are changed in AD neurons. Thus, we next investigated the distribution of peroxisomes directly, by a quantitative analysis of peroxisomal density in gyrus frontalis. To this end, we applied immunohistochemical detection of the peroxisomal membrane protein PMP70 and determined stained area/cell by a morphometric method in at least 24 neurons of each case. The results demonstrated an increased number of neurons with a higher somatic peroxisomal density in gyrus frontalis of patients with more pronounced AD pathology (Fig. 3a). The increase in peroxisomal density showed significantly stronger (p = 0.001) association with the presence of NFT pathology (p = 0.018) than with amyloid plaques (p = 0.123) (Fig. 3b).
Fig. 3.

Increased peroxisome density in the soma of neurons in gyrus frontalis is associated with NFT. a The peroxisome density in the cell body of at least 24 neurons (each represented by a circle) in gyrus frontalis from each of the 30 cases in the cohort was determined by morphometry after immunohistochemical staining for PMP70 and plotted as pixel/mm2. The total number of analyzed neurons/Braak group is indicated at the bottom of the panel. b The increase in mean peroxisome volume density was statistically significant in tissues containing NFT (p = 0.018) but not in the group with plaques only (p = 0.123). The observation that the increase was more strongly associated with NFT than with plaques was statistically significant (p = 0.001). The number (n) of cases in each group is indicated below the graphs. Error bars indicate SEM; *p < 0.05
Peroxisomes are absent in neuronal processes with phosphorylated Tau
Finally, we investigated whether the increase in peroxisomal density in the neuronal somata containing NFT might be due to impaired transport of peroxisomes to neuronal processes as observed in cell culture models of organellar trafficking [28, 38]. By laser confocal microscopy, we analyzed double immunolabeling of peroxisomes co-stained for phosphorylated tau. In the neuronal processes lacking phospho-tau immunoreactivity, numerous PMP70-positive peroxisomes (Fig. 4a) and also superoxide dismutase 2 (SOD2)-positive mitochondria (Fig. 4b) were present. In contrast, no peroxisomes could be detected in neuronal processes, likely representing dendrites, with phosphorylated tau immunopositivity, corresponding to so-called pre-tangles (Fig. 4c), while the mitochondrial staining appeared unchanged (Fig. 4d). In neurons with fully developed NFT, few peroxisomes or mitochondria could be detected in the soma but not in the processes (Fig. 4e, f).
Fig. 4.
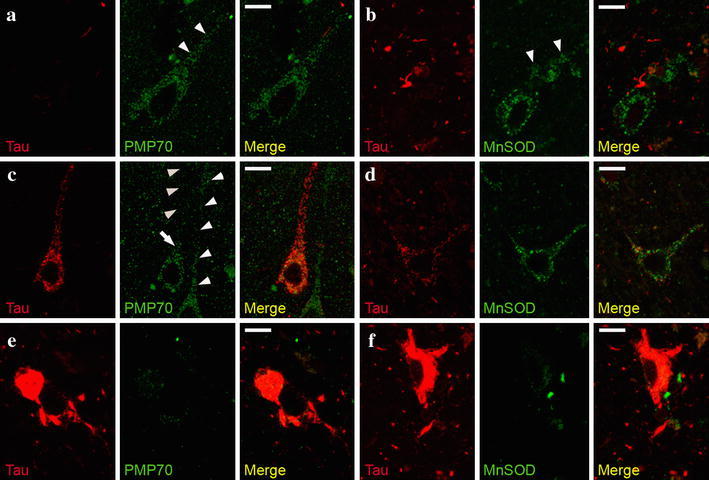
Peroxisomes but not mitochondria are absent from neuronal processes featuring pre-tangles. Representative images of confocal double-immunofluorescence using AT8 antibody to detect phospho-tau (pre-tangle marker) and either PMP70-positive peroxisomes (a, c, e) or SOD2-positive mitochondria (b, d, f) in entorhinal cortex of an AD patient with Braak stage IV. a , b In the absence of phosphorylated tau, numerous peroxisomes (a) and mitochondria (b) are present in the neuronal processes. When phosphorylated tau is present, peroxisomes are only visible in the soma (arrow), but not in the neuronal process (c arrowheads pointing upwards), but normal amounts of mitochondria are present (d). Note the abundance of peroxisomes in a neighboring neuron, in which no phospho-tau is detected (c arrowheads pointing downwards). e, f In neurons filled with NFT, no peroxisomes and only sporadic mitochondria were detected in the soma. Size bar 10 μm
Discussion
Previous reports on reduced levels of plasmalogens in gray and white matter of AD brain led us to hypothesize that impaired peroxisomal functions contribute to the progression of AD. Here, we demonstrate that in addition to plasmalogens, other peroxisomal parameters such as peroxisomal density in neurons and concentration of VLCFA are altered in tissues with AD-related pathology. Specifically, we observed a significant increase in C22:0, C24:0 and C26:0 in gyrus frontalis of AD patients. These changes were also found in various other brain areas from individuals with neuropathologically proven AD, except in samples of the parasubiculum. The interpretation of this observation merits caution, however; one possible reason could be that the cytoarchitecture of the parasubiculum is different. Particularly there are smaller neurons and cell-free areas as compared to the trans-entorhinal, frontal, or precentral cortex, and a smaller amount of neurons than present in the cerebellar cortex. Interestingly, cerebellum does not show neurofibrillary degeneration; thus, alterations observed in this region suggest that elevated VLCFA may either be independent of pathological tau processing, or a regional difference in metabolic pathways contribute to the elevation. As VLCFA concentrations are normally higher in white than in gray matter, the observed elevation of VLCFA might have been due to differing extent of myelin in our brain specimens. However, the amount of MBP, which was determined as a measure of myelin in all samples, was not significantly altered during AD progression. Thus, the possibility that the observed increase in VLCFA levels was caused by variable amounts of myelin could be excluded.
The observed accumulation of VLCFA could result from either reduced peroxisomal β-oxidation or enhanced fatty acid elongation. In tissues of patients with the peroxisomal disorder X-linked adrenoleukodystrophy (X-ALD), both metabolic pathways contribute to the accumulation of VLCFA [22]. Although peroxisomal β-oxidation of C22:0, C24:0 and C26:0 is defective in X-ALD, only C24:0 and C26:0 accumulate. Thus, it has been argued that C22:0 fails to accumulate because it is a better substrate for the activated elongation system. In contrast to X-ALD, in the AD brains we found elevated levels of both C22:0 and VLCFA (C24:0 and C26:0), suggesting that in AD impaired peroxisomal degradation of VLCFA rather than increased elongation accounts for the accumulation. To our knowledge, this is the first report on changes of VLCFA or C22:0 levels in AD tissue. This finding provides another important piece of knowledge about the complex lipid alterations observed in brain regions still showing modest progression of AD-related neuropathology.
Our finding of reduced amounts of plasmalogens is in good agreement with previous results [15, 18, 19, 34]. In myelin, the sn-2 position of plasmalogens (Fig. 2a) predominantly contains unsaturated or monounsaturated fatty acids, whereas in neurons PUFAs such as DHA and arachidonic acid dominate. Thus, it is of particular interest that in a mildly affected region, gyrus frontalis, of late stage AD, mainly plasmalogen species that carry PUFAs at the sn-2 position were reduced. This points to a neuronal (or possibly astrocytic or microglial) impairment rather than a myelin-based effect.
Notably, in addition to alterations in VLCFA and plasmalogens, we observed an increased number of neurons containing a higher somatic volume density of peroxisomes in gyrus frontalis with increasing Braak score. The setup of our study allowed us to correlate our biochemical and histological findings to different groups of AD severity, through the neuropathological staging of the contralateral brain hemisphere. Although amyloid β plaques represent a hallmark of AD, NFT pathology is widely considered to correlate better with disease progression [2, 8]. Accordingly, we observed that all peroxisomal abnormalities (increase in VLCFA and somatic peroxisomal volume density and decrease in plasmalogens) were significantly better correlated with the appearance of NFT than with neuritic plaques also quantified in the immediately adjacent cortical regions.
Previous observations in cultured neurons demonstrated that overexpression of tau inhibits kinesin-dependent transport of peroxisomes in neurites [28, 38]. We hypothesized that the increase in somatic peroxisome density results from abnormally phosphorylated tau impairing peroxisome trafficking. By confocal laser microscopy, we demonstrated a considerably reduced number of peroxisomes in neuronal processes that contained phosphorylated tau in pre-tangles (Fig. 4). In contrast, the number of mitochondria appeared to be nearly unchanged in the same processes. However, both peroxisomes and mitochondria almost completely disappeared in neuronal processes with fully developed NFT. Thus, the increase in peroxisomal volume density in neuronal somata might indeed represent an early event in pre-tangle formation. It has also been reported that peroxisomal proliferation enhances oxidative stress [35]. Thus, the higher abundance of peroxisomes could elevate the oxidative burden, in turn causing a generalized reduction in the import and metabolic activities of peroxisomal matrix proteins and eventually inducing changes in lipid metabolism and lipid-related second messenger signaling.
The patient collective of the VITA study offered a rare opportunity to follow progression of AD-related neuropathological alterations in the context of biochemical and histological parameters of peroxisomes in a homogenous and exceptionally age-matched cohort. At 75 years of age, all participants of the VITA study, which had been recruited from two districts of Vienna, were free of clinical signs of dementia; 6–7 years later, in 10 of these subjects, severe AD-related neuropathological findings (corresponding to Braak stage V–VI) were detected upon autopsy. Although statistical significance was not reached, the mean level of VLCFA in the cerebellar cortex, not affected by amyloid plaques, pre-tangles or neurofibrillary tangle pathology, and serving as a control tissue in our study, was found to be increased by 36.6% when compared with the control group (Braak stage I–II). In line with our observations, recent reports show reduced levels of plasmalogens in the serum of AD patients [16], which might even qualify as a predictive marker [42]. Thus, both the increase in VLCFA in cerebellar cortex and the decreased plasmalogen levels in serum of patients support the hypothesis of a systemic age-dependent reduction in peroxisomal functions. Among the 79 investigated postmortem brain samples of 81–82-year-old subjects, none were entirely free of neuropathological findings, such as NFT or plaques, probably reflecting that neuronal oxidative stress increases in all aging brains. Reduced peroxisomal functions may enhance progression of pre-tangle formation and further accelerate pathological processes including mitochondrial damage, alterations in the endosomal–lysosomal system, ER-stress and finally neuronal death.
Restoration of the moderately reduced levels of plasmalogens by dietary supplementation could well have beneficial effects and should be considered. However, additional studies focused on the neuropathological influence of plasmalogen deficiency on AD pathology in model systems are required. The observed peroxisomal alterations in AD add an important contribution to our knowledge of complex mechanisms modulating AD pathology.
Electronic supplementary material
Below is the link to the electronic supplementary material.
Acknowledgments
This work was supported by the European Union project “Peroxisome” LSHG-CT-2004-512018 and the Austrian Science Fund (FWF) project P21950-B20.
Open Access
This article is distributed under the terms of the Creative Commons Attribution Noncommercial License which permits any noncommercial use, distribution, and reproduction in any medium, provided the original author(s) and source are credited.
References
- 1.Antonenkov VD, Grunau S, Ohlmeier S, Hiltunen JK. Peroxisomes are oxidative organelles. Antioxid Redox Signal. 2010;13:525–537. doi: 10.1089/ars.2009.2996. [DOI] [PubMed] [Google Scholar]
- 2.Arriagada PV, Growdon JH, Hedley-Whyte ET, Hyman BT. Neurofibrillary tangles but not senile plaques parallel duration and severity of Alzheimer’s disease. Neurology. 1992;42:631–639. doi: 10.1212/wnl.42.3.631. [DOI] [PubMed] [Google Scholar]
- 3.Barberger-Gateau P, Letenneur L, Deschamps V, et al. Fish, meat, and risk of dementia: cohort study. BMJ. 2002;325:932–933. doi: 10.1136/bmj.325.7370.932. [DOI] [PMC free article] [PubMed] [Google Scholar]
- 4.Bertram L, McQueen MB, Mullin K, Blacker D, Tanzi RE. Systematic meta-analyses of Alzheimer disease genetic association studies: the AlzGene database. Nat Genet. 2007;39:17–23. doi: 10.1038/ng1934. [DOI] [PubMed] [Google Scholar]
- 5.Bligh EG, Dyer WJ. A rapid method of total lipid extraction and purification. Can J Biochem Physiol. 1959;37:911–917. doi: 10.1139/o59-099. [DOI] [PubMed] [Google Scholar]
- 6.Bonekamp NA, Volkl A, Fahimi HD, Schrader M. Reactive oxygen species and peroxisomes: struggling for balance. Biofactors. 2009;35:346–355. doi: 10.1002/biof.48. [DOI] [PubMed] [Google Scholar]
- 7.Braak H, Alafuzoff I, Arzberger T, Kretzschmar H, Del Tredici K. Staging of Alzheimer disease-associated neurofibrillary pathology using paraffin sections and immunocytochemistry. Acta Neuropathol. 2006;112:389–404. doi: 10.1007/s00401-006-0127-z. [DOI] [PMC free article] [PubMed] [Google Scholar]
- 8.Braak H, Braak E. Neuropathological staging of Alzheimer-related changes. Acta Neuropathol. 1991;82:239–259. doi: 10.1007/BF00308809. [DOI] [PubMed] [Google Scholar]
- 9.Braak H, Del Tredici K. The pathological process underlying Alzheimer’s disease in individuals under thirty. Acta Neuropathol. 2011;121:171–181. doi: 10.1007/s00401-010-0789-4. [DOI] [PubMed] [Google Scholar]
- 10.Calon F, Lim GP, Yang F, et al. Docosahexaenoic acid protects from dendritic pathology in an Alzheimer’s disease mouse model. Neuron. 2004;43:633–645. doi: 10.1016/j.neuron.2004.08.013. [DOI] [PMC free article] [PubMed] [Google Scholar]
- 11.Cimini A, Moreno S, D’Amelio M, et al. Early biochemical and morphological modifications in the brain of a transgenic mouse model of Alzheimer’s disease: a role for peroxisomes. J Alzheimers Dis. 2009;18:935–952. doi: 10.3233/JAD-2009-1199. [DOI] [PubMed] [Google Scholar]
- 12.Conquer JA, Tierney MC, Zecevic J, Bettger WJ, Fisher RH. Fatty acid analysis of blood plasma of patients with Alzheimer’s disease, other types of dementia, and cognitive impairment. Lipids. 2000;35:1305–1312. doi: 10.1007/s11745-000-0646-3. [DOI] [PubMed] [Google Scholar]
- 13.Dacremont G, Vincent G. Assay of plasmalogens and polyunsaturated fatty acids (PUFA) in erythrocytes and fibroblasts. J Inherit Metab Dis. 1995;18(Suppl 1):84–89. doi: 10.1007/BF00711431. [DOI] [PubMed] [Google Scholar]
- 14.Fischer P, Jungwirth S, Krampla W, et al. Vienna Transdanube Aging “VITA”: study design, recruitment strategies and level of participation. J Neural Transm Suppl. 2002;62:105–116. doi: 10.1007/978-3-7091-6139-5_11. [DOI] [PubMed] [Google Scholar]
- 15.Ginsberg L, Rafique S, Xuereb JH, Rapoport SI, Gershfeld NL. Disease and anatomic specificity of ethanolamine plasmalogen deficiency in Alzheimer’s disease brain. Brain Res. 1995;698:223–226. doi: 10.1016/0006-8993(95)00931-F. [DOI] [PubMed] [Google Scholar]
- 16.Goodenowe DB, Cook LL, Liu J, et al. Peripheral ethanolamine plasmalogen deficiency: a logical causative factor in Alzheimer’s disease and dementia. J Lipid Res. 2007;48:2485–2498. doi: 10.1194/jlr.P700023-JLR200. [DOI] [PubMed] [Google Scholar]
- 17.Han X. Lipid alterations in the earliest clinically recognizable stage of Alzheimer’s disease: implication of the role of lipids in the pathogenesis of Alzheimer’s disease. Curr Alzheimer Res. 2005;2:65–77. doi: 10.2174/1567205052772786. [DOI] [PubMed] [Google Scholar]
- 18.Han X. Multi-dimensional mass spectrometry-based shotgun lipidomics and the altered lipids at the mild cognitive impairment stage of Alzheimer’s disease. Biochim Biophys Acta. 2010;1801:774–783. doi: 10.1016/j.bbalip.2010.01.010. [DOI] [PMC free article] [PubMed] [Google Scholar]
- 19.Han X, Holtzman DM, McKeel DW., Jr Plasmalogen deficiency in early Alzheimer’s disease subjects and in animal models: molecular characterization using electrospray ionization mass spectrometry. J Neurochem. 2001;77:1168–1180. doi: 10.1046/j.1471-4159.2001.00332.x. [DOI] [PubMed] [Google Scholar]
- 20.Kalmijn S, Launer LJ, Ott A, et al. Dietary fat intake and the risk of incident dementia in the Rotterdam Study. Ann Neurol. 1997;42:776–782. doi: 10.1002/ana.410420514. [DOI] [PubMed] [Google Scholar]
- 21.Kamholz J, Deferra F, Puckett C, Lazzarini RA. Identification of 3 forms of human myelin basic-protein by cDNA cloning. Proc Natl Acad Sci USA. 1986;83:4962–4966. doi: 10.1073/pnas.83.13.4962. [DOI] [PMC free article] [PubMed] [Google Scholar]
- 22.Kemp S, Wanders R. Biochemical aspects of X-linked adrenoleukodystrophy. Brain Pathol. 2010;20:831–837. doi: 10.1111/j.1750-3639.2010.00391.x. [DOI] [PMC free article] [PubMed] [Google Scholar]
- 23.Kovacs GG, Gelpi E, Ströbel T, et al. Involvement of the endosomal–lysosomal system correlates with regional pathology in Creutzfeldt–Jakob disease. J Neuropathol Exp Neurol. 2007;66:628–636. doi: 10.1097/nen.0b013e318093ecc7. [DOI] [PubMed] [Google Scholar]
- 24.Kuczynski B, Reo NV. Evidence that plasmalogen is protective against oxidative stress in the rat brain. Neurochem Res. 2006;31:639–656. doi: 10.1007/s11064-006-9061-7. [DOI] [PubMed] [Google Scholar]
- 25.Laemmli UK. Cleavage of structural proteins during the assembly of the head of bacteriophage T4. Nature. 1970;227:680–685. doi: 10.1038/227680a0. [DOI] [PubMed] [Google Scholar]
- 26.Lin MT, Beal MF. Mitochondrial dysfunction and oxidative stress in neurodegenerative diseases. Nature. 2006;443:787–795. doi: 10.1038/nature05292. [DOI] [PubMed] [Google Scholar]
- 27.Lorizate M, Brugger B, Akiyama H, et al. Probing HIV-1 membrane liquid order by Laurdan staining reveals producer cell-dependent differences. J Biol Chem. 2009;284:22238–22247. doi: 10.1074/jbc.M109.029256. [DOI] [PMC free article] [PubMed] [Google Scholar]
- 28.Mandelkow EM, Stamer K, Vogel R, Thies E, Mandelkow E. Clogging of axons by tau, inhibition of axonal traffic and starvation of synapses. Neurobiol Aging. 2003;24:1079–1085. doi: 10.1016/j.neurobiolaging.2003.04.007. [DOI] [PubMed] [Google Scholar]
- 29.Martin F, Corrigan FM, Donard OF, et al. Organotin compounds in trimethyltin-treated rats and in human brain in Alzheimer’s disease. Hum Exp Toxicol. 1997;16:512–515. doi: 10.1177/096032719701600906. [DOI] [PubMed] [Google Scholar]
- 30.Martinez M. Abnormal profiles of polyunsaturated fatty acids in the brain, liver, kidney and retina of patients with peroxisomal disorders. Brain Res. 1992;583:171–182. doi: 10.1016/S0006-8993(10)80021-6. [DOI] [PubMed] [Google Scholar]
- 31.Morris MC, Evans DA, Bienias JL, et al. Consumption of fish and n-3 fatty acids and risk of incident Alzheimer disease. Arch Neurol. 2003;60:940–946. doi: 10.1001/archneur.60.7.940. [DOI] [PubMed] [Google Scholar]
- 32.Nixon RA, Cataldo AM, Mathews PM. The endosomal–lysosomal system of neurons in Alzheimer’s disease pathogenesis: a review. Neurochem Res. 2000;25:1161–1172. doi: 10.1023/A:1007675508413. [DOI] [PubMed] [Google Scholar]
- 33.Nye SH, Pelfrey CM, Burkwit JJ, Voskuhl RR, Lenardo MJ, Mueller JP. Purification of immunologically active recombinant 21.5 kDa isoform of human myelin basic protein. Mol Immunol. 1995;32:1131–1141. doi: 10.1016/0161-5890(95)00066-6. [DOI] [PubMed] [Google Scholar]
- 34.Pettegrew JW, Panchalingam K, Hamilton RL, McClure RJ. Brain membrane phospholipid alterations in Alzheimer’s disease. Neurochem Res. 2001;26:771–782. doi: 10.1023/A:1011603916962. [DOI] [PubMed] [Google Scholar]
- 35.Reddy JK, Rao MS. Oxidative DNA damage caused by persistent peroxisome proliferation: its role in hepatocarcinogenesis. Mutat Res. 1989;214:63–68. doi: 10.1016/0027-5107(89)90198-x. [DOI] [PubMed] [Google Scholar]
- 36.Schrader M, Fahimi HD. Peroxisomes and oxidative stress. Biochim Biophys Acta. 2006;1763:1755–1766. doi: 10.1016/j.bbamcr.2006.09.006. [DOI] [PubMed] [Google Scholar]
- 37.Schriner SE, Linford NJ, Martin GM, et al. Extension of murine life span by overexpression of catalase targeted to mitochondria. Science. 2005;308:1909–1911. doi: 10.1126/science.1106653. [DOI] [PubMed] [Google Scholar]
- 38.Stamer K, Vogel R, Thies E, Mandelkow E, Mandelkow EM. Tau blocks traffic of organelles, neurofilaments, and APP vesicles in neurons and enhances oxidative stress. J Cell Biol. 2002;156:1051–1063. doi: 10.1083/jcb.200108057. [DOI] [PMC free article] [PubMed] [Google Scholar]
- 39.Strittmatter WJ, Saunders AM, Schmechel D, et al. Apolipoprotein E: high-avidity binding to beta-amyloid and increased frequency of type 4 allele in late-onset familial Alzheimer disease. Proc Natl Acad Sci USA. 1993;90:1977–1981. doi: 10.1073/pnas.90.5.1977. [DOI] [PMC free article] [PubMed] [Google Scholar]
- 40.Vreken P, van Lint AE, Bootsma AH, et al. Rapid stable isotope dilution analysis of very-long-chain fatty acids, pristanic acid and phytanic acid using gas chromatography–electron impact mass spectrometry. J Chromatogr B Biomed Sci Appl. 1998;713:281–287. doi: 10.1016/S0378-4347(98)00186-8. [DOI] [PubMed] [Google Scholar]
- 41.Wanders RJ, Waterham HR. Biochemistry of mammalian peroxisomes revisited. Annu Rev Biochem. 2006;75:295–332. doi: 10.1146/annurev.biochem.74.082803.133329. [DOI] [PubMed] [Google Scholar]
- 42.Wood PL, Mankidy R, Ritchie S, et al. Circulating plasmalogen levels and Alzheimer Disease Assessment Scale-Cognitive scores in Alzheimer patients. J Psychiatry Neurosci. 2010;35:59–62. doi: 10.1503/jpn.090059. [DOI] [PMC free article] [PubMed] [Google Scholar]
Associated Data
This section collects any data citations, data availability statements, or supplementary materials included in this article.