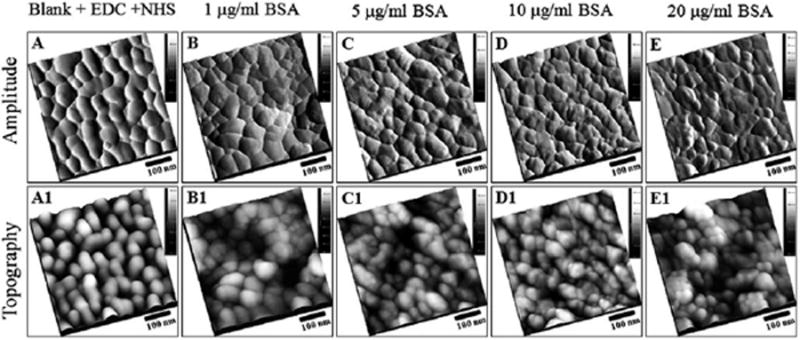
Fig. 5.

Tapping mode-AFM topographs and amplitude images showing the exterior of the NHS functionalized nanoporous gold surfaces after conjugation of BSA. Top panels represent the amplitude images; lower panels represent the topographic images of the same areas as in top panels. (A) 500 nm × 500 nm, NHS ester functionalized gold surface without exposure to BSA. Similarly, 500 nm × 500 nm, AFM topographic images of NHS ester functionalized gold surface after exposure to BSA (4 ml of BSA, PBS buffer pH 7.0, 24 h incubation at 4 °C), at (B) 1 μg ml−1, (C) 5 μg ml−1, (D) 10 μg ml−1 and (E) 20 μg ml−1.
