Abstract
Previous studies have demonstrated that Polarization Sensitive Optical Coherence Tomography (PS-OCT) can be used to image the remineralization of early artificial caries lesions. However, the depth resolution of the imaging system employed in those previous studies was limited and the outer surface structure of the lesions were not resolved as clearly as desired. The purpose of this study was to repeat the earlier remineralization study using a broadband light-source of higher resolution to determine if there can be improved resolution of the remineralized surface zones of the lesions. An all polarization-maintaining fiber based PS-OCT system operating at 1310-nm was used to acquire polarization resolved images of bovine enamel surfaces exposed to a demineralizing solution at pH-4.9 followed by a fluoride containing remineralizing solution at pH-7.0 containing 2-ppm fluoride. The structure of the surface zones could be clearly resolved using PS-OCT in the samples that underwent remineralization. The PS-OCT measurements indicated a significant (p<0.05) reduction in the integrated reflectivity between the severity of the lesions that were exposed to the remineralization solution and those that were not. The lesion depth and mineral loss were also measured with polarized light microscopy and transverse microradiography after sectioning the enamel blocks. These results show that PS-OCT can be used to non-destructively monitor the remineralization potential of anti-caries agents.
Keywords: near-IR, optical coherence tomography, dental enamel, dental caries, polarization, microradiography, remineralization
1. INTRODUCTION
Previous studies in our laboratory have demonstrated that PS-OCT can be used successfully to measure the formation of a surface zone of increased mineral content after exposure of artificial enamel lesions to a remineralizing solution 1–3. The growth of such a surface zone suggests that the lesion has undergone remineralization and repair and the existence of an intact zone of high mineral content can be considered an indication that the lesion has become “arrested” and is no longer an active progressing lesion.
If carious lesions are detected early enough, it is likely that they can be arrested/reversed by non-surgical means through fluoride therapy, anti-bacterial therapy, dietary changes, or by low intensity laser irradiation4,5. Therefore, one cannot overstate the importance of detecting the decay in the early stage of development at which point non-invasive preventive measures can be taken to halt further decay and new technologies for the assessment of surface demineralization for clinical trials need to be validated for the most prevalent lesion types, such as pre-cavitated lesions on proximal and occlusal surfaces, root caries and secondary caries around restorations.
Accurate determination of the degree of lesion activity and severity is of paramount importance for the effective employment of the treatment strategies mentioned above. Since optical diagnostic tools exploit changes in the light scattering of the lesion they have great potential for the diagnosis of the current “state of the lesion”, i.e., whether or not the caries lesion is active and expanding or whether the lesion has been arrested and is undergoing remineralization. Therefore, new technologies must be able to determine whether active caries lesions have been partially remineralized and have become arrested. PS-OCT is uniquely capable of this task since it provides a measure of the reflectivity from each layer of the lesion and is able to show the formation of a zone of increased mineral density and reduced light scattering due to remineralization. This is a very important distinction between PS-OCT and other optical caries detection methods, such as the Diagnodent and QLF, that only provide a single measure of lesion severity representing fluorescence loss or gain from the lesion and are not capable of resolving the internal lesion structure. Although, recent efforts in QLF development have focused on using other means to show the presence of a surface zone which involve hydration/dehydration of the lesion during image acquisition, it is more advantageous to be able to acquire in depth images of the lesion structure 6. Such data is also valuable for caries management by risk assessment in the patient and for determining the appropriate form of intervention. A non-destructive, quantitative method of monitoring demineralization and remineralization “in vivo” with high sensitivity would be invaluable for use in short term clinical trials for various anti-caries agents such as fluoride dentifrices and antimicrobials.
In previous studies we investigated the remineralization of smooth enamel surfaces employing two caries models. The first model involved pH cycling to produce lesions with a well-defined surface zone of intact enamel1 while the 2nd model used a different demineralization model to produce a surface softened lesion 3. Both models showed markedly different outcomes after exposure to the remineralization solution. Studies have shown that remineralization requires the presence of residual partially dissolved crystals to serve as a template for growth 7. Furthermore, remineralization has been observed to proceed from the outside of the lesion towards the lesion body, therefore as the remineralization takes place in the surface zone of the lesion the diffusion pathways to the lesion body are blocked thus preventing further remineralization of the lesion body. However, the lesion does become arrested since further dissolution in the lesion body is also blocked. This is typically how lesions are arrested naturally. We observed that the surface softened lesion model yields the greatest change in mineral content upon remineralization since it does not contain a well-defined surface layer that inhibits diffusion 7.
PS-OCT images of a surface softened lesion before and after remineralization have shown that there was significant growth in the thickness of a layer of remineralized enamel along with a concomitant decrease in the integrated reflectivity 3. The surface layer thickness increased significantly from 10 ± 4 μm for the lesion before remineralization to 33± 5 μm after remineralization, p < 0.05, n=10. The mean integrated reflectivity of the lesion, ΔR(dB × μm), also decreased markedly from 114(31) to 79(33), p < 0.053.
Artificial lesions produced using pH cycling (1st model), maintain a well-defined surface layer and responded differently to exposure to the remineralization solution. Those lesions did not exhibit increased growth of the existing surface-layer thickness and showed the formation of another layer of highly reflective (high scattering) apatite mineral above the existing lesion surface1. These preliminary results regarding remineralization clearly demonstrate that PS-OCT can be used to directly measure structural changes in artificial caries lesions due to remineralization. Moreover, due to the structural complexity of caries lesions and the resulting optical changes that result upon remineralization, it is probably not sufficient to simply measure an overall change in reflectivity of the lesion (or fluorescence loss that has been done with QLF), it is advantageous to measure depth resolved images of the lesion structure as well to show repair of the lesion surface zone and this can be accomplished using PS-OCT.
The preliminary results employing PS-OCT regarding artificial remineralization using well-established models are very intriguing, manifesting an unexpected level of complexity depending on the nature of the artificial lesion undergoing remineralization. The purpose of this study was to repeat an earlier remineralization study (surface softened model) employing a light-source of higher resolution to determine if there was improved resolution of the important surface zones of increased mineral density due to lesion repair and remineralization.
2. MATERIALS AND METHODS
Sample Preparation
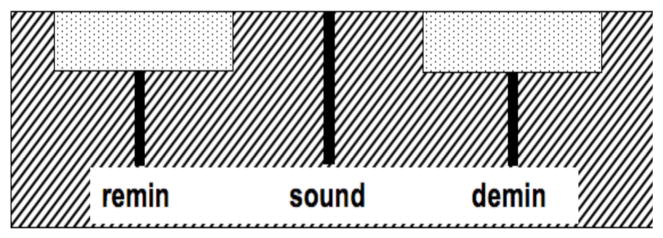
Twenty enamel blocks, 5 × 2 × 2 mm3, of bovine enamel were prepared from extracted bovine incisors acquired from a slaughterhouse. The samples had a layer of enamel approximately 2-mm thick over a layer of dentin. Surfaces were serially polished with 12, 9 and 3 μm embedded diamond polishing discs. Each block was partitioned into three sections as shown in Fig. 1. The center section of the sample was covered with a thin layer of acid resistant varnish, red nail polish, (Revlon, New York, New York) to cover the sound enamel control area for protection before submersion in the demineralization solution. This area served as the negative control group, sound (S) group. The samples were cemented to delrin blocks and the sample sides were varnished to isolate the enamel surface. The surface softening model that produces lesions characteristic of early stages of an active caries lesions was employed 8. In this model surface softening (demineralization) occurs in depth without the erosion of the surface. Each sample was placed in the demineralization solution for 9 days which consisted of a 40-mL aliquot of acetate buffer solution containing 2.0 mmol/L calcium, 2.0 mmol/L phosphate, and 0.075 mol/L acetate maintained at pH 4.9 and a temperature of 37°C. The demineralization solution is designed to produce lesions to a depth of approximately 100-μm on exposed enamel smooth surfaces in that time period of exposure. For remineralization of artificial or existing natural lesions, teeth were immersed in a solution of 1.5 mmol/L calcium, 0.9 mmol/L phosphate, 150 mmol/L KCl, 20 mmol/L cacodylate buffer maintained at pH 7.0 and 37°C for 20 days. Fluoride, as NaF, was added at the level of 2 ppm F to enhance remineralization 9.
Fig. 1.
Layout of the exposed areas on the surface of the bovine blocks. Sound areas were protected with acid-resistant varnish. The lines represent the positions of the PS-OCT b-scans
PS-OCT System
An all fiber-based Optical Coherence Domain Reflectometry (OCDR) system with polarization maintaining (pm) optical fiber, high speed piezoelectric fiber-stretchers and two balanced InGaAs receivers that was designed and fabricated by Optiphase, Inc., Van Nuys, CA was integrated with a broadband high power superluminescent diode (SLD) DL-CS3159A, (Denselight, Singapore) and a high-speed XY-scanning system (ESP 300 controller & 850G-HS stages, National Instruments, Austin, TX) and used for in vitro optical tomography. This system is based on a polarization-sensitive Michelson white light interferometer. The polarized SLD source operating at a center wavelength of 1310 nm with a spectral bandwidth FWHM of 81 nm was aligned using a polarization controller to deliver 15-mW into the slow axis of the polarization maintaining (pm) fiber of the source arm of the interferometer. This light was split into the reference and sample arms of the Michelson interferometer by a 50/50 pm-fiber coupler. The 81-nm bandwidth source provides a coherence length or an axial (depth) resolution of 9-μm in air and 6-μm in dental enamel. The sample arm was coupled to an AR coated fiber-collimator to produce a 3-mm in diameter collimated beam. That beam was focused onto the sample surface using a 15-mm focal length AR coated plano-convex lens. This configuration provided a lateral resolution of approximately 20 μm with a signal to noise ratio of greater than 40–50 dB. Both orthogonal polarization states of the light scattered from the tissue are coupled into the slow and fast axes of the pm- fiber of the sample arm. A quarter wave plate set at 22.5° to horizontal in the reference arm rotated the polarization of the light by 45° upon reflection. After being reflected from the reference mirror and the sample, the sample and reference beams are recombined by the pm fiber-coupler. A polarizing cube splits the recombined beam into its horizontal and vertical polarization components or “slow” and “fast” axis components, which were then coupled by single mode fiber optics into two detectors. The light from the reference arm was polarized at 45° and therefore split evenly between the two detectors. Readings of the electronically demodulated signal from each receiver channel represent the intensity for each orthogonal polarization of the backscattered light. Neutral density filters are added to the reference arm to reduce the intensity noise for shot limited detection. The all-fiber OCDR system is described in more detail in reference10. The PS-OCT system is completely controlled using Labview™ software (National Instruments, Austin, TX).
Polarized Light Microscopy (PLM) and Digital Traverse Microradiography (TMR)
After the PS-OCT scanning, the bovine enamel samples were cut into sections ~200-μm thick for polarized light examination (PLM) and digital transverse microradiography (TMR) using a Isomet 5000 saw, (Buehler, Lake Bluff, IL). The thickness of each section was measured with a digital micrometer with 1-μm resolution. Ideally, thin sections of 80–100-μm thickness should be used for both PLM and TMR, and thinner sections are more desirable for comparison with the PS-OCT scans with a lateral resolution of 20–25-μm. However, enamel is very brittle and difficult to cut into thin sections without fracture, more so for demineralized lesion areas, and attempts to produce such thin sections results in unacceptable high loss rates of samples/sections, therefore we choose a more reliable section thickness of 200–μm. Even with the choice of thicker sections the sample loss was still high and we applied a thin layer of cyanoacrylate adhesive to each block before cutting to help preserve the lesions. Polarized light microscopy was carried out using a Scientific Series 7 optical microscope (Westover Scientific, Mill Creek, WA) with an integrated digital camera, Canon EOS Digital Rebel XT (Canon Inc., Tokyo, Japan). Thin sections were imbibed in water and examined in the brightfield mode with crossed polarizers and a red I plate with 500-nm retardation. Demineralization due to strong scattering causes loss of birefringence in the lesion and it appears dark. A custom-built digital tranverse microradiography (TMR) system was used to measure mineral loss in the natural caries lesions. High-resolution microradiographs were taken using Cu Ka radiation from a Philips 3100 x-ray generator and a Photonics Science FDI x-ray digital imager (Microphotonics, Allentown, PA). The x-ray digital imager consists of a 1392×1040 pixel interline CCD directly bonded to a coherent micro fiber-optic coupler that transfers the light from an optimized gadolinium oxysulphide scintillator to the CCD sensor. The image size is 2.99 × 2.24 mm with a pixel resolution of 2.15-μm. A high-speed motion control system with Newport UTM150 and 850G stages and an ESP300 controller coupled to a video microscopy and laser targeting system was used for precise positioning of the tooth samples in the field of view of the imaging system.
Integrated Reflectivity and Quantitative Mineral Loss Profiles
Three line-profiles or a-scans were taken from each PS-OCT perpendicular (⊥ - axis) b-scan as indicated in Fig. 1 using the same procedure applied in reference 11. Each line-profile from the OCT scans was integrated over a distance from the tooth surface to a depth of 200-μm to yield the integrated reflectivity in units of (dB×μm) that we have called ΔR for comparison with the relative mineral loss, ΔZ described below. This 200-μm is a real depth, not an optical depth, calculated by dividing the optical path length/optical depth of each PS-OCT a-scan by the refractive index of enamel, namely 1.6. The lesion depth was calculated by taking the point in the lesion where the intensity in the decreased to a value of (1/e2) from the peak intensity in the lesion.
A similar procedure was carried out for the TMR images. The best intact 200-μm thick section through the lesions on each block was chosen after sectioning to be used for analysis by polarized light microscopy (PLM) and transverse microradiography (TMR). Line-profiles were chosen from each TMR image. The TMR images were converted from 12-bit intensity values representing x-ray attenuation through the thin section, to vol.% mineral using a calibration plot and the section thickness. The line-profiles were integrated to a depth of 200-μm and subtracted from a line profile taken of a sound area from the same tooth to yield the integrated mineral loss or the ΔZ value (vol.% × μm) that is typically used in cariology research that represents the overall severity of the caries lesion. Since there was cavitation in some samples, we substituted 20% mineral for the missing areas. The integrations were performed using Igor Pro software (Wavemetrics, Lake Oswego, OR). Linear regression correlation analysis was performed using InStat (GraphPad Software, San Diego, CA). Significant differences among the six groups was determined using repeated measures analysis of variance (ANOVA) with a Tukey multiple comparisons test using the same Instat software.
3. RESULTS
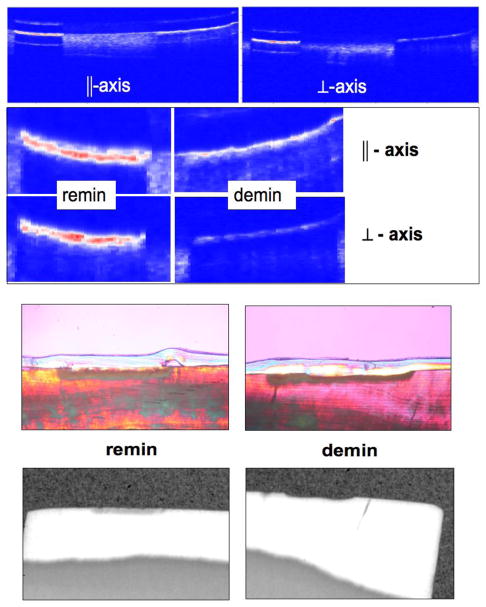
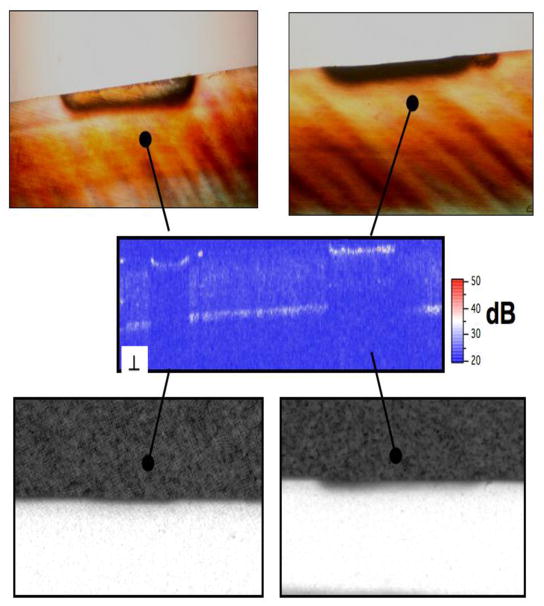
PS-OCT, TMR and PLM images from some of the bovine blocks are shown in Figs. 2–4. The severity of the demin lesions produced and the degree of remineralization varied quite markedly from sample to sample. Some lesions were so severe that there was cavitation (surface no longer intact) while other lesions were quite minor. Some lesions almost completely remineralized while other manifested no observable remineralization. Bovine blocks demineralize faster than the human enamel used in our previous study and cavitation from excessive demineralization was not as great a problem using this the same dissolution model. Figure 2 shows a combination of the OCT, PLM and TMR images for a block with partial remineralization. The two polarization images are shown at the top of the figure and they represent the entire surface of the bovine enamel block. A drop of water was added to the surface of each bovine enamel block to increase optical penetration and suppress the strong surface reflection at the enamel surface on these samples that were polished perfectly flat. The varying water layer thickness produced an apparent curved surface due to the optical delay but produced better images. Greater detail is visible in the expanded images shown just below the remin and demin zones. The demin area does not have a transparent surface zone of higher mineral content while the remin zone has a clear surface zone that is visible in all three image modalities, OCT, PLM and TMR. In Figure 3 the remin zone has remineralized to the point that the lesion is no longer visible in the TMR image. The outer rim of the lesion is still visible in the PS-OCT image and under polarized light. It is interesting that the lesion did not remineralize uniformly across the lesion. Another contrasting example of remineralization was observed on another bovine block in which the remin zone protrudes outwards above the original surface of the block. The TMR image and the expanded OCT images are shown in Fig. 4. The OCT and PLM images show that this outer zone is transparent and the TMR image indicates that the mineral density in the outer transparent zones are similar to sound enamel. The remin zone on the outer surface is not visible in the ⊥ –axis OCT image because it does not depolarize the incident polarized light.
Fig. 2.
PS-OCT b-scans of one sample for both polarizations with demin + remin area on the left side and the demin only area is on the right. The entire scans are should at the very top and the magnified areas are shown just below as indicated. The transparent material visible in the PLM images is cyanoacrylate adhesive. The corresponding PLM and TMR images are shown on the bottom for each area (note they are not of the same scale).
Fig. 4.
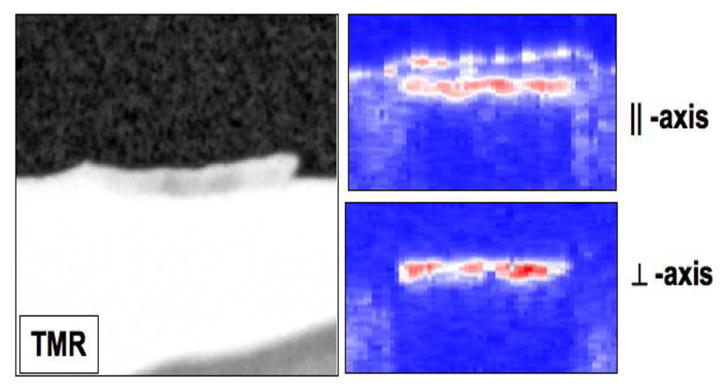
PS-OCT scan of the remin area on one sample with a transparent, high mineral density a “remin” surface zone protruding above the surface. The TMR image is on the two PS-OCT scans at both polarizations are on the right.
Fig. 3.
⊥ - axis PS-OCT b-scan of one of the samples showing the demin + remin area on the left side and the demin only area is on the right. The (top) images are the magnified PLM images of each side. The corresponding TMR images are shown on the bottom.
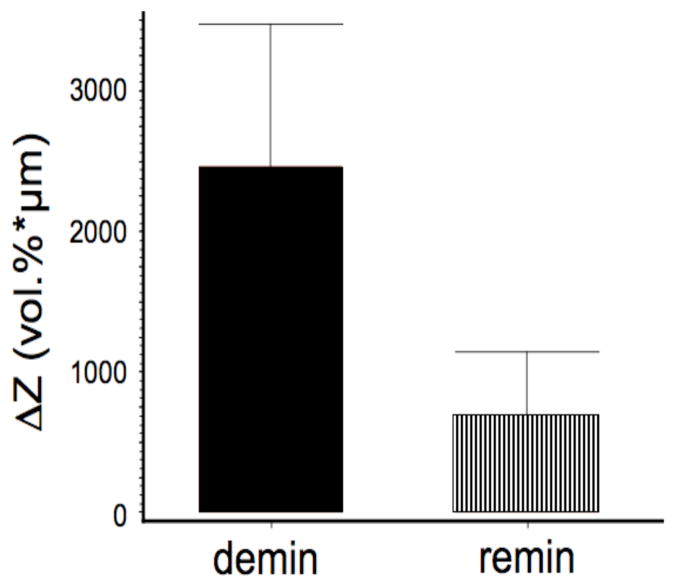
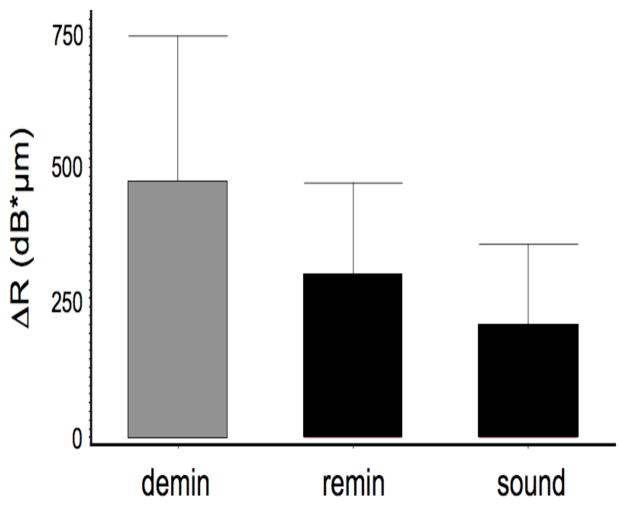
The integrated reflectivity, ΔR (dB × μm), was calculated to a real depth of 200-μm for each of the three locations on each sample—the real depth is the optical depth divided by the 1.6 refractive index for enamel. The mean and standard deviation for each of the three groups is shown in Fig. 4. Repeated measures ANOVA was used with the Tukey multiple comparision test to show that the integrated reflectivity was significantly lower, p < 0.05, between the remin and demin groups. A similar procedure was carried for the TMR images. The integrated mineral loss, ΔZ (vol. % min × μm), is shown in Fig. 6 for the remin and demin groups and there was a significant difference, p < 0.05, between the two groups. Polarized light microscopy showed that the mean depth of the lesions on the demin side was 87±20 μm and on the remin side 78±25 μm. There was no significant difference in the lesion depth, p>0.05, between the remin and demin groups. A semi-transparent remin zone was measurable on 14 of the 17 samples and it was found to have a mean thickness of 39±21 μm.
Fig. 6.
The mean ± s.d. of the integrated mineral loss, ΔZ, calculated from TMR for the remin and demin areas of each block for n=15 samples. The two groups are significantly different (p < 0.05).
4. DISCUSSION
Although there were large variations in the depth and severity of the lesions generated, there were measurable and significant differences between the remin and demin groups. Both TMR (the gold standard) and PS-OCT indicated significant remineralization. The contrast between the remin and demin areas for TMR was greater than for PS-OCT, however it is likely that the mineral loss may have been exaggerated for TMR due to including the cavitated areas into the mineral loss calculation, i.e., assigning 25% mineral to areas where cavitation occurred. There were some exceptional results regarding the nature of the remineralized layer on some of the samples. For example the growth of a transparent remin zone above the sample was observed on one sample. We did observe a layer of apatite growth above the surface applying the pH cycling model1. However, that zone was not transparent indicating the structure was not similar to that of enamel. The higher resolution was valuable for resolving the structure of the zone of remineralization near the surface. We plan on repeating this study with the same high-resolution source but we will use human enamel in which artificial demineralization proceeds at a slower rate pace to avoid any cavitation of the lesions.
Fig. 5.
The mean ± s.d. of the integrated reflectivity, ΔR, calculated from the PS-OCT scans of the three areas of each block for n=15 samples. Bars of the same color are not significantly different (p > 0.05).
Acknowledgments
Supported by NIH/NIDR R01-DE14698 and R01-DE17869. The authors would like to thank Chi Ho for his help with these studies.
References
- 1.Jones RS, Darling CL, Featherstone JDB, Fried D. Remineralization of in vitro Dental Caries Assessed with Polarization Sensitive Optical Coherence Tomography. Journal of Biomedical Optics. 2006;11:014016, 1–9. doi: 10.1117/1.2161192. [DOI] [PubMed] [Google Scholar]
- 2.Jones RS, Fried D. Quantifying the remineralization of artificial caries lesions using PS-OCT. Vol. 6137. SPIE; 2006. p. 613708. [Google Scholar]
- 3.Jones RS, Fried D. Remineralization of Enamel Caries Can Decrease Optical Reflectivity. J Dent Res. 2006;85:804–808. doi: 10.1177/154405910608500905. [DOI] [PMC free article] [PubMed] [Google Scholar]
- 4.NIH. Report No. 18. 2001. Diagnosis and Management of Dental Caries throughout Life. [PubMed] [Google Scholar]
- 5.Featherstone JDB. Prevention and reversal of dental caries:role of low level fluoride. Community Dent Oral Epidemiol. 1999;27:31–40. doi: 10.1111/j.1600-0528.1999.tb01989.x. [DOI] [PubMed] [Google Scholar]
- 6.Veen MH van der, de Jong E de Josselin, Al-Kateeb S. Early detection of Dental caries II. Vol. 4. Indiana University; Indianapolis, IN: 1999. Caries Activity Detection by Dehydration with Qualitative Light Fluorescence; pp. 251–260. [Google Scholar]
- 7.ten Cate JM, Arends J. Remineralization of artificial enamel lesions in vitro. Caries Res. 1977;11:277–86. doi: 10.1159/000260279. [DOI] [PubMed] [Google Scholar]
- 8.Featherstone JDB, Shariati M. Chemical and Histological Changes during Development of Artificial Caries. Caries Res. 1985;19:1–10. doi: 10.1159/000260824. [DOI] [PubMed] [Google Scholar]
- 9.Featherstone JDB, Barrett NA, Conners MG, Shariati M. A pH cycling model for assessing fluoride effects on root caries. J Dent Res. 1989;68:995. [Google Scholar]
- 10.Fried D, Xie J, Shafi S, Featherstone JDB, Breunig T, Lee CQ. Early detection of dental caries and lesion progression with polarization sensitive optical coherence tomography. J Biomed Optics. 2002;7:618–627. doi: 10.1117/1.1509752. [DOI] [PubMed] [Google Scholar]
- 11.Ngaotheppitak P, Darling CL, Fried D, Bush J, Bell S. PS-OCT of occlusal and interproximal caries lesions viewed from occlusal surfaces. Vol. 6137. SPIE; 2006. p. 61370L. [Google Scholar]


