Abstract
New square–pyramidal bis(ene–1,2–dithiolate)MoSe complexes, [MoIVSe(L)2]2−, have been synthesised along with their terminal sulfido analogues, [MoIVS(L)2]2−, using alkyl (LC4H8), phenyl (LPh) and methyl carboxylate (LCOOMe) substituted dithiolene ligands (LR). These complexes now complete three sets of MoIVO, MoIVS and MoIVSe species that are coordinated with identical ene–1,2–dithiolate ligands. The alkyl substituted [Mo(S/Se)(LC4H8)2]2 − complexes were reported in prior investigations (H. Sugimoto, T. Sakurai, H. Miyake, K. Tanaka and H. Tsukube, Inorg. Chem. 2005, 44, 6927, H. Tano, R. Tajima, H. Miyake, S. Itoh and H. Sugimoto, Inorg. Chem. 2008, 47, 7465). The new series of complexes enable a systematic investigation of terminal chalcogenido and supporting ene–1,2–dithiolate ligand effects on geometric structure, electronic structure, and spectroscopic properties. X–ray crystallographic analysis of these (Et4N)2[Mo(E)L2] (E = terminal chalcogenide) complexes reveals an isostructural Mo centre that adopts a distorted square pyramidal geometry. The M≡E bond distances observed in the crystal structures and the ν(M≡E) vibrational frequencies indicate that these bonds are weakened with an increase in L→Mo electron donation (LCOOMe < LPh < LC4H8), and this order is confirmed by an electrochemical study of the complexes. The 77Se NMR resonances in MoSeL complexes appear at lower magnetic fields as the selenido ion became less basic from MoSeLC4H8, MoSeLPh and MoSeLCOOMe. Electronic absorption and resonance Raman spectroscopies have been used to assign key ligand-field, MLCT, LMCT and intraligand CT bands in complexes that possess the LCOOMe ligand. The presence of low-energy intraligand CT transition in these MoELCOOMe compounds directly probes the electron withdrawing nature of the −COOMe substituents, and this underscores the complex electronic structure of square pyramidal bis(ene–1,2–dithiolate)-MoIV complexes that possess extended dithiolene conjugation.
Introduction
Compounds with metal–ligand multiple bonds, M=E or Mo≡E (M = metal and E = element), function as key components of industrial and biological catalysts.1 The recent structural characterisation of some mononuclear pyranopterin molybdenum enzymes has resulted in increased interest in the study of multiply bonded MoO, MoS, and MoSe units in the coordination chemistry of molybdenum.2 A terminal oxo donor, possessing a formal triple bond, is found in many forms of pyranopterin molybdenum enzymes, which include the molybdenum hydroxylases of the xanthine oxidase enzyme family and the molybdenum oxotransferases that belong to the sulfite oxidase and DMSO reductase enzyme families.2 In contrast to these terminal Mo-oxo bonds, a terminal sulfido donor with a reduced Mo-Ssulfido bond order is found oriented cis to the apical oxo ligand in the xanthine oxidase family.3 Also a terminal sulfido donor is included in the reduced formate dehydrogenase of molybdenum enzymes.4 Recently, Dobbek and coworkers showed that a terminal selenide donor is found in place of the terminal sulfido present in xanthine oxidase and nicotinic acid hydroxylase.5 Although a large number of monomeric molybdenum coordination compounds possess terminal oxo ligands, notably fewer that possess terminal sulfido ligands have been prepared and their reactivities and spectroscopic properties explored.6,7 Even fewer studies have examined the geometric and electronic structure of molybdenum complexes that possess terminal selenido coordination due to the difficulty in synthesising MoSe complexes.7,8,9 Additionally, there is a paucity of comparative studies on MoO, MoS and MoSe compounds that have been synthesised using the same or similar supporting ligands. The dearth of such compounds has limited our ability to make detailed geometric-electronic structure correlations as a function of the MoE unit, and this has provided the impetus for the synthesis of new monomeric compounds that possess terminal sulfido and selenido coordination.
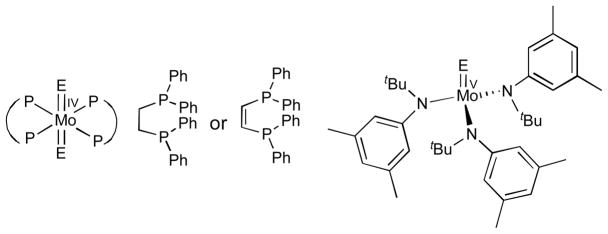
Over a decade ago, Cotton and coworkers synthesised a series of six–coordinate distorted octahedral trans–MoIVE2(P-P)2 complexes (E = O, S, Se, and P-P = 1,2-bis(diphenylphosphino)ethylene or its ethane derivative (Fig. 1)).10 Cummins and coworkers also reported a series of four coordinate distorted tetrahedral MoVE complexes with an identical coligand in MoVE(N(R)Ar)3 (E = O, S, Se; R = C(CD3)2CH3, Ar = 3,5-C6H3Me2) (Fig. 1).11 However, no series of five–coordinate MoO, MoS, and MoSe complexes exist that possess identical supporting ligands. Furthermore, the P-P and N(R)Ar supporting ligands in the earlier studies did not possess electron withdrawing groups (EWGs) or electron donating groups (EDGs) that would allow for a systematic study of substituent effects on the electronic structure, spectroscopy and reactivities of the complexes. A classic series of MoIV/V/VI S complexes, [{HB(R2pz)3}MoS(L)m]n− (hydrotris(3,5-dialkylpyrazol-1-yl)borate, L = mono- or di-dentate ligands), has been prepared by Young and Enemark using sterically demanding tridentate ligands as models for Mo-sulfido centres in pyranopterin molybdenum enzymes.12–17 This series of compounds has allowed for very meaningful systematic investigations of their geometric structures, spectroscopic properties, and reactivities by modifying both the alkyl groups, R, and the mono- and bidentate ligands, L. However, no corresponding MoSe derivatives have been reported to date.
Fig. 1.
Designation and abbreviation of MoE complex structures reported previously (E = O, S, Se). ref. 10,11
Recently, we reported the first series of multiply bonded square pyramidal MoE (E = O, S, Se) complexes possessing an identical supporting ligand, [MoIVE(LC4H8)2]2− (LC4H8 = cyclohexene-1,2-dithiolate).18–20 These complexes make possible detailed investigations regarding the effects of the MoE unit on the structure, spectroscopy and reactivity of the complexes. Regarding the square pyramidal structure, the active sites of reduced (i.e. Mo(IV)) formate dehydrogenase and arsenite oxidase adopt similar square pyramidal bis(pyranopterin-dithiolene)-MoIVS and -MoIVO structures, respectively,4,21 This has stimulated our interest in extending the [MoIV Se(ene-1,2-dithiolate)2]2− family to include the ene-1,2-dithiolates, 1,2-diphenyl-1,2-dithiolate (LPh) and 1,2-dicarbomethoxyethylene-1,2-dithiolate (LCOOMe), allowing us to probe MoE bonding as a function of dithiolene electronic structure.
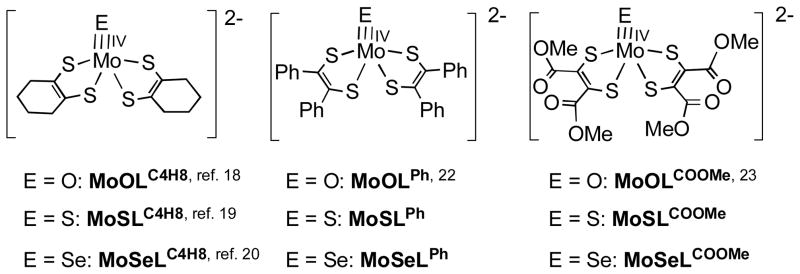
In this manuscript, we describe the synthesis and X-ray structures of (Et4N)2[MoIVS(LPh)2] (MoSLPh), (Et4N)2[MoIVS(LCOOMe)2] (MoSLCOOMe), as well as their selenido derivatives, (Et4N)2[MoIVSe(LPh)2] (MoSeLPh) and (Et4N)2[MoIVSe(LCOOMe)2] (MoSeLCOOMe) (see Fig. 2). These new molecules now complete set of [MoEL2]2− (E = O, S, Se; L = LC4H8, LPh, LCOOMe) compounds that allow the development of detailed electronic and geometric structure correlations as a function of the terminal E ligand, and this provides a means for evaluating the effects of dithiolene substituents on the structure and spectroscopic properties of these compounds. A long these lines, we have performed a detailed electronic absorption, resonance Raman and computational investigation of the MoELCOOMe (E = O, S, Se) series in order to understand the nature of their low energy ligand-field and charge transfer excitations and to develop a basic electronic structure description of the complexes as a function of the apical E donor.
Fig. 2.
Designation and abbreviation of complex structures.
Experimental section
General
All reagents and solvents were used as received unless otherwise noted. All reactions were carried out under a dinitrogen atmosphere using standard Schlenk techniques. Complexes of MoOLC4H8,18 MoSLC4H8,19 MoSeLC4H8,20 MoOLPh,22 MoOLCOOMe,23 [Mo(CO)2(LPh)]24 and (Et4N)[MoIV(OSitBuPh2)(LCOOMe)2] (Mo(OSitBuPh2)LCOOMe)25 were prepared by following established literature procedures.
Synthesis and characterization of complexes
(Et4N)2[MoIVS(LPh)2] (MoSLPh)
To an acetonitrile suspension containing [Mo(CO)2(LPh)2] (46 mg, 0.072 mmol), an acetonitrile suspension containing Na2S (52 mg, 0.67 mmol) was added. After stirring for 3 hours, Et4NCl (24 mg, 0.15 mmol) was added to the suspension. Excess Na2S was removed by filtration and the filtrate was concentrated to dryness. The obtained green solid was dissolved in minimum volume of DMSO and diffusion of ether to the solution gave green-brown crystals of MoSLPh. The crystals were collected by filtration and dried under reduced pressure. Yield 44 mg (70%). Anal. Calcd for C44H60MoN2S5 • DMSO (mol wt. 951.38): C, 58.07; H, 6.99; N, 2.94. Found: C, 57.82; H, 6.65; N; 2.75. 1H NMR (CD3CN): δ 7.24-6.92 (m, 20H), 3.09 (q, 16H), 2.53 (s, 6H), 1.08 (t, 24H). UV-vis spectrum (CH3CN): λmax = 258 (ε = 37000), 321 (29600), 385 (13000), 450 (sh, 4660), 569 (1370), 699 nm (1240 M−1 cm−1). ESI-MS (CH3CN): m/z = 357 [M]2−. CV (0.1 V s−1, CH3CN): E1/2 (rev.) = −0.43 V vs. SCE. IR (KBr): ν 486 (s), 691 (s), 723 (s), 759 (m), 836 (s), 870 (s), 997 (m), 1026 (s), 1077 (w), 1108 (vs), 1236 (vs), 1438 (vs), 1484 (s), 1586 (w), 1707 (s), 1716 cm−1 (s).
(Et4N)2[MoIVSe(LPh)2] (MoSeLPh)
This complex was synthesised using the same procedure as MoSLPh, except Na2Se (27 mg, 0.22 mmol) was used instead of Na2S. Recrystallization from DMSO/ether gave a microcrystalline powder, which was collected by filtration and dried in dinitrogen. Yield: 24 mg (34%). Anal. Calcd for C44H60MoN2S4Se • DMSO (mol wt. 998.25): C, 55.35; H, 6.66; N, 2.81. Found: C, 55.38; H, 6.65; N; 2.96. 1H NMR (CD3CN): δ 7.24-6.91 (m, 20H) 3.09 (q, 16H), 2.53 (s, 6H), 1.08 (t, 24H). UV-vis spectrum (CH3CN): λmax = 294 (ε = 33200), 328 (32300), 370 (sh, 14900), 414 (12000), 480 (sh, 3850), 588 (sh, 830), 705 nm (620 M1−cm−1). ESI–MS (CH3CN): m/z = 792 {[M]2− + Et4N+}−. CV (0.1 V s−1, CH3CN): E1/2(rev.) = −0.45 V vs. SCE. IR (KBr): ν 784 (m), 807 (m), 909 (s), 999 (m), 1017 (m), 1055 (m), 1152 (m), 1172 (m), 1234 (vs), 1325 (m), 1394 (s), 1431 (m), 1454 (m), 1483 (s), 1528 (s), 1696 (s), 1711 cm−1 (s).
(Et4N)2[MoIVS(LCOOMe)2] (MoSLCOOMe)
To 10 mL of an acetonitrile solution of Mo(OSitBuPh2)LCOOMe (124 mg, 0.14 mmol), 1.5 mL of an acetonitrile solution of Et4NSH (25 mg, 0.15 mmol) was added. The resultant brown solution was concentrated to ~1 mL. A brown powder was precipitated by addition of diethyl ether to the solution, and this was collected by filtration, washed with THF/acetone, and dried in vacuo. To 3 mL of an acetonitrile solution of the brown powder, tBuPh2SiCl (14 mL, 0.065 mmol) was added, and the solution was stirred for 5 minutes and then concentrated to 1 mL. Addition of 6 mL of THF to the solution yielded a brown powder, which was collected by filtration and washed with THF/acetone. Yield: 50.5 mg (45%). Anal. Calcd for C28H52MoN2O8S5 (mol wt. 801.00): C, 41.99; H, 6.54; N, 3.50. Found: C, 41.94; H, 6.55; N; 3.53. 1H NMR (CD3CN, 25 °C): δ 3.725 (s, 12H), 3.09 (q, 16H), 1.08 (t, 24H). UV-vis spectrum (CH3CN): λmax = 365 (ε = 8110), 429 (2020), 505 (sh, 370), 711 nm (62 M−1 cm−1). ESI-MS (CH3CN): m/z = 672 {[M]2− + Et4N+}−. CV (CH3CN): Epa(irrev.) = −0.12 V vs. SCE. IR (KBr): ν 495 (s), 678 (w), 753 (w), 782 (m), 1014 (m), 1068 (w), 1172 (m), 1227 (vs), 1393 (m), 1433 (m), 1456 (w), 1478 (s), 1525 (s), 1684 (s), 1718 cm−1 (s).
(Et4N)2[MoIVSe(LCOOMe)2] (MoSeLCOOMe)
To an acetonitrile solution (4 mL) containing Mo(OSitBuPh2)LCOOMe (153 mg, 0.17 mmol), an acetonitrile suspension (1 mL) containing Na2Se (51 mg, 0.041 mmol) was added. After stirring this suspension for 20 hours, an acetonitrile solution (1 mL) of Et4NCl (28 mg, 0.17 mmol) was added to the reaction mixture. Undissolved Na2Se was removed by filtration and the brown filtrate was concentrated to ca. 1 mL. A brown powder was precipitated by addition of diethyl ether to the solution, which was collected by filtration, washed with THF/acetone, and dried in dinitrogen. To an acetonitrile solution (6 mL) of the brown powder, tBuPh2SiCl (31 mL, 0.14 mmol) was added. After stirring the solution for 5 min, the solution was concentrated to 1 mL. Addition of 12 mL of THF to the solution gave a brown powder, which was collected by filtration, washed with THF/acetone, and dried in dinitrogen. Yield: 42 mg (29%). Anal. Calcd for C28H52MoN2O8S4Se (mol wt. 847.89): C, 39.66; H, 6.18; N, 3.30. Found: C, 39.53; H, 6.13; N; 3.46. 1H NMR (CD3CN, 25°C): δ 3.725 (s, 12 H), 3.09 (q, 16H), 1.08 (t, 24H). UV-vis spectrum (CH3CN): λmax = 376 (ε = 8440), 458 (2020), 575 (sh, 280), 740 nm (42 M−1 cm−1). ESI–MS (CH3CN): m/z = 719 {[M]2−+ Et4N+}−. CV (CH3CN): Epa (irrev.) = −0.12 V vs. SCE. IR (KBr): ν 675 (w), 780 (m), 1013 (m), 1067 (w), 1171 (m), 1225 (vs), 1393 (m), 1432 (m), 1455 (w), 1478 (s), 1684 (s), 1718 cm−1 (vs).
Physical measurements
FT–IR spectra were recorded with a Perkin–Elmer Spectrum One spectrometer. Resonance Raman spectra were taken on a Jasco NRD–1000 instrument using an Ar+ ion laser with excitation at 488 nm. Solid state resonance Raman (rR) spectra and associated rR excitation profiles were collected using a system comprised of an PI/Acton SpectraPro SP-2556 500 mm focal length imaging spectrograph with a triple grating turret and a PI/Acton Spec-10:100B back-illuminated 1340 × 100 pixel digital CCD spectroscopy system with a cryogenically cooled camera head. A Coherent Innova Ar+ ion laser was the excitation source. Samples were mixed with either NaCl or a NaCl/Na2SO4 mixture with Na2SO4 as an internal calibrant. 1H NMR spectra were recorded with a JEOL Lambda 300, and TMS signal was adjusted to 0 ppm. 77Se-NMR spectra were recorded on a JEOL FT-NMR Lambda 300WB spectrometer. (CH3)2Se was used as an internal standard. ESI–mass spectra were measured with a JEOL JMS-700S. Routine UV-vis spectra were recorded on a HP-8453 or Shimazu-UV 2550 spectrometer. Additional solution electronic absorption spectra were collected using a Hitachi U-3501 UV-Vis-NIR dual-beam spectrophotometer capable of scanning a wavelength region between 185 and 3200 nm. Spectral samples were dissolved in dry, degassed acetonitrile, and the electronic absorption spectra were measured in a 1 cm pathlength, 100 mL, black-masked, quartz cuvette (Starna Cells, Inc.) equipped with a Teflon stopper. All electronic absorption spectra were performed at room temperature and repeated at regular time intervals to ensure the structural stability and integrity of the complex in solution.
Electrochemistry
Cyclic voltammetric measurements were performed under dinitrogen with a Hokuto Denko HZ-3000 potentiostat. A set of a glassy-carbon working electrode (circular, 3 mm diameter), a SCE reference electrode, and a platinum counter electrode was employed in these experiments.
X-ray crystallography
Single crystals of MoSLPh•CH3CN were obtained by diffusion of diethyl ether into an acetonitrile solution of MoSLPh. Single crystals of MoSeLPh•DMSO were obtained by diffusion of diethyl ether into a DMSO solution of MoSeLPh. Single crystals of MoSLCOOMe and MoSeLCOOMe were obtained by diffusion of diethyl ether into each acetonitrile solution. Single crystals of MoOLPh were obtained by recrystallization from DMSO/diethylether. Each single crystal obtained, except for MoOLPh, was mounted on a glass fiber, and all X-ray data were collected at −173 °C on a Rigaku CCD diffractometer with monochromatic Mo-Kα radiation. A single crystal of MoOLPh was mounted on a glass fiber, and all measurements were made on a Rigaku RAXIS RAPID imaging plate area detector with graphite monochromated Mo-Kα radiation. The structures were solved by direct methods26 and expanded using DIRDIF 99.27 The non–hydrogen atoms were refined anisotropically by full–matrix least squares on F2. The hydrogen atoms were attached at idealized positions on carbon atoms and were not refined. All structures in the final stages of refinement showed no movement in the atom positions. The calculations were performed using Single–Crystal Structure Analysis Software, version 3.8.28 Crystallographic parameters are summarised in Table 1.
Table 1.
Crystallographic Data for MoSLPh•CH3CN, MoSeLPh•DMSO, MoSLCOOMe, MoSeLCOOMe and MoOLPh
| MoSLPh•CH3CN | MoSeLPh•DMSO | MoSLCOOMe | MoSeLCOOMe | MoOLPh | |
|---|---|---|---|---|---|
| formula | C46H63MoN3S5 | C46H66MoN2OS5Se | C28H52MoN2O8S5 | C28H52MoN2O8S4Se | C44H60MoN2OS4 |
| fw | 914.26 | 998.24 | 800.97 | 847.87 | 857.15 |
| cryst system | orthorhombic | monoclinic | orthorhombic | orthorhombic | monoclinic |
| space group | P212121 | P21/c | Pbca | Pbca | P21 |
| a, Å | 19.519(4) | 10.628(2) | 12.8056(5) | 12.7676(7) | 14.733(9) |
| b, Å | 20.011(4) | 19.035(4) | 18.2219(8) | 18.3036(10) | 8.778(5) |
| c, Å | 11.887(2) | 24.634(5) | 31.5759(15) | 31.9341(17) | 17.409(11) |
| β, deg | 90 | 107.256(2) | 90 | 90 | 104.966(10) |
| V, Å3 | 4643.1(15) | 4759.2(16) | 7368.0(6) | 7462.8(7) | 2175.0(23) |
| Z | 4 | 4 | 8 | 8 | 2 |
| ρ, g cm−3 | 1.308 | 1.393 | 1.444 | 1.509 | 1.309 |
| μ, mm−1 | 0.541 | 1.295 | 0.685 | 1.596 | 0.528 |
| data | 13116 | 37472 | 54114 | 56065 | 21205 |
| unique data | 11310 | 10659 | 7969 | 8435 | 9877 |
| R1a | 0.0510 | 0.0568 | 0.0712 | 0.0566 | 0.0443 |
| wR2 (F2)b | 0.1261 | 0.1686 | 0.1457 | 0.1689 | 0.1097 |
| GOF | 0.953 | 0.962 | 1.053 | 1.029 | 1.028 |
R1 = Σ(|Fo| − |Fc|)/Σ|Fo|.
wR2 = {Σ(w(Fo2 − Fc2)2)/Σw(Fo2)2}1/2.
Electronic structure calculations
Electronic structure and vibrational frequency calculations were performed at the density functional level of theory using the Gaussian 03W software package.29 All calculations employed the B3LYP hybrid functional and used a LANL2DZ basis set with an effective core potential for Mo. A 6-31G* basis set was used for all light atoms. Input files were prepared using the molecule builder function in the Gaussview software package. The results of these calculations were further analyzed using the program AOMix. Electron density difference maps (EDDMs) were constructed using the GaussSum suite of programs.
Results and discussion
Preparation and characterisation of MoIVS/MoIVSe complexes with LPh and LCOOMe
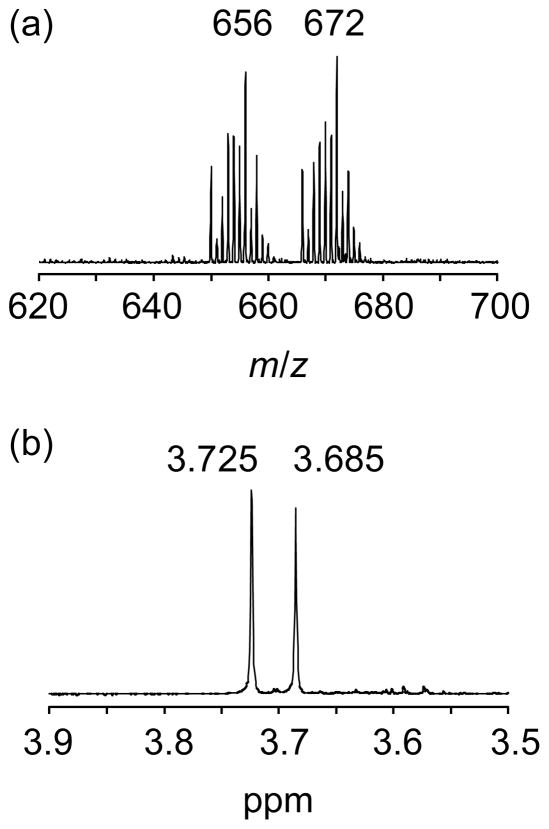
The first series of the square pyramidal bis(ene-1,2-dithiolate)MoIVE (E = O, S, Se) complexes, [MoIVE(LC4H8)2]2− (MoELC4H8), were synthesised from Mo(CO)2(LC4H8)2 and 2 equivalent of hydroxide ion (Et4NOH), 1 equivalent of sulfido ion (Na2S) or 1 equivalent of selenido ion (Na2Se) in dry CH3CN.18,19,20 In a similar manner, MoSLPh and MoSeLPh were synthesised. These two complexes, along with MoOLPh, complete the second series of MoIVE complexes including an identical ene-1,2-dithiolate ligand. The elemental analysis and negative-ion ESI-MS data for MoSLPh and MoSeLPh were consistent with the corresponding molecular formulas. For the synthesis of the MoIVS and MoIVSe species with Ldmed, Mo(OSitBuPh2)LCOOMe was employed. When the compound was treated with one equivalent of EtN4SH in acetonitrile, a mixture of two complexes was obtained. The negative ESI-MS of the acetonitrile solution containing Mo(OSitBuPh2)LCOOMe and Et4NSH in a 1: 1 ratio showed two peak clusters at m/z = 656 and 672 in ca. 1: 1 ratio in intensity (Fig. 3), of which one peak cluster at m/z = 656 corresponded to the mono-oxo molybdenum complex MoOLCOOMe ([M2− + Et4N+]−), and another one at m/z = 672 was attributed to the mono–sulfido molybdenum complex MoSLCOOMe ([M2− + Et4N+]−). The 1H NMR spectrum of an acetonitrile–d3 solution containing equimolar amount of Mo(OSitBuPh2)LCOOMe and EtN4SH exhibited two singlets at 3.685 and 3.725 ppm in a 1: 1 integrate ratio. The former chemical shift was identical to that of the 1H NMR signal for −COOMe groups of the MoOLCOOMe reported in the literature.23 The IR spectrum of a powder precipitated from the solution showed strong absorption bands at 911 and 495 cm−1 assignable to ν(MoO) and ν(MoS) stretchings, respectively. Collectively, Mo(OSitBuPh2)LCOOMe was revealed to change to the MoO and MoS compounds upon treatment with SH−. The MoS species was purified by washing the mixture with THF containing tBuPh2SiCl since Mo(OSitBuPh2)LCOOMe formed again here is soluble in THF. Similarly, MoSeLCOOMe was synthesised from Mo(OSitBuPh2)LCOOMe and Na2Se in CH3CN. Monoselenido molybdenum(IV) complexes are extremely rare and [MoIVSe(Se4)2]2−, 30 is the only example of such species besides the series reported in this paper.
Fig. 3.
ESI mass (a) and 1H NMR (b) spectra obtained by a treatment of Mo(OSitBuPh2)LCOOMe with 1 equiv of SH− in acetonitrile.
Crystal structures of MoS and MoSe complexes of LPh and LCOOMe
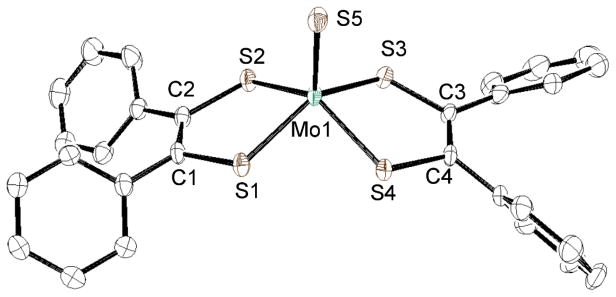
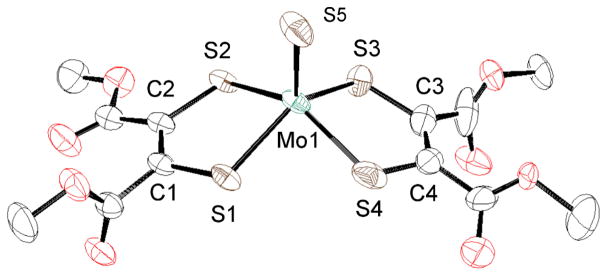
The crystal structures of the anionic parts of MoSLPh and MoSLCOOMe are shown in Figs. 4 and 5, respectively, and the selected bond distances and angles are listed in Table 2 together with those of MoSLC4H8. The Mo1 atom of MoSLPh is coordinated by a terminal sulfido, S5, and four sulfur atoms, S1–S4 of two LPh. The S1, S2, S3 and S4 atoms are almost coplanar and the four bond angles, S5-Mo1-S1 (110.20(3) °), -S2 (112.08(3) °), -S3 (106.16(3) °) and -S4 (110.19(3) °) are found to be very similar. Additionally, the S1-Mo1-S3 bond angle (143.64(3) °) is very similar to the S2-Mo1-S4 (137.71(3) °) angle. Taken together, these observations indicate that each Mo1 atom possesses a distorted square pyramidal geometry as commonly found in the Mo(IV) complexes, [MoS(didentate ligand)2]2−, (bidentate ligand = S4,23 CS4,31 LC4H8,18 S2C2Me232), [MoS(bdt)(S4)]2−,33 and [MoS(bdtCl2)(S4)]2−.33 The Mo1 atom of MoSLCOOMe also adopts a similar distorted square pyramidal geometry as MoSLPh, and this is reflected by the S5-Mo1-S (LCOOMe) and S1-Mo1-S3 and S2-Mo1-S4 bond angles. With respect to the dimensions of LPh and LCOOMe, the four C-S bond lengths of LPh (1.766(3) – 1.789(3) Å) and the three C-S bonds (1.748(6) – 1.774(4) Å), except for the C1-S1 bond (1.735(5) Å) of LCOOMe, are in the typical range of C-S single bonds. The somewhat shorter LCOOMe S1-C1 bond length may be ascribed to the mesomeric effect of the −COOMe ester group attached on S2 atom of MoSLCOOMe, as suggested by the small 6.43(6) ° dihedral angle between the −COOMe and S1-C1-C2-S2 planes. As comparison, other three dihedral angles between −COOMe and S1-C1-C2-S2 or S3-C3-C4-S4 planes of LCOOMe are close to 90 °. The respective C1-C2 and C3-C4 bond lengths of MoSLPh (1.355(5) and 1.360(5) Å) and MoSLCOOMe (1.353(7) and 1.358(10) Å) suggest their double bond character. Collectively, these observations indicate that LPh and LCOOMe ligands of the MoS complexes have a structure of ene–1,2–dithiolate, as in the case of LC4H8 of MoSLC4H8. The Mo1–S5 bond length of the three complexes with LPh, LCOOMe and LC4H8 increases in the order of MoSLC4H8 (2.167(2) Å) > MoSLPh (2.1592(9) Å) > MoSLCOOMe (2.1495(16) Å), indicating that the Lewis acidity of the central molybdenum(IV) ion decreases with an increase in L→Mo electron donation yielding weaker Mo≡S bonds.
Fig. 4.
Crystal structure of the anionic part of MoSLPh • CH3CN shown with 50% ellipsoids. The hydrogen atoms were omitted for clarity.
Fig. 5.
Crystal structure of the anionic part of MoSLCOOMe shown with 50% ellipsoids. The hydrogen atoms were omitted for clarity.
Table 2.
Selected Bond Distances (A) and Angles (deg) of MoSLPh•CH3CN, MoSLCOOMe and MoSLCC4H8
| MoSLPh•CH3CN | MoSLCOOMe | MoSLC4H8, a | |
|---|---|---|---|
| Mo1–S5 | 2.1592(9) | 2.1495(16) | 2.167(2) |
| Mo1–S1 | 2.3577(8) | 2.3740(13) | 2.369(2) |
| Mo1–S2 | 2.3675(8) | 2.3696(14) | 2.364(2) |
| Mo1–S3 | 2.3455(9) | 2.3623(13) | 2.382(2) |
| Mo1–S4 | 2.3656(8) | 2.3601(18) | 2.369(2) |
| S1–C1 | 1.781(3) | 1.735(5) | 1.775(8) |
| S2–C2 | 1.789(3) | 1.774(4) | 1.75(1) |
| S3–C3 | 1.766(3) | 1.748(6) | 1.753(8) |
| S4–C4 | 1.779(3) | 1.770(8) | 1.772(9) |
| C1–C2 | 1.355(5) | 1.353(7) | 1.33(1) |
| C3–C4 | 1.360(5) | 1.358(10) | 1.35(1) |
| Mo1–4S plane | 0.7981(5) | 0.7968(9) | 0.79(1) |
| S5–Mo1–S1 | 110.20(3) | 108.17(5) | 106.46(9) |
| S5–Mo1–S2 | 112.08(3) | 109.36(6) | 110.39(9) |
| S5–Mo1–S3 | 106.16(3) | 111.53(5 | 109.12(9) |
| S5–Mo1–S4 | 110.19(3) | 109.56(6) | 111.82(9) |
| S1-Mo1-S2 | 81.86(2) | 83.07(4) | 82.20(8) |
| S1-Mo1-S3 | 143.64(3) | 140.30(4) | 144.42(8) |
| S1-Mo1-S4 | 84.95(2) | 84.18(5) | 84.92(7) |
| S2-Mo1-S3 | 85.33(3) | 83.62(4) | 85.70(8) |
| S2-Mo1-S4 | 137.71(3) | 141.06(5) | 137.78(8) |
| S3-Mo1-S4 | 81.99(2) | 83.13(6) | 81.90(8) |
ref. 19
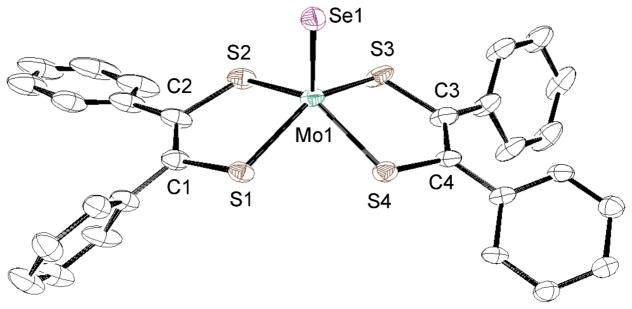
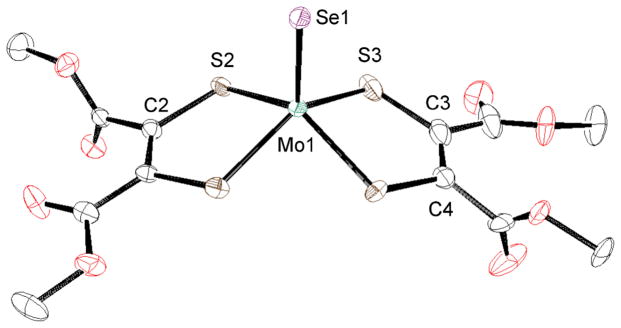
The crystal structures of anionic parts of MoSeLPh and MoSeLCOOMe are shown in Figs. 6 and 7, respectively. The selected bond lengths and angles are indicated in Table 3 together with those of MoSeLC4H8. The Mo1 atoms of MoSeLPh and MoSeLCOOMe are coordinated with one terminal selenido, Se1, and the four dithiolene sulfur atoms, S1–S4, derived from either LPh or LCOOMe. The dimensions about each Mo1 atom are similar to those of the corresponding sulfido analogues except for the Mo1–Se1 bond distances, yielding an isostructural distorted square-pyramidal geometry. In MoSeLPh, the C–S bond lengths range from 1.768(3) to 1.789(5) Å and the C1-C2 and C3-C4 bond distances are 1.345(5) and 1.380(7) Å. These data suggest that the two LPh ligands of MoSeLPh are also ene-1,2-dithiolates and not dithiones.34 The two LCOOMe ligands in MoSeLCOOMe also possess an ene-1,2-dithiolate structure as reflected by the C-S bond distances (1.749(6) - 1.769(4) Å) and the C1-C2 and C3-C4 bond lengths (1.345(6) and 1.338(7) Å). The Mo1-Se1 bond (2.3069(5) Å) of MoSeLC4H8 with the largest L→Mo charge donation is the longest in the Mo1-Se1 bonds of the three MoSeL complexes (see electrochemical section). All three of the Mo1-Se1 bond lengths are longer than the MoSe bond in square-pyramidal [MoIVSe(Se4)2]2− (2.270(4) Å).30
Fig. 6.
Crystal structure of the anionic part of MoSeLPh • DMSO shown with 50% ellipsoids. The hydrogen atoms were omitted for clarity.
Fig. 7.
Crystal structure of the anionic part of MoSeLCOOMe shown with 50% ellipsoids. The hydrogen atoms were omitted for clarity.
Table 3.
Selected Bond Distances (A) and Angles (deg) of MoSeLPh • DMSO, MoSeLCOOMe and MoSeLC4H8
| MoSeLPh•DMSO | MoSeLCOOMe | MoSeLC4H8, a | |
|---|---|---|---|
| Mo1–Se1 | 2.2915(5) | 2.2900(5) | 2.3069(5) |
| Mo1–S1 | 2.3552(11) | 2.3637(11) | 2.3517(12) |
| Mo1–S2 | 2.3400(10) | 2.3645(10) | 2.3627(11) |
| Mo1–S3 | 2.3520(13) | 2.3530(13) | 2.3639(11) |
| Mo1–S4 | 2.3452(8) | 2.3636(13) | 2.3618(11) |
| S1–C1 | 1.768(3) | 1.769(4) | 1.786(4) |
| S2–C2 | 1.789(5) | 1.746(4) | 1.770(4) |
| S3–C3 | 1.785(3) | 1.749(6) | 1.772(4) |
| S4–C4 | 1.784(4) | 1.761(5) | 1.765(4) |
| C1–C2 | 1.345(5) | 1.345(6) | 1.331(7) |
| C3–C4 | 1.380(7) | 1.338(7) | 1.338(7) |
| Mo1–4S plane | 0.7976(7) | 0.7933(7) | 0.79(1) |
| Se1–Mo1–S1 | 109.45(3) | 109.78(3) | 110.86(2) |
| Se1–Mo1–S2 | 109.66(3) | 109.78(3) | 107.59(3) |
| Se1–Mo1–S3 | 109.35(3) | 108.80(3) | 113.20(3) |
| Se1–Mo1–S4 | 111.00(3) | 110.96(3) | 106.50(3) |
| S1-Mo1-S2 | 82.09(3) | 82.91(3) | 82.50(4) |
| S1-Mo1-S3 | 141.20(4) | 141.41(4) | 135.94(4) |
| S1-Mo1-S4 | 84.64(3) | 84.33(4) | 85.77(4) |
| S2-Mo1-S3 | 84.56(4) | 83.74(4) | 84.70(3) |
| S2-Mo1-S4 | 139.34(4) | 139.99(4) | 145.90(3) |
| S3-Mo1-S4 | 82.20(3) | 83.06(4) | 81.78(4) |
ref. 20
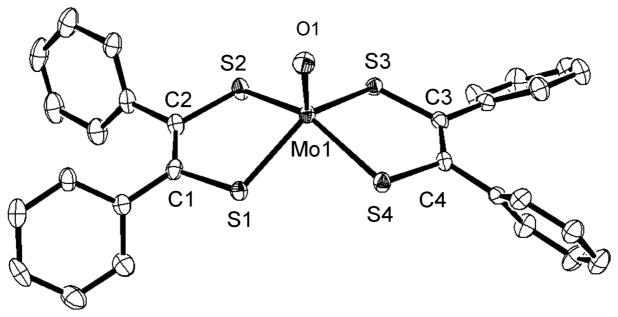
We report the crystal structure here and find the square-pyramidal geometry and the Mo≡O bond length to be 1.709(2) Å (Fig. 8 and Table 4) although MoOLPh had been synthesised previously.22 In summary, the crystal structures presented here show that the bis(L)MoIVE series provides a set of isostructural complexes that can be used to evaluate the strength of the Mo≡E bonds as a function of L→Mo charge donation.
Fig. 8.
Crystal structure of the anionic part of MoOLPh shown with 50% ellipsoids. The hydrogen atoms were omitted for clarity.
Table 4.
Selected Bond Distances (A) and Angles (deg) of MoOLPh, MoOLCOOMe and MoOLC4H8
| MoOLPh | MoOLCOOMe, a | MoOLC4H8, b | |
|---|---|---|---|
| Mo1–O1 | 1.709(2) | 1.686(6) | 1.745(6) |
| Mo1–S1 | 2.3874(7) | 2.380 c | 2.418(3) |
| Mo1–S2 | 2.3761(7) | 2.384(7) | |
| Mo1–S3 | 2.3824(8) | 2.418(5) | |
| Mo1–S4 | 2.3778(7) | 2.39(1) | |
| S1–C1 | 1.792(2) | 1.758 d | 1.76(1) |
| S2–C2 | 1.782(3) | 1.777(8) | |
| S3–C3 | 1.785(2) | 1.81(1) | |
| S4–C4 | 1.786(3) | 1.783(8) | |
| C1–C2 | 1.345(4) | 1.33(1) | 1.34(1) |
| C3–C4 | 1.369(5) | 1.31(1) | 1.32(1) |
| Mo1–4S–plane | 0.7871(5) | e | 0.76(1) |
| O1–Mo1–S1 | 110.45(8) | 108.9 f | 106.6(4) |
| O1–Mo1–S2 | 108.37(7) | 106.2(6) | |
| O1–Mo1–S3 | 110.64(8) | 106.5(3) | |
| O1–Mo1–S4 | 107.04(7) | 108.1(4) | |
| S1-Mo1-S2 | 82.20(2) | 83.1(1) | 82.4(2) |
| S1-Mo1-S3 | 138.89(2) | 140.7(1) | 146.8(5) |
| S1-Mo1-S4 | 86.70(2) | 84.3(1) | 88.5(4) |
| S2-Mo1-S3 | 83.92(2) | 85.3(1) | 86.7(2) |
| S2-Mo1-S4 | 144.57(3) | 143.5(1) | 145.7(5) |
| S3-Mo1-S4 | 82.67(2) | 83.0(1) | 83.0(4) |
Electrochemical properties
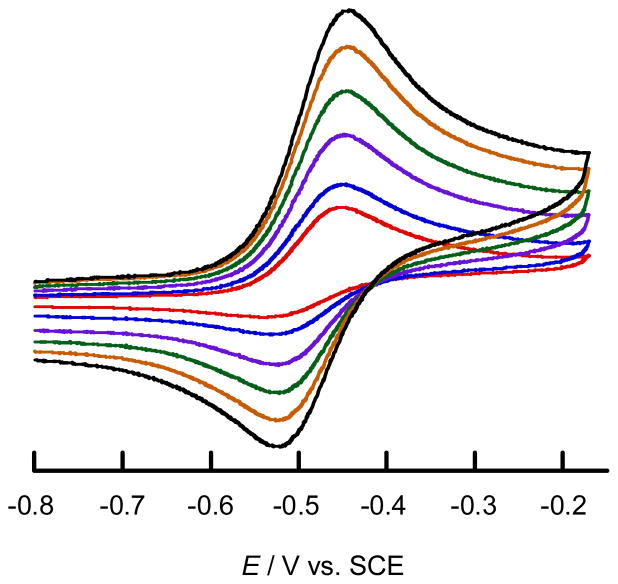
Although the MoSL and MoSeL complexes exhibit a redox wave assignable to the Mo(V)/Mo(IV) couple, the reversibility of the redox wave is influenced by the nature of the dithiolene, L. The Mo(V)/Mo(IV) couple for MoSLC4H8 (E1/2 = −0.75 V vs. SCE) is reversible on the cyclic voltammetry (CV) time scale using scan rates greater than 20 mV s−1. The Mo(V)/Mo(IV) couple for MoSeLC4H8 was observed at E1/2 = −0.74 V and was also observed to be reversible on the CV time scale under the same experimental conditions as MoSLC4H8. However, both MoSLPh and MoSeLPh exhibited a noticeable scan rate dependent reversibility in the CV. Using scan rates greater than 300 mV s−1, the Mo(V)/Mo(IV) redox process of these complexes exhibited a reversible wave at −0.43 V for MoSLPh and −0.45 V for MoSeLPh. The redox wave became irreversible at scan rates less than 300 mV s−1. The dependence of scan rate on the CV of MoSeLPh is shown in Fig. 9. These observations indicate that the structure of the monomeric Mo(IV) species is unstable relative to one-electron oxidation processes. This instability likely results from dimerization, as both MoSLC4H8 and MoSeLC4H8 have been reported to yield dinuclear {[MoV(LC4H8)2]2(μ −S/Se)2}2− structures upon one-electron oxidation,19,20 and the UV–vis spectra of solutions obtained by chemical oxidation of MoSLPh and MoSeLPh with ferrocenium hexafluorophosphate are identical to those of dimeric {[MoV(LPh)2]2(μ − S/Se)2}2−.35 The MoSLCOOMe and MoSeLCOOMe complexes both exhibit an irreversible Mo(V)/Mo(IV) redox couple at Epa = −0.12 and −0.12 V, respectively, even with scan rates greater than 500 mV s−1, indicating rapid dimerization of a putative square pyramidal Mo(V) species to generate {[MoV(LCOOMe)2]2(μ − S/Se)2}2−. The marked scan rate dependency on the reversibility of the Mo(V)/Mo(IV) redox process for MoSL and MoSeL supports an argument that an increase in dithiolene L→Mo charge donation can stabilise the square pyramidal Mo(V) species. In the case of MoOL, the one-electron oxidized mononuclear Mo(V) form is stable and does not yield dinuclear {[MoV(L)2]2(μ-O)2}2− species. Therefore, the Mo(V)/Mo(IV) redox couple in the CV is reversible. The E1/2 values for the Mo(S/Se)L series and the corresponding literature values for the MoOL series are summarised in Table 5. Here it is observed that the Mo(V)/Mo(IV) redox potential increases in the order LCOOMe > LPh > LC4H8, indicating that L→Mo charge donation increases in the order of LC4H8 > LPh > LCOOMe. This is the expected trend based on the electronic donating/withdrawing nature of the substituents on the dithiolene, L. In square pyramidal bis(dithiolene)MoIV, V, VI complexes that possess an apical multiply bonded ligand E, the Mo redox orbital is Mo(dx2−y2) (see Table 8). This redox orbital is oriented orthogonal to the Mo≡E bond with the principal lobes bisecting all four Mo-S bonds. In the C4v high-symmetry limit, the Mo(dx2−y2) orbital is non-bonding with respect to the apical E ligand. As a result, the nature of the Mo≡E bond should not have a dominant influence on the redox potential of a given MoEL complex (E = O, S, Se) at parity of the equatorial ligands. We observe that the redox potentials for the LPh and LC4H8 compounds as a function of E are essentially uneffected by the nature of the E donor, with potentials that vary by only 30–50 mV across a given series. This should be compared with the much larger (i.e. ~300 mV) potential shift as a function of the dithiolene for a given terminal E donor. For the LCOOMe compounds, MoOLCOOMe possesses a redox potential that is 90 mV more positive than for MoOLCOOMe and MoOLCOOMe. In summary, the redox potentials of the MoEL series are dominated by the nature of the dithiolene, but are much less affected by the nature of the terminal E donor despite the fact that the pKb values of O2− (≪0), S2− (−0.85), and Se2− (~3) are significantly different.36
Fig. 9.
Scan rate dependent cyclic voltammogram of MoSeLPh in CH3CN, 500 (black), 400 (brown), 300 (green), 200 (purple), blue (100), and 50 mV s−1 (red).
Table 5.
Redox potentials (V vs. SCE) of Mo(V)/Mo(IV) process for MoEL
| Complexes | LCOOMe | LPh | LC4H8 |
|---|---|---|---|
| MoOL | −0.03 | −0.46 | −0.70 |
| MoSL | −0.12 | −0.43 | −0.75 |
| MoSeL | −0.12 | −0.45 | −0.74 |
Table 8.
Percentage Fragment Orbital Character to the Frontier Molecular Orbitals of MoELCOOMe
| MoOLCOOMe | ||||
|---|---|---|---|---|
| Molecular Fragment | % Mo | % Sdithiolene | % Dithiolene (total) | % Oxo |
| HOMO-1 | 0.8 | 68.3 | 95.0 | 4.1 |
| HOMO | 81.2 | 10.1 | 18.5 | 0.3 |
| LUMO | 5.9 | 9.9 | 90.3 | 2.8 |
| LUMO+1 | 3.3 | 13.5 | 95.6 | 0.0 |
| LUMO+2 | 36.4 | 7.1 | 53.9 | 8.6 |
| LUMO+3 | 43.3 | 9.2 | 45.7 | 10.2 |
| MoSLCOOMe | ||||
|---|---|---|---|---|
| Molecular Fragment | % Mo | % Sdithiolene | % Dithiolene (total) | % Sulfido |
| HOMO-1 | 0.4 | 61.0 | 83.3 | 15.7 |
| HOMO | 80.3 | 9.8 | 18.8 | 0.8 |
| LUMO | 21.7 | 8.7 | 65.9 | 11.8 |
| LUMO+1 | 3.9 | 13.7 | 94.4 | 0.6 |
| LUMO+2 | 57.7 | 17.5 | 22.7 | 19.5 |
| LUMO+3 | 39.9 | 14.4 | 47.5 | 12.1 |
| MoSeLCOOMe | ||||
|---|---|---|---|---|
| Molecular Fragment | % Mo | % Sdithiolene | % Dithiolene (total) | % Selenido |
| HOMO-1 | 0.5 | 56.2 | 76.6 | 22.8 |
| HOMO | 80.0 | 9.9 | 19.1 | 1.0 |
| LUMO | 25.8 | 8.7 | 60.0 | 13.6 |
| LUMO+1 | 6.2 | 13.8 | 91.2 | 1.7 |
| LUMO+2 | 55.8 | 18.2 | 26.7 | 17.5 |
| LUMO+3 | 37.7 | 15.0 | 51.4 | 10.4 |
77Se NMR spectra of MoSeL complexes
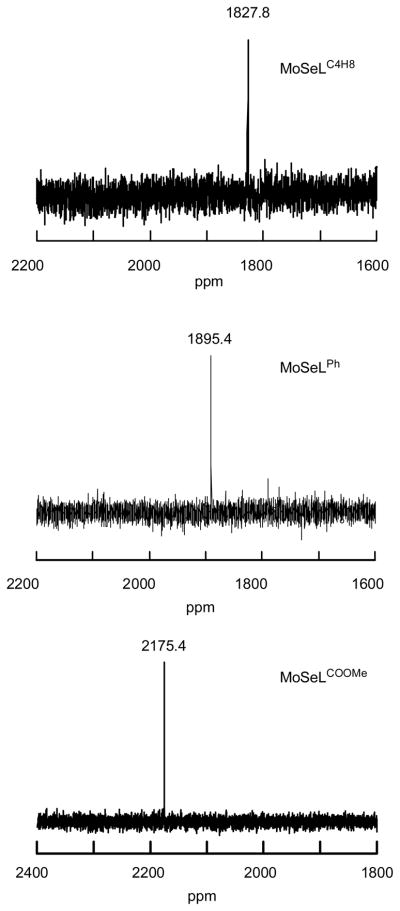
Given the effects of E on the redox potentials of the MoEL series at parity of L are minimal, we now turn our investigation toward the effects of L on the Mo≡E bond at parity of E. For the MoSeL complexes, this can conveniently be accomplished using 77Se NMR spectroscopy (Fig. 10). To the best of our knowledge, MoSe(NR)([N]Ar)2 (R = C(CD3)2CH3, Ar = 3,5–C6H3Me2) and trans–Mo(PMe3)4(Se)2 are the only examples of terminal selenido complexes that have been probed by 77Se NMR spectroscopy.10,37 Our experiments reveal the 77Se NMR resonances to shift to lower magnetic field in the order MoSeLC4H8 (1827.8) < MoSeLPh (1895.4) < MoSeLCOOMe (2175.4 ppm). This clearly indicates that electron withdrawing substituents on L result in an increase in Se2−→ Mo(IV) charge donation, which in turn results in a less basic terminal selenide. These results are important, since they suggest that the nature of the dithiolene ligand can fine-tune the acid/base and the atom transfer reactivity of terminal MoE sites in enzymes and related systems.
Fig. 10.
77Se NMR spectra of MoSeLC4H8 (above), MoSeLPh (middle), and MoSeLCOOMe (bottom) in (CD3)2SO.
Spectroscopic and electronic structure studies
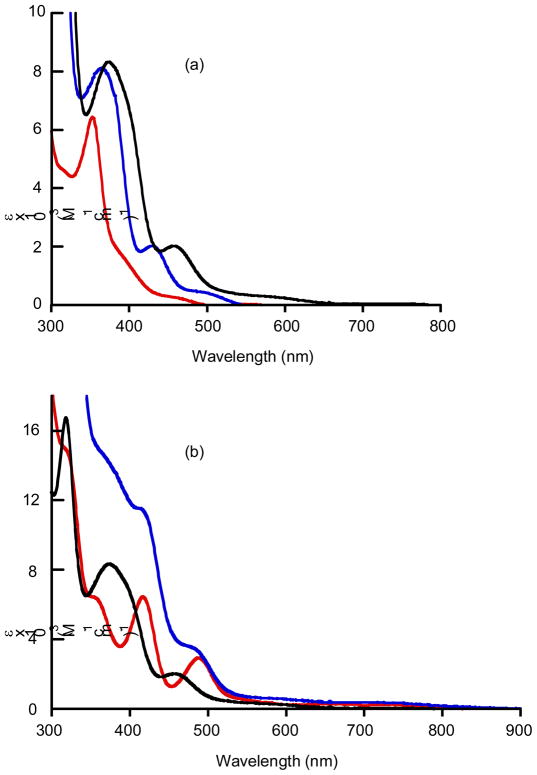
Solution electronic absorption spectra for MoSL and MoSeL were collected in CH3CN. The electronic absorption spectra of the MoOL series have been reported previously.18,22,23 Inspection of the absorption spectra for MoSL and MoSeL complexes reveals that they can be divided into three sections: the first region occurs at wavelengths lower than ca. 350 nm where the complexes possesses intense absorption bands with molar extinction coefficients (ε) over ~10,000 M−1 cm−1, the second region occurs between 350 – 600 nm and displays a well-defined band with an extinction coefficient of ca. 2000 M−1 cm−1, and finally a third low-energy region that consists of a series of weak absorption bands. The well-defined band that appears in the second spectral region was previously tentatively assigned as an E→Mo(IV) charge transfer band, with respect to the prior spectral assignments for trans–Mo(E)2(PMe3)4 (E= O, S, or Se) and trans–Mo(E)2(P–P)2 (E = O, S, and Se).37,10 The solution electronic absorption spectra of MoELCOOMe (E = O, S, Se) and MoSeL are shown in Fig. 11. Interestingly, the prominent band in the second spectral region is shifted progressively to lower energy in the MoELCOOMe series as a function of the terminal chalcogen donor atoms (MoOLCOOMe, 380 nm; MoSLCOOMe, 429 nm; MoSeLCOOMe, 458 nm), and this reflects a significant degree of E wavefunction mixing with the dithiolene frontier orbitals, vide infra. Finally, this CT band shifts to higher energy with a decrease in L → Mo charge donation (E = S; 462 nm for LC4H8, 450 nm for LPh, 429 nm for LCOOMe: E = Se; 489 nm for LC4H8, 480 nm LPh, 458 nm for LCOOMe).
Fig. 11.
Absorption spectra in visible region in CH3CN: (a) MoELCOOMe (O (red), S (blue), and Se (black)), (b) MoSeL (LC4H8 (red), LPh (blue), and LCOOMe (black)).
Understanding the nature of key M-L vibrations in these MoEL (E = O, S, Se) complexes is important in developing a greater understanding of important bonding interactions in both synthetic model systems and the enzymes, particularly those of the DMSOR enzyme family that possesses bis-dithiolene coordination. Solid-state rR spectra for the MoELCOOMe series are presented in Fig. S1 (Supplementary Information) and summarised in Table 6. Additionally, solution resonance Raman (rR) spectra of MoOL, MoSL and MoSeLPh, COOMe in CH3CN were obtained using 488 nm excitation. The Raman data are presented in Figs. S2 and S3 (Supplementary Information) and are summarized in Table 7 for comparative purposes. We were not able to obtain a Raman spectrum for MoSeLC4H8 due to decomposition as a result of the incident laser radiation. Vibrational assignments are consistent with calculated virbrations and earlier vibrational assignments made by Spiro et al for MoOLCOOMe.38
Table 6.
Solid State Resonance Raman Data (cm−1) for MoELCOOMe
| Complexes | ν(Mo≡E) | ν(Mo-S)dithiolene | ν(C=C)sym | ν(C=O)sym |
|---|---|---|---|---|
| MoOLCOOMe | 903 | 364 | 1530 | 1691 |
| MoSLCOOMe | 493 | 364 | 1527 | 1702 |
| MoSeLCOOMe | 370a | 344 a | 1525 | 1700 |
vibrational frequency calculations indicate is significant degree of mixing between ν(Mo≡Se) and ν(Mo-S)ditholene resulting from the small energy difference between these two totally symmetric vibrations.
Table 7.
Solution Resonance Raman Data (cm−1) for MoEL
| Complexes | ν(Mo ≡E) stretch | ν(C=C) stretch |
|---|---|---|
| MoOL | 897 (LC4H8), 903 (LPh), 911 (LCOOMe)a | 1596 (LC4H8), c, 1533 (LCOOMe) |
| MoSL | 480 (LC4H8), 487 (LPh), 500 (LCOOMe) | 1593 (LC4H8), c, 1531 (LCOOMe) |
| MoSeL | b c 347 (LCOOMe)d | b, c, 1531 (LCOOMe) |
ref. 38.
MoSeLC4H8 was decomposed upon irradiation.
not assigned unambiguously.
vibrational frequency calculations indicate both Mo≡Se and Mo-Sdithiolene stretches contribute to the 347 cm−1 mode.
With respect to the MoSeLC4H8 and MoELPh (E = O, S, Se) solution rR spectra, neither ν(Mo≡Se) for MoSeLC4H8 or ν(C=C) for MoELPh could be assigned due to spectral overlap of the intrinsic compound vibrations with modes associated with the solvent. For the MoELCOOMe (E = O, S, Se) series, there is very good agreement between the solution and solid state spectra and this indicates the integrity and geometry of the complexes are maintained in solution. The Raman data for the MoELCOOMe series reveal that the ν(Mo≡E) stretching frequency is shifted to lower energy according to O>S>Se, and reflect reduced mass differences within the Mo≡E unit. This is in marked contrast to the ν(C=C) and ν(M-Sdithiolene) stretching frequencies across this series which remain essentially constant. These observations indicates that E→Mo charge donation does not dominate Mo-Sdithiolene bonding interactions or bonding interactions within the dithiolenes. However, the ν(Mo≡O/S) stretch in the Mo(O/S)L series does shift to lower frequency as a function of increased L→Mo charge donation, and this effect is greatest for the MoSL series. Specifically, this reflects the relative degree of L→Mo charge donation into the Mo(dxz, dyz) orbitals, which are π-antibonding with respect to the Mo≡E bonding scheme, and the amount of E character admixed into the Mo(dxz, dyz) orbitals. These results are also consistent with the change in Mo≡S bond length for the MoSL complexes (2.167(2) Å for LC4H8 > 2.1592(9) Å for LPh > 2.1495(16) Å for LCOOMe). Finally, our vibrational data indicate that electron withdrawing substituents on the dithiolene noticeably reduce the ν(C=C) stretching frequency (1593 cm−1 for LC4H8 > 1531 cm−1 for LCOOMe), and this is due to electron withdrawal from occupied frontier dithiolene orbitals that possess C=C π-bonding character.
Electronic structure calculations have been performed on the MoELCOOMe series in order to obtain insight into the nature of the frontier molecular orbital bonding scheme and spectroscopy of these complexes. The relevant frontier molecular orbitals for MoOLCOOMe and MoSeLCOOMe are shown in Fig. 12, and the fragment orbital contributions to these MOs are listed in Table 8. The frontier molecular orbitals for MoSLCOOMe are provided in Fig. S4 since their appearance is essentially identical to those of MoSeLCOOMe. Assuming idealized C2v symmetry, the HOMO-1 for these MoELCOOMe complexes is principally a dithiolene S based MO of b1 symmetry with a noticeable degree of apical E(px) character (Table 8). The E character in the HOMO-1 orbital is observed to decrease from E=Se to E=O, and this reflects the progressively higher valence ionization energy and electronegativity of the terminal E donor that is commensurate with a decrease in principle quantum number. As mentioned previously, the HOMO is the Mo(dx2−y2) redox orbital of a1 symmetry (idealized C2v) and is essentially invariant across the series with ~80% Mo character and <1% terminal E character (Table 8), consistent with our vibrational and electrochemical results, vide supra. The LUMO and LUMO+1 for the MoELCOOMe complexes are dithiolene based orbitals with C=C π* character. However, the LUMO also possesses some Mo(dyz)-E π* character which decreases appreciably (MoOLCOOMe: 2.8% O; MoELCOOMe: 11.8% S; MoELCOOMe: 13.6% Se; Table 8) with increasing apical ligand electronegativity. These results are interesting in that there exists a pair of low energy acceptor orbitals with significant ligand character that lie between the filled Mo(dx2−y2) HOMO and the rest of the Mo(IV) d-orbital manifold. Importantly, this provides a mechnanism for low-energy MLCT transitions in MoELCOOMe compounds. The LUMO+2 and LUMO+3 orbitals for MoOLCOOMe are the Mo(dyz) and Mo(dxz) orbitals, respectively, and these also possess π antibonding interactions with the terminal oxo py and px orbitals. This orbital ordering is reversed for Mo(S/Se)LCOOMe with the Mo(dyz) observed at higher energy than the Mo(dxz). This results from stronger orbital mixing with the dithiolene-based LUMO, which also possesses some Mo(dyz)-E π* character. The LUMO+4 for Mo(S/Se)LCOOMe and the LUMO+6 for Mo(O)LCOOMe are higher energy unoccupied Mo(dz2) orbitals which are σ* with the apical E donor. Due to the stronger ligand field of the terminal oxo donor, the Mo(dz2) orbital is at higher energy for Mo(O)LCOOMe.39,40 The LUMO+10 for Mo(S/Se)LCOOMe and the LUMO+9 for Mo(O)LCOOMe are the unoccupied Mo(dxy) orbitals which are σ* with the equatorial dithiolene S donors. The high energy of the Mo(dz2) and Mo(dxy) orbitals restricts their ability to function as acceptor orbitals in low-energy LMCT transitions.
Fig. 12.
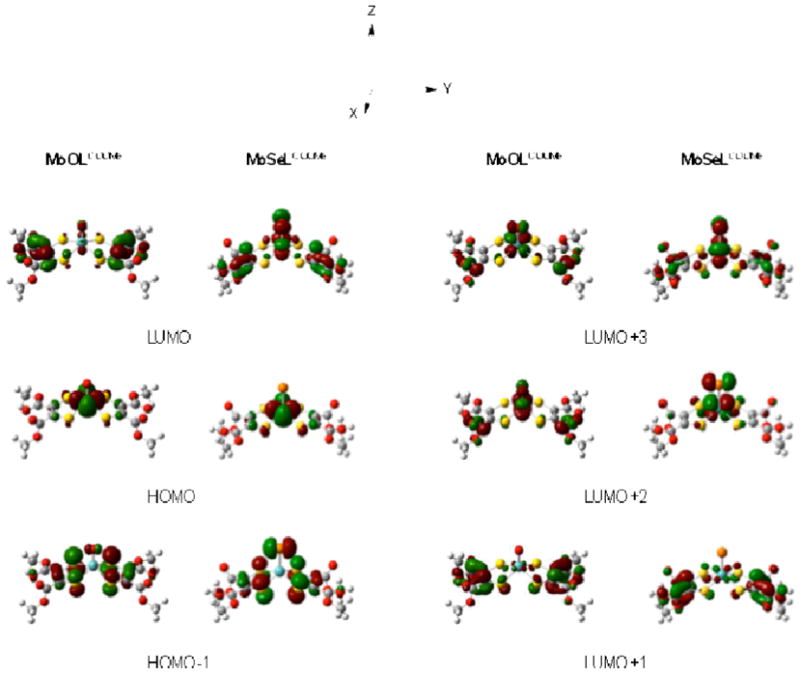
Frontier Kohn-Sham orbitals for MoSeLCOOMe. The corresponding orbitals for Mo(O/S)LCOOMe are very similar with important differences detailed in the text.
The electronic absorption spectrum for MoOLCOOMe is presented in Fig. 13a along with resonance Raman excitation profiles for the ν(Mo-Sdithiolene), ν(Mo≡O), ν(C-O + C-C), ν(C=C) and ν(C=O) vibrations. Gaussian resolution of the electronic absorption spectrum reveals the presence of four bands below ~27,000 cm−1. These bands have been assigned (Table 9) based on their <Fig. 13, Table 7> relative intensities and energies, the nature of the rR excitation profiles, and via a computationally assisted approach using the results of our bonding (Fig. 13) and time dependent density functional theory calculations. From these data, we can assign bands 1 and 2 as the HOMO → LUMO and HOMO → LUMO+1 MLCT transitions. These assignments are strongly supported by the nature of the rR profile, which shows resonance enhancement of ligand ν(C-O + C-C), ν(C=C) and ν(C=O), but no resonance enhancement of ν(Mo-Sdithiolene) or ν(Mo≡O) under band 1. The fact that the ν(Mo≡O) mode is not resonantly enhanced under band 1 confirms the results of our bonding calculations which show the expected result that the Mo(dx2−y2) HOMO wavefunction possesses no oxo character. Furthermore, the lack of a ν(Mo≡O) stretch indicates a minimal admixture of Mo(dxz, dyz)-O π* character in the ligand-based LUMO and LUMO+1 orbitals. Bands 3 and 4 are assigned as HOMO-1→LUMO and HOMO-1→LUMO+1 transitions, respectively. Since the HOMO-1 is non-bonding with the Mo centre, we anticipate no enhancement of the ν(Mo-Sdithiolene) stretch and enhancement of ν(C-O + C-C), ν(C=C) and ν(C=O) vibrations and this is observed experimentally, confirming these band assignments. The nature of the HOMO-1→LUMO and HOMO-1→LUMO+1 transitions are unusual for this type of complex as they are intraligand transitions described by a charge transfer from the dithiolene S donors to the carbon backbone of the dithiolene ligand. A similar intraligand charge transfer transition has very recently been observed in Tp*MoO(S2BMOQO) (BMOQO = 2-(3-butynyl-2-methyl-2-ol)quinoxaline), which possesses a donor-acceptor type dithiolene ligand.41 The nature of the intraligand charge transfer is apparent in the electron density difference map (EDDM) constructed for the HOMO-1→LUMO+1 transition (Fig. 13, band 4). The observation of such intraligand charge transfer bands in MoOLCOOMe underscores the electron withdrawing nature of the −COOMe groups in LCOOMe dithiolenes.
Fig. 13.
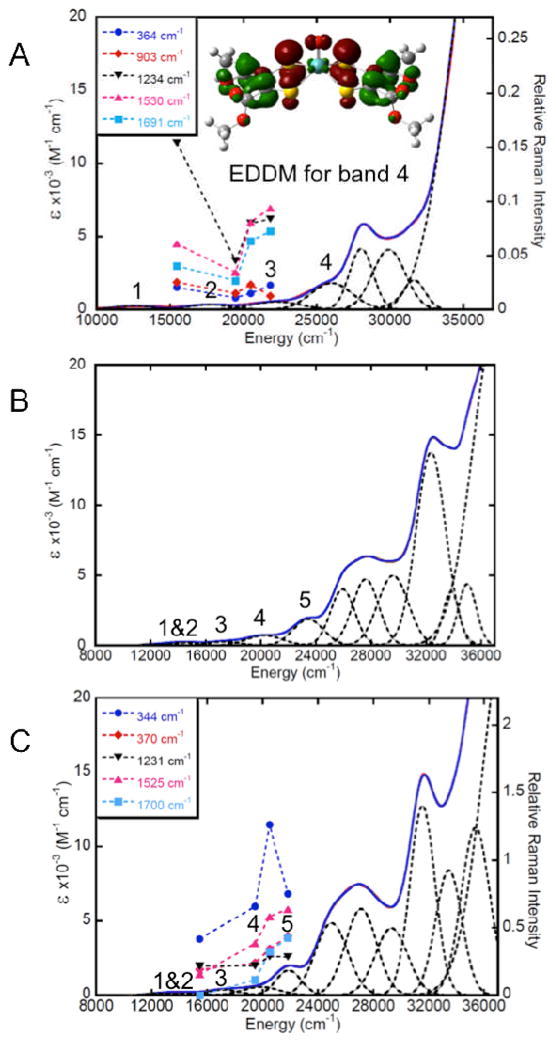
Gaussian resolved solution electronic absorption spectra for MoOLCOOMe (A), MoSLCOOMe (B), and MoSeLCOOMe (C). Resonance Raman excitation profiles for MoOLCOOMe and MoSeLCOOMe are overlayed on their respective absorption spectra. An electron density difference map that details the nature of the intraligand transition (HOMO-1→LUMO+1) in MoOLCOOMe (red: electron density loss in transition, green: electron density gain in transition) is presented in A (inset).
Table 9.
Band Assignments for Low-Energy Transitions in MoELCOOMe Compounds
| MoOLCOOMe | MoSLCOOMe | MoSeLCOOMe | ||||
|---|---|---|---|---|---|---|
| Band | Energy | Assignment | Energy | Assignment | Energy | Assignment |
| 1 | 13,320 | HOMO→LUMO | 12,750 | HOMO→LUMO | 12,850 | HOMO→LUMO |
| 2 | 17,720 | HOMO→LUMO+1 | 14,530 | HOMO→LUMO+2 | 14,525 | HOMO→LUMO+2 |
| 3 | 21,980 | HOMO-1→LUMO | 17,242 | HOMO-1→LUMO | 17,140 | HOMO-1→LUMO |
| 4 | 25,980 | HOMO-1→LUMO+1 | 20,290 | HOMO→LUMO+1 HOMO-1→LUMO+2 |
19,880 | HOMO→LUMO+1 HOMO-1→LUMO+2 |
| 5 | a | 23,430 | HOMO-1→LUMO+1 HOMO-1→LUMO+3 |
21,180 | HOMO-1→LUMO+1 HOMO-1→LUMO+3 |
|
not observed
The electronic absorption spectra of MoSLCOOMe and MoSeLCOOMe are presented in Figs. 13b and 13c, respectively, and their transition energies and band assignments are summarised in Table 9. Resonance Raman excitation profiles have been constructed for the ν(Mo-Sdithiolene), ν(Mo≡Se), ν(C-O + C-C), ν(C=C) and ν(C=O) vibrations of MoSeLCOOMe and these are overlayed on the absorption spectrum of MoSeLCOOMe in Fig. 13c. Gaussian resolution of the electronic absorption spectra for MoSLCOOMe and MoSeLCOOMe yield five bands at energies below ~27,000 cm−1. Due to the similar spectral features observed for MoSLCOOMe and MoSeLCOOMe we will discuss their band assignments together. Band 1 is assigned as the HOMO → LUMO ligand field transition (Mo(dx2−y2) → Mo(dyz)) that possesses some MLCT character (Fig. 12) while band 2 is assigned as the HOMO → LUMO+2 ligand field transition (Mo(dx2−y2) → Mo(dxz)). The small energy splitting of these bands, coupled with their similar transition energies, indicates nearly equivalent ligand field strengths for the terminal sulfido and selenido donors in MoSLCOOMe and MoSeLCOOMe. Band 3 is the first LMCT band and is primarily described as a HOMO-1 → LUMO one-electron promotion with some intraligand CT character. Both the HOMO → LUMO+1 and HOMO-1 → LUMO+2 contribute to the spectral region defined by band 4. This is supported by resonance enhancement of both the ν(Mo-Sdithiolene) and the ν(C=C) modes in MoSeLCOOMe. Interestingly, the ν(Mo≡Se) mode is only weakly resonance enhanced with excitation into band 4 and this likely results from a smaller contribution of the HOMO-1 → LUMO+2 one electron promotion to this band compared to the HOMO → LUMO+1. Large resonance enhancement of ν(C=C), ν(C=O), ν(Mo-Sdithiolene) and ν(Mo≡E) vibrational modes supports an assignment of both the HOMO-1 → LUMO+1 and HOMO-1 → LUMO+3 one-electron promotions as dominant contributors to band 5. The EDDMs for the two transitions that principally contribute to this band in MoSeLCOOMe are given in Fig. 14. Collectively, the assignments for band 5 in MoSLCOOMe and MoSeLCOOMe, and for the corresponding band 4 in MoOLCOOMe indicate that the one-electron promotions that contribute to these transitions originate from the HOMO-1 orbital, and this orbital possesses increased E character in the order O < S < Se. Therefore, the E character in the HOMO-1 orbitals contribute to the progressive shift of this band to higher energies, and this is consistent with the electronegativity and valence ionization energy of the terminal E donor.40
Fig. 14.
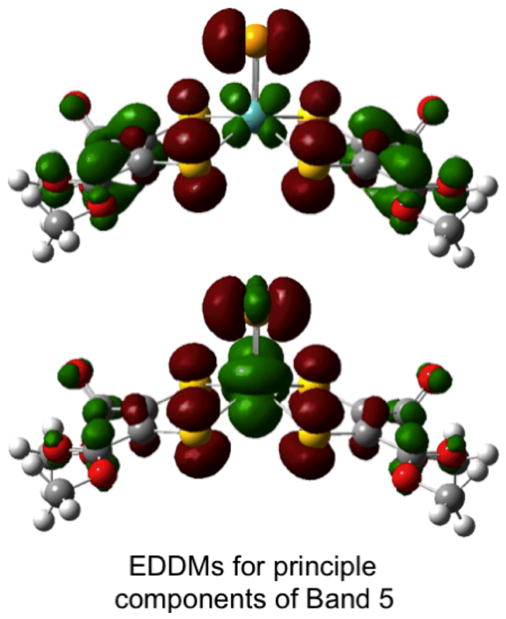
Electron density difference maps for the two transitions that comprise band 5 that detail the nature of the intraligand (HOMO-1→LUMO+1) and LMCT (HOMO-1→LUMO+3) one-electron promotions in MoSeLCOOMe (red: electron density loss in transition, green: electron density gain in transition) is presented in A (inset). Notice the increased in the Se→Mo charge transfer contribution to this transition relative to MoOLCOOMe (Figure 13A inset).
Conclusions
We have synthesised and structurally characterised new square pyramidal bis(ene-1,2-dithiolate)MoIV(S/Se) complexes with LC4H8, LPh and LCOOMe ligands that, when coupled with the known MoIVO complexes of LPh and LCOOMe, have enabled a systematic study of the effects of terminal chalcogenido and ene-1,2-dithiolate ligands on geometric and electronic structure. The structural data indicate that the Mo≡E bond lengths decrease according to LC4H8 > LPh > LCOOMe, reflecting the relative electron donating and withdrawing nature of the substituents on the dithiolene ligands. Dithiolene ligand effects on the nature of the Mo≡E bonds have been probed in our electrochemical investigations, where it was shown that the redox potential for the Mo(V)/Mo(IV) couple was shifted more positive as the dithiolene ligand L changed from LC4H8 to LPh to LCOOMe. Electrochemical, spectroscopic, and bonding calculations are consistent with a redox orbital that is dominantly Mo(dx2−y2) in character and possesses no contribution from the terminal E donor. 77Se NMR spectroscopy on MoSeL complexes showed that the 77Se resonances shifted to lower magnetic field as the terminal selenido donor became less basic. Optical spectroscopic studies on the MoELCOOMe (E = O, S, Se) series have allowed detailed band assignments to be made for all three compounds, and this has resulted in a greater understanding of their electronic structures. Specifically, it was found that certain low-energy transitions possessed considerable intraligand charge transfer character described by a substantial dithiolene S charge donation to the carbon backbone of the dithiolene ligand, underscoring the electron withdrawing nature of the −COOMe substituents in the LCOOMe dithiolenes. The Mo(dx2−y2) → Mo(dxz, dyz) ligand field transitions were assigned for the MoELCOOMe (E = S, Se) complexes yielding a spectroscopic t2g splitting of ~14,500 cm−1. This may be compared with an ~12,000 cm−1 Mo(dx2−y2) → Mo(dxz, dyz) ligand field for des-oxo MoIV(ER)(dithiolene) (E = O, S, Se) complexes studied by Holm, Kirk and coworkers.40 Finally, the origin of spectral shifts in the MoELCOOMe (E = O, S, Se) series can be explained by 1) the much stronger ligand field exerted by the terminal oxo ligand that results in markedly higher energy ligand field bands for MoOLCOOMe, and 2) the nature of the dithiolene-based LUMO wavefunction, which possesses increased E character and leads to lower energy HOMO→LUMO and HOMO-1→LUMO CT transitions as the apical chalcogenido electronegativity decreases.
Supplementary Material
Acknowledgments
This work was partly supported by a grant (Grant 22108520 to H.S.) for Scientific Research on Priority Areas “Coordination Programming” from MEXT of Japan. M.L.K. acknowledges the National Institutes of Health (GM-057378) for financial assistance.
Footnotes
Electronic supplementary information (ESI) available: resonance Raman spectra (Figures S1–S3). CIF files. Full Gaussian03 reference.
Contributor Information
Hideki Sugimoto, Email: sugimoto@mls.eng.osaka-u.ac.jp.
Shinobu Itoh, Email: shinobu@mls.eng.osaka-u.ac.jp.
Martin L. Kirk, Email: mkirk@unm.edu.
References
- 1.Nugent WA, Mayer JM. Metal–Ligand Mutiple Bonds. John Wiley; New York: 1988. [Google Scholar]; Limberg C. Angew Chem Int Ed. 2009;48:2270. doi: 10.1002/anie.200805977. [DOI] [PubMed] [Google Scholar]
- 2.Hille R. Chem Rev. 1996;96:2757. doi: 10.1021/cr950061t. [DOI] [PubMed] [Google Scholar]; Tunney JM, McMaster L, Garner CD. In: Comprehensive Coordination Chemistry II. McCleverty JA, Meyer JM, editors. Vol. 8. 2004. p. 459. [Google Scholar]; Burgmayer SJN. Prog Inorg Chem. 2004;52:491. [Google Scholar]; Young CG. In: Encyclopedia of Inorganic Chemistry 2. King RB, editor. Vol. 5. 2005. p. 3321. [Google Scholar]
- 3.Okamoto K, Matsumoto K, Hille R, Eger BT, Pai EF, Nishino T. Proc Natl Acad Sci USA. 2004;101:7931. doi: 10.1073/pnas.0400973101. [DOI] [PMC free article] [PubMed] [Google Scholar]; Doonan CJ, Rubie ND, Peariso K, Harris HH, Knottenbelt SZ, George GN, Young CG, Kirk ML. J Am Chem Soc. 2008;130:55. doi: 10.1021/ja068512m. [DOI] [PubMed] [Google Scholar]
- 4.Raaijimakers HCA, Romao MJ. J Biol Inorg Chem. 2006;11:1261. doi: 10.1007/s00775-006-0129-2. [DOI] [PubMed] [Google Scholar]
- 5.Wagener N, Pierik AJ, Ibdah A, Hille R, Dobbek H. Proc Natl Acad Sci USA. 2009;106:11055. doi: 10.1073/pnas.0902210106. [DOI] [PMC free article] [PubMed] [Google Scholar]
- 6.Holm RH. Coord Chem Rev. 1990;100:183. [Google Scholar]; Young CG. In: Biomimetic Oxidations Catalyzed by Transition Metal Complexes. Meunier B, editor. 2000. p. 415. [Google Scholar]
- 7.Young CG. In: Comprehensive Coordination Chemistry II. McCleverty JA, Meyer JM, editors. Vol. 4. 2004. p. 415. [Google Scholar]
- 8.Enemark JH, Cooney JLA, Wang J-J, Holm RH. Chem Rev. 2004;104:1175. doi: 10.1021/cr020609d. [DOI] [PubMed] [Google Scholar]
- 9.Sugimoto H, Tsukube H. Chem Soc Rev. 2008;37:2609. doi: 10.1039/b610235m. [DOI] [PubMed] [Google Scholar]
- 10.Cotton FA, Schmid G. Inorg Chem. 1997;36:2267. doi: 10.1021/ic961071v. [DOI] [PubMed] [Google Scholar]
- 11.Johnson AR, Davis WM, Christopher C, Cummins CC, Serron S, Nolan SP, Musaev DG, Morokuma K. J Am Chem Soc. 1998;120:2071. [Google Scholar]
- 12.Young CG, Wedd AG. Chem Comm (Feature Article) 1997:1251. [Google Scholar]
- 13.Young CG, Roberts SA, Ortega RB, Enemark JH. J Am Chem Soc. 1987;109:2938. [Google Scholar]
- 14.Young CG, Gable RW, Hill JP, George GN. Eur J Inorg Chem. 2001:2227. [Google Scholar]
- 15.Doonan CJ, Nielsen DJ, Smith PD, White JM, George GN, Young CG. J Am Chem Soc. 2006;128:305. doi: 10.1021/ja056109u. [DOI] [PubMed] [Google Scholar]
- 16.Drew SC, Hill JP, Lane I, Hansen GR, Gable RW, Young CG. Inorg Chem. 2007;46:2373. doi: 10.1021/ic060585j. [DOI] [PubMed] [Google Scholar]
- 17.Laughlin LJ, Eagle AA, George GN, Tiekink ERT, Young CG. Inorg Chem. 2007;46:939. doi: 10.1021/ic061213d. [DOI] [PubMed] [Google Scholar]
- 18.Sugimoto H, Harihara M, Shiro M, Sugimoto K, Tanaka K, Miyake H, Tsukube H. Inorg Chem. 2005;44:6386. doi: 10.1021/ic050234p. [DOI] [PubMed] [Google Scholar]
- 19.Sugimoto H, Sakurai T, Miyake H, Tanaka K, Tsukube H. Inorg Chem. 2005;44:6927. doi: 10.1021/ic0509128. [DOI] [PubMed] [Google Scholar]
- 20.Tano H, Tajima R, Miyake H, Itoh S, Sugimoto H. Inorg Chem. 2008;47:7465. doi: 10.1021/ic8009942. [DOI] [PubMed] [Google Scholar]
- 21.Ellis PJ, Conrads T, Hille R, Kuhn P. Structure. 2001;9:125. doi: 10.1016/s0969-2126(01)00566-4. [DOI] [PubMed] [Google Scholar]
- 22.Lim BS, Holm RH. J Am Chem Soc. 2001;123:1920. doi: 10.1021/ja003546u. [DOI] [PubMed] [Google Scholar]
- 23.Coucouvanis D, Hadjikyriacou A, Toupadakis A, Koo SM, Ileperuma O, Draganjac M, Salifoglou A. Inorg Chem. 1991;30:754. [Google Scholar]
- 24.Schrauzer GN, Mayweg VP, Heinrich W. J Am Chem Soc. 1966;88:8174. [Google Scholar]
- 25.Sugimoto H, Tatemoto S, Suyama K, Miyake H, Mtei RP, Itoh S, Kirk ML. Inorg Chem. 2010;49:5368. doi: 10.1021/ic100825x. [DOI] [PMC free article] [PubMed] [Google Scholar]
- 26.Burla MC, Camalli M, Carrozzini B, Cascarano GL, Giacovazzo C, Polidori G, Spagna R. J Appl Crystallogr. 2003;36:1103. [Google Scholar]
- 27.Beurskens PT, Admiraal G, Beurskens G, Bosman WP, de Gelder R, Israel R, Smits JMM. Technical Report of the Crystallography Laboratory. University of Nijmegen; The Netherlands: 1999. The DIRDIF-99 program system. [Google Scholar]
- 28.Crystal Structure Analysis Package. Rigaku and Rigaku/MSC; The Woodlands, TX, USA: 2000–2006. [Google Scholar]
- 29.Gaussian 03. R. C. G., Inc; Pittsburgh, PA: 2003. Inc. (full reference is given in Supplementary Information).
- 30.O’Neal S, Kolis JW. J Am Chem Soc. 1988;110:1971. [Google Scholar]
- 31.Coucouvais D, Draganjac MJ. J Am Chem Soc. 1982;104:6820. [Google Scholar]
- 32.Groysman S, Holm RH. Inorg Chem. 2007;46:4090. doi: 10.1021/ic062441a. [DOI] [PubMed] [Google Scholar]
- 33.Sugimoto H, Suyama K, Sugimoto K, Miyake H, Takahashi I, Hirota S, Itoh S. Inorg Chem. 2008;47:10150. doi: 10.1021/ic800832a. [DOI] [PubMed] [Google Scholar]
- 34.The C1–C2 and C3–C4 distances are somewhat longer than those of complete C=C double bonds.
- 35.Lim BS, Donahue JP, Holm RH. Inorg Chem. 2000;39:263. doi: 10.1021/ic9908672. [DOI] [PubMed] [Google Scholar]
- 36.Atkins P, Orerton T, Rourke J, Weller M, Armstrong F. Inorganic Chemistry. 4. Oxford University Express; New York: 2006. [Google Scholar]
- 37.Murphy VJ, Parkin G. J Am Chem Soc. 1995;117:3522. [Google Scholar]
- 38.Subramanian P, Burgmayer S, Richards S, Szalai V, Spiro TG. Inorg Chem. 1990;29:3849. [Google Scholar]
- 39.Inscore FE, McNaughton R, Westcott BL, Helton ME, Jones R, Dhawan IK, Enemark JH, Kirk ML. Inorg Chem. 1999;38:1401. [Google Scholar]
- 40.McNaughton RL, Lim BS, Knottenbelt SZ, Holm RH, Kirk ML. J Am Chem Soc. 2008;130:4628. doi: 10.1021/ja074691b. [DOI] [PubMed] [Google Scholar]
- 41.Matz KG, Mtei RP, Leung B, Burgmayer SJN, Kirk ML. J Am Chem Soc. 2010;132:7830. doi: 10.1021/ja100220x. [DOI] [PMC free article] [PubMed] [Google Scholar]
Associated Data
This section collects any data citations, data availability statements, or supplementary materials included in this article.


